

Abstract
We previously reported that effective treatment of chronic low back pain (CLBP) reversed abnormal brain structure and functional MRI (fMRI) activity during cognitive task performance, particularly in the left dorsolateral prefrontal cortex (DLPFC). Here, we used resting‐state fMRI to examine how chronic pain affects connectivity of brain networks supporting cognitive functioning and the effect of treatment in 14 CLBP patients and 16 healthy, pain‐free controls (scans were acquired at baseline for all subjects and at 6‐months post‐treatment for patients and a matched time‐point for 10 controls). The main networks activated during cognitive task performance, task‐positive network (TPN) and task‐negative network (TNN) (aka default mode) network, were identified in subjects' task fMRI data and used to define matching networks in resting‐state data. The connectivity of these cognitive resting‐state networks was compared between groups, and before and after treatment. Our findings converged on the bilateral insula (INS) as the region of aberrant cognitive resting‐state connectivity in patients pretreatment versus controls. These findings were complemented by an independent, data‐driven approach showing altered global connectivity of the INS. Detailed investigation of the INS confirmed reduced connectivity to widespread TPN and TNN areas, which was partially restored post‐treatment. Furthermore, analysis of diffusion‐tensor imaging (DTI) data revealed structural changes in white matter supporting these findings. The left DLPFC also showed aberrant connectivity that was restored post‐treatment. Altogether, our findings implicate the bilateral INS and left DLPFC as key nodes of disrupted cognition‐related intrinsic connectivity in CLBP, and the resulting imbalance between TPN and TNN function is partially restored with treatment. Hum Brain Mapp 36:2075–2092, 2015. © 2015 Wiley Periodicals, Inc.
Keywords: chronic pain, cognitive networks, functional MRI, resting state, intrinsic connectivity, longitudinal
INTRODUCTION
Chronic pain affects cognition. Functional MRI (fMRI) studies show that brain regions involved in cognitive task performance belong to either task‐positive network (TPN) or task‐negative network (TNN) [Fox et al., 2005; Fransson, 2005]. The TPN, comprised of lateral prefrontal, posterior parietal, anterior cingulate, and insula (INS) areas, shows increased activation during cognitive tasks. The TNN consisting of medial prefrontal, posterior cingulate/precuneus, posterior inferior parietal, hippocampus, and temporal areas, shows deactivation during cognitive tasks requiring externally‐directed attention. Task‐related activity in the TPN is enhanced when pain is simultaneously experienced, suggesting that pain acts as a cognitive load [Seminowicz and Davis, 2007b], supported by other studies with healthy subjects [Mantini et al., 2009] and chronic pain patients [Weissman‐Fogel et al., 2011]. In contrast, the TNN shows deactivation when subjects are attending to painful stimuli [Kong et al., 2010; Loggia et al., 2012b]. The TPN and TNN can be reliably reproduced using resting‐state fMRI (i.e., in the absence of a task), showing that the brain is intrinsically organized into networks supporting cognitive functioning [Smith et al., 2009]. Resting‐state networks consist of brain regions whose activity is correlated temporally. The TPN and TNN are anticorrelated (when one network is activated, the other is deactivated). This anticorrelation is preserved during resting‐state fMRI and has been suggested to reflect the intrinsic balance of these networks needed for optimal cognitive performance [Fornito et al., 2012; Kelly et al., 2008].
Chronic pain has been associated with heightened activity (particularly in the left DLPFC) in both TPN and TNN during cognitive task performance [Seminowicz et al., 2011; Weissman‐Fogel et al., 2011]. Importantly, altered connectivity of brain networks has also been reported at rest in chronic pain patients [Baliki et al., 2011, 2012; Cauda et al., 2009, 2010; Cifre et al., 2012; Balenzuela et al., 2010; Loggia et al., 2012a; Napadow et al., 2010; Russo et al., 2012; Tagliazucchi et al., 2010; Tessitore et al., 2013], suggesting a reorganization of intrinsic brain networks due to persistent pain. One of the regions most consistently showing aberrant resting state connectivity in chronic pain is the INS. Some of these alterations are likely due to hypervigilance to pain [Baliki et al., 2011; Napadow et al., 2010]. INS, however, is also activated during cognitive tasks and it is unknown if altered INS connectivity in chronic pain conditions is related to altered cognitive network connectivity.
We hypothesized that cognitive networks (TPN, TNN) have aberrant connectivity to the INS and left DLPFC in chronic low back pain (CLBP) patients compared to healthy controls, and that treatment partially restores normal connectivity. We used cognitive networks during task‐performance to identify comparable networks in resting state data, and then explored the connectivity of these resting‐state cognitive networks (TPN and TNN). We complemented the findings with an independent, data‐driven approach, as well as diffusion‐tensor imaging (DTI).
MATERIALS AND METHODS
Participants and Study Design
Fourteen patients with CLBP of intensity at least 4 out of 10 for at least 1 year (mean (SD) duration: 4.8 (3.2) years) participated before treatment and 6 months following treatment. CLBP patients were recruited sequentially in an outpatient orthopedic spine clinic or multidisciplinary pain centre. Patients enrolled in the study were permitted to continue their normal pharmacological treatment for pain. The following medication was used before treatment: acetaminophen (N = 8), non‐steroidal anti inflammatory drug (NSAID)s (N = 10), selective serotonin reuptake inhibitor (SSRI)s or serotonin norepinephrine reuptake inhibitor (SNRI)s (N = 3), tricyclic antidepressant (TCA)s (N = 3), antiepileptics/anticonvulsants (N = 4), opioids (N = 5). Patients did not change their medication regimens after treatment, except that one patient stopped using opioids, and another patient started a new (anticonvulsant class) medication. Sixteen healthy, pain‐free, age and sex matched controls also participated, and 10 of those subjects returned 6 months following the first visit. Subjects with other chronic pain disorders, neurological or psychological disorders, and other major medical illness or complicating medical factors were excluded. At each study session, subjects were given questionnaires to assess pain and pain‐related disability and underwent MRI. The CLBP intervention was either spine surgery (8 of the patients) or zygapophysial (facet) joint block (6 of the patients). For individual information on duration of pain, as well as diagnosis and treatment please refer to [Seminowicz et al., 2011], Supporting Information. The procedures were approved by the McGill University Faculty of Medicine Institutional Review Board, the Montreal Neurological Institute (MNI) and Hospital Research Ethics Board, and the McGill University Health Centre Research Ethics Office. Participants completed questionnaires about pain (Short Form McGill Pain Questionnaire (SFMPQ) [Melzack, 1987]) and pain‐related disability (Oswestry Disability Index (ODI) [Fairbank et al., 1980]).
MRI
Acquisition
MRI scans were acquired on a 3T Siemens Tim Trio scanner equipped with an eight channel head coil. An anatomical scan was acquired at the beginning of the session and lasted 5 min. The following parameters were used: echo time (TE) 30 ms, repetition time (TR) 2.3 s, flip angle 9, and resolution 1 × 1 × 1 mm. We acquired a resting state functional scan of 5 min in which subjects were instructed to “relax, keep your eyes open, and don't think about any one thing in particular.” Participants also performed a cognitive task, the multisource interference task (MSIT; [Bush et al., 2003; Seminowicz and Davis, 2007a, b]) in a separate functional run. The MSIT is a cognitive conflict task relying on Stroop, Simon, and Flanker effects. The task had three levels of difficulty based on the amount of cognitive interference: a motor control (tapping), an easy level, and a difficult level. The parameters for both functional scans (rest and task) were the same: echo‐planar imaging (EPI), TE 3 ms, TR 2.26 s, flip angle 90, 133 frames, 64 × 64 matrix, 38 slices for whole brain coverage, resolution 4 × 4 × 4 mm. Functional images were acquired in the axial plane, plus 30° from the AC‐PC line to avoid the eyes. A diffusion‐weighted scan lasting about 5 min was acquired at the end of the imaging session. The image was acquired in the axial plane, with the following: EPI diffusion with integrated parallel imaging technique (iPAT2), TE 94 ms, TR 8.3 s, 96 × 96 matrix, 63 slices, 30 directions, b value 1,000, resolution 2.5 × 2.5 × 2.5 mm.
fMRI preprocessing
SPM8 (http://www.fil.ion.ucl.ac.uk/spm/) was used to perform the following preprocessing steps: slice timing correction, six‐parameter rigid body correction for head motion, coregistration to the anatomical image, segmentation, normalization to the MNI space [linear (12‐parameter affine) and nonlinear], and smoothing at 8 mm full width at half maximum (FWHM). To ensure that there were no differences in overall motion between groups and time‐points, we compared mean total displacement, calculated as root‐mean‐square (RMS) of the translation parameters (total displacement=square root (x 2 + y 2 + z 2) [Van Dijk et al., 2012]). RMS did not differ significantly between patients pretreatment (mean (SD) 0.0062 (0.0047)) and controls (0.0043 (0.0016), P=0.23), or in patients pre‐ versus post‐treatment (P=0.09). The range of head motions did not differ significantly between patients pretreatment and controls (translations (mean range (SD) in mm: x‐direction patients 0.22 (0.19), controls 0.24 (0.23), P=0.84; y‐direction patients 0.36 (0.17), controls 0.33 (0.17), P=0.61; z‐direction patients 0.61 (0.37), controls 0.47 (0.27), P=0.24), rotations (mean range (SD) in mm: pitch patients 0.54 (0.39), controls 0.40 (0.23), P=0.24, roll patients 0.20 (0.10), controls 0.25 (0.13), P=0.32; yaw patients 0.24 (0.21), controls 0.25 (0.13), P=0.88). There was no significant difference in the range of head motion in patients pre‐ versus post‐treatment (translations x‐direction P=0.78, y‐direction P=0.49, z‐direction P=0.86; rotations pitch P=0.29, roll P=0.40, yaw P=0.64).
DTI preprocessing
Diffusion‐weighted images were preprocessed with FSL 4.1 (http://www.fmrib.ox.ac.uk/fsl). Briefly, raw data were corrected for eddy‐currents and head motion, and skull and nonbrain tissue removed using FSL's Brain Extraction Tool. FA images, reflecting the degree of water diffusion anisotropy in each voxel, were created by fitting a tensor model to the diffusion data using FSL's Diffusion Toolbox (FDT). All subjects' FA data were aligned into a common space via the supplied standard‐space image (FMRIB58_FA) using FSL's Nonlinear Registration Tool, followed by linear registration into standard (MNI) space. Next, the mean FA image was built and thinned to create a mean FA skeleton representing the centers of all tracts common to the study sample. Finally, each subject's aligned FA images were projected onto this skeleton.
fMRI analysis
The main analysis steps were:
Identification of TPN and TNN resting‐state fMRI networks based on similarity to brain networks with increased (TPN) and decreased (TNN) activation during cognitive task performance (MSIT task; separate fMRI scan). These two resting‐state networks were then used as seeds in a functional connectivity analysis.
Resting state functional connectivity analysis to identify brain region(s) with aberrant functional connectivity to TPN and TNN in patients pretreatment versus controls, as well as patients‐pretreatment versus post‐treatment.
Whole brain voxel‐to‐voxel connectivity analysis to confirm decreased connectivity of the INS.
DTI to investigate white matter changes in the INS
Detailed analyses of changes in INS connectivity and relationship with treatment outcomes.
Detailed analyses of changes in left DLPFC connectivity and relationship with treatment outcomes.
Identification of Task‐Positive and Task‐Negative Networks
We used independent component analysis (ICA) on the fMRI data acquired during performance of a cognitive task (MSIT) to identify sets of brain regions (i.e., networks) whose activation increased (TPN) and decreased (TNN) during the task. This approach was adopted because we were interested in networks (rather that isolated regions) related to cognitive task. The corresponding resting state TPN and TNN were defined as those having the strongest spatial similarity to ones identified in the task data.
Group ICA of fMRI Toolbox (GIFT; http://icatb.sourceforge.net/groupica.htm [Calhoun et al., 2005]) was used on the MSIT dataset. The components with the strongest positive and negative temporal correlation to the task paradigm were considered to be the TPN and TNN, respectively. We used the full blind source separation (FBSS) ICA algorithm [Calhoun and Adalı, 2012] with 20 components. One component for each of the anticorrelated TPN and TNN was identified [Fox et al., 2005]. A conjunction analysis with patient and control groups (first scan) was created for each network and shown in Figure 1A. Figure 1B shows the time‐courses for the extracted TNN and TPN and the corresponding difficult task block time‐course convolved with the hemodynamic response function (HRF). Next, TPN and TNN were identified in the resting state scans using FBSS and 20 components as above. Components were sorted based on spatial similarity (correlation) to the TNN and TPN identified in the ICA of the MSIT task data. There were 4 networks that had r‐values >0.3 to the spatial pattern of MSIT TPN (a higher order visual network (visual cortex and PPC, r = 0.60), a motor network (bilateral premotor, PPC, SMA, r = 0.34), a bilateral frontopolar and cerebellar network (r = 0.33), and a primary visual network (r = 0.30) and these four networks were included in the resting state TPN. One network had a very high correlation with the MSIT TNN (r = 0.74) and this was considered the resting state TNN. Based on these identified networks, component masks were created for TPN and TNN, after converting to z scores and binarizing the maps at z >1.5 These masks were used as TPN and TNN seeds in the proceeding analyses.
Figure 1.
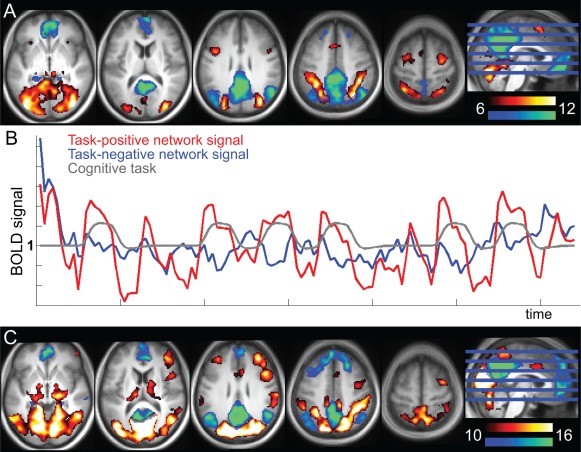
Definition of the anticorrelated TPN and task negative network (TNN). A. TPN (red‐yellow) and TNN (blue‐green) networks identified with ICA of the cognitive task data (conjunction of patients and controls, baseline time point; shown at T‐values 6–12). TPN was positively correlated with the task, and TNN negatively (i.e., TPN and TNN are anticorrelated). B. Average time‐course across all subjects for the entire TPN (red) and entire TNN (blue) identified in A. The gray line shows the modelled task. C. TPN (red‐yellow) and TNN (blue‐green) from the seed‐based resting state analyses (conjunction of patients and controls, baseline time point; shown at T 10–16). The seeds for these networks were the TPN and TNN networks that were spatially correlated with the cognitive task networks. [Color figure can be viewed in the online issue, which is available at http://wileyonlinelibrary.com.]
To define resting state networks whose connectivity could be compared between groups across time‐points, the TNN and TPN masks specified above were used as seeds in functional analyses using the Conn toolbox (ver 13l, Whitfield‐Gabrieli and Nieto‐Castanon, 2012). White matter and CSF signals (estimated from a highly eroded tissue segmentation so that removal of gray matter signal was unlikely) and six motion‐related signals were used as regressors of no interest. Data were initially bandpass filtered at 0.008–0.2 Hz. Although most of the resting state signal is captured under 0.1 Hz [Biswal et al., 1995; Cordes et al., 2000], higher frequency oscillations (up to ∼0.2 Hz) have been shown to contribute to altered resting state connectivity in CLBP [Baliki et al., 2011], as well in other chronic pain states [Cauda et al., 2010; Hong et al., 2013; Kim et al., 2013; Malinen et al., 2010; Otti et al., 2013]. Therefore, we present data at the full bandwidth (0.008–0.2 Hz), as well as split into lower (0.008–0.09 Hz) and higher frequency bands (0.09–0.2 Hz).
For statistical tests of ROI data we used IBM SPSS Statistics (version 21.0, SPSS).
Identification of Aberrant Connectivity to Task‐Positive and Task‐Negative Network in Patients Compared to Controls, and in Patients Pre‐Treatment Compared to Post‐Treatment
Beta maps for each subject from the resulting seed‐based analyses for TNN and TPN were entered in a second‐level GLM analysis in SPM8. Maps displaying conjunction analyses (areas of connectivity common to controls and patients) for these networks are shown in Figure 1C. Specific regions were identified with altered connectivity to TPN and TNN networks in patients compared to controls (independent samples t‐test) and in patients pretreatment compared to post‐treatment (paired t‐test), and are presented in the Results section (Table 1). Results were thresholded at P<0.01 and corrected for multiple comparisons at a random field theory (RFT) based cluster level of P<0.05. The significant clusters are presented in Table 1. Along with paired t‐test analyses, RM‐ANOVA (group × time) using the flexible factorial model in SPM was performed and reported.
Table 1.
Results from TPN and TNN comparisons between patients and controls and within patients pretreatment and post‐treatment
| Region | Freqa | L/R | Peak T‐value | Peak MNI coordinate | Cluster volume (mm3) | Cluster P‐value |
|---|---|---|---|---|---|---|
| TPN: Controls > patients pretreatment | ||||||
| aINS | Full | L | 4.3 | −44 2 0 | 12,024 | <0.001 |
| Full | R | 4.2 | 44 4 2 | 9,336 | <0.001 | |
| m/pINS | Full | R | 4.5 | 50 −6 −2 | 9,064 | <0.001 |
| Low | R | 3.8 | 38 −18 −6 | 9,264 | 0.033 | |
| DLPFC | High | L | 4.0 | −34 14 40 | 4,528 | 0.004 |
| Frontal pole | Low | R | 4.0 | 24 44 12 | 3,120 | <0.001 |
| pACC/aMCC | Low | R | 4.7 | 14 46 2 | 34,096 | 0.021 |
| MTG/STG | Full | L | 3.8 | −50 −28 2 | 2,856 | 0.030 |
| High | L | 5.0 | −46 −32 −2 | 4,656 | 0.004 | |
| High | R | 4.1 | 52 −32 14 | 2,288 | 0.031 | |
| Low | L | 4.3 | −48 −28 2 | 6,896 | 0.021 | |
| Cb | Low | L | 4.5 | −44 −70 −26 | 3,136 | 0.021 |
| Low | R | 4.4 | 46 −80 −34 | 3,120 | 0.001 | |
| TPN: Patients pre−treatment > controls | ||||||
| Occipital/cuneus | Full | L | 4.7 | −10 −80 42 | 11,968 | <0.001 |
| High | R | 4.9 | 12 −88 36 | 19,224 | <0.001 | |
| Low | L | 4.6 | 6 −90 34 | 15,528 | <0.001 | |
| TPN: Patients post‐treatment > pretreatment | ||||||
| aINS/FroP/STG | Low | L | 5.5 | −58 −8 −4 | 27,472 | <0.001b |
| Low | R | 4.6 | 44 14 −14 | 5,400 | 0.002b | |
| DLPFC | Full | L | 4.4 | −56 24 28 | 2,864 | 0.017 |
| Low | R | 5.6 | 56 18 32 | 2,232 | 0.029 | |
| Frontal pole | Low | R | 5.2 | 34 48 10 | 2,112 | 0.033 |
| ITG | Low | R | 5.0 | 62 −26 −22 | 2,248 | 0.021 |
| TPN: Patients pretreatment > post‐treatment | ||||||
| Frontal pole | High | R | 8.4 | 4 64 −6 | 2,272 | 0.020 |
| Precuneus | High | L,R | 10.0 | −8 −78 44 | 8,472 | <0.001 |
| PPC | Full | R | 5.5 | 38 −74 36 | 11,544 | <0.001 |
| High | R | 5.8 | 32 −82 42 | 3,176 | 0.007 | |
| Hc | Full | R | 5.0 | 32 −36 −6 | 2,912 | 0.017 |
| TNN: Controls > patients pretreatment | ||||||
| pINS | Full | L | 3.5 | −40 −24 10 | 5,144 | 0.010 |
| Full | R | 3.9 | 40 −10 8 | 5,728 | 0.007 | |
| OFC | Full | L | 3.6 | −18 22 −18 | 2,800 | 0.045 |
| MTG/STG | Full | R | 3.7 | 70 −26 18 | 3,400 | 0.029 |
| Low | R | 4.1 | 54 −36 2 | 7,080 | 0.002 | |
| midbrain | Full | L | 4.0 | −14 −32 −8 | 3,008 | 0.039 |
| TNN: Patients pretreatment > controls | ||||||
| PCC/precuneus | High | R | 5.6 | 14 −42 44 | 2,632 | 0.026 |
| TNN: Patients post‐treatment > pretreatment | ||||||
| MTG/STG/mINS | Low | R | 5.1 | 52 10 −16 | 3,288 | 0.018 |
| Occipital/lingual | Low | R | 4.4 | 10 −48 4 | 2,288 | 0.042b |
| TNN: Patients pretreatment > post‐treatment | ||||||
| DLPFC | High | R | 4.8 | 32 62 24 | 8,120 | <0.001 |
| VLPFC | High | L | 5.1 | −44 54 −12 | 5,232 | 0.001 |
| Frontal pole | High | R | 6.2 | 32 56 −16 | 8,608 | <0.001 |
| PPC | Full | R | 4.7 | 52 −66 34 | 8,808 | <0.001 |
| High | R | 6.9 | 58 −58 38 | 24,152 | <0.001 | |
| L | 4.8 | −36 −58 46 | 2,888 | 0.010 | ||
The threshold for these analyses was set at P<0.01, significant RFT multiple‐comparison‐corrected clusters at P<0.05 are reported.
Frequency band; Full (0.008–0.2), High (0.09–0.2), Low (0.008–0.09). a/m/pINS, anterior/mid/posterior INS, I/M/STG, inferior/middle/superior temporal gyrus, A/PCC, anterior/posterior cingulate cortex, OFC, orbitofrontal cortex, Cb, cerebellum, FrOp, frontal operculum, VL/DLPFC, ventrolateral/dorsolateral prefrontal cortex, PPC, posterior parietal cortex.
Significant group × timepoint interaction at cluster‐corrected P<0.05 (RM‐ANOVA, flexible factorial model, SPM)
Because we were mainly interested in regions that showed altered connectivity to cognitive networks overall, (i.e., TPN and TNN combined), we overlaid the F maps showing group difference thresholded at P < 0.05 uncorrected with a minimum cluster size of 25 voxels to identify such regions (Fig. 2A). We then created an intersection map of the F maps for TNN and TPN (shown in Fig. 2B), so that the remaining regions had altered connectivity in patients to both TPN and TNN. The most prominent regions to show altered connectivity to both TPN and TNN were the bilateral anterior/mid INS cortex (a/mINS), whose connectivity we investigated in more detail below.
Figure 2.
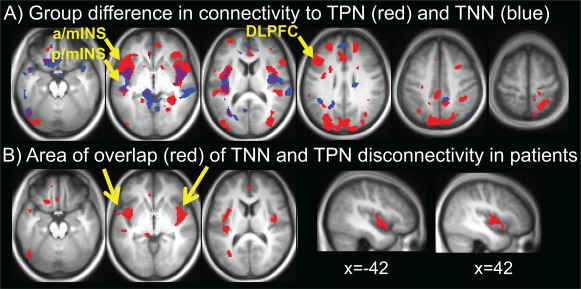
Identification of seed regions based on differences in connectivity between patients pretreatment and controls. A. Altered connectivity between controls and patients to TPN (red) and TNN (blue). This map is based on F‐contrasts thresholded at P<0.05. B. Image showing the areas of overlap in A. Yellow arrows point to the bilateral a/mINS clusters and left DLPFC cluster, which are used for seeds in further analyses (Figs. 4 and 5, respectively). [Color figure can be viewed in the online issue, which is available at http://wileyonlinelibrary.com.]
Another prominent region to show altered connectivity to TPN in patients was the left DLPFC (Fig. 2A). Because of our previous findings on pain‐related changes in DLPFC structure and function [Seminowicz et al., 2011] we focused on this area further by including it as a seed region.
Whole Brain Voxel‐to‐Voxel Connectivity Analysis
To confirm global disruption in connectivity to INS in patients, we used a voxel‐to‐voxel based intrinsic connectivity contrast (ICC) analysis [Martuzzi et al., 2011] in the Conn toolbox [Whitfield‐Gabrieli and Nieto‐Castanon, 2012]. This analysis determines the strength of functional connectivity between each voxel and all other voxels in the brain. We compared resulting ICC maps between patients pretreatment and controls (independent samples t‐tests), and between patients pretreatment and post‐treatment (paired t‐tests).
Analysis of Insula White Matter: Diffusion Tensor Imaging
We used DTI to determine if treatment‐related recovery in functional connectivity of the INS was related to alterations in the underlying structure. To this end, we compared in the white matter of the INS the fractional anisotropy (FA), a degree of water diffusivity (0 = unconstrained to 1=constrained (anisotropic)), assumed to reflect fiber density and/or myelination [Mori and Zhang, 2006]. FA was compared in patients pretreatment versus post‐treatment and in controls at both time points. Covariate analyses were performed to assess the effects of treatment outcomes on FA.
DTI analysis
The left and right INS ROIs from the resting state seed analyses were expanded to include the adjacent white matter. Mean skeleton FA values were extracted from these white matter INS ROIs and compared between patients and controls (independent samples t‐tests) and in patients pretreatment compared to post‐treatment (paired t‐tests) using IBM SPSS Statistics (version 21.0, SPSS). In addition, we investigated the presence of whole‐brain white matter FA changes using TBSS (Tract‐Based Spatial Statistics) in FSL (http://fsl.fmrib.ox.ac.uk/fsl/fslwiki/TBSS). Briefly, TBSS was carried out using a permutation‐based inference tool for nonparametric statistical thresholding, with the number of permutations set at 5,000 (default setting). Comparisons were performed at P<0.001 uncorrected threshold with a minimum cluster extent of 10 voxels to detect the presence of any additional whole brain FA changes.
Connectivity Analysis of the Insula and Relationship with Treatment Outcomes
To confirm large scale disruption of INS connectivity to TPN and TNN, and to identify specific areas in the TPN and TNN with which the connectivity was altered and potentially recovered with treatment, we compared a/mINS connectivity across the brain between patients and controls (independent samples t‐tests) and between patients pretreatment versus post‐treatment (paired t‐tests). The overlap ROI was used as a seed in the Conn toolbox, as described above, and subsequent second‐level t‐tests were performed in SPM to examine effects of group and treatment. The peak coordinates for the seed regions were: left a/mINS, center of mass MNI coordinates −42,0, −3 (ranges for coordinates: −50 to −36, −8 to 12, −14 to 14) ROI volume = 1,736 mm3, right a/mINS, center of mass MNI coordinates 44, −3,1 (ranges for coordinates: 38 to 52, −12 to 12, −12 to 12) ROI volume = 2,296 mm3. To relate connectivity recovery to treatment outcomes, we assessed the whole brain correlations between improvement in SFMPQ and ODI scores (post‐treatment minus pretreatment) and the change in connectivity of the INS (post‐treatment minus pretreatment connectivity map). These tests were thresholded at P<0.001 and corrected for multiple comparisons using RFT at a cluster level of P<0.05.
Connectivity Analysis of the Left Dorsolateral Prefrontal Cortex and Relationship with Treatment Outcomes
To assess in more detail altered connectivity of the left DLPFC region in which we previously reported altered structure and function and partial recovery with treatment [Seminowicz et al., 2011], we compared the connectivity of the left DLPFC ROI between patients and controls (independent samples t‐tests) and between patients pretreatment versus post‐treatment (paired t‐tests). The peak coordinates for the left DLPFC seed region was: center of mass MNI coordinates −48,22,31 (ranges for coordinates: −58 to −34, 12 to 38, 22 to 40) ROI volume = 2,864mm3. Because we previously showed that left DLPFC thickness recovery was inversely correlated with the change in SFMPQ scores, such that greater thickening was associated with a greater reduction in pain [Seminowicz et al., 2011], we assessed the whole brain correlations between improvement in SFMPQ and ODI scores (post‐treatment minus pretreatment) and the change in connectivity of the left DLPFC (post‐treatment minus pretreatment connectivity map). These tests were thresholded at P<0.001 and corrected for multiple comparisons using RFT at a cluster level of P<0.05.
RESULTS
Questionnaire Data
Patients included in this study had SFMPQ total scores of (mean ± SD) 17.6 ± 9.7 before treatment and 10.1 ± 7.1 after treatment (P=0.056), and ODI scores of 45.3 ± 16.5 before treatment and 25.7 ± 19.8 after treatment (P=0.005).
Identification of Aberrant Connectivity to Task‐Positive and Task Negative‐Networks in Chronic Low Back Pain Patients Compared to Controls
TPN and TNN in resting state scans were identified based on ICA and spatial correlation with the networks from the cognitive task data (Fig. 1). The most prominent regions showing aberrant connectivity in patients pretreatment compared to controls were bilateral INS cortices for both the TPN and TNN (Fig. 2A). The significant clusters are presented in Table 1. An overlap of the F maps for TNN and TPN is shown in Fig. 2B; the resulting a/mINS region, which showed aberrant connectivity to both TNN and TPN, was used as a seed in later analysis.
Identification of Aberrant Connectivity to Task‐Positive and Task‐Negative Networks in Patients Pre‐ and Post‐Treatment
Posthoc paired t‐tests of the data extracted from INS clusters with decreased connectivity to TPN (a/mINS) and TNN (p/mINS) in patients pretreatment compared to controls revealed partial recovery of this connectivity in patients after treatment, as shown in Supporting Information Figure 1 (high frequency band: TNN‐p/mINS t 13=2.4, P<0.05, TPN‐a/mINS t 13=2.3, P<0.05; low frequency band: TNN‐p/mINS t 13=0.8, P>0.1, TPN‐a/mINS t 13=1.4, P>0.1; full band: TNN‐p/mINS t 13=1.1, P>0.1, TPN‐a/mINS t 13=1.0, P>0.1). There was no significant change in these regions in healthy controls (P>0.1). Moreover, TPN had increased connectivity to left DLPFC post‐treatment compared to pretreatment, as shown in Supporting Information Figure 1 (MNI coordinates −56, 24, 28, Table 1; high frequency band: t 13=2.9, P<0.05; low frequency band: t 13=1.8, P>0.1; full band: t 13=3.6, P<0.01) in an area where patients had less connectivity compared to controls pretreatment (Table 1, coordinates −34, 14, 40). There was no significant change in these regions in healthy controls (P>0.1).
Whole Brain Voxel‐to‐Voxel Analysis
Using voxel‐to‐voxel whole brain analysis, two bilateral a/mINS clusters were the only regions to show significantly less global connectivity in patients pretreatment compared to controls. Conversely, the mediodorsal thalamus had increased global connectivity in patients pretreatment compared to controls. A marginally significant increase in global connectivity was seen in the left aINS in patients post‐treatment compared to pretreatment (Fig. 3, Table 4).
Figure 3.
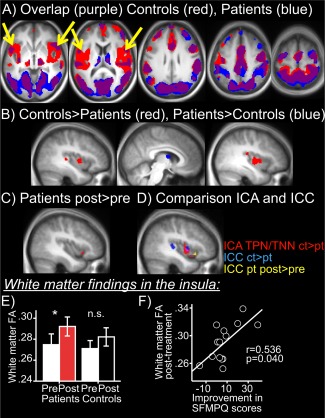
Voxel‐to‐voxel analysis confirms disrupted INS cortex connectivity and restoration with treatment. A. Overlap map of controls (red) and patients pretreatment (blue) (threshold T = 3.5) showing areas of highest voxel‐to‐voxel connectivity in the whole brain and highlighting the absence of INS connectivity in patients. B. Areas with increased (red) or decreased (blue) whole brain voxel‐to‐voxel connectivity in controls compared to patients pretreatment (P<0.05 cluster corrected). C. Area with increased (red) whole brain voxel‐to‐voxel connectivity in patients post‐treatment compared to pretreatment (P < 0.05 cluster corrected). D. Red, a/mINS overlap cluster from TPN, TNN controls versus patients pretreatment (as in Fig. 2A). Blue, ICC (whole brain voxel‐to‐voxel analysis) controls versus patients pretreatment. Yellow ICC (whole brain voxel‐to‐voxel analysis) patients post‐treatment versus pretreatment, E. White matter finding in a/mINS cluster showing disconnectivity with TPN/TNN: increased white matter FA in a/mINS in patients post‐treatment versus pretreatment (*P<0.05), while no change in controls between visits (n.s.). F. White matter FA in a/mINS post‐treatment is positively correlated with magnitude of recovery in pain (SFMPQ) scores. [Color figure can be viewed in the online issue, which is available at http://wileyonlinelibrary.com.]
Table 4.
Results from voxel‐to‐voxel analyses comparisons between patients and controls and within patients pretreatment and post‐treatment
| Region | Peak T‐value | Peak MNI coordinate | Cluster volume (mm3) | Cluster P‐value |
|---|---|---|---|---|
| Voxel‐to‐voxel | ||||
| Controls > patients pretreatment | ||||
| L a/mINS | 4.9 | −32 8 8 | 1,640 | 0.001 |
| L STG/pINS | 4.8 | −46 −28 0 | 1,040 | 0.005 |
| R S2/pINS | 4.8 | 50 −34 16 | 928 | 0.007 |
| R mINS | 4.7 | 52 −2 0 | 3,472 | <0.001 |
| Patients pretreatment > controls | ||||
| MD thalamus | 4.18 | 4 −2 10 | 648 | 0.020 |
| Patients post‐treatment > pretreatment | ||||
| L aINS | 5.14 | −42 18 −10 | 200 | 0.092 a |
The threshold for these analyses was set at P<0.001, significant multiple‐comparison‐corrected clusters are reported.
Result did not reach significance.
White Matter Findings in the Insula
Fractional anisotropy (white matter tract integrity) in left INS white matter (ROI based on Fig. 2C) did not differ significantly in patients pretreatment versus controls (t=−0.767, P=0.451). However, post‐treatment patients had significantly higher FA in left INS white matter versus pretreatment (t=2.191, P=0.046), while in controls the FA did not change significantly between visits (t=1.293, P=0.228). Results are shown in Figure 3E. No significant differences were observed for right white matter INS. No significant differences were observed anywhere else in the brain (whole brain analysis of white matter FA) between controls and patients or for patients pretreatment versus post‐treatment
FA values in the INS post‐treatment were negatively correlated with magnitude of improvement in SFMPQ scores (i.e., higher FA with more pain improvement; r=−0.536, P=0.040). A similar trend was observed for FA values in the right INS post‐treatment (negative correlation with SFMPQ difference scores t=0.471, P=0.077).
Connectivity of the Anterior/Mid Insula
The results for left a/mINS connectivity are shown in Table 2 and Figure 4. The left a/mINS had decreased connectivity in patients pretreatment versus controls to bilateral aINS/FrOP, bilateral DLPFC, bilateral VLPFC/frontal pole, left SMA/aMCC, PCC/precuneus, left PMC, left PPC, bilateral S1/M1, bilateral temporal, and bilateral visual. There were no significant clusters where patients had more connectivity than controls. In patients, left a/mINS had increased connectivity post‐treatment versus pretreatment to left FrOP/aINS, right DLPFC, left VLPFC, right SMA/MPFC, PCC/precuneus, right temporal and right visual. There were no areas where patients had more connectivity pretreatment versus post‐treatment. Group and time point results for the right a/mINS overlap seed maps were largely similar (Supporting Information Table 1). Therefore, these analyses revealed widespread disconnectivity of the bilateral a/mINS in patients with CLBP that partially recovered after treatment.
Table 2.
Results from left mINS seed analyses comparisons between patients and controls and within patients pre‐ and post‐treatment
| Region | Freqa | L/R | Peak T‐value | Peak MNI coordinate | Cluster volume (mm3) | Cluster P‐value |
|---|---|---|---|---|---|---|
| Left mINS: Controls > patients pretreatment | ||||||
| aINS/frOP | Full | R | 4.6 | 46 20 8 | 5,280 | <0.001 |
| FrOP | Full | L | 4.8 | −52 20 −2 | 1,280 | 0.035 |
| High | L | 5.3 | −42 26 4 | 3,176 | <0.001 | |
| High | R | 5.0 | 56 26 2 | 2,864 | 0.001 | |
| Low | L | 5.6 | −48 6 −2 | 2,552 | 0.004 | |
| DLPFC | Full | R | 4.2 | 36 12 34 | 1,336 | 0.032 |
| High | L | 4.5 | −46 26 38 | 2,528 | 0.001 | |
| Frontal pole | Full | L | 5.6 | −30 60 2 | 3,560 | 0.001 |
| Full | R | 5.0 | 32 56 16 | 3,952 | 0.001 | |
| High | L | 4.6 | −36 48 6 | 1,568 | 0.008 | |
| High | R | 5.9 | 28 48 12 | 3,064 | 0.001 | |
| SMA/aMCC | Full | L | 3.9 | −2 20 52 | 2,640 | 0.004 |
| PCC/precuneus | Full | L | 6.7 | −8 −46 46 | 11,840 | <0.001 |
| Low | R | 4.9 | 10 −46 52 | 5,960 | <0.001 | |
| MTG/STG | Full | L | 4.8 | −46 −30 0 | 1,960 | 0.012 |
| Full | R | 4.5 | 60 −16 −4 | 4120 | 0.001 | |
| High | L | 5.8 | −46 −32 0 | 2,296 | 0.002 | |
| PPC | Full | L | 4.4 | −28 −58 46 | 1,880 | 0.013 |
| Low | L | 5.0 | −50 −26 0 | 2,408 | 0.004 | |
| S1/M1 | Full | L | 5.2 | −30 −14 50 | 4,344 | 0.001 |
| Full | R | 4.4 | 46 −22 36 | 1,296 | 0.034 | |
| Low | L | 4.9 | −54 2 38 | 1,312 | 0.027 | |
| Low | R | 4.4 | 44 −6 56 | 2,640 | 0.003 | |
| PMC | Full | L | 4.3 | −36 4 42 | 2,304 | 0.007 |
| Occipital/lateral | Full | L | 4.0 | −48 −70 4 | 1,984 | 0.011 |
| Occipital/lingual | High | L | 4.3 | −24 −56 2 | 816 | 0.044 |
| Occipital/cuneus | Full | R | 5.6 | 22 −66 14 | 44,608 | <0.001 |
| High | R | 4.3 | 20 −80 30 | 792 | 0.047 | |
| Low | R | 5.7 | 16 −62 14 | 10,832 | <0.001 | |
| Left mINS: Patients pretreatment > controls: no significant clusters | ||||||
| Left mINS: Patients post−treatment > pretreatment | ||||||
| DLPFC | Full | R | 6.3 | 38 48 24 | 2,384 | 0.001b |
| VLPFC | Full | L | 6.5 | −48 36 10 | 1,920 | 0.002b |
| SMA/DMPFC | Full | R | 6.3 | 2 24 52 | 2,824 | <0.001 |
| FrOP/aINS | High | L | 7.2 | −56 18 4 | 1,784 | 0.001b |
| High | L | 6.6 | −32 18 14 | 1,328 | 0.003b | |
| ITG | Low | R | 8.0 | 52 −48 −16 | 1,808 | 0.003 |
| PCC/precuneus | Low | R | 8.0 | −14 −42 40 | 2,200 | 0.003b |
| Occipital/lingual | Low | R | 5.2 | 16 −96 −10 | 1,232 | 0.010 |
| Left mINS: Patients pretreatment > post‐treatment: no significant clusters | ||||||
| Correlations with improvement in pain (SFMPQ) and pain‐related disability (ODI) | ||||||
| Left a/mINS: Negative correlations with change in SFMPQ | ||||||
| DLPFC | High | L | 7.6 | −46 24 34 | 176 | 0.017 |
| Th | High | R | 9.2 | 14 −14 −4 | 5,408 | <0.001 |
| High | L | 8.3 | −12 −8 8 | 5,816 | <0.001 | |
| Occipital/lateral | High | L | 6.4 | −38 −80 42 | 112 | 0.001 |
| SPL | High | L | 5.9 | −42 −60 52 | 4,120 | <0.001 |
| Cb | High | L | 5.3 | −10 −52 −36 | 576 | 0.025 |
| SMA | High | L | 5.0 | −4 −6 66 | 464 | 0.042 |
| PCC | High | R | 4.9 | −12 −52 36 | 1,264 | 0.002 |
| IPL/SMG | Full | L | 6.8 | −50 −68 14 | 1,216 | 0.007 |
| Left a/mINS: Negative correlations with change in ODI | ||||||
| IPL/SMG | Low | L | 7.8 | −52 −64 30 | 6,280 | <0.001 |
| Low | R | 7.8 | 50 −60 20 | 1,552 | 0.004 | |
| Full | L | 5.9 | −50 −60 20 | 1,232 | 0.006 | |
| Cb | Low | L | 6.2 | −6 −88 −24 | 1,288 | 0.007 |
| MPFC | Low | L | 6.0 | −8 72 12 | 704 | 0.036 |
| Th | High | L | 5.8 | −16 −10 8 | 624 | 0.024 |
The threshold for these analyses was set at P<0.001, significant RFT multiple‐comparison‐corrected clusters at P<0.05 are reported.
Frequency band; Full (0.008–0.2), High (0.09–0.2), Low (0.008–0.09)
Significant group × timepoint interaction at cluster‐corrected P<0.05 (RM‐ANOVA, flexible factorial model, SPM).
Figure 4.
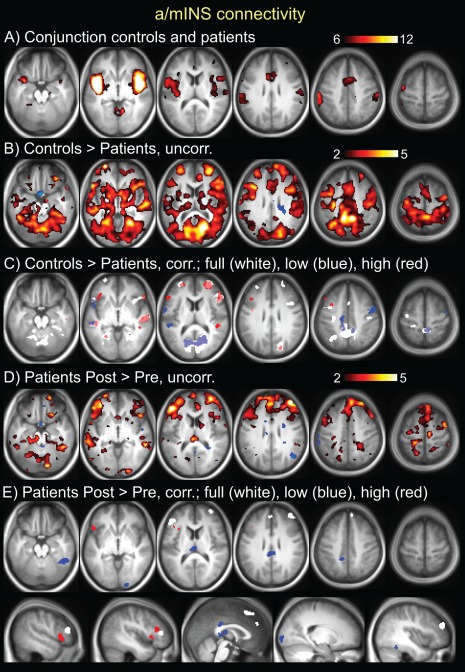
Results from seed‐based resting state connectivity of the left anterior/mid INS overlap (identified in fig 2). A. Conjunction seed map of controls and patients at the pretreatment time point. T scale is 6–12. B. Controls > patients pretreatment, T scale 2–5, demonstrating disconnectivity of left a/mINS to vast regions of cortex and subcortical and brainstem areas. C. Controls > patients pretreatment, significant clusters (P<0.05 cluster corrected). There were no areas where patients had more connectivity than controls. D. Patients post‐treatment > pretreatment, T scale 2–5, demonstrating increased connectivity of left a/mINS post‐treatment to multiple cortical regions, particularly prefrontal. E. Patients post‐treatment > pretreatment, significant clusters (p<0.05 cluster corrected). There were no areas with increased connectivity pre‐ compared to post‐treatment. For C and E, results are shown for different bandwidths: white = full band (0.008–0.2 Hz), blue = low frequency (0.008–0.09 Hz), red = high frequency (0.09–0.2 Hz). [Color figure can be viewed in the online issue, which is available at http://wileyonlinelibrary.com.]
Relationship Between Anterior/Mid Insula Connectivity and Treatment Outcomes
The results for a/mINS correlations with SFMPQ (pain) and ODI (pain‐related disability) are shown in Table 2. The change in increases in connectivity of the left a/mINS (post‐treatment minus pretreatment connectivity map) was correlated with the magnitude of improvement in SFMPQ scores following treatment in left DLPFC, right PCC, left IPL/SMG, left SPL, left SMA, bilateral thalamus and left Cb. Correlation analysis between the change in connectivity in the left a/mINS and the magnitude of improvement in ODI scores yielded similar results (see Table 2). No correlations were found between decreases in connectivity with the left a/mINS with either SFMPQ or ODI. Therefore, these analyses revealed that increased INS connectivity was related to improvement in pain and pain‐related disability with treatment.
Connectivity of the Left Dorsolateral Prefrontal Cortex
The results for DLPFC connectivity are shown in Table 3 and Figure 5. The left DLPFC had decreased connectivity in patients pretreatment versus controls to the cerebellum. There were no significant clusters where patients had more connectivity than controls. In patients, the left DLPFC had increased connectivity post‐treatment versus pretreatment to pMCC, bilateral S1/M1, right PMC, right PPC, left Cb, left temporal, bilateral fusiform, and bilateral visual. Decreased post‐treatment connectivity was seen to one cluster, sACC/VMPFC. Therefore, these analyses revealed widespread changes, largely increases, in left DLPFC connectivity with treatment.
Table 3.
Results from left DLPFC seed analyses comparisons between patients and controls and within patients pretreatment and post‐treatment
| Region | Freqa | L/R | Peak T‐value | Peak MNI coordinate | Cluster volume (mm3) | Cluster P‐value |
|---|---|---|---|---|---|---|
| L DLPFC: Controls > patients pretreatment | ||||||
| Cb | Full | R | 4.5 | 6 −70 −28 | 1,112 | 0.041 |
| L DLPFC: Patients pretreatment > controls: no significant cluster | ||||||
| L DLPFC: Patients post‐treatment > pretreatment | ||||||
| pMCC | High | mid | 6.7 | 0 −6 30 | 464 | 0.051b |
| PMC | Full | R | 6.8 | 40 4 58 | 720 | 0.035 |
| STG | Full | L | 5.4 | −48 4 −10 | 720 | 0.035 |
| ITG | Full | L | 5.7 | −44 −56 −16 | 800 | 0.027b |
| fusiform | Low | L | 7.8 | −30 −48 −22 | 4,520 | <0.001b |
| Low | R | 6.0 | 34 −60 −18 | 1,472 | 0.004b | |
| S1/M1 | Low | R | 6.2 | 22 −28 46 | 976 | 0.015 |
| PPC | Low | R | 5.1 | 30 −52 46 | 1,312 | 0.006 |
| Low | R | 5.0 | 24 −74 40 | 648 | 0.042 | |
| Cb | Low | L | 5.5 | −10 −70 −34 | 1,184 | 0.009 |
| Occipital/lateral | Full | L | 6.6 | −40 −80 20 | 3,056 | <0.001 |
| Full | R | 5.0 | 38 −74 26 | 864 | 0.023b | |
| Occipital/lingual | Full | L | 6.3 | −2 −96 −6 | 792 | 0.028b |
| High | mid | 5.7 | 0 −96 −8 | 568 | 0.033 | |
| Low | R | 4.7 | 10 −64 −8 | 1,328 | 0.006 | |
| L DLPFC: Patients pretreatment > post‐treatment | ||||||
| sACC/VMPFC | High | L | 6.3 | −8 38 −14 | 496 | 0.045b |
| Left DLPFC: Negative correlations with change in SFMPQ | ||||||
| DLPFC | Full | R | 7.8 | 36 26 44 | 1,624 | 0.002 |
| Full | L | 5.5 | −18 −2 66 | 672 | 0.034 | |
| OFC | Full | R | 7.2 | 24 18 −16 | 2,032 | 0.001 |
| M1 | Full | L | 5.3 | −52 −6 46 | 536 | 0.054 |
| Occipital/lateral | Full | L | 6.1 | −20 −92 −22 | 1,040 | 0.011 |
| Full | R | 7.1 | 26 −86 18 | 1,968 | 0.001 | |
| Left DLPFC: Negative correlations with change in ODI | ||||||
| DLPFC | Full | R | 7.1 | 38 24 46 | 872 | 0.017 |
| M1 | Full | R | 6.4 | 56 0 46 | 800 | 0.022 |
| MTG/STG | High | R | 6.1 | 64 −12 −8 | 608 | 0.025 |
| ITG/fusiform | Full | R | 5.6 | 40 −60 −2 | 1,088 | 0.009 |
| Full | R | 9.2 | 68 −26 −22 | 680 | 0.032 | |
| Cb | Low | L | 5.4 | −46 −66 −48 | 720 | 0.029 |
The threshold for these analyses was set at p<0.001, significant RFT multiple‐comparison‐corrected clusters at P<0.05 are reported.
Frequency band; Full (0.008–0.2), High (0.09–0.2), Low (0.008–0.09).
Significant group x timepoint interaction at cluster‐corrected P<0.05 (RM‐ANOVA, flexible factorial model, SPM).
Figure 5.
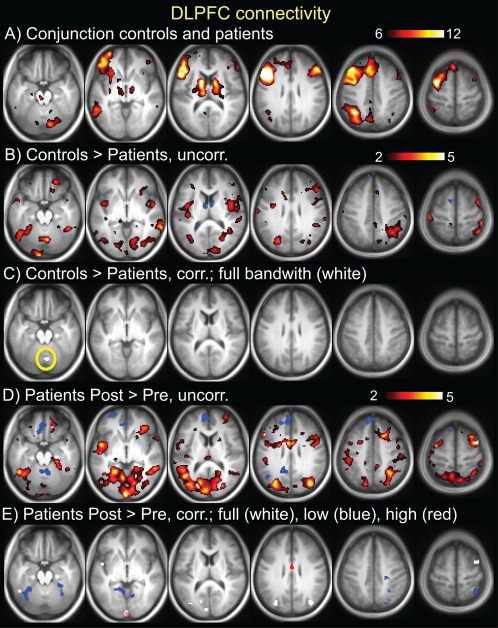
Results from seed‐based resting state connectivity of the left DLPFC (identified in Fig. 2). A. Conjunction seed map of controls and patients at pretreatment time point. T scale is 6–12. B. Controls > patients pretreatment, T scale 2–5, demonstrating disconnectivity of the left DLPFC to vast regions of the cortex, and subcortical, and brainstem areas. C. Controls > patients pretreatment, significant cluster (P<0.05 cluster corrected, yellow circle). There were no areas where patients had more connectivity than controls. D. Patients post‐treatment > pretreatment, T scale 2–5, demonstrating increased connectivity of left DLPFC post‐treatment to multiple cortical regions, particularly prefrontal. E. Patients post‐treatment > pretreatment, significant clusters (P<0.05 cluster corrected). For C and E, results are shown for different bandwidths: white = full band (0.008–0.2 Hz), blue = low frequency (0.008–0.09Hz), red = high frequency (0.09–0.2 Hz). [Color figure can be viewed in the online issue, which is available at http://wileyonlinelibrary.com.]
Relationship Between the Left Dorsolateral Prefrontal Cortex Connectivity and Treatment Outcomes
The results for DLPFC correlations with SFMPQ (pain) and ODI (pain‐related disability) are shown in Table 3. The change in connectivity of the left DLPFC (post‐treatment minus pretreatment connectivity map) was correlated with the magnitude of improvement in SFMPQ scores following treatment in bilateral DLPFC, right VLPFC/OFC/aINS, left S1, and bilateral visual Correlation analysis between the change in connectivity in the DLPFC and the magnitude of improvement in ODI scores yielded largely similar results, including the right DLPFC cluster (see Table 3). No correlations were found between decreases in connectivity with the left DLPFC with either SFMPQ or ODI. Therefore, these analyses revealed that increased prefrontal connectivity was related to improvement in pain and pain‐related disability with treatment.
Effect of Frequency Band on Functional Connectivity of the Insula and Dorsolateral Prefrontal Cortices
The contribution of lower (0.008–0.09 Hz) and higher frequency (0.09–0.2 Hz) to full band (0.008–0.2 Hz) connectivity changes between groups and time points were evaluated for the INS and DLPFC seeds. Isolated analysis in the high frequency band revealed decreased connectivity to INS areas in patients pretreatment versus controls, and increased connectivity post‐treatment versus pretreatment to VLPFC, DLPFC and MCC (all areas belonging to TPN). Similarly, isolated analysis of the lower frequency revealed decreased connectivity in patients pretreatment versus controls, as well as partial recovery with treatment, primarily to PCC/precuneus, fusiform, and ITG, areas that belong to the TNN. Decreased connectivity in patients post‐treatment versus pretreatment, which was only observed for the DLPFC, was found in the higher frequency (0.09–0.2 Hz) in VMPFC/sACC, a node of the TNN. While the physiological role of these different frequency bands is largely unknown, studies have implicated frequency band‐specific changes in chronic pain.
DISCUSSION
Our findings indicate that intrinsic connectivity of cognitive networks is altered in CLBP and that treatment partially restores connectivity toward normal patterns. Our analyses converged on aberrant connectivity of cognitive networks to the bilateral INS in CLBP, with evidence coming from ICA, seed‐based, and voxel‐to‐voxel connectivity analyses. Abnormal INS connectivity to multiple areas of the TPN and TNN was partially restored after treatment. Furthermore, changes in underlying white matter structure support these functional connectivity findings. The DLPFC also showed aberrant connectivity that was restored after treatment. The partial recovery of INS and DLPFC connectivity to cognitive networks was related to treatment outcomes. Altogether, our findings implicate the bilateral INS and left DLPFC as key areas of (disrupted) intrinsic connectivity in CLBP.
Treatment Restores Aberrant Insula and DLPFC Connectivity
Aberrant functional connectivity of the INS to both TPN and TNN in CLPB patients was partially restored with treatment, suggesting that insults to intrinsic cognitive networks due to prolonged pain are reversible. Moreover, increased connectivity of INS to DLPFC and several other TPN and TNN areas was related to treatment‐related pain reduction. A/mINS white matter FA, reflecting the degree of water diffusion anisotropy in each voxel, was increased after treatment. As increased white matter FA has been related to increased axonal density and myelination [Blumenfeld‐Katzir et al., 2011; De Groof et al., 2008], both of which are associated with increased structural connectivity, this increase in patients could indicate improved robustness of the white matter scaffolding underlying the intrinsic functional network [van den Heuvel et al., 2009]. The FA increased in patients post‐treatment only, whereas it remained stable in controls between two sessions, and the FA values post‐treatment were correlated with pain reduction. Similarly, we previously reported that increased INS cortical thickness was correlated with pain reduction after treatment [Seminowicz et al., 2011].
Functional connectivity between the left DLPFC and the TPN was reduced in patients and restored after treatment. We previously reported decreased cortical thickness in the same patients in the left DLPFC [Seminowicz et al., 2011], which reversed after treatment. The extent of increased left DLPFC cortical thickness in that study, and the increased connectivity between left and right DLPFC in this study were correlated with reduced pain and pain‐related disability.
INS and DLPFC are amongst the most highly connected brain regions, serving as “hubs” for integration of information across different parts of the brain [van den Heuvel and Sporns, 2013]. Thus, an impaired connectivity of these two regions will likely have consequences on brain function. Our findings provide evidence that chronic pain‐related alterations in INS and DLPFC connectivity negatively affect networks supporting cognitive functioning, and these findings are supported by the fact that these networks can partially be restored with treatment and this recovery is at least in part related to improvement on pain and pain‐related disability.
Anterior/Mid Insula as the Connectivity Hub in CLBP
We propose that the a/mINS, which had decreased connectivity in patients compared to controls to both TPN and TNN, is a hub of (aberrant) connectivity in CLBP. Given that TNN and TPN are “anti‐correlated” (Fig. 1), this observation is initially counterintuitive; however on closer examination, the findings fit well with the existing literature. The pINS is often deactivated during cognitive tasks [Mayer et al., 2010; Spreng et al., 2010], and the more anterior part of the INS is commonly activated during cognitive tasks. Thus, the reduced connectivity of both of pINS and aINS to the rest of TNN and TPN, respectively, suggests impaired efficiency of and a compromised relationship between these networks.
The overlapping a/mINS region that was functionally disconnected from both TPN and TNN in CLBP is involved in cognitive (task) control [Dosenbach et al., 2007; Power et al., 2011] as part of the overarching cognitive control network (CCN). The CCN encompasses both TPN and TNN regions [Fox et al., 2005; Fransson, 2005], including the INS and DLPFC. In terms of cognitive control, these regions are required for goal‐directed actions and suppression of irrelevant information [Spreng et al., 2010; Vincent et al., 2008]. It has been suggested that the CCN maintains task control by sending regulatory top‐down signals to TPN [Dosenbach et al., 2006] and TNN [Wen et al., 2013] brain areas, thereby serving as a “cortical mediator” that facilitates the balance between the TPN and TNN necessary for optimal behavior. Accordingly, the CCN has been shown to flexibly couple (positively correlate) with either TPN or TNN depending on task domain in support of goal‐directed cognition [Gao and Lin, 2012; Spreng et al., 2010]. This flexibility is impaired in older adults, resulting in a failure to deactivate the TNN during a cognitive task [Spreng and Schacter, 2012]. Failure to deactivate the TNN (as well as TPN hyperactivation) has been observed in CLBP [Baliki et al., 2008; Seminowicz et al., 2011] and in other chronic pain conditions [Glass et al., 2011; Weissman‐Fogel et al., 2011]. We here show that altered function of TPN and TNN regions in chronic pain might be mediated by their impaired connectivity to the CCN, specifically the a/m INS and the DLPFC, and that this can be partially restored with treatment (see schematic in Fig. 6). In future studies using tasks to activate the TPN and TNN separately, their relative contribution to impaired connectivity with the CCN could be explored in chronic pain conditions.
Figure 6.
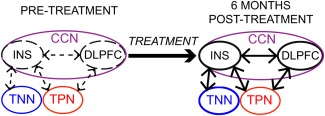
Schematic summary of findings. Treatment of CLBP results in partial recovery of intrinsic functional connectivity between the CCN, comprising the INS and DLPFC, and the TPN and TNN. [Color figure can be viewed in the online issue, which is available at http://wileyonlinelibrary.com.]
“Clinical” Pain: Current (Ongoing) Pain Versus Disease State of Chronic Pain
Studies in chronic pain have reported increased connectivity between TNN and a/mINS, while we here report decreased connectivity between TNN (as well as TPN) and a/mINS. An explanation for these differences is that in the studies reporting increased TNN‐aINS connectivity, patients were largely experiencing ongoing pain at the time of the scan [Baliki et al., 2012; Loggia et al., 2013; Napadow et al., 2010]. In contrast, in our study deliberate effort was made to make patients as comfortable as possible for the scan, resulting in minimal to no pain during the short scanning period (despite an average daily pain of 4/10 or higher as dictated by inclusion criteria). Consistent with our findings, two recent studies in migraine patients who were pain‐free at the time of the scan also reported reduced connectivity compared to controls between INS and TNN (precuneus) [Schwedt et al., 2013], or the entire CCN and TPN (right PMC/DLPFC) [Russo et al., 2012]. This reduced connectivity was correlated with increased pain reported for previous migraine attacks [Russo et al., 2012] and with duration of symptoms [Schwedt et al., 2013]. Together, these findings suggest differential effects on intrinsic connectivity between current pain and changes related to long‐term chronic pain as a disease state. Indeed, increased connectivity between TNN and widespread brain areas (including the INS) was recently reported in a group of CLBP patients during moderate pain, but not during the pain‐free state [Loggia et al., 2013].
Effects of Bandwidth
Lower‐frequency oscillations contributed primarily to decreased connectivity of INS to TNN areas in patients compared to controls and high frequency oscillations contributed primarily to decreased connectivity between DLPFC/INS and TPN areas, the latter of which was partially restored with treatment. Though their physiological origin and significance are largely unknown, higher frequency cortical oscillations have been shown to contribute to resting state alterations in CLBP [Baliki et al., 2011] and other chronic pain states [Cauda et al., 2009; Malinen et al., 2010; Otti et al., 2013]. These high frequency oscillations are proposed to reflect increased disinhibition of thalamocortical projections [Baliki et al., 2011; Seminowicz et al., 2012], potentially due to prolonged/increased afferent nociceptive input. Conditions of chronic pain are associated with enhanced thalamic neural activity and spontaneous oscillations [Walton et al., 2010; Whitt et al., 2013] that have been shown to release cortical neurons from inhibition [Leznik et al., 2002]. We observed increased global connectivity of mediodorsal thalamus in patients before treatment (Fig. 3), suggesting increased influence of the thalamus across the brain. In EEG studies, increased functional connectivity of thalamus with cortex has been associated with persistence of chronic pain, and has been shown to normalize after successful treatment [Sarnthein et al., 2006; Stern et al., 2006]. Thus, our findings of increased high frequency synchrony between cortical areas, together with increased thalamic connectivity across brain, may support the current view implicating thalamocortical disinhibition in chronic pain pathology.
CONCLUSIONS
We show impaired functional connectivity of the INS—and supported by structural connectivity findings—to the two major brain networks involved in the processing of cognitively demanding tasks in patients with CLBP that is partially restored with treatment. DLPFC also shows partial recovery of altered connectivity after treatment, and in both INS and DLPFC, the recovery of connectivity is related to improvements in pain and pain‐related disability. We propose that this disconnect reflects impaired cortical control of INS and DLPFC over normally efficiently balanced processing of cognitive signals. This thesis is supported by evidence showing inefficient bilateral DLPFC connectivity, which was restored with treatment and correlated to improvement in pain and disability. This work highlights the importance of INS and DLPFC as hubs of chronic pain‐related dysregulation of intrinsic functional connectivity, in particular in terms of altered cognitive processing, which is increasingly being recognized as a major comorbidity in chronic pain.
Supporting information
Supplementary Information
This article was published online on 3 February 2015. An error was subsequently identified. This notice is included in the online and print versions to indicate that both have been corrected on 20 February 2015.
REFERENCES
- Balenzuela P, Chernomoretz A, Fraiman D, Cifre I, Sitges C, Montoya P, Chialvo DR (2010): Modular organization of brain resting state networks in chronic back pain patients. Frontiers in neuroinformatics 4:116. [DOI] [PMC free article] [PubMed] [Google Scholar]
- Baliki MN, Geha PY, Apkarian AV, Chialvo DR (2008): Beyond feeling: Chronic pain hurts the brain, disrupting the default‐mode network dynamics. J Neurosci 28:1398–1403. [DOI] [PMC free article] [PubMed] [Google Scholar]
- Baliki MN, Baria AT, Apkarian AV (2011): The cortical rhythms of chronic back pain. J Neurosci 31:13981–13990. [DOI] [PMC free article] [PubMed] [Google Scholar]
- Baliki MN, Petre B, Torbey S, Herrmann KM, Huang L, Schnitzer TJ, Fields HL, Apkarian AV (2012): Corticostriatal functional connectivity predicts transition to chronic back pain. Nat Neurosci 15:1117–1119. [DOI] [PMC free article] [PubMed] [Google Scholar]
- Biswal B, Yetkin FZ, Haughton VM, Hyde JS (1995): Functional connectivity in the motor cortex of resting human brain using echo‐planar MRI. Magn Reson Med 34:537–541. [DOI] [PubMed] [Google Scholar]
- Blumenfeld‐Katzir T, Pasternak O, Dagan M, Assaf Y (2011): Diffusion MRI of structural brain plasticity induced by a learning and memory task. PLoS One 6:e20678. [DOI] [PMC free article] [PubMed] [Google Scholar]
- Bush G, Shin LM, Holmes J, Rosen BR, Vogt BA (2003): The multi‐source interference task: Validation study with fMRI in individual subjects. Mol Psychiatry 8:60–70. [DOI] [PubMed] [Google Scholar]
- Calhoun VD, Adali T, Stevens MC, Kiehl KA, Pekar JJ (2005): Semi‐blind ICA of fMRI: A method for utilizing hypothesis‐derived time courses in a spatial ICA analysis. Neuroimage 25:527–538. [DOI] [PubMed] [Google Scholar]
- Calhoun VD, Adalı T (2012): Multisubject independent component analysis of fMRI: a decade of intrinsic networks, default mode, and neurodiagnostic discovery. IEEE Rev Biomed Eng. 5:60–73. [DOI] [PMC free article] [PubMed] [Google Scholar]
- Cauda F, Sacco K, Duca S, Cocito D, D'Agata F, Geminiani GC, Canavero S (2009): Altered resting state in diabetic neuropathic pain. PLoS One 4:e4542. [DOI] [PMC free article] [PubMed] [Google Scholar]
- Cauda F, D'Agata F, Sacco K, Duca S, Cocito D, Paolasso I, Isoardo G, Geminiani G (2010): Altered resting state attentional networks in diabetic neuropathic pain. J Neurol Neurosurg Psychiatry 81:806–811. [DOI] [PubMed] [Google Scholar]
- Cifre I, Sitges C, Fraiman D, Munoz MA, Balenzuela P, Gonzalez‐Roldan A, Martinez‐Jauand M, Birbaumer N, Chialvo DR, Montoya P (2012): Disrupted functional connectivity of the pain network in fibromyalgia. Psychosom Med 74:55–62. [DOI] [PubMed] [Google Scholar]
- Cordes D, Haughton VM, Arfanakis K, Wendt GJ, Turski PA, Moritz CH, Quigley MA, Meyerand ME (2000): Mapping functionally related regions of brain with functional connectivity mr imaging. Am J Neuroradiol 21:1636–1644. [PMC free article] [PubMed] [Google Scholar]
- De Groof G, Verhoye M, Van MV , Balthazart J, Van der Linden A (2008): Seasonal rewiring of the songbird brain: An in vivo MRI study. Eur J Neurosci 28:2475–2485. [DOI] [PubMed] [Google Scholar]
- Dosenbach NU, Visscher KM, Palmer ED, Miezin FM, Wenger KK, Kang HC, Burgund ED, Grimes AL, Schlaggar BL, Petersen SE (2006): A core system for the implementation of task sets. Neuron 50:799–812. [DOI] [PMC free article] [PubMed] [Google Scholar]
- Dosenbach NU, Fair DA, Miezin FM, Cohen AL, Wenger KK, Dosenbach RA, Fox MD, Snyder AZ, Vincent JL, Raichle ME, Schlaggar BL, Petersen SE (2007): Distinct brain networks for adaptive and stable task control in humans. Proc Natl Acad Sci USA 104:11073–11078. [DOI] [PMC free article] [PubMed] [Google Scholar]
- Fairbank JC, Couper J, Davies JB, O'Brien JP (1980): The Oswestry low back pain disability questionnaire. Physiotherapy 66:271–273. [PubMed] [Google Scholar]
- Fornito A, Harrison BJ, Zalesky A, Simons JS (2012): Competitive and cooperative dynamics of large‐scale brain functional networks supporting recollection. Proc Natl Acad Sci USA 109:12788–12793. [DOI] [PMC free article] [PubMed] [Google Scholar]
- Fox MD, Snyder AZ, Vincent JL, Corbetta M, Van Essen DC, Raichle ME (2005): The human brain is intrinsically organized into dynamic, anticorrelated functional networks. Proc Natl Acad Sci 102:9673–9678. [DOI] [PMC free article] [PubMed] [Google Scholar]
- Fransson P (2005): Spontaneous low‐frequency BOLD signal fluctuations: An fMRI investigation of the resting‐state default mode of brain function hypothesis. Hum Brain Mapp 26:15–29. [DOI] [PMC free article] [PubMed] [Google Scholar]
- Gao W, Lin W (2012): Frontal parietal control network regulates the anti‐correlated default and dorsal attention networks. Hum Brain Mapp 33:192–202. [DOI] [PMC free article] [PubMed] [Google Scholar]
- Glass JM, Williams DA, Fernandez‐Sanchez ML, Kairys A, Barjola P, Heitzeg MM, Clauw DJ, Schmidt‐Wilcke T (2011): Executive function in chronic pain patients and healthy controls: Different cortical activation during response inhibition in fibromyalgia. J Pain 12:1219–1229. [DOI] [PMC free article] [PubMed] [Google Scholar]
- Hong JY, Kilpatrick LA, Labus J, Gupta A, Jiang Z, Ashe‐McNalley C, Stains J, Heendeniya N, Ebrat B, Smith S, Tillisch K, Naliboff B, Mayer EA (2013): Patients with chronic visceral pain show sex‐related alterations in intrinsic oscillations of the resting brain. J Neurosci 33:11994–12002. [DOI] [PMC free article] [PubMed] [Google Scholar]
- Kelly AM, Uddin LQ, Biswal BB, Castellanos FX, Milham MP (2008): Competition between functional brain networks mediates behavioral variability. Neuroimage 39:527–537. [DOI] [PubMed] [Google Scholar]
- Kim JY, Kim SH, Seo J, Kim SH, Han SW, Nam EJ, Kim SK, Lee HJ, Lee SJ, Kim YT, Chang Y (2013): Increased power spectral density in resting‐state pain‐related brain networks in fibromyalgia. Pain 154:1792–1797. [DOI] [PubMed] [Google Scholar]
- Kong J, Loggia ML, Zyloney C, Tu P, LaViolette P, Gollub RL (2010): Exploring the brain in pain: Activations, deactivations and their relation. Pain 148:257–267. [DOI] [PMC free article] [PubMed] [Google Scholar]
- Leznik E, Makarenko V, Llinas R (2002): Electrotonically mediated oscillatory patterns in neuronal ensembles: An in vitro voltage‐dependent dye‐imaging study in the inferior olive. J Neurosci 22:2804–2815. [DOI] [PMC free article] [PubMed] [Google Scholar]
- Loggia ML, Kim J, Gollub RL, Vangel MG, Kirsch I, Kong J, Wasan AD, Napadow V (2012a): Default mode network connectivity encodes clinical pain: An arterial spin labeling study. Pain 154:24–33. [DOI] [PMC free article] [PubMed] [Google Scholar]
- Loggia ML, Edwards RR, Kim J, Vangel MG, Wasan AD, Gollub RL, Harris RE, Park K, Napadow V (2012b): Disentangling linear and nonlinear brain responses to evoked deep tissue pain. Pain 153:2140–2151. [DOI] [PMC free article] [PubMed] [Google Scholar]
- Loggia ML, Kim J, Gollub RL, Vangel MG, Kirsch I, Kong J, Wasan AD, Napadow V (2013): Default mode network connectivity encodes clinical pain: An arterial spin labeling study. Pain 154:24–33. [DOI] [PMC free article] [PubMed] [Google Scholar]
- Malinen S, Vartiainen N, Hlushchuk Y, Koskinen M, Ramkumar P, Forss N, Kalso E, Hari R (2010): Aberrant temporal and spatial brain activity during rest in patients with chronic pain. Proc Natl Acad Sci USA 107:6493–6497. [DOI] [PMC free article] [PubMed] [Google Scholar]
- Mantini D, Caulo M, Ferretti A, Romani GL, Tartaro A (2009): Noxious somatosensory stimulation affects the default mode of brain function: Evidence from Functional MR Imaging1. Radiology 253:797–804. [DOI] [PubMed] [Google Scholar]
- Martuzzi R, Ramani R, Qiu M, Shen X, Papademetris X, Constable RT (2011): A whole‐brain voxel based measure of intrinsic connectivity contrast reveals local changes in tissue connectivity with anesthetic without a priori assumptions on thresholds or regions of interest. Neuroimage 58:1044–1050. [DOI] [PMC free article] [PubMed] [Google Scholar]
- Mayer JS, Roebroeck A, Maurer K, Linden DE (2010): Specialization in the default mode: Task‐induced brain deactivations dissociate between visual working memory and attention. Hum Brain Mapp 31:126–139. [DOI] [PMC free article] [PubMed] [Google Scholar]
- Melzack R (1987): The short‐form McGill Pain Questionnaire. Pain 30:191–197. [DOI] [PubMed] [Google Scholar]
- Mori S, Zhang J (2006): Principles of diffusion tensor imaging and its applications to basic neuroscience research. Neuron 51:527–539. [DOI] [PubMed] [Google Scholar]
- Napadow V, LaCount L, Park K, As‐Sanie S, Clauw DJ, Harris RE (2010): Intrinsic brain connectivity in fibromyalgia is associated with chronic pain intensity. Arthritis Rheum 62:2545–2555. [DOI] [PMC free article] [PubMed] [Google Scholar]
- Otti A, Guendel H, Wohlschlager A, Zimmer C, Noll‐Hussong M (2013): Frequency shifts in the anterior default mode network and the salience network in chronic pain disorder. BMC psychiatry 13:84. [DOI] [PMC free article] [PubMed] [Google Scholar]
- Power JD, Cohen AL, Nelson SM, Wig GS, Barnes KA, Church JA, Vogel AC, Laumann TO, Miezin FM, Schlaggar BL, Petersen SE (2011): Functional network organization of the human brain. Neuron 72:665–678. [DOI] [PMC free article] [PubMed] [Google Scholar]
- Russo A, Tessitore A, Giordano A, Corbo D, Marcuccio L, De Stefano M, Salemi F, Conforti R, Esposito F, Tedeschi G (2012): Executive resting‐state network connectivity in migraine without aura. Cephalalgia 32:1041–1048. [DOI] [PubMed] [Google Scholar]
- Sarnthein J, Stern J, Aufenberg C, Rousson V, Jeanmonod D (2006): Increased EEG power and slowed dominant frequency in patients with neurogenic pain. Brain 129:55–64. [DOI] [PubMed] [Google Scholar]
- Schwedt TJ, Schlaggar BL, Mar S, Nolan T, Coalson RS, Nardos B, Benzinger T, Larson‐Prior LJ (2013): Atypical resting‐state functional connectivity of affective pain regions in chronic migraine. Headache 53:737–751. [DOI] [PMC free article] [PubMed] [Google Scholar]
- Seminowicz DA, Davis KD (2007a): Interactions of pain intensity and cognitive load: The brain stays on task. Cereb Cortex 17:1412–1422. [DOI] [PubMed] [Google Scholar]
- Seminowicz DA, Davis KD (2007b): Pain enhances functional connectivity of a brain network evoked by performance of a cognitive task. J Neurophysiol 97:3651–3659. [DOI] [PubMed] [Google Scholar]
- Seminowicz DA, Wideman TH, Naso L, Hatami‐Khoroushahi Z, Fallatah S, Ware MA, Jarzem P, Bushnell MC, Shir Y, Ouellet JA, Stone LS (2011): Effective treatment of chronic low back pain in humans reverses abnormal brain anatomy and function. J Neurosci 31:7540–7550. [DOI] [PMC free article] [PubMed] [Google Scholar]
- Seminowicz DA, Jiang L, Ji Y, Xu S, Gullapalli RP, Masri R (2012): Thalamocortical asynchrony in conditions of spinal cord injury pain in rats. J Neurosci 32:15843–15848. [DOI] [PMC free article] [PubMed] [Google Scholar]
- Smith SM, Fox PT, Miller KL, Glahn DC, Fox PM, Mackay CE, Filippini N, Watkins KE, Toro R, Laird AR, Beckmann CF (2009): Correspondence of the brain's functional architecture during activation and rest. Proc Natl Acad Sci U S A 106:13040–13045. [DOI] [PMC free article] [PubMed] [Google Scholar]
- Spreng RN, Schacter DL (2012): Default network modulation and large‐scale network interactivity in healthy young and old adults. Cereb Cortex 22:2610–2621. [DOI] [PMC free article] [PubMed] [Google Scholar]
- Spreng RN, Stevens WD, Chamberlain JP, Gilmore AW, Schacter DL (2010): Default network activity, coupled with the frontoparietal control network, supports goal‐directed cognition. Neuroimage 53:303–317. [DOI] [PMC free article] [PubMed] [Google Scholar]
- Stern J, Jeanmonod D, Sarnthein J (2006): Persistent EEG overactivation in the cortical pain matrix of neurogenic pain patients. Neuroimage 31:721–731. [DOI] [PubMed] [Google Scholar]
- Tagliazucchi E, Balenzuela P, Fraiman D, Chialvo DR (2010): Brain resting state is disrupted in chronic back pain patients. Neurosci Lett 485:26–31. [DOI] [PMC free article] [PubMed] [Google Scholar]
- Tessitore A, Russo A, Giordano A, Conte F, Corbo D, De Stefano M, Cirillo S, Cirillo M, Esposito F, Tedeschi G (2013): Disrupted default mode network connectivity in migraine without aura. J Headache Pain 14:89. [DOI] [PMC free article] [PubMed] [Google Scholar]
- van den Heuvel MP, Sporns O (2013): An anatomical substrate for integration among functional networks in human cortex. J Neurosci 33:14489–14500. [DOI] [PMC free article] [PubMed] [Google Scholar]
- van den Heuvel MP, Mandl RC, Kahn RS, Hulshoff Pol HE (2009): Functionally linked resting‐state networks reflect the underlying structural connectivity architecture of the human brain. Hum Brain Mapp 30:3127–3141. [DOI] [PMC free article] [PubMed] [Google Scholar]
- Van Dijk KR, Sabuncu MR, Buckner RL (2012): The influence of head motion on intrinsic functional connectivity MRI. Neuroimage 59:431–438. [DOI] [PMC free article] [PubMed] [Google Scholar]
- Vincent JL, Kahn I, Snyder AZ, Raichle ME, Buckner RL (2008): Evidence for a frontoparietal control system revealed by intrinsic functional connectivity. J Neurophysiol 100:3328–3342. [DOI] [PMC free article] [PubMed] [Google Scholar]
- Walton KD, Dubois M, Llinás RR (2010): Abnormal thalamocortical activity in patients with Complex Regional Pain Syndrome (CRPS) Type I. Pain 150:41–51. [DOI] [PubMed] [Google Scholar]
- Weissman‐Fogel I, Moayedi M, Tenenbaum HC, Goldberg MB, Freeman BV, Davis KD (2011): Abnormal cortical activity in patients with temporomandibular disorder evoked by cognitive and emotional tasks. Pain 152:384–396. [DOI] [PubMed] [Google Scholar]
- Wen X, Liu Y, Yao L, Ding M (2013): Top‐down regulation of default mode activity in spatial visual attention. J Neurosci 33:6444–6453. [DOI] [PMC free article] [PubMed] [Google Scholar]
- Whitfield‐Gabrieli S, Nieto‐Castanon A (2012): Conn: a functional connectivity toolbox for correlated and anticorrelated brain networks. Brain connectivity 2:125–141. [DOI] [PubMed] [Google Scholar]
- Whitt JL, Masri R, Pulimood NS, Keller A (2013): Pathological activity in mediodorsal thalamus of rats with spinal cord injury pain. J Neurosci 33:3915–3926. [DOI] [PMC free article] [PubMed] [Google Scholar]
Associated Data
This section collects any data citations, data availability statements, or supplementary materials included in this article.
Supplementary Materials
Supplementary Information