

Abstract
Magnetoencephalographic (MEG) investigations of inter‐regional amplitude correlations have yielded new insights into the organization and neurophysiology of resting‐state networks (RSNs) first identified using fMRI. Inter‐regional MEG amplitude correlations in adult RSNs have been shown to be most prominent in alpha and beta frequency ranges and to express strong congruence with RSN topologies found using fMRI. Despite such advances, little is known about how oscillatory connectivity in RSNs develops throughout childhood and adolescence. This study used a novel fMRI‐guided MEG approach to investigate the maturation of resting‐state amplitude correlations in physiologically relevant frequency ranges within and among six RSNs in 59 participants, aged 6–34 years. We report age‐related increases in inter‐regional amplitude correlations that were largest in alpha and beta frequency bands. In contrast to fMRI reports, these changes were observed both within and between the various RSNs analyzed. Our results provide the first evidence of developmental changes in spontaneous neurophysiological connectivity in source‐resolved RSNs, which indicate increasing integration within and among intrinsic functional brain networks throughout childhood, adolescence, and early adulthood. Hum Brain Mapp 35:5249–5261, 2014. © 2014 Wiley Periodicals, Inc.
Keywords: magnetoencephalography, resting‐state networks, development, neural oscillations, functional connectivity, neural synchrony, neural network, functional magnetic resonance imaging, alpha‐band, beta‐band
INTRODUCTION
Recent advances in analysis of resting‐state brain connectivity have provided new vistas into the organization of intrinsic neural networks. Resting‐state networks (RSNs) were initially identified through temporal correlations in BOLD signals of the resting brain. A classical example is the default mode network (DMN), which is robust during rest and shows disrupted activation patterns during goal‐directed behaviour [Greicius et al., 2003; Raichle et al., 2001]. This and other RSNs have been the focus of many studies in adults and adult clinical populations [i.e., Brier et al., 2012]; much less is understood about their maturational course. The development of spontaneous fMRI connectivity throughout childhood and adolescence has been characterized by a general tendency toward increased network integration with maturation. With increasing age, connectivity increases among anatomically segregated but functionally related brain regions [Fair et al., 2009]; for example, connectivity among DMN regions increased with age [Fair et al., 2008]. Such results suggest that locally defined functional network architecture in children progresses towards more distributed functional network connectivity in adults [Dosenbach et al., 2010].
Magnetoencephalographic (MEG) resting‐state studies of amplitude correlations have revealed RSN organization similar to that observed using fMRI [Brookes et al., 2011a,b]. Neuromagnetic recordings however, offer higher temporal resolution and therefore convey insights into temporal dynamics within physiologically relevant frequency ranges [de Pasquale et al., 2010, 2012; Hipp et al., 2012]. In adults, spontaneous MEG connectivity has been shown to be strongest among alpha (8–14 Hz) and beta band (15–30 Hz) oscillations in the visual cortex and DMN regions [Hillebrand et al., 2012; Hipp et al., 2012].
Functional connectivity mediated by neural oscillations is thought to be relevant for inter‐regional communication supporting cognition and perception [Fries, 2005; Uhlhaas et al., 2009b; Varela et al., 2001]. Much of this research has indicated that inter‐regional phase relationships are pertinent for dynamic functional connectivity [see Fries, 2005], although more recent research has indicated that correlations in band‐limited amplitude are also relevant for cognitive and perceptual networks [see Lachaux et al., 2012]. Task‐dependent expression of oscillatory connectivity has also been related to the development of functional networks underlying cognitive and perceptual processing throughout childhood [Uhlhaas et al., 2009a, 2010]. Moreover, the amplitude of neural oscillations in specific frequency ranges has been linked to the development of language abilities [i.e., Benasich et al., 2008; Heim et al., 2013]. Increased short‐distance but decreased long‐distance beta‐band EEG connectivity with development has also been reported [Thatcher et al., 2008]. Although such EEG studies provide important information on the maturation of connectivity in the brain, they offer limited spatial resolution and do not inform the putative involvement of specific brain regions or networks in developmental changes. This study uses a novel fMRI‐guided MEG approach to investigate how the amplitude correlations among spontaneous neuromagnetic oscillations develop within and between RSNs throughout childhood and adolescence and into adulthood.
METHODS
Particicants and MEG Data Acquisition
MEG and fMRI resting‐state data were collected for a total of 67 participants. Due to movement or noise during MEG and/or fMRI data acquisition, we excluded eight participants. Data from single bad channels had to be removed from the MEG data of four participants. Analyses were completed on a total of 59 participants including 20 children (6.6 – 11.6 years, mean 9.0 ± 1.6 years, seven females, two left‐handed), 18 adolescents (12.3 – 15.9 years, mean 14.7 ± 1.1 years, four females, one left‐handed), and 21 adults (20.6 – 34 years, mean 23.7 ± 3.3 years, 11 females, one left‐handed). MEG data were acquired using a 151 channel whole‐head system (CTF Omega, Port Coquitlam, Canada). Five minutes of eyes‐open spontaneous MEG data were collected at 600 Hz during which participants fixated on a white crosshair on black background, which was back‐projected onto a screen about 60 cm from participant's eyes. Participants were supine during recording and were monitored using a video camera. Head location was monitored continuously during MEG data acquisition using three fiducial coils placed at the nasion and the left and right preauricular points. Structural and functional MRI data were collected using a Siemens Trio 3T MRI scanner with a 12 channel head coil. MR acquisition for each participant included a T1 MPRAGE structural image and five minutes of continuous fMRI data, during which participants viewed the same stimulus used during MEG data recording through MR‐compatible goggles. Resting‐state fMRI data were acquired with an echo planar imaging sequence (axial; FOV = 224 × 224 mm; Res = 64 × 64; 40 slices; 3.5 × 3.5 × 3.5 mm voxels; TR/TE/FA = 2340/30/70). All data were collected at the Hospital for Sick Children. This research was approved by the Hospital for Sick Children Research Ethics Board and conforms with the Declaration of Helsinki. All participants gave informed consent.
fMRI Data Processing
Recent advances have demonstrated that correlations in the amplitude of spontaneous MEG oscillations reflect intrinsic organization of functional networks consistent with RSNs identified using fMRI BOLD correlations [Brookes et al., 2011a,b]. This led to studies employing seed points based on fMRI for the study of spontaneous MEG oscillations [i.e., de Pasquale et al., 2012]. Further, we know that the organization of RSN connectivity, as revealed by fMRI, undergoes considerable maturational changes throughout childhood and adolescence [i.e., Dosenbach et al., 2010; Fair et al., 2009]. Given this, extraction of spontaneous MEG data based on coordinates obtained from adult fMRI literature may create unanticipated biases in analysis of younger participants. To overcome this challenge, we capitalized on recent advances in fMRI, which enable participant‐level seed coordinate contraction based on BOLD correlation strengths between adjacent voxels. To this end, fMRI data were preprocessed using standard AFNI [Cox, 1996] and FMRIB Software Library tools [Jenkinson et al., 2012]. Slice‐timing and motion correction were performed before aligning the data to the MNI152 2 mm atlas via the participant's high‐resolution anatomical T1. Participants with head movement >2 mm for more than one‐third of their volume were excluded from the analysis. Next, data underwent smoothing using a 7 mm FWHM Gaussian kernel and was bandpass filtered with a lower and upper cut‐off frequency of 0.01 and 0.2 Hz respectively. Mean signals from white matter and CSF ROIs, in addition to a motion signal generated from maximum displacement motion estimates were regressed out. Finally, data were baseline averaged within subjects to subtract the mean of the data. This does not affect the calculation of functional connectivity between regions in BOLD signal, but is a common step in fMRI preprocessing pipelines. In order to account for individual variability in assigning seed points for the connectivity analysis, dilation of a 27 voxel cube centred around each initial seed coordinate in MNI space was used to find regions with strong internal cross‐correlations between neighboring voxels. We employed an iterative algorithm whereby the cross‐correlation of the mean ROI signal and its surrounding voxels was calculated. With each iteration, the adjacent voxel with the highest cross‐correlation was added to the ROI until either an internal correlation of 0.7 was achieved or the ROI had grown to 300 voxels. Typically the seed points contained about 100 voxels. The coordinates of the voxel most highly correlated with the mean ROI signal were extracted and used for MEG source reconstruction. This method generated seed coordinates at locations expressing maximal local connectivity, and also accounted for individual and age‐related differences in the organization of intrinsic resting‐state connectivity. Our approach was derived from previous studies demonstrating the benefits of an erosion‐based method for finding highly self‐correlated ROIs in fMRI [Golestani and Goodyear, 2011]. In this study, we used coordinates defined by de Pasquale et al. [2012], which represent RSN in adult populations [Cordes et al., 2000, 2001; Damoiseaux et al., 2006; de Luca et al., 2006; Greicius, 2008], and adapted them based on the above‐described dilation method in every individual participant. Average seed coordinates are described in Table 1 and depicted in Figure 1. The six RSNs were comprised of the dorsal attention network (DAN), the ventral attention network (VAN), the DMN, the visual network (VIS), the motor network (MOT), and the language network (LAN) [de Pasquale et al., 2012]. Lastly, BOLD correlations among seed points were obtained and used to construct connectivity matrices for each participant.
Table 1.
RSN seed regions
| Networks | Region name | Abbreviation | Seed coordinates | Average dilated coordinates | ||||
|---|---|---|---|---|---|---|---|---|
| DAN | Left posterior intraparietal sulcus | LpIPS | −25 | −67 | 48 | −27 | −69 | 45 |
| Right posterior intraparietal sulcus | RpIPS | 23 | −69 | 49 | 20 | −71 | 45 | |
| Left frontal eye field | FLEF | −26 | −12 | 53 | −26 | −14 | 50 | |
| Right frontal eye field | RFEF | 30 | −13 | 53 | 28 | −16 | 50 | |
| Left middle temporal | LMT | −43 | −72 | −8 | −44 | −70 | −9 | |
| Right middle temporal | RMT | 42 | −70 | −11 | 40 | −68 | −12 | |
| VAN | Right middle frontal gyrus | RMFG | 41 | 17 | 31 | 39 | 14 | 31 |
| Right precentral sulcus | RPCD | 41 | 2 | 50 | 38 | −1 | 50 | |
| Right supramarginal gyrus | RSMG | 52 | −48 | 28 | 51 | −49 | 27 | |
| Right superior temporal gyrus | RSTG | 58 | −48 | 10 | 56 | −48 | 10 | |
| Right ventral frontal cortex | RVFC | 40 | 21 | −4 | 39 | 18 | −1 | |
| DMN | Left angular gyrus | LAG | −43 | −76 | 35 | −42 | −74 | 31 |
| Right angular gyrus | RAG | 51 | −64 | 32 | 47 | −63 | 30 | |
| Posterior cingulate/precuneus | PCC | −3 | −54 | 31 | −3 | −54 | 28 | |
| Ventral medial prefrontal cortex | vMPFC | −2 | 51 | 2 | −2 | 49 | 6 | |
| Dorsal medial prefrontal cortex | dMPFC | −13 | 52 | 23 | −15 | 49 | 25 | |
| Right medial prefrontal cortex | RMPFC | 2 | 53 | 24 | 0 | 49 | 27 | |
| Left inferior temporal gyrus | LITG | −57 | −25 | −17 | −57 | −24 | −16 | |
| VIS | Left V1 | LV1 | −3 | −101 | −1 | −5 | −98 | −4 |
| Right V1 | RV1 | 11 | −88 | −4 | 8 | −85 | −5 | |
| Left V2 dorsal | LV2d | −8 | −99 | 7 | −9 | −96 | 3 | |
| Right V2 dorsal | RV2d | 14 | −96 | 13 | 12 | −94 | 10 | |
| Left V3 | LV3 | −9 | −96 | 13 | −10 | −94 | 10 | |
| Right V3 | RV3 | 20 | −95 | 18 | 18 | −94 | 16 | |
| Left V4 | LV4 | −31 | −77 | −17 | −31 | −75 | −18 | |
| Right V4 | RV4 | 27 | −71 | −14 | 24 | −70 | −14 | |
| Left V7 | LV7 | −23 | −78 | 26 | −25 | −78 | 24 | |
| Right V7 | RV7 | 32 | −78 | 25 | 29 | −79 | 22 | |
| MOT | Left secondary somatosensory | LSII | −60 | −28 | 24 | −59 | −28 | 23 |
| Right central sulcus | RCS | 35 | −26 | 55 | 32 | −28 | 52 | |
| Left central sulcus | LCS | −37 | −19 | 53 | −38 | −21 | 51 | |
| Right secondary somatosensory | RSII | 57 | −28 | 23 | 55 | −28 | 22 | |
| Left supplementary motor area | LSMA | −1 | −17 | 55 | −1 | −20 | 52 | |
| Right supplementary motor area | RSMA | 4 | −15 | 53 | 1 | −18 | 50 | |
| Left putamen | LPUT | −30 | −18 | 10 | −30 | −19 | 10 | |
| Right putamen | RPUT | 30 | −17 | 9 | 28 | −18 | 9 | |
| LAN | Left dorsal inferior frontal gyrus | LDIFG | −44 | 23 | 15 | −44 | 21 | 16 |
| Superior temporal sulcus | STS | −50 | −54 | 22 | −50 | −55 | 21 | |
| Anterior superior temporal gyrus | T1a | −56 | −12 | −3 | −56 | −12 | −2 | |
| Upper part of the pars opercularis of the inferior frontal gyrus | F3OPD | −44 | 21 | 24 | −44 | 17 | 26 | |
| Pars triangularis opercularis of the inferior frontal gyrus | F3TV | −43 | 20 | 4 | −43 | 18 | 6 | |
| Posterior superior temporal gyrus | T1p | −55 | −48 | 15 | −56 | −48 | 13 | |
Seed coordinates were adapted from de Pasquale et al. [2012] and dilated based on individual fMRI connectivity for each RSN region analyzed (see the Methods section).
Figure 1.
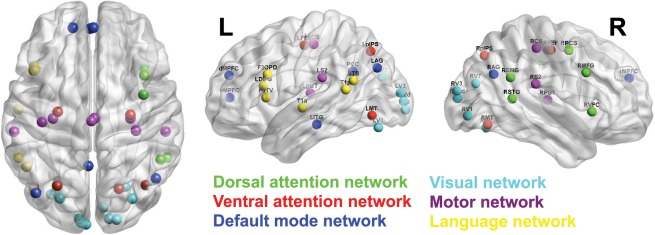
Network regions for fMRI‐guided MEG connectivity analysis. Regions of interest for 42 coordinates from the six RSNs were adapted from de Pasquale et al. [2012] and are shown on brain surface plots in axial, sagittal left, and sagittal right views. To prevent bias in analysis across a wide age range, seed points were dilated according to each individual's fMRI activity patterns, and coordinates representing maximal local connectivity were selected as seed locations for MEG functional connectivity analysis (see Table 1). Regions are grouped into six RSN, which are denoted by color. Depicted here are fMRI‐guided coordinates averaged across all participants, shown in MNI space. Regions were visualized using BrainNet Viewer software (http://www.nitrc.org/projects/bnv). [Color figure can be viewed in the online issue, which is available at http://wileyonlinelibrary.com.]
MEG Data Processing
Broadband time series of MEG data were reconstructed for each seed point based on the fMRI analysis detailed above. To ensure that movement during MEG acquisition was within an acceptable range, we calculated the median head position during MEG recording. Participants who moved >10 mm over 10% of the recording time were excluded. This standard of movement tolerance is typical in MEG studies of pediatric populations and is required to reliably record MEG data from children without creating a biased sample. Time series were reconstructed to represent the activity of each source using beamformer analysis [Sekihara et al., 2001]. Multisphere head models were constructed for each participant using their individual structural MRI data. Beamformer analysis implements a spatial filter to reconstruct activity from a location in the brain, in which activity at all other locations is maximally attenuated without any power change at the reconstructed source location [Quraan and Cheyne, 2010]. Beamformer analysis has also been demonstrated to be effective for supressing both ocular and nonocular artifacts [Cheyne et al., 2006]. In this study, the sources were defined by resting‐state fMRI‐guided MNI coordinates, which were fitted to the standard MNI brain and unwarped into individual headspace. Vector beamformer analysis was then used to reconstruct continuous broadband (1–150 Hz) activity from each source location. To this end a weight vector, w ( r ), was applied to the measurement vector to produce a weighted sum, which represents source activity from the target location, r. Activity at the target location r for time t is produced by the spatial filter
| (1) |
where b (t) is the measurement vector given by
| (2) |
for an MEG system with M sensors. In this study, a two dimensional vector beamformer was employed to derive the tangential components of the source magnitude (θand ϕ), where the weights, source activity and forward solution are given by
| (3) |
| (4) |
and
| (5) |
respectively, and the beamformer weights take the form
| (6) |
where R is the second‐order moment matrix after baseline subtraction (often referred to as the covariance matrix) given by
| (7) |
where <♦> indicates the expectation value [Quraan and Cheyne, 2010; Sekihara et al., 2001].
Reconstructed data from each source were filtered into theta (4–7 Hz), alpha (8–14 Hz), beta (15–30 Hz), low gamma (30–80 Hz) and high gamma (80–150 Hz) frequency ranges. We then obtained time series of instantaneous amplitude values for each source and frequency range using the Hilbert transform, which reflect fluctuations in the envelope of spontaneous neural oscillations. The first and last second from each time series were discarded to avoid contamination from distortions introduced by the Hilbert transform. Finally, we calculated correlation coefficients between time series for each source pair, creating a 42 × 42 connectivity matrix for each participant and frequency range. All region pairs closer in space than 35 mm were excluded from connectivity matrices to protect against spurious correlations introduced by volume conduction. This step was consistent with previous studies using these coordinates to investigate resting‐state MEG envelope correlations [de Pasquale et al., 2012]. Although this original criteria was adapted from a study which did not rely on beamformer source reconstruction, data simulations and comparison of beamformer results with fMRI findings suggest that this criteria is also appropriate for investigating functional connectivity in beamformer reconstructed MEG data [Brookes et al., 2011a]. Moreover, this beamformer‐based approach has also been shown to be effective for analysis of RSNs in MEG [i.e., Brookes et al., 2011b]. Functional connectivity among beamformer reconstructed sources has been successfully investigated in numerous contexts, and data simulations indicate that performance of these methods is appropriate, relative to other available methodologies [see Scoffelen and Gross, 2009 for review].
Statistical Analyses
Connectivity differences between participant groups within (i.e. intra‐DMN connectivity) and between networks (i.e., visual‐to‐DMN or DMN‐to‐DAN connectivity) were evaluated. After removing the diagonal of the 42 × 42 connectivity matrices and excluding node pairs closer than 35 mm, correlations for all pairs within one network comparison were averaged (e.g., averaging across all connections between DMN and VIS for each participant and frequency range) and permutation statistics were employed independently for each network connection [see, Blair and Karniski, 1993]. To provide surrogate data distributions, 21,008 permutations were performed for correcting at an α‐level of 0.05 and 105,040 permutations were performed for correcting at an α‐level of 0.01. The alpha levels of 0.05 and 0.01 were Bonferroni corrected to account for multiple comparisons across all network pairs and frequency bands. Linear regression was used to evaluate global, within‐network and between‐network correlation values with age. Node strength was calculated using the Brain Connectivity Toolbox [Rubinov and Sporns, 2010] and reflects the connectivity strength of each brain region to all other regions. To assess changes in connectivity between individual region pairs throughout development, we calculated correlations of regional connectivity strength with age and inter‐regional pair‐wise connections with age. As a control for false positives, a Bonferroni corrected statistical threshold at an alpha‐level of 0.05 was applied across all regions and frequency bands for connectivity strength and across all region pairs and frequency bands for inter‐regional connectivity.
To investigate whether patterns of MEG amplitude correlations in specific frequency ranges were similar to fMRI connectivity, we first determined the MEG‐fMRI correlation across all analyzed region pairs within each participant. We then used data surrogation to represent the null hypothesis that there was no association between the topographies of fMRI and MEG connectivity by shuffling the matrices and deriving a correlation coefficient for the surrogated data. This was repeated 1000 times within each participant, and then averaged to obtain a robust estimate of the strength of the surrogated correlation. Permutation testing across participants was then employed to assess whether the true MEG‐fMRI correlations statistically differed from the surrogate data [see Blair and Karniski, 1993]; 10,000 permutations were used in these analyses. We also investigated whether MEG amplitude correlations in different frequency bands bore more similarity to topographic patterns of fMRI correlations. To this end, we obtained for each participant the MEG‐fMRI correlation across region pairs for the to‐be‐compared frequency ranges, and then used permutation analysis (10,000 permutations) to test whether or not the association strength differed between bandwidths.
RESULTS
Age‐Group Differences in Oscillatory Network Connectivity
To interrogate potential connectivity differences between age groups, inter‐regional amplitude correlations for all combinations of inter‐ (i.e., DMN‐to‐VIS or DAN‐to‐MOT) and intra‐ (i.e., DMN‐to‐DMN or VAN‐to‐VAN) network pairs were averaged for each participant and group contrasts were assessed using permutation statistics. Group differences were observed in beta, alpha, theta frequency bands, and were most pronounced in the alpha frequency range (Fig. 2). Conversely, low and high gamma frequency bands did not show significant contrasts over age. Highly significant increases in inter‐network and intranetwork connectivity were found between adults and children in beta and alpha bands (Fig. 2; Bonferroni corrected for multiple comparisons). Furthermore, group contrasts between adults and adolescents showed significant but weaker differences in these bands. Contrasts in the theta frequency range were most evident between the adults and adolescent groups, potentially reflecting late restructuring of oscillatory network connectivity in this frequency range. To investigate relations between age and the amplitude of oscillations within each analyzed frequency range, we averaged the envelope amplitude across all analyzed time points for each MEG source location, and subsequently averaged these amplitude scores across all 42 analyzed regions. This produced a single amplitude score for each participant, for each analyzed frequency range, which was then entered into a linear regression analysis with age to determine relations between overall spontaneous oscillatory amplitude and age within the analyzed networks.
Figure 2.
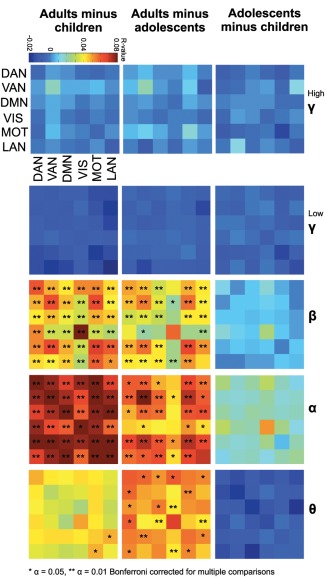
Network connectivity contrasts between age groups. Group contrasts of inter‐ and intra‐ network connectivity for the six RSNs: DAN, VAN, DMN, VIS, MOT, and LAN were determined by averaging all node pairs within one network comparison (i.e., all DMN‐to‐VIS connections). Network connectivity contrasts between age groups are shown for high gamma (80–150 Hz), low gamma (30–80 Hz), beta (15–30 Hz), alpha (8–14 Hz), and theta (4–7 Hz) frequency bands. Connections surviving Bonferroni correction across all network comparisons and frequency bands are shown with asterisks (*α = 0.05; **α = 0.01). Color bar depicts average between‐group differences in inter‐regional correlations. [Color figure can be viewed in the online issue, which is available at http://wileyonlinelibrary.com.]
Band‐Limited MEG Connectivity Changes with Age
To assess the development of network connectivity, we examined correlations between inter‐regional connectivity and age, investigating global connectivity (i.e., averaged across all region pairs, Fig. 3A), intranetwork connectivity (averaged across region pairs within the same network, Fig. 3B) and inter‐network connectivity (i.e., averaged across all DMN‐to‐visual, DMN‐to‐DAN region pairs etc, Fig. 3C). Beta, alpha, and theta frequency bands showed significant correlations of network connectivity with age. Global connectivity showed a significant increase with age (beta: P = 0.000000015, r 2 = 0.43; alpha: P = 0.000000012, r 2 = 0.44; theta: P = 0.016, r 2 = 0.1; Fig. 3A). Subdivision of global network connectivity into intranetwork and inter‐network connectivity revealed positive associations with age, which were also concentrated within beta and alpha bands. Average intranetwork connectivity significantly increased with age (beta: P = 0.0000000082, r 2 = 0.44; alpha: P = 0.000000078, r 2 = 0.4; theta: P = 0.026, r 2 = 0.08; Fig. 3B). Associations between age and inter‐network connectivity were also observed in beta (P = 0.00000016, r 2 = 0.39), alpha (P = 0.000000054, r 2 = 0.41) and theta (P = 0.014, r 2 = 0.1) frequency bands (Fig. 3C). Figure 4 depicts age‐related changes in regional connectivity strength and inter‐regional pair‐wise connections in beta and alpha frequency ranges. The size of each node represents change in connectivity strength with age, and lines indicate correlations among region pairs with age. Only in beta and alpha frequency bands were there correlations with age that survived Bonferroni correction across all regions and frequency bands for connectivity strength and across all region pairs and frequency bands for inter‐regional connectivity.
Figure 3.
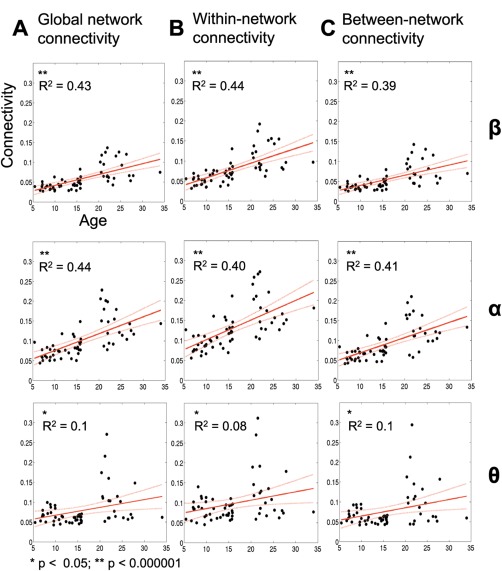
Spontaneous network connectivity increases throughout development. Associations between network connectivity and age in the beta (15–30 Hz), alpha (8–14 Hz), and theta (4–7 Hz) frequency bands across participants are shown. A: Global connectivity, as calculated through the average connectivity of 42 regions, correlates positively with age. B, C: Increased intra‐network connectivity (i.e., all regions within the DMN) and average inter‐network connectivity (i.e., DMN‐DAN) is associated with increased age. P‐values and R 2 –values for linear regression are reported. [Color figure can be viewed in the online issue, which is available at http://wileyonlinelibrary.com.]
Figure 4.
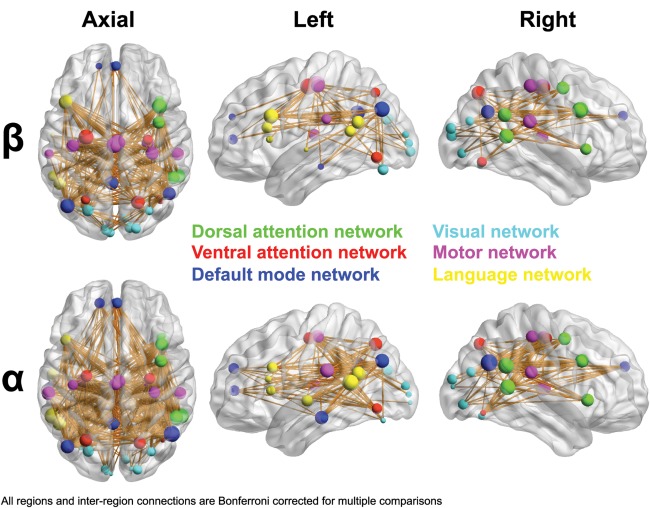
Development of oscillatory network connectivity. Correlations of connectivity strength with age for each region, as well as inter‐regional connectivity in the beta (15–30 Hz) and alpha (8–14 Hz) frequency bands. Regions depicted are group averaged fMRI‐guided coordinates from all participants. Region colors illustrate network affiliation. Region size reflects the correlation between age and that regions' connectivity strength with all other areas in the analyzed network. Thus, larger regions denote greater connectivity increases with development. Age‐related increases in connection strength were significant for all regions in the beta and alpha frequency bands (Bonferroni corrected across all regions and frequencies at an alpha level of 0.05). Inter‐regional connections reflect increased connectivity strength that is positively correlated with age. Line thickness represents correlation strength. Only connections surviving Bonferroni correction across all region pairs and frequencies at an alpha‐level of 0.05 are shown. Regions and connections were visualized using BrainNet Viewer software (http://www.nitrc.org/projects/bnv). [Color figure can be viewed in the online issue, which is available at http://wileyonlinelibrary.com.]
Associations Between Oscillatory Amplitude and Age
To investigate relations between age and the amplitude of oscillations within each analyzed frequency range, we averaged the envelope amplitude across all analyzed time points for each MEG source location, and subsequently averaged these amplitude scores across all 42 analyzed regions. This produced a single amplitude score for each participant, for each analyzed frequency range, which was then entered into a linear regression analysis with age to determine relations between overall spontaneous oscillatory amplitude and age within the analyzed networks. Analysis of associations between age and local amplitude revealed a markedly different pattern of effects than was found for inter‐regional amplitude correlations. Specifically, theta amplitude was found to be negatively associated with age (P = 0.00002, r 2 = 0.28), there was no association between alpha amplitude and age (P = 0.74, r 2 = 0.016), and that beta amplitude was positively associated with age (P = 0.00000013, r 2 = 0.38). Low gamma amplitude was found to be positively associated with age (P = 0.00001, r 2 = 0.28), whereas no association was found between age and high gamma amplitude (P = 0.24, r 2 = 0.0007).
Associations Between fMRI and MEG Connectivity
Inter‐regional MEG connectivity for all three age groups was strongest in theta (4–7 Hz), alpha (8–14 Hz), and beta (15–30 Hz) frequency bands and weak in low (30–80 Hz) and high (80–150 Hz) gamma. Analysis revealed that the topography of inter‐regional correlations in all analyzed frequency ranges corresponded with BOLD connectivity patterns at greater than chance levels (P < 0.0002) for all bandwidths. Correspondence with fMRI was greatest in the alpha and beta band, which did not statistically differ from each other but corresponded better with fMRI than all other analyzed frequency ranges (P < 0.006 in all cases). The congruence between alpha amplitude correlations and fMRI connectivity is depicted in Figure 5.
Figure 5.
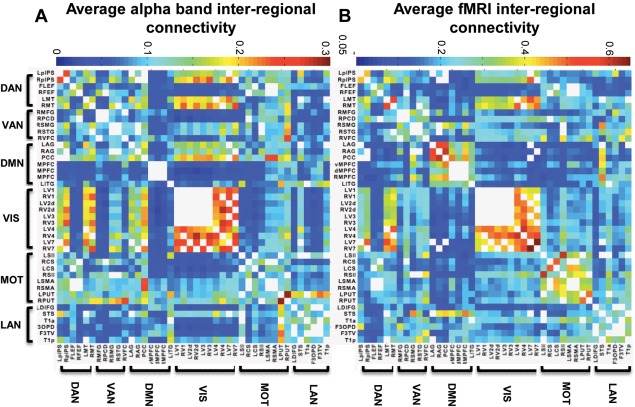
Average alpha band MEG and fMRI connectivity. The strength of inter‐regional connectivity shown for (A) alpha band MEG and (B) fMRI data, averaged across all participants. White cells represent region pairs closer than 35 mm, which were excluded from the analysis. Note adjusted colourbars for MEG and fMRI average connectivity matrices. [Color figure can be viewed in the online issue, which is available at http://wileyonlinelibrary.com.]
DISCUSSION
Using a novel fMRI‐guided MEG approach with three age groups, we found that spontaneous inter‐regional amplitude correlations increased in the beta, alpha and theta frequency bands throughout childhood, adolescence and into adulthood. This study provides the first evidence regarding the development of oscillatory network connectivity within and among RSNs of the brain. Our results build upon previous fMRI investigations of spontaneous network connectivity during childhood and adolescence [Dosenbach et al., 2010; Fair et al., 2009] by providing evidence of how neuromagnetic interactions at physiologically relevant rates mature within RSNs. These findings also provide novel insights on the role of oscillatory network connectivity during brain development throughout childhood, adolescence, and early adulthood. Establishing how the intrinsic patterns of communication develop in functional brain networks is critical, as the coordination of neural oscillations among brain regions is known to support cognitive and perceptual processing [Lachaux et al., 2012; Uhlhaas et al., 2009a; Varela et al., 2001). Age‐dependent changes in the expression of spontaneous brain oscillations have been demonstrated to reflect the development of language abilities [Benasich et al., 2008; Gou et al., 2011]. Furthermore, altered patterns of oscillatory connectivity have been shown in neurodevelopmental disorders [Boersma et al., 2013a; Doesburg et al., in press; Mazaheri et al., 2010] and linked to cognitive difficulties in clinical child populations [Doesburg et al., 2011].
The Temporal Resolution of MEG Sheds New Light on RSNs
Resting‐state fMRI investigations have played a vital role in mapping connectivity in intrinsic brain networks [i.e., Beckmann et al., 2005; Damoiseaux et al., 2006]. Such fMRI studies, while illuminating spontaneous brain connectivity patterns with excellent spatial resolution, are inherently limited to measuring only functional connectivity among indirect measures of neuronal activity at very slow time scales. Recent MEG resting‐state studies in adults have shown that correlations among source‐reconstructed MEG band‐limited envelope amplitude correlations can also reveal RSNs comparable to those detected using fMRI [Brookes et al., 2011a,b]. These networks resembled fMRI networks most closely in the beta band, except the DMN, which was most clearly expressed in the alpha band [Brookes et al., 2011b]. MEG has opened new windows into the organization and role of RSNs as it supports interrogation of fast interactions in neurophysiologically relevant frequency ranges. This approach has revealed increased anterior to posterior amplitude correlations of global connectivity patterns, with hubs located in lateral parietal, dorsal prefrontal and temporal cortices, and the strongest power envelope correlations between 8 and 32 Hz, peaking at 16Hz [Hipp et al., 2012]. Source reconstructed spontaneous MEG has also clarified the contribution of oscillatory connectivity in specific frequency ranges to intrinsic connectivity in particular functional networks [Hillebrand et al., 2012; Hipp et al., 2012]. The temporal resolution provided by MEG has been used to establish RSN dynamics [see de Pasquale et al., 2010]. For example, the DMN has been shown to strongly cross‐correlate with other functional networks in the beta frequency band during periods of high internal network connectivity [de Pasquale et al., 2012].
Functional Networks Integrate with Age
Despite recent breakthroughs in our ability to investigate neurophysiological interactions of RSNs using MEG, knowledge remains scant regarding how such inter‐regional connectivity develops throughout childhood, adolescence and into adulthood. Our findings provide the first evidence of maturation of oscillatory connectivity between sources and indicate that these effects are characterized by a general trend toward integration with age which is most pronounced in the alpha and beta frequency ranges. Moreover, we demonstrate correspondence between topographic patterns of MEG amplitude correlations and fMRI connectivity which is significantly stronger than chance and show that this congruence is strongest in the alpha and beta bands, consistent with prior reports using only adult participants [i.e., Brookes et al., 2011b]. These findings are also in accord with previous research demonstrating the importance of these frequency bands for organization of spontaneous networks measured using MEG [Brookes et al., 2011aa, 2011b; Hipp et al., 2012], and further extend these studies by demonstrating that such patterns of band‐limited amplitude correlations are pertinent to the maturation of functional networks, as well as their expression in adulthood.
The Maturation of Inter‐Regional Amplitude Correlations
Oscillatory connectivity among brain regions has been proposed as a mechanism for neuronal communication and for binding of information [Varela et al., 2001]. Although much emphasis has been placed on phase‐phase relations among regions [i.e., Fries, 2005], more recent findings have also implicated amplitude correlations in functional network connectivity underlying cognitive dynamics [i.e., Lachaux et al., 2012]. Alpha and theta oscillations have been purported to mediate long‐range coupling between distant cortical areas, whereas local connectivity within cortical areas is more prominent in gamma frequency bands [Palva and Palva, 2007; Von Stein and Sarnthein, 2000]. More recent evidence has led to the proposal that coherent beta oscillations also play a central role in information integration across distant brain regions [Siegel et al., 2012]. Spatial distance and hence high conduction delays might limit coherency of large‐scale network oscillations to lower frequency ranges. For reliable communication among oscillating neuronal groups, conduction delay times must also be consistent and predictive. White matter development and axonal myelination continues into early adulthood and relates to fast and reliable axonal conduction times [i.e., Lebel and Beaulieu, 2011]. In accordance with this, our data shows increasing inter‐regional correlations in the alpha and beta bands with maturation, which might reflect increased temporal precision in the coordination of neuronal rhythms and spatial focusing of neural interactions.
In this study, we also observed age‐related changes in the amplitude of oscillatory activity within brain regions comprising the analyzed networks. In general, the pattern of results did not correspond to that observed in the inter‐regional connectivity analysis. Theta amplitude was negatively associated with age, whereas theta connectivity was positively associated with age. No association between alpha amplitude and age was observed, whereas inter‐regional correlations became stronger in the alpha band with increasing age. Conversely, low gamma amplitude increased with age, but inter‐regional connectivity in this frequency range did not. The beta frequency range alone expressed corresponding increases in amplitude and inter‐regional connectivity. Given this strong divergence in the pattern of effects for oscillatory amplitude and inter‐regional connectivity, observed connectivity results cannot be attributed to previously established age‐related changes in EEG/MEG power in various frequency ranges [i.e., Clarke et al., 2001; Gasser et al., 1988]. In the case of beta oscillations, this cannot be unambiguously determined, as prior studies have also reported increases in beta power throughout childhood and adolescence [Gómez et al., 2013]. It is unlikely that our findings of increasing inter‐regional correlations in beta amplitude with age is simply an effect of changes in local amplitude, as prior investigations have indicated that beamformer‐reconstructed estimations of MEG connectivity, with the constraint of ignoring source pairs within 35 mm of one another, should be reasonable estimates of the true underlying neuronal interactions [see Brookes et al., 2011a; Scoffelen and Gross, 2009]. Moreover, many region pairs expressing increased beta connectivity with age are very widely separated (see Fig. 4), indicating that these effects are highly unlikely to arise simply because of changes in local amplitude. Similarly, it is unlikely that observed age‐related changes would be attributable to differences in seed locations between participants. Our fMRI analyses were expressly designed to adapt our coordinates to individual variability in RSN organization [Golestani and Goodyear, 2011], as prior fMRI studies have demonstrated that this changes throughout childhood and adolescence [i.e., Dosenbach et al., 2010; Fair et al., 2009]. Moreover, brain volume increases throughout childhood and adolescence indicating that the distances between nodes would be increasing with age. As this study reports increases in connectivity with age, it is unlikely that this is due to an artefact of age‐dependent shifting of seed locations.
Development of RSN Organization
The present research also provides a novel perspective into the development of the organization of RSNs in specific physiological frequency ranges. We report increased within‐network and between‐network amplitude correlations in beta, alpha and theta frequency bands with increasing age. These results demonstrate a developmental trend towards stronger network integration. EEG studies of maturation in spontaneous oscillatory synchrony among scalp electrodes indicate a shift toward more efficient topologies expressing small‐world properties, and suggest developmental changes in typical routes of information flow in brain networks [Boersma et al., 2011, 2013b]. Previous fMRI studies report increased within‐network connectivity but weakening of between‐network connections [Dosenbach et al., 2010], and a developmental trend toward increased connectivity among distributed but functionally related brain regions, coupled with decreasing integration among anatomical neighbours with weaker functional relations [Fair et al., 2009]. In contrast to these previous fMRI findings, our results not only show an increase in oscillatory MEG amplitude correlations within but also between RSNs throughout development. We demonstrate a trend toward increasing functional connectivity in theta, beta and particularly alpha frequency ranges, indicating that these are particularly relevant physiological timescales in which developmental adaptations in functional network connectivity occur. These findings underline the importance of temporal coordination among distributed processes for the maturation of functional networks.
Neural Synchrony Influences Cognitive Development
The development of coherent oscillations has been purported to play a critical role in the maturation of cognition and perception [Uhlhaas et al., 2010]. An EEG study evaluating coherent perception using ambiguous stimuli found a developmental trend of increased neural phase synchrony in beta and theta frequency bands that was accompanied by improvements in cognitive performance [Uhlhaas et al., 2009b]; early adolescence was accompanied by general destabilization in synchrony linking to a potential reorganization of functional networks. We report pronounced differences in spontaneous theta band amplitude correlations between adults and adolescence, suggesting late restructuring of neuronal networks may also be evident in resting‐state neuromagnetic connectivity.
Neural Oscillations and the Development of Network Connectivity
The emergence of basic neurocognitive functions, such as perceptual closure during infancy, has been shown to coincide with related oscillatory brain responses [Csibra, 2000]. Progressive changes in the spectral content of the EEG have been linked to cognitive development over childhood, and deviation from these normative trajectories have been associated with increased risk of intellectual and/or neurological impairment [Ahn et al., 1980; Clarke et al. 2001; John et al., 1980]. Investigating the development of coherent network oscillations and their role in behavioral, perceptual, and cognitive maturation will further contribute to our understanding of frequency‐specific connectivity among distributed neuronal ensembles underlying functional networks. This study extends this line of inquiry by establishing for the first time that inter‐regional amplitude correlations in the theta, alpha, and beta bands increase throughout childhood, adolescence, and early adulthood.
CONCLUSION
Using a novel fMRI‐guided MEG approach, we provide the first evidence of developmental changes in spontaneous amplitude correlations within and between source‐resolved RSNs. Age‐dependent increases of inter‐regional connectivity in beta, alpha, and theta frequency bands indicate stronger network integration with age, establishing for the first time the typical maturational pattern of oscillatory communication within and between various intrinsic functional networks of the human brain. This development of inter‐regional connectivity is critical to our understanding of the maturation of RSNs and establishes a foundation for future research on relations between inter‐regional oscillatory connectivity and the development of cognitive and perceptual abilities in typical and atypical child populations.
ACKNOWLEDGMENTS
The authors thank Wayne Lee, Marc Lalancette, Rachel C. Leung, Michelle AuCoin‐Power, and Tamara Powell for their assistance in data collection and analyses. We would also like to thank Dr. Maher Quraan and Dr. George Ibrahim for their help with the data analysis and manuscript preparation.
Conflicts of interest: The authors have no conflicts of interest to declare.
REFERENCES
- Ahn H, Prichep L, John ER, Baird H, Trepetin M KH (1980): Developmental equations reflect brain dysfunctions. Science 210:1259–1262. [DOI] [PubMed] [Google Scholar]
- Beckmann CF, DeLuca M, Devlin JT, Smith SM (2005): Investigations into resting‐state connectivity using independent component analysis. Philos Trans R Soc Lond B Biol Sci 360:1001–1013. [DOI] [PMC free article] [PubMed] [Google Scholar]
- Benasich AA, Gou Z, Choudhury N, Harris KD (2008): Early cognitive and language skills are linked to resting frontal gamma power across the first 3 years. Behav Brain Res 195:215–222. [DOI] [PMC free article] [PubMed] [Google Scholar]
- Blair C, Karniski W (1993): An alternative method for significance testing of waveform difference potentials. Psychopysiology 30:518–523. [DOI] [PubMed] [Google Scholar]
- Boersma M, Smit DJ, De Bie HMA, Van Baal GCM, Boomsma DI, De Geus EJC, Delemarre‐van de Waal HA, Stam CJ (2011): Network analysis of resting state EEG in the developing young brain: Structure comes with maturation. Hum Brain Mapp 32:413–425. [DOI] [PMC free article] [PubMed] [Google Scholar]
- Boersma M, Kemner C, De Reus MA, Collin G, Snijders TM, Hofman D, Buitelaar JK, Stam CJ, Van den Heuvel MP (2013a): Disrupted functional brain networks in autistic toddlers. Brain Connect 3:41–49. [DOI] [PubMed] [Google Scholar]
- Boersma M, Smit DJA, Boomsma DI, De Geus EJC, Delemarre‐van de Waal HA, Stam CJ (2013b): Growing trees in child brains: Graph theoretical analysis of electroencephalography‐derived minimum spanning tree in 5‐ and 7‐year‐old children reflects brain maturation. Brain Connect 3:50–60. [DOI] [PubMed] [Google Scholar]
- Brier MR, Thomas JB, Snyder AZ, Benzinger TL, Zhang D, Raichle ME, Holtzman DM, Morris JC, Ances BM (2012): Loss of intranetwork and internetwork resting state functional connections with Alzheimer's disease progression. J Neurosci 32:8890–8899. [DOI] [PMC free article] [PubMed] [Google Scholar]
- Brookes MJ, Hale JR, Zumer JM, Stevenson CM, Francis ST, Barnes GR, Owen JP, Morris PG, Nagarajan SS (2011a): Measuring functional connectivity using MEG: methodology and comparison with fcMRI. NeuroImage 56:1082–1104. [DOI] [PMC free article] [PubMed] [Google Scholar]
- Brookes MJ, Woolrich M, Luckhoo H, Price D, Hale JR, Stephenson MC, Barnes GR, Smith SM, Morris PG (2011b): Investigating the electrophysiological basis of resting state networks using magnetoencephalography. Proce Natl Acad Sci USA 108:16783–16788. [DOI] [PMC free article] [PubMed] [Google Scholar]
- Cheyne D, Bakhtazad L, Gaetz W (2006): Spatiotemporal mapping of cortical activity accompanying voluntary movements using an event‐related beamforming approach. Hum Brain Mapp 27:213–229. [DOI] [PMC free article] [PubMed] [Google Scholar]
- Clarke AR, Barry RJ, McCarthy R, Selikowitz M (2001): Age and sex effects in the EEG: Development of the normal child. Clin Neurophysiol 112:806–814. [DOI] [PubMed] [Google Scholar]
- Cordes D, Haughton VM, Arfanakis K, Wendt GJ, Turski PA, Moritz CH, Quigley MA, Meyerand ME (2000): Mapping functionally related regions of brain with functional connectivity MR imaging. Am J Neuroradiol 21:1636–1644. [PMC free article] [PubMed] [Google Scholar]
- Cordes D, Haughton VM, Arfanakis K, Carew JD, Turski PA, Moritz CH, Quigley MA, Meyerand ME (2001): Frequencies contributing to functional connectivity in the cerebral cortex in “resting‐state” data. Am J Neuroradiol 22:1326–1333. [PMC free article] [PubMed] [Google Scholar]
- Cox RW (1996): AFNI: Software for analysis and visualization of functional magnetic resonance neuroimages. Comput Biomed Res 29:162–173. [DOI] [PubMed] [Google Scholar]
- Csibra G, Davis G, Spratling MW, Johnson MH (2000): Gamma oscillations and object processing in the infant brain. Science 290:1582–1585. [DOI] [PubMed] [Google Scholar]
- Damoiseaux JS, Rombouts SARB, Barkhof F, Scheltens P, Stam CJ, Smith SM, Beckmann CF (2006): Consistent resting‐state networks. Proc Natl Acad Sci USA 103:13848–13853. [DOI] [PMC free article] [PubMed] [Google Scholar]
- de Luca M, Beckmann CF, De Stefano N, Matthews PM, Smith SM (2006): fMRI resting state networks define distinct modes of long‐distance interactions in the human brain. NeuroImage 29:1359–1367. [DOI] [PubMed] [Google Scholar]
- de Pasquale F, Della Penna S, Snyder AZ, Lewis C, Mantini D, Marzetti L, Belardinelli P, Ciancetta L, Pizzella V, Romani GL, Corbetta M (2010): Temporal dynamics of spontaneous MEG activity in brain networks. Proc Natl Acad Sci USA 107:6040–6045. [DOI] [PMC free article] [PubMed] [Google Scholar]
- de Pasquale F, Della Penna S, Snyder AZ, Marzetti L, Pizzella V, Romani GL, Corbetta M (2012): A cortical core for dynamic integration of functional networks in the resting human brain. Neuron 74:753–764. [DOI] [PMC free article] [PubMed] [Google Scholar]
- Doesburg SM, Ribary U, Herdman AT, Miller SP, Poskitt KJ, Moiseev A, Whitfield MF, Synnes A, Grunau RE (2011): Altered long‐range alpha‐band synchronization during visual short‐term memory retention in children born very preterm. NeuroImage 54:2330–2339. [DOI] [PMC free article] [PubMed] [Google Scholar]
- Doesburg SM, Vidal J, Taylor MJ (2013): Reduced theta connectivity during set‐shifting in children with autism. Front Hum Neurosci 7:785 DOI: 10.3389/fnhum.2013.00785. [DOI] [PMC free article] [PubMed] [Google Scholar]
- Dosenbach NUF, Nardos B, Cohen AL, Fair DA, Power JD, Church JA, Nelson SM, Wig GS, Vogel AC, Lessov‐Schlaggar CN, Barnes KA, Dubis JW, Feczko E, Coalson RS, Pruett JR, Barch DM, Petersen SE, Schlaggar BL (2010): Prediction of individual brain maturity using fMRI. Science (New York, NY) 329:1358–1361. [DOI] [PMC free article] [PubMed] [Google Scholar]
- Fair DA, Cohen AL, Dosenbach NUF, Church JA, Miezin FM, Barch DM, Raichle ME, Petersen SE, Schlaggar BL (2008): The maturing architecture of the brain's default network. Proc Natl Acad Sci USA 105:4028–4032. [DOI] [PMC free article] [PubMed] [Google Scholar]
- Fair DA, Cohen AL, Power JD, Dosenbach NUF, Church JA, Miezin FM, Schlaggar BL, Petersen SE (2009): Functional brain networks develop from a “local to distributed” organization. PLoS Comput Biol 5:e1000381. [DOI] [PMC free article] [PubMed] [Google Scholar]
- Fries P (2005): A mechanism for cognitive dynamics: Neuronal communication through neuronal coherence. Trends Cogn Sci 9:474–480. [DOI] [PubMed] [Google Scholar]
- Gasser T, Jennen‐Steinmetz C, Stroka L, Verleger R, Möcks J (1988): Development of the EEG of school‐age children and adolescents II. Topography. Electroencephalogr Clin Neurophysiol 69: 100–109. [DOI] [PubMed] [Google Scholar]
- Golestani A‐M, Goodyear BG (2011): Regions of interest for resting‐state fMRI analysis determined by inter‐voxel cross‐correlation. NeuroImage 56:246–251. [DOI] [PubMed] [Google Scholar]
- Gómez C, Pérez‐Macías JM, Poza J, Fernández A, Hornero R (2013): Spectral changes in spontaneous MEG activity across the lifespan. J Neural Eng 10: 066006. [DOI] [PubMed] [Google Scholar]
- Gou Z, Choudhury N, Benasich AA (2011): Resting frontal gamma power at 16, 24 and 36 months predicts individual differences in language and cognition at 4 and 5 years. Behav Brain Res 220:263–270. [DOI] [PMC free article] [PubMed] [Google Scholar]
- Greicius M (2008): Resting‐state functional connectivity in neuropsychiatric disorders. Curr Opin Neurol 21:424–430. [DOI] [PubMed] [Google Scholar]
- Greicius MD, Krasnow B, Reiss AL, Menon V (2003): Functional connectivity in the resting brain: A network analysis of the default mode hypothesis. Proc Natl Acad Sci USA 100:253–258. [DOI] [PMC free article] [PubMed] [Google Scholar]
- Heim S, Keil A, Choudhury N, Thomas Friedman J, Benasich AA (2013): Early gamma oscillations during rapid auditory processing in children with a language‐learning impairment: Changes in neural mass activity after training. Neuropsychologia 51:990–1001. [DOI] [PMC free article] [PubMed] [Google Scholar]
- Hillebrand A, Barnes GR, Bosboom JL, Berendse HW, Stam CJ (2012): Frequency‐dependent functional connectivity within resting‐state networks: An atlas‐based MEG beamformer solution. NeuroImage 59:3909–3921. [DOI] [PMC free article] [PubMed] [Google Scholar]
- Hipp JF, Hawellek DJ, Corbetta M, Siegel M, Engel AK (2012): Large‐scale cortical correlation structure of spontaneous oscillatory activity. Nat Neurosci 15:884–890. [DOI] [PMC free article] [PubMed] [Google Scholar]
- Jenkinson M, Beckmann CF, Behrens TEJ, Woolrich MW, Smith SM (2012): FSL. NeuroImage 62:782–790. [DOI] [PubMed] [Google Scholar]
- John ER, Ahn H, Prichep L, Trepetin M, Brown DKH (1980): Developmental equations for the electroencephalogram. Science 210:1255–1258. [DOI] [PubMed] [Google Scholar]
- Lachaux J‐P, Axmacher N, Mormann F, Halgren E, Crone NE (2012): High‐frequency neural activity and human cognition: Past, present and possible future of intracranial EEG research. Prog Neurobiol 98:279–301. [DOI] [PMC free article] [PubMed] [Google Scholar]
- Lebel C, Beaulieu C (2011): Longitudinal development of human brain wiring continues from childhood into adulthood. J Neurosci 31:10937–10947. [DOI] [PMC free article] [PubMed] [Google Scholar]
- Mazaheri A, Coffey‐Corina S, Mangun GR, Bekker EM, Berry AS, Corbett BA (2010): Functional disconnection of frontal cortex and visual cortex in attention‐deficit/hyperactivity disorder. Biol Psychiatry 67:617–623. [DOI] [PubMed] [Google Scholar]
- Palva S, Palva JM (2007): New vistas for alpha‐frequency band oscillations. Trends Neurosci 30:150–158. [DOI] [PubMed] [Google Scholar]
- Quraan M, Cheyne D (2010): Reconstruction of correlated brain activity with adaptive spatial filters in MEG. NeuroImage 49:2387–2400. [DOI] [PubMed] [Google Scholar]
- Raichle ME, MacLeod AM, Snyder a Z, Powers WJ, Gusnard DA, Shulman GL (2001): A default mode of brain function. Proc Natl Acad Sci USA 98:676–682. [DOI] [PMC free article] [PubMed] [Google Scholar]
- Rubinov M, Sporns O (2010): Complex network measures of brain connectivity: Uses and interpretations. NeuroImage 52:1059–1069. [DOI] [PubMed] [Google Scholar]
- Scoffelen J‐M, Gross J (2009): Source connectivity analysis with MEG and EEG. Hum Brain Mapp 30:1857–1865. [DOI] [PMC free article] [PubMed] [Google Scholar]
- Sekihara K, Nagarajan SS, Poeppel D, Marantz A, Miyashita Y (2001): Reconstructing spatio‐temporal activities of neural sources using an MEG vector beamformer technique. IEEE Trans Biomed Eng 48:760–771. [DOI] [PubMed] [Google Scholar]
- Siegel M, Donner TH, Engel AK (2012): Spectral fingerprints of large‐scale neuronal interactions. Nat Rev Neurosci 13:121–134. [DOI] [PubMed] [Google Scholar]
- Thatcher RW, North DM, Biver CJ (2008): Development of cortical connections as measured by EEG coherence and phase delays. Hum Brain Mapp 29:1400–1415. [DOI] [PMC free article] [PubMed] [Google Scholar]
- Uhlhaas PJ, Pipa G, Lima B, Melloni L, Neuenschwander S, Nikolic D (2009a): Neural synchrony in cortical networks: history, concept and current status. Front Integr Neurosci 3:1–19. [DOI] [PMC free article] [PubMed] [Google Scholar]
- Uhlhaas PJ, Roux F, Singer W, Haenschel C, Sireteanu R, Rodriguez E (2009b): The development of neural synchrony reflects late maturation and restructuring of functional networks in humans. Proc Natl Acad Sci USA 106:9866–9871. [DOI] [PMC free article] [PubMed] [Google Scholar]
- Uhlhaas PJ, Roux F, Rodriguez E, Rotarska‐Jagiela A, Singer W (2010): Neural synchrony and the development of cortical networks. Trends Cogn Sci 14:72–80. [DOI] [PubMed] [Google Scholar]
- Varela F, Lachaux J, Rodriguez E, Martinerie J (2001): The brainweb: phase synchronization and large‐scale integration. Nat Rev Neurosci 2:229–239. [DOI] [PubMed] [Google Scholar]
- Von Stein A, Sarnthein J (2000): Different frequencies for different scales of cortical integration: From local gamma to long range alpha/theta synchronization. Int J Psychophysiol 38:301–313. [DOI] [PubMed] [Google Scholar]