

Abstract
Objectives:
To investigate, using resting state (RS) functional connectivity (FC), the selectivity of involvement of the sensorimotor network in patients with acquired (A) and with hereditary (H) peripheral neuropathies (PN) and the correlations of RS FC abnormalities with clinical impairment and structural brain damage. Temporal associations among RS networks were also explored. Experimental design: RS fMRI scans were acquired from 13 APN, 12 HPN, and 18 age‐ and sex‐matched healthy controls. Independent component analysis and functional network connectivity were used to investigate RS FC within and among RS networks with potential functional relevance.
Principal observations:
Compared to controls, patients had a decreased FC of the right precentral gyrus and an increased RS FC of the precuneus within the sensorimotor network. Both decreased and increased RS FC also involved the visual and auditory networks, which additionally had an increased coherence of function with the sensorimotor network (more pronounced in HPN). RS FC modifications in patients extended to several cognitive networks and were correlated with disease duration. In APN, they were also correlated with the severity of clinical impairment and corpus callosum atrophy.
Conclusions:
In PN, RS FC modifications extend beyond the sensorimotor network and involve other sensory and cognitive networks. The correlations between RS FC patterns and disease duration in patients as well as with clinical impairment in patients with APN suggest that modifications of FC might reflect an adaptive mechanism, which takes time to occur and helps to limit the clinical consequences of peripheral damage. Hum Brain Mapp 35:513–526, 2014. © 2012 Wiley Periodicals, Inc.
Keywords: brain plasticity, fMRI, functional network connectivity, resting state functional connectivity, peripheral neuropathy
INTRODUCTION
Central nervous system (CNS) reorganization has been shown to occur following peripheral nervous system injury of different etiologies, including peripheral neuropathy (PN) [Reddy et al., 2001, 2002], muscle reconstruction [Chen et al., 2003), and limb amputation [Roricht et al., 2001]. Neurophysiologic and functional magnetic resonance imaging (fMRI) studies have consistently demonstrated a reshaping of the motor and sensory networks in these patients, characterized by an expanded representation for finger movement in patients with motor neuropathy during active and passive tasks [Reddy et al., 2001], an increased recruitment of motor areas and the parietal cortex in patients with neuropathic pain [Maihofner et al., 2007], and local synaptic remapping with invasion of the face and shoulder representation into the hand representation after upper limb amputation [Dettmers et al., 2001].
Although previous findings have helped to shed light on functional CNS modifications following peripheral nervous system injury, there are several aspects that remain unexplored, including the evaluation of a possible vicarious role of other sensory systems, similar to that demonstrated in patients with isolated visual deficits [Leclerc et al., 2000; Poirier et al., 2006; Rocca et al., 2011] and the possible different involvement of the sensorimotor versus other (e.g., cognitive) networks. Indeed, a previous resting state (RS) study in patients with hereditary optic neuropathy has demonstrated that abnormalities of function in this condition are not limited to the visual system, but extend to the auditory network, thus reinforcing the notion of a cross‐modal plasticity between these sensory modalities in patients with visual deficits [Leclerc et al., 2000; Poirier et al., 2006; Rocca et al., 2011]. Another important observation in patients with visual deficits is that age at onset of the clinical manifestations influences the observed modifications of cortical representation due to a different level of maturation of visual synapses in young compared to adult individuals [Herschkowitz, 2000; Herschkowitz et al., 1997]. Whether damage to the peripheral nervous system might be associated with a similar outcome, particularly in chronic conditions, has not been investigated, so far. In this study, we wished to explore these three aspects by using, as a model of peripheral nervous system injury, patients with PN, a heterogeneous condition which is due to different etiologies and which may result in different severities of the clinical manifestations. To assess the influence of age at onset on CNS plasticity, we compared patients with hereditary (H) to those with acquired (A) diseases. Notably, although patients with HPN tend to have a slow progression of clinical symptoms over decades [Pareyson and Marchesi, 2009], those with the acquired forms (particularly those with chronic inflammatory demyelinating polyradiculoneuropathy—CIDP) typically show a more rapid accumulation of disability over a few weeks or months. Since the interpretation of the results of fMRI studies of active tasks in diseased people is biased by the difficulty of matching task performance between patients and controls and among patients with different degrees of impairment, we used a task‐free approach, based on RS fMRI, to define whether functional CNS abnormalities in patients with PN are limited to the motor and sensory systems, or, conversely tend to be more diffuse and involve additional networks. In addition to a “classical” analysis of RS data (i.e., an analysis of functional connectivity [FC] and independent component analysis within all RSNs with potential functional relevance), we also performed a functional network connectivity (FNC) analysis [Jafri et al., 2008] to investigate functional interactions between the RSNs studied. Finally, to get additional insights into the role of the detected abnormalities, we also investigated whether and at which magnitude they were correlated with clinical scales of disease severity and with MRI measures of structural brain damage (if present). For the latter goal, we quantified whole brain T2 lesion volume, as a measure of global brain damage, and corpus callosum (CC) area, as a measure of interhemispheric structural integrity.
MATERIAL AND METHODS
Subjects
We studied 25 right‐handed patients with PN and 18 age‐matched right‐handed healthy controls with no history of neurological disorders and a normal neurological examination. The diagnosis of PN was based on electrophysiological and/or pathological examination at the time of onset of clinical symptoms. Thirteen patients had an APN (11 CIDP and 2 alcoholic neuropathy) and 12 had a HPN (10 Charcot‐Marie‐Tooth disease—none of them with mitofusin 2 gene mutation—and 2 hereditary neuropathy with liability to pressure palsies). To be included, subjects had to have no history of concomitant psychiatric or major medical conditions. In addition, patients had to have no hearing loss or visual disturbances. None of the patients had hyperalgesia or autonomic dysfunction. In patients, peripheral nerve function was tested using the clinical version of the total neuropathy score (TNSc) (i.e., the TNS version based exclusively on clinical evaluation of the patients) [Cavaletti et al., 2006]. The main demographic and clinical characteristics of the study groups are reported in Table 1.
Table 1.
Main demographic, clinical, and structural magnetic resonance imaging characteristics of HC and patients with PN
| HC | APN | HPN | P | |
|---|---|---|---|---|
| Number of subjects | 18 | 13 | 12 | — |
| Men/Women | 7/11 | 6/7 | 7/5 | 0.31 |
| Mean age [years] (range) | 47.1 (20–73) | 49.4 (21–77) | 46.6 (35–75) | 0.84 |
| Median disease duration [years] (range) | — | 5.5 (1–22) | 12.2 (0.2–35)a | 0.08 |
| Clinical manifestations: sensory/motor/sensorimotor | — | 4/4/5 | 1/1/10 | — |
| Axonal/demyelinating/mixedb | — | 4/9/0 | 3/7/2 | — |
| Median TNSc (range) | — | 8 (3‐10) | 10 (4‐15) | 0.06 |
| Mean T2 LV [ml] (SD) | — | 2.1 (5.9) | 0.6 (0.9) | 0.06 |
| Mean intracranial volume [ml] (SD) | 1408 (179) | 1436 (152) | 1444 (104) | 0.79 |
| Mean corpus callosum area [mm2] (SD) | 869 (143) | 683 (153) | 774 (120) | 0.01 |
APN, acquired peripheral neuropathy; HPN, hereditary peripheral neuropathy; TNSc, clinical total neuropathy score; LV, lesion volume; SD, standard deviation.
From symptoms onset.
Based on electrophysiological and/or pathological examination.
Approval was received from local ethical standards committee on human experimentation, and written informed consent was obtained from all subjects participating into the study.
MRI Acquisition
Using a 3.0‐Tesla Philips Intera scanner, the following images of the brain were acquired from all subjects: (a) T2*‐weighted single‐shot echo planar imaging (EPI) sequence for RS fMRI (repetition time [TR]= 3,000 ms, echo time [TE] = 35 ms, flip angle [FA] = 90°, field of view [FOV] = 240 mm2; matrix = 128 × 128, slice thickness = 4 mm, 200 sets of 30 contiguous axial slices, parallel to the AC‐PC plane); (b) dual‐echo turbo spin echo (SE) (TR/TE = 3,500/24–120 ms; FA = 150°; FOV = 240 mm2; matrix = 256 × 256; echo train length [ETL] = 5; 44 contiguous, 3‐mm‐thick axial slices); (c) 3D T1‐weighted fast field echo (FFE) (TR = 25 ms, TE = 4.6 ms, FA = 30°, FOV = 230 mm2, matrix = 256 × 256, slice thickness = 1 mm, 220 contiguous axial slices, in‐plane resolution = 0.89 × 0.89 mm2).
Total acquisition time for RS fMRI was about 10 min. During scanning, subjects were instructed to remain motionless, to close their eyes and not to think of anything in particular. All subjects reported that they had not fallen asleep during scanning, according to a questionnaire delivered immediately after the MRI assessment.
Analysis of Intrinsic Brain FC in RSNs (FC Analysis)
Using SPM8, RS fMRI scans were realigned to the first image of each session with a 6° rigid‐body transformation to correct for minor head movements. None of the subjects was excluded from the analysis because of motion, since the maximum cumulative translation was <1.5 mm and the maximum rotation was <0.3° for all of them. Data were then normalized to the SPM8 default EPI template using a standard affine transformation, with data subsampling to a resolution of 3 × 3 × 4 mm3 [Calhoun et al., 2001] and smoothing using a 3D 6‐mm Gaussian kernel. Linear de‐trending and band‐pass filtering between 0.01 and 0.08 Hz were performed using the REST software (http://resting-fmri.sourceforge.net/) to partially remove low‐frequency drift and high‐frequency physiological noise.
After these preprocessing steps, RS FC was assessed using an independent component analysis (ICA) using the GIFT software [Calhoun et al., 2001], and following three main steps: (i) data reduction, (ii) group ICA, and (iii) back reconstruction. First, individual subjects' data were reduced to a lower dimensionality by using a two‐stage principal component analysis (one at an individual level and one at a group level). Then, RS fMRI data from all subjects were concatenated. The independent group components were estimated using the Infomax approach [Bell and Sejnowski 1995) and were used to compute spatial maps and temporal profiles of the individual subject components (back reconstruction). The last stage was performed with the new optimized GICA3 algorithm [Erhardt et al., 2011]. The number of independent group components was 40, that is, the median number of ICs in our study group determined by the minimum description length criterion [Calhoun et al., 2001]. The statistical reliability of the IC decomposition was tested by using the ICASSO toolbox [Himberg et al., 2004], and by running Infomax 10 times with different initial conditions and bootstrapped data sets. Individual functional maps from each ICA‐determined network were converted to Z‐scores before entering group statistics, to obtain voxel values comparable across subjects.
Visual inspection of the spatial patterns, and a frequency analysis of the spectra of the estimated ICs allowed us to remove components clearly related to artifacts. A systematic process was also applied to inspect and select the components of interest from the remaining ones. To identify ICs with potential functional relevance, a frequency analysis of the IC time courses was first performed to detect those with a high (50% or greater) spectral power at a low frequency (between 0.01 and 0.05 Hz) (19 components excluded). Then, RSNs of interest were selected based on results from group ICA using spatial correlation against a set of network templates defined a priori. The default mode network (DMN) was identified through a voxel‐wise correlation with the DMN template supplied in GIFT [Franco et al., 2009]. The remaining network templates were generated using the Wake Forest University (WFU) Pickatlas [Maldjian et al., 2003] on the basis of the Brodmann areas and cluster peaks reported in the literature (for the salience network [SN] [Seeley et al., 2007]; for the fronto‐parietal working memory networks [WMN], lateralized to the left and right hemisphere [Damoiseaux et al., 2006]; for the executive, sensorimotor, primary visual, secondary visual and auditory networks [Smith et al., 2009]). The 11 ICs having a squared correlation coefficient (R 2, as implemented in GIFT software) greater than or equal to 0.20 with each of these templates were selected. The remaining 10 components, representing a mixture of RSNs and artifacts, had a low R 2 with all templates mentioned earlier, and were discarded in order to reduce the likelihood of spurious results.
Analysis of Intrinsic Brain Connectivity Among RSNs (FNC Analysis)
The ICA algorithm assumes that the signal time courses of brain areas belonging to the same IC are synchronous [Calhoun et al., 2004]. Indeed, although RS components are spatially independent, significant temporal correlations exist between them. We explored such temporal associations by analysing the time series of the RSNs of interest using the FNC toolbox (http://mialab.mrn.org), and computing a constrained maximal lagged bivariate correlation between component time courses, as previously described [Jafri et al., 2008]. The maximum possible lag between time courses was set at 6 s. The time courses from all ICs of interest and for all subjects were interpolated, using the low‐pass temporal interpolation implemented in Matlab (The MathWorks, Natick, MA) and resampled to 250 ms bins to enable the detection of sub‐TR hemodynamic delay differences between subjects [Calhoun et al., 2000; Jafri et al., 2008]. Subsequently, the maximal lagged correlation was examined among all pair‐wise combinations between components. In other words, we examined the correlation between two IC time courses, A and B, when B is circularly shifted from ‐6 to +6 s around A. The maximal correlation value and the corresponding lag were saved for each of the analyzed time course pairs.
Structural MRI Analysis
Hyperintense brain lesions on dual‐echo scans were identified by two experienced observers, and lesion volumes (LV) were measured using a local thresholding segmentation technique (Jim 5.0, Xinapse Systems, http://www.xinapse.com). On 3D FFE images, intracranial volumes (ICV) were calculated using the Structural Imaging Evaluation of Normalized Atrophy (SIENAx) software [Smith et al., 2002]. For each subject, the area of the corpus calloum (CC) was also measured on the midsagittal slice of the 3D T1‐weighted images using a local thresholding segmentation technique (Jim 5.0, Xinapse System, http://www.xinapse.com). Areas were expressed in mm2.
Voxel‐based morphometry (VBM) [Good et al., 2001] was performed using SPM8 and the Diffeomorphic Anatomical Registration using Exponentiated Lie algebra (DARTEL) registration method, as described elsewhere [Ashburner, 2007]. Briefly, after segmentation of 3D FFE images into GM, white matter (WM) and cerebrospinal fluid (CSF), GM maps were normalized to the GM population‐specific template generated from the complete image set using DARTEL [Ashburner, 2007]. Spatially normalized images were then modulated by the Jacobian determinants derived from the spatial normalization to ensure preservation of the overall amount of GM tissue, and smoothed with a 8‐mm full‐width at half maximum kernel.
Statistical Analysis
An ANOVA was used to assess between‐group differences in structural MRI measures using the SPSS software package. SPM8 and ANCOVA models were used to assess significant between‐group voxel‐wise differences in GM volume, including age, sex, and ICV as nuisance variables. The within‐group spatial extent of FC for each RSN with potential functional relevance was assessed using SPM8 and a one‐sample t‐test. Between‐group comparisons of RS FC in each network were performed using ANCOVA models corrected for regional GM volume using the Biological Parametric Mapping (BPM) toolbox [Casanova et al., 2007]. The analysis was then repeated by including age as confounding covariate. For these analyses, GM and RSN maps were registered to the MNI space and resampled to an isotropic voxel size (2 × 2 × 2 mm3) and image dimensions (to 91 × 109 × 91 voxels) across functional and structural data. To exclude misclassified pixels from the statistical analysis, GM probability maps were thresholded at 0.2. Correlations of RS FC of each network with clinical and structural MRI variables were performed using BPM and multiple regression models, corrected for regional GM volume. For all the analyses run with SPM, results were assessed at a threshold of P < 0.05 corrected for multiple comparisons (family‐wise error [FWE]). Results were also tested at P < 0.001 (uncorrected for multiple comparisons) and a cluster extent of k = 10 voxels. Correlations and lag values obtained for each subject with the FNC toolbox were averaged for the three groups for descriptive purposes. A Shapiro−Wilk test was used to assess the normality of the distribution of the correlation coefficients obtained from each single subject. Since the assumption of normality was confirmed for our data, parametric tests were used to perform statistical analysis of FNC. One‐sample t‐tests were used to define significant within‐group correlations for controls and patients with PN, separately. Between‐group differences of FNC were then assessed using ANOVA models, both at an uncorrected and at a false discovery rate (FDR) threshold, as implemented in the FNC toolbox [Jafri et al., 2008).
RESULTS
Structural MRI
The main brain structural MRI findings from healthy controls and patients with PN are reported in Table 1. Nonspecific hyperintense T2 lesions were identified in 7 patients with APN and 6 patients with HPN. CC area differed significantly between study groups and was significantly decreased in patients with APN versus healthy controls (P = 0.008). ICV and regional GM volumes (evaluated using VBM) did not differ between study groups. T2 LV was significantly correlated with age (P = 0.009, r = 0.69) in APN, but not in patients with HPN. In patients with APN, T2 LV was also significantly correlated with CC area (P = 0.04, r = −0.58).
Intrinsic Brain FC in RSNs (FC Analysis)
The analysis of RS fMRI detected 11 spatial maps of potentially relevant RS networks, including those related to sensorimotor areas (sensorimotor I and II, R 2 with the template of the sensorimotor network = 0.36 and 0.21, respectively), primary and secondary visual cortical areas (R 2 with the templates of the primary and secondary visual networks = 0.47 and 0.35, respectively), and primary and secondary auditory areas (R 2 with the template of the auditory network = 0.63). We also detected two components related to the DMN (R 2 with the template of the DMN = 0.51 and 0.39, respectively), one related to the executive control network (ECN) (R 2 with the template of the ECN = 0.51), one related to the SN (R 2 with the template of the SN = 0.26), and two related to the WMNs (R 2 with the templates of the left and right WMN = 0.29 and 0.28, respectively) (Fig. 1). All these components were stable across multiple runs of IC decomposition (stability index assessed by ICASSO ranged from 0.94 to 0.98).
Figure 1.
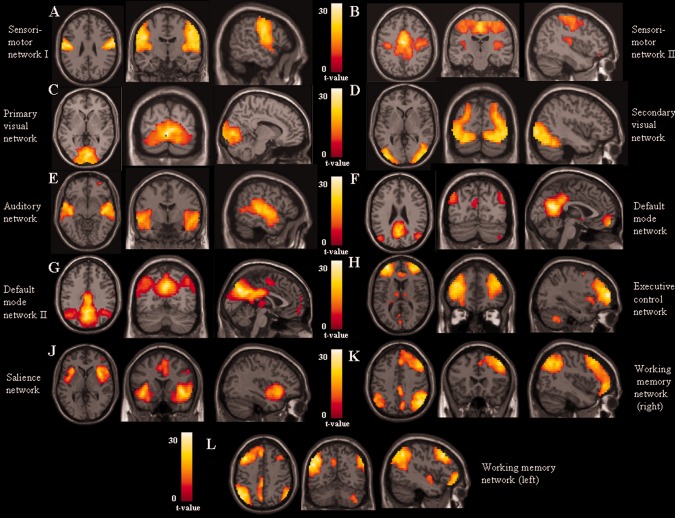
Spatial maps, combined across groups, of potentially functionally‐relevant RSNs from the cohort of healthy subjects and patients with PN (t contrasts thresholded for positive values; ANCOVA models, P < 0.05 family‐wise error corrected for multiple comparisons): (A, B) sensorimotor networks; (C) primary visual network; (D) secondary visual network; (E) auditory network; (F, G) default mode network; (H) executive control network; (I) salience network; (J) right fronto‐parietal working memory network; and (K) left fronto‐parietal working memory network. Images are in neurological convention.
The results of between‐group comparisons of RS FC in all RSNs with potential functional relevance among study groups are shown in Table 2, and in Figures 2 and 3. Compared with controls, patients with APN showed several clusters of decreased FC in the majority of the RSNs, including the sensorimotor (right precentral gyrus), secondary visual (right fusiform gyrus), auditory (right superior temporal pole), SN (right inferior frontal gyrus [IFG]), and left WMN (posterior cingulate cortex [PCC]). Compared with controls, HPN patients showed a decreased FC of the right postcentral gyrus of the sensorimotor I, right fusiform gyrus of the secondary visual, and right IFG of the SN.
Table 2.
Differences between HC, patients with APN and HPN in resting state functional connectivity of all networks with potential functional relevance
| Comparison | RS network | Brain region | BA | MNI space coordinates | t values | k |
|---|---|---|---|---|---|---|
| HC versus APN | Sensorimotor I | R precentral | 6 | 48, −10, 48 | 4.1a | 17 |
| Sensorimotor II | R precentral | 4 | 60, −2, 42 | 3.97 | 20 | |
| Secondary visual RSN | R fusiform gyrus | 19 | 42, −62, ‐18 | 4.4a | 26 | |
| Auditory RSN | R superior temporal pole | 38 | 38, 8, ‐24 | 5.0a | 31 | |
| SN | R IFG | 45 | 55, 22, 12 | 4.0a | 36 | |
| L WMN | L PCC | 23 | −4, −36, 38 | 3.90 | 23 | |
| HC versus HPN | Sensorimotor I | R postcentral | 2 | 20, −44, 62 | 3.30 | 25 |
| Secondary visual RSN | R fusiform gyrus | 37 | 36, −58, −10 | 4.0a | 10 | |
| SN | R IFG | 47 | 40, 22, −10 | 3.20 | 13 | |
| APN versus HC | Sensorimotor I | R precuneus | 5 | 10, −50, 48 | 3.50 | 16 |
| Primary visual RSN | L calcarine cortex | 17 | −4, −70, 14 | 3.80 | 24 | |
| Auditory network | L MTG | 21 | −56, 2, −10 | 3.8a | 12 | |
| DMN | L precuneus/PCC | 23 | −10, −62, 32 | 4.4a | 15 | |
| DMN II | L precuneus/PCC | 23 | −12, −56, 20 | 3.7a | 18 | |
| R precuneus/PCC | 23 | 14, −54, 28 | 3.20 | 19 | ||
| ECN | L DLPFC | 46 | −38, 42, 24 | 4.3a | 23 | |
| L WMN | L SFG | 9 | −22, 38, 46 | 3.20 | 15 | |
| HPN versus HC | Sensorimotor I | R precuneus | 5 | 6, −46, 56 | 3.20 | 21 |
| Primary visual RSN | L calcarine cortex | 17 | −2, −88, 4 | 3.20 | 32 | |
| Auditory RSN | L MTG | 21 | −60, 2, −10 | 3.60 | 10 | |
| DMN II | L precuneus/PCC | 32 | −8, −58, 32 | 3.4a | 68 | |
| ECN | R DLPFC | 46 | 42, 52, 10 | 3.7a | 12 | |
| SN | L insula | 13 | −42, 2, −2 | 4.1a | 14 | |
| L WMN | L DLPFC | 46 | −38, 32, 34 | 3.70 | 22 | |
| APN versus HPN | DMN | L precuneus/PCC | 7 | −6, −76, 46 | 4.4a | 49 |
| HPN versus APN | Sensorimotor II | R precentral gyrus | 4 | 50, −10, 44 | 3.70 | 12 |
| Secondary visual RSN | L inferior occipital gyrus | 18 | −16, −100, −8 | 4.1a | 13 | |
| ECN | R DLPFC | 46 | 30, 50, 18 | 3.7a | 12 |
ANCOVA model adjusted for regional grey matter volume, P < 0.001 uncorrected, cluster extent k=10 voxels.
L, left; R, right; MNI, Montreal Neurological Institute; DMN, default mode network; ECN, executive control network; SN, salience network; WMN, working memory network; BA, Brodmann area; ITG, inferior temporal gyrus; MTG, middle temporal gyrus; PCC, posterior cingulate cortex; DLPFC, dorsolateral prefrontal cortex; IFG, inferior frontal gyrus.
P < 0.05, FWE corrected at a cluster level.
Figure 2.
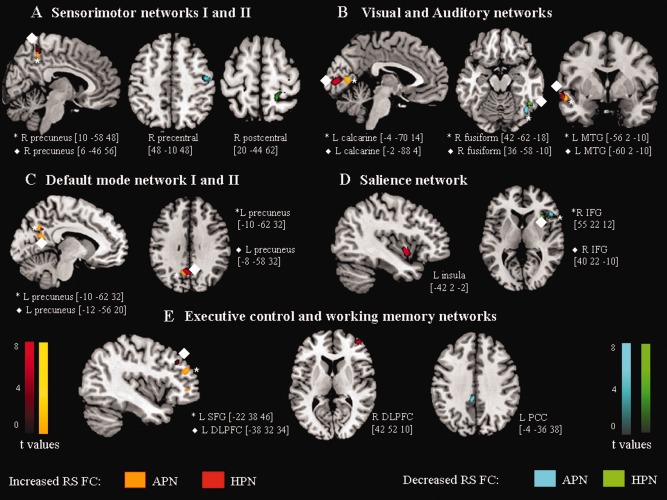
Between‐group differences (P < 0.001, uncorrected for illustrative purposes only) in the spatial patterns of RS FC among patients with PN and healthy controls. (A) sensorimotor networks; (B) visual and auditory networks; (C) default mode network; (D) salience network; (E) executive control and left working memory networks. Brain regions and MNI coordinates of peaks of each detected cluster are also reported. Orange‐codes: clusters of increased RS FC in patients with APN versus controls; red‐codes: clusters of increased RS FC in patients with HPN versus controls; light blue‐codes: clusters of decreased RS FC in patients with APN versus controls; and green‐codes: clusters of decreased RS FC in patients with HPN versus controls. Clusters deriving from homologous networks (e.g., sensorimotor network I and II) are represented using the same colors. Images are in neurologic convention. L, left; R, right; MTG, middle temporal gyrus; IFG, inferior frontal gyrus; SFG, superior frontal gyrus; DLPFC, dorsolateral prefrontal cortex; PCC, posterior cingulate cortex.
Figure 3.
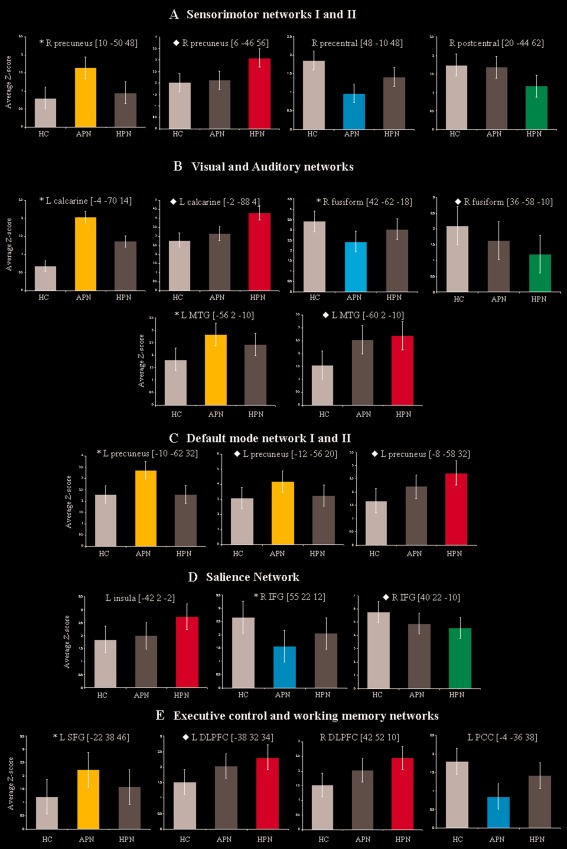
Bar plots showing average Z‐scores and standard deviations of each significant cluster of between‐group difference shown in Figure 2. (A) sensorimotor networks; (B) visual and auditory networks; (C) default mode network; (D) salience network; (E) executive control and left working memory networks. Orange bars represent clusters of increased RS FC in patients with APN versus controls; red bars represent clusters of increased RS FC in patients with HPN versus controls; light blue bars represent clusters of decreased RS FC in patients with APN versus controls; and green bars represent clusters of decreased RS FC in patients with HPN versus controls. L, left; R, right; MTG, middle temporal gyrus; IFG, inferior frontal gyrus; SFG, superior frontal gyrus; DLPFC, dorsolateral prefrontal cortex; PCC, posterior cingulate cortex.
Both groups of patients also showed several clusters of increased FC compared to controls, including the right precuneus (sensorimotor I), left calcarine cortex (primary visual), left middle temporal gyrus (MTG) (auditory), precuneus/PCC (DMN), dorsolateral (DL) prefrontal cortex (PFC) (ECN), and several frontal regions (left WMN). In addition, compared to controls, patients with HPN also experienced an increased FC of the left insula (SN).
Compared to HPN, APN also had a decreased FC of the right precentral gyrus (sensorimotor I), left inferior occipital gyrus (secondary visual), and DLPFC (ECN), as well as an increased FC of the left precuneus/PCC (DMN).
The results of between‐group comparisons of RS FC did not change when including age as a confounding covariate (data not shown).
Intrinsic Brain Connectivity Among RS Networks (FNC Analysis)
Results of FNC analysis are shown in Figure 4 and Table 3, which report significant correlations among RS networks in healthy controls and patients with PN, separately, as well as significant differences of correlations between groups. An increased FNC was found in both patients with APN and patients with HPN versus healthy controls, whereas the opposite was never observed.
Figure 4.
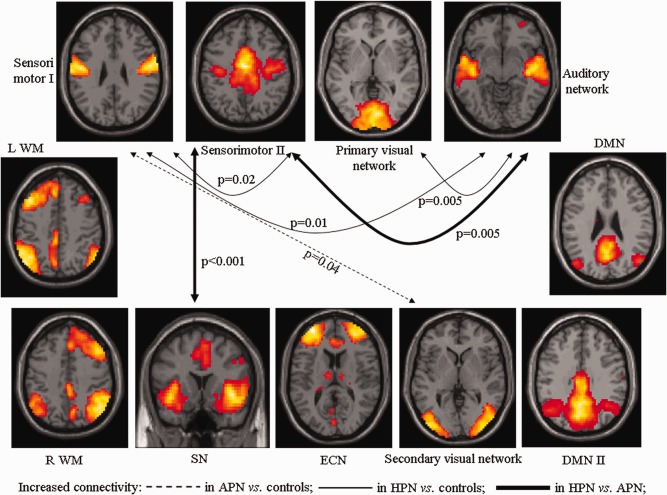
Diagram showing RSNs with a significantly different pair‐wise connectivity among healthy controls, patients with APN and HPN, as assessed using functional network connectivity (FNC) analysis (P < 0.05, false discovery rate corrected). Dotted arrows indicate increased network connectivity in patients with APN versus controls; continuous arrows indicate increased network connectivity in patients with HPN versus controls, bold arrows refer to connections that are increased in HPN not only versus controls, but also versus patients with APN. L, left; R, right; WMN, working memory network; SN, salience network; ECN, executive control network; DMN, default mode network.
Table 3.
Within‐group correlation coefficients (R) among RSNs with potential functional relevance in HC and patients with APN and HPN assessed with FNC analysis
| RSN pair: correlation | HC | P a | APN | P a | HPN | P a | APN vs. HC | HPN vs. HC | HPN vs. APN | |
|---|---|---|---|---|---|---|---|---|---|---|
| Between | And | P b | P b | P b | ||||||
| Sensorimotor I | Sensorimotor II | 0.33 | 0.008 | 0.53 | <0.001 | 0.57 | <0.001 | — | 0.02 | — |
| Primary visual network | — | — | 0.33 | 0.01 | 0.34 | <0.001 | — | — | — | |
| Secondary visual network | 0.25 | 0.02 | 0.48 | <0.001 | — | — | 0.04 | — | — | |
| Auditory network | 0.26 | 0.05 | 0.51 | <0.001 | 0.59 | <0.001 | — | 0.01 | — | |
| SN | 0.27 | 0.003 | 0.30 | 0.006 | 0.42 | <0.001 | — | — | — | |
| L WMN | — | — | −0.21 | 0.02 | −0.27 | <0.001 | — | — | — | |
| Sensorimotor II | Primary visual network | — | — | — | — | 0.24 | 0.01 | — | — | — |
| Secondary visual network | 0.27 | 0.004 | 0.44 | <0.001 | 0.30 | 0.01 | — | — | — | |
| Auditory network | 0.35 | 0.003 | 0.43 | 0.003 | 0.64 | <0.001 | — | 0.005 | 0.05 | |
| ECN | — | — | — | — | 0.22 | 0.04 | — | — | — | |
| SN | 0.30 | <0.001 | 0.31 | 0.01 | 0.52 | <0.001 | 0.92 | <0.001 | 0.03 | |
| R WMN | −0.19 | 0.001 | — | — | −0.07 | — | — | — | — | |
| L WMN | −0.30 | <0.001 | −0.32 | 0.003 | −0.31 | 0.001 | — | — | — | |
| Primary visual network | Secondary visual network | 0.32 | 0.001 | 0.45 | 0.01 | 0.32 | 0.01 | — | — | — |
| Auditory network | — | — | — | — | 0.32 | <0.001 | — | 0.005 | — | |
| DMN | 0.32 | <0.001 | — | — | 0.39 | <0.001 | — | — | — | |
| DMN II | 0.16 | 0.01 | — | — | — | — | — | — | — | |
| ECN | — | — | 0.19 | 0.03 | — | — | — | — | — | |
| Secondary visual network | Auditory network | 0.22 | 0.04 | 0.47 | <0.001 | 0.38 | <0.001 | — | — | — |
| DMN | — | — | 0.23 | 0.01 | 0.22 | 0.01 | — | — | — | |
| L WMN | — | — | −0.16 | 0.02 | — | — | — | — | — | |
| ECN | 0.26 | 0.001 | 0.27 | 0.03 | 0.38 | <0.001 | — | — | — | |
| SN | 0.52 | <0.001 | 0.55 | <0.001 | 0.62 | <0.001 | — | — | — | |
| R WMN | −0.17 | 0.01 | — | — | — | — | — | — | — | |
| L WMN | −0.24 | 0.001 | −0.26 | 0.005 | −0.36 | <0.001 | — | — | — | |
| DMN | DMN II | 0.50 | <0.001 | 0.48 | <0.001 | 0.50 | <0.001 | — | — | — |
| SN | −0.30 | <0.001 | −0.23 | 0.01 | −0.25 | 0.02 | — | — | — | |
| R WMN | — | — | 0.13 | 0.03 | — | — | — | — | — | |
| L WMN | 0.34 | <0.001 | 0.24 | 0.004 | 0.26 | 0.01 | — | — | — | |
| DMN II | SN | −0.19 | 0.01 | — | — | −0.30 | <0.001 | — | — | — |
| R WMN | 0.25 | <0.001 | 0.20 | 0.05 | 0.26 | 0.01 | — | — | — | |
| LWMN | 0.24 | 0.001 | — | — | 0.31 | 0.003 | — | — | — | |
| ECN | SN | 0.37 | <0.001 | 0.37 | 0.001 | 0.53 | <0.001 | — | — | — |
| R WMN | 0.27 | <0.001 | — | — | 0.27 | 0.009 | — | — | — | |
| L WMN | −0.36 | <0.001 | −0.37 | <0.001 | −0.42 | <0.001 | — | — | — | |
| R WMN | L WMN | 0.16 | 0.01 | 0.31 | <0.001 | — | — | — | — | — |
L, left; R, right; DMN, default mode network; SN, salience network; ECN, executive control network; WMN, working memory network.
“—” denotes not‐significant correlations, or not‐significant between‐group difference. Significant between‐group differences in FNC are highlighted in bold. Note that, since coefficients are symmetrical (i.e., given two RSNs A and B, correlation between A and B is the same as that between B and A), they were reported only once.
One‐sample t‐test.
ANOVA (significant P values are surviving false discovery rate correction for multiple comparisons).
Compared to healthy controls, patients with APN showed a higher inter‐network connectivity between the sensorimotor I and the secondary visual RSN. Compared to both healthy controls and patients with APN, patients with HPN showed an increased FNC of the sensorimotor II with the auditory and the SN. Finally, compared to healthy controls, patients with HPN also experienced an increased FNC of the sensorimotor I with the sensorimotor II and auditory networks, as well as between the primary visual and auditory networks.
RS FC Correlation Analysis
Correlations between RSN abnormalities and clinical and conventional MRI findings in the two groups of patients are summarized in Table 4. In APN, significant correlations were found between:
disease duration and increased RS FC of the ECN, L WMN, and DMN;
TNSc score and decreased RS FC of the sensorimotor network II, secondary visual RSN, as well as increased RS FC of the DMNs;
CC area and decreased RS FC of the sensorimotor I network as well as with increased RS left WMN.
Table 4.
Correlations (P < 0.001) between measures of functional connectivity of RSNs with potential functional relevance with clinical and structural MRI findings in patients with APN and HPN
| Acquired peripheral neuropathy | Hereditary peripheral neuropathy | |||||
|---|---|---|---|---|---|---|
| RS network | Regions | r | RS network | Regions | r | |
| Disease duration | ECN | L DLPFC | 0.89 | ECN | R DLPFC | 0.87 |
| DMN | L precuneus | 0.89 | DMN | L precuneus | 0.89 | |
| L WMN | L SFG | 0.92 | — | — | — | |
| — | — | — | Sensorimotor I | Right precuneus | 0.90 | |
| — | — | — | Secondary visual | Right fusiform | −0.84 | |
| TNSc | Sensorimotor II | R precentral gyrus | −0.90 | — | — | — |
| Secondary visual | R fusiform | −0.71 | — | — | — | |
| DMN | L precuneus | 0.89 | — | — | — | |
| DMN II | R precuneus | 0.82 | — | — | — | |
| CC area | Sensorimotor I | R precentral gyrus | 0.86 | — | — | — |
| L WMN | L SFG | −0.74 | — | — | — | |
DMN, default mode network; ECN, executive control network; WMN, working memory network; L, left; R, right; IFG, inferior frontal gyrus; DLPFC, dorsolateral prefrontal cortex; SFG, superior frontal gyrus; TNSc, clinical total neuropathy score; CC, corpus callosum.
In patients with HPN, significant correlations were found between:
disease duration and increased RS FC of the sensorimotor network I, ECN and DMN, as well as with decreased RS FC of the secondary visual RSN.
DISCUSSION
By applying a whole‐brain, unbiased analysis to investigate abnormalities of RSN FC and FNC in patients with PN, we sought to explore brain function following peripheral nervous system damage and whether age at onset of the clinical manifestations has an influence on it. Previous studies focused their analysis on the sensorimotor network and applied active stimulations. One of the main strengths of this study is the use of RS brain fMRI, which allowed us to avoid confounding effects associated to the use of active fMRI paradigms, which are biased by between‐subject differences in task performance.
Overall, we found that, in patients with PN, RS FC patterns are characterized by: (a) the concomitant presence of areas of increased and decreased FC in comparison to healthy controls; and (b) an extent beyond the sensorimotor network and the involvement of other sensory and cognitive networks. Some of these findings differ between patients with HPN and those with APN and are related to disease duration, suggesting that they might reflect an adaptive mechanism, which takes time to occur.
Using ICA, we identified 11 potentially relevant RSNs both in healthy controls and in patients with PN. As expected from previous task studies (e.g., active and passive index finger movements) [Reddy et al., 2001, 2002], both groups of patients showed significant RS FC abnormalities of the sensorimotor network, characterized by a decreased FC of the right precentral gyrus (which was more pronounced in patients with APN), and an increased RS FC of the precuneus. The notion that in patients with PN, the nondominant (right) primary sensorimotor cortex might harbor more severe abnormalities than the dominant (left), probably reflecting long distance connectivity changes, is in line with the results of previous studies in this condition [Reddy et al., 2001, 2002] and complex regional pain syndromes [Maihofner et al., 2007]. These studies found a decreased lateralization index in patients when contrasted to healthy controls. It is worth noting a previous suggestion that a modification of right motor cortex recruitment might have a potentially adaptive role in patients with PN [Reddy et al., 2001, 2002]. However, the correlation we found between decreased FC of this region and the severity of clinical impairment goes against such a hypothesis. The precuneus, which showed an increased FC in both patient groups, has cortico‐cortical connections with several areas of the frontal lobe, which are thought to play a pivotal role in the visual guidance of hand movements (see [Cavanna and Trimble, 2006] for a review of the precuneus functions). Other reciprocal cortical connections, which contribute to the integration of auditory, somatosensory and visual information, involve parieto‐occipital visual areas and the temporo‐parietal‐occipital cortex [Cavanna and Trimble, 2006].
The first important finding of our study is the demonstration that RS FC abnormalities in patients with PN in comparison to healthy controls are not limited to the sensorimotor network, but also involve the visual and auditory networks. Notably, for both these networks, patients with PN not only showed a decreased, but also an increased RS FC compared to healthy controls. In addition, the analysis of FNC showed an increased coherence of function between the sensorimotor and these two networks in patients with PN versus controls, which was more pronounced in patients with HPN. This suggests that an abnormal function of the sensorimotor network (secondary to the peripheral damage) might modulate its connectivity with other sensory modalities. Clearly, one of the main issues with such a finding is whether this phenomenon reflects an adaptive and potentially compensatory mechanism in these patients, or, conversely, a more global CNS dysfunction. The notion that damage to a sensory modality can be associated with an extensive rewiring of cortico‐cortical connections between the affected system and other large‐scale sensory networks has been studied extensively in blind and deaf subjects [Merabet and Pascual‐Leone, 2010]. Indeed, multisensory integration is thought to provide the redundancy of cues that enhances perceptual accuracy and accounts for compensatory behaviors that may follow the loss of sensory modalities [Merabet and Pascual‐Leone, 2010]. In Braille readers blind from the birth, it has been reported that there is visual cortex activation following somatosensory stimulation of the fingers during Braille reading [Sadato et al., 1996], an expansion of the cortical finger representation [Pascual‐Leone and Torres, 1993], and a signal alteration in the auditory cortex consistent with a more efficient processing [Stevens and Weaver, 2009]. Similar findings have been described in deaf people, who showed an activation of auditory cortical areas during tactile, language and visual processing tasks [Merabet and Pascual‐Leone, 2010]. In our previous study of patients with hereditary optic neuropathy [Rocca et al., 2011], we found concomitant abnormalities of RS FC, with regions of increased as well as regions of decreased FC, at the level of the visual and auditory networks, suggesting an interplay between these two networks even in the absence of stimulation. Notably, these abnormalities of function were associated, for the majority of the areas, with abnormalities of structure within the visual and auditory cortices. A recent single‐case study showed extensively increased structural connections between the auditory and secondary somatosensory cortex in the lesioned hemisphere of a patient with acquired auditory‐tactile synesthesia [Ro et al., 2012].
Consistent with findings in sensory deprivation conditions [Merabet and Pascual‐Leone, 2010] showing that the brain is more receptive to change during an early period, we found that abnormalities of RS FC and FNC were prominent in patients with HPN versus those with APN. Such an enhanced plasticity might explain the slower progression of overt clinical deficits in the former group.
The second important result of our analysis is that RS FC modifications in both APN and HPN also extended to several cognition‐related networks, comprising the DMN, ECN, SN, and left WMN. Also in this case, compared to controls, patients mostly had an increased RS FC of several critical nodes of the networks, such as the precuneus/PCC, DLPFC, and SFG. All these high‐order areas are thought to act as sources of the modulatory signals that influence more posterior sensory areas [Macaluso and Driver, 2001]. The correlations we found between the increased RS FC of these regions and disease duration in both groups of patients, as well as with better clinical performance (as quantified by the TNSc) in patients with APN suggest that modifications of connections of “critical” regions might reflect an adaptive mechanism, which takes time to occur and may help to limit the clinical manifestations of peripheral nervous system damage. At present, the effect of PN on cognition‐related networks has not been studied; however, preliminary data support the notion that an altered peripheral sensation might result in deficits in interpreting another person's action [Bosbach et al., 2005]. The analysis of FNC did not detect any modification of connectivity between the sensory and the cognitive RSNs, apart from an increased connectivity between the sensorimotor and the SN in patients with HPN versus the other study groups. The SN, which includes the fronto‐insular circuit and the anterior cingulate cortex, is supposed to contribute to the integration of highly processed sensory stimuli with visceral and autonomic information to guide subjects' behavior [Seeley et al., 2007]. Clearly, the major issue here is whether changes of inter‐network connectivity are compensatory or rather reflect a maladaptive mechanism. Although only longitudinal studies would allow this point to be clarified, the results of a recent study in patients with synesthesia, which showed hyperconnectivity between sensory and cognitive networks in these patients, suggest that there may be a maladaptive process associated with specific clinical deficits [Dovern et al., 2012].
Another intriguing finding of this study is the observation of an abnormal RS FC of the precuneus/PCC that was found across several RSNs (the sensorimotor, DMN and WMN) in patients with PN versus healthy controls. Consistent with its role as a multimodal association area, this area is among the brain regions with the highest FC at rest and during different types of active task [Mesulam, 1998]. In addition, a diffusion spectrum imaging study has shown that, together with other regions of the posterior medial and parietal cortex, it forms a structural core of the human brain, which may have an important role in integrating information across functionally segregated brain regions, and shaping large‐scale brain dynamics [Hagmann et al., 2008]. Therefore, a modification of FC strengths of the precuneus/PCC with several modules of the frontal and temporal lobes might help to explain our network analysis findings. It is important to note that our analysis of correlations showed that this was the only area whose activity had a potentially adaptive role in limiting the clinical consequences of peripheral nervous system damage, as suggested by the correlation with TNSc severity.
We also quantified structural brain damage in our patients by estimating the amount of brain WM hyperintensities and CC area. Consistent with previous reports in patients with Charcot‐Marie‐Tooth disease [Brockmann et al., 2008; Panas et al., 1998] and CIDP, we found aspecific WM lesions in a relatively large proportion of our patients. In patients with CIDP, a pattern of lesion appearance and distribution similar to that detected in patients with multiple sclerosis is well documented [Mendell et al., 1987; Zephir et al., 2008]. However, none of our patients had such a pattern and we think that the observed abnormalities in our patients are likely due to aging (as also suggested by the correlation found between age and T2 LV in patients with APN). Unexpectedly, we found a significant CC atrophy in patients with APN versus healthy controls. Data on CNS atrophy in these patients are scant. A previous study [Laura et al., 2005] described atrophy of the cervical cord in 10 patients with CIDP versus matched healthy controls, while atrophy of the whole brain, or of selected brain regions/structures, has never been investigated. The correlation found between the CC area and brain T2 LV supports secondary degeneration as a potential factor explaining CC atrophy. Further investigations are nonetheless required to confirm these results. Importantly, in patients with APN, CC atrophy was related to decreased RS FC of the right precentral gyrus of the sensorimotor network and increased RS FC of the left SGF of the WMN. This suggests that structural damage to the CC might affect inter‐hemispheric connectivity of the sensorimotor network in these patients, and modulate rewiring of other networks that may play a compensatory role.
Clearly, this study has some limitations. First, is the relatively small sample sizes and the heterogeneous clinical characteristics of the subjects enrolled, which probably prevented us from obtaining significant correlations at a corrected statistical threshold. In addition, this did not allow us to address the influence of disease etiology (e.g., axonal vs. demyelinating) on our findings. Second, it was a cross‐sectional study, and therefore provided us with only a snapshot of the processes at work in our patients, and did not allow to assess whether these processes are dynamic over time. Finally, to address our working hypotheses, we used a purely data‐driven approach to connectivity analysis. This provided a way of selecting future models more empirically, in studies for testing specific hypotheses, using regions‐of‐interest or seed based approaches (e.g., by selecting the precuneus to study FC of the whole brain or of a subset of brain areas of interest).
Acknowledgments
We are grateful to Dr. Mark A. Horsfield (Medical Physics Group, Department of Cardiovascular Sciences, University of Leicester, Leicester, UK) for reviewing this manuscript and his precious suggestions.
REFERENCES
- Ashburner J (2007): A fast diffeomorphic image registration algorithm. Neuroimage 38:95–113. [DOI] [PubMed] [Google Scholar]
- Bell AJ, Sejnowski TJ (1995): An information‐maximization approach to blind separation and blind deconvolution. Neural Comput 7:1129–1159. [DOI] [PubMed] [Google Scholar]
- Bosbach S, Cole J, Prinz W, Knoblich G (2005): Inferring another's expectation from action: The role of peripheral sensation. Nat Neurosci 8:1295–1297. [DOI] [PubMed] [Google Scholar]
- Brockmann K, Dreha‐Kulaczewski S, Dechent P, Bonnemann C, Helms G, Kyllerman M, Bruck W, Frahm J, Huehne K, Gartner J, Rautentrauss B (2008): Cerebral involvement in axonal Charcot‐Marie‐Tooth neuropathy caused by mitofusin2 mutations. J Neurol 255:1049–1058. [DOI] [PubMed] [Google Scholar]
- Calhoun V, Adali T, Kraut M, Pearlson G (2000): A weighted least‐squares algorithm for estimation and visualization of relative latencies in event‐related functional MRI. Magn Reson Med 44:947–954. [DOI] [PubMed] [Google Scholar]
- Calhoun VD, Adali T, Pearlson GD, Pekar JJ (2001): A method for making group inferences from functional MRI data using independent component analysis. Hum Brain Mapp 14:140–151. [DOI] [PMC free article] [PubMed] [Google Scholar]
- Calhoun VD, Kiehl KA, Liddle PF, Pearlson GD (2004): Aberrant localization of synchronous hemodynamic activity in auditory cortex reliably characterizes schizophrenia. Biol Psychiatry 55:842–849. [DOI] [PMC free article] [PubMed] [Google Scholar]
- Casanova R, Srikanth R, Baer A, Laurienti PJ, Burdette JH, Hayasaka S, Flowers L, Wood F, Maldjian JA (2007): Biological parametric mapping: A statistical toolbox for multimodality brain image analysis. Neuroimage 34:137–143. [DOI] [PMC free article] [PubMed] [Google Scholar]
- Cavaletti G, Jann S, Pace A, Plasmati R, Siciliano G, Briani C, Cocito D, Padua L, Ghiglione E, Manicone M, Giussani G, Italian NETox Group (2006): Multi‐center assessment of the Total Neuropathy Score for chemotherapy‐induced peripheral neurotoxicity. J Peripher Nerv Syst 11:135–141. [DOI] [PubMed] [Google Scholar]
- Cavanna AE, Trimble MR (2006): The precuneus: A review of its functional anatomy and behavioural correlates. Brain 129:564–583. [DOI] [PubMed] [Google Scholar]
- Chen R, Anastakis DJ, Haywood CT, Mikulis DJ, Manktelow RT (2003): Plasticity of the human motor system following muscle reconstruction: A magnetic stimulation and functional magnetic resonance imaging study. Clin Neurophysiol 114:2434–2446. [DOI] [PubMed] [Google Scholar]
- Damoiseaux JS, Rombouts SA, Barkhof F, Scheltens P, Stam CJ, Smith SM, Beckmann CF (2006): Consistent resting‐state networks across healthy subjects. Proc Natl Acad Sci USA 103:13848–13853. [DOI] [PMC free article] [PubMed] [Google Scholar]
- Dettmers C, Adler T, Rzanny R, van Schayck R, Gaser C, Weiss T, Miltner WH, Bruckner L, Weiller C (2001): Increased excitability in the primary motor cortex and supplementary motor area in patients with phantom limb pain after upper limb amputation. Neurosci Lett 307:109–112. [DOI] [PubMed] [Google Scholar]
- Dovern A, Fink GR, Fromme AC, Wohlschlager AM, Weiss PH, Riedl V (2012): Intrinsic network connectivity reflects consistency of synesthetic experiences. J Neurosci 32:7614–7621. [DOI] [PMC free article] [PubMed] [Google Scholar]
- Erhardt EB, Rachakonda S, Bedrick EJ, Allen EA, Adali T, Calhoun VD (2011): Comparison of multi‐subject ICA methods for analysis of fMRI data. Hum Brain Mapp 32:2075–2095. [DOI] [PMC free article] [PubMed] [Google Scholar]
- Franco AR, Pritchard A, Calhoun VD, Mayer AR (2009): Interrater and intermethod reliability of default mode network selection. Hum Brain Mapp 30:2293–2303. [DOI] [PMC free article] [PubMed] [Google Scholar]
- Good CD, Johnsrude IS, Ashburner J, Henson RN, Friston KJ, Frackowiak RS (2001): A voxel‐based morphometric study of ageing in 465 normal adult human brains. Neuroimage 14:21–36. [DOI] [PubMed] [Google Scholar]
- Hagmann P, Cammoun L, Gigandet X, Meuli R, Honey CJ, Wedeen VJ, Sporns O (2008): Mapping the structural core of human cerebral cortex. PLoS Biol 6:e159. [DOI] [PMC free article] [PubMed] [Google Scholar]
- Herschkowitz N (2000): Neurological bases of behavioral development in infancy. Brain Dev 22:411–416. [DOI] [PubMed] [Google Scholar]
- Herschkowitz N, Kagan J, Zilles K (1997): Neurobiological bases of behavioral development in the first year. Neuropediatrics 28:296–306. [DOI] [PubMed] [Google Scholar]
- Himberg J, Hyvarinen A, Esposito F (2004): Validating the independent components of neuroimaging time series via clustering and visualization. Neuroimage 22:1214–1222. [DOI] [PubMed] [Google Scholar]
- Jafri MJ, Pearlson GD, Stevens M, Calhoun VD (2008): A method for functional network connectivity among spatially independent resting‐state components in schizophrenia. Neuroimage 39:1666–1681. [DOI] [PMC free article] [PubMed] [Google Scholar]
- Laura M, Leong W, Murray NM, Ingle G, Miszkiel KA, Altmann DR, Miller DH, Reilly MM (2005): Chronic inflammatory demyelinating polyradiculoneuropathy: MRI study of brain and spinal cord. Neurology 64:914–916. [DOI] [PubMed] [Google Scholar]
- Leclerc C, Saint‐Amour D, Lavoie ME, Lassonde M, Lepore F (2000): Brain functional reorganization in early blind humans revealed by auditory event‐related potentials. Neuroreport 11:545–550. [DOI] [PubMed] [Google Scholar]
- Macaluso E, Driver J (2001): Spatial attention and crossmodal interactions between vision and touch. Neuropsychologia 39:1304–1316. [DOI] [PubMed] [Google Scholar]
- Maihofner C, Baron R, DeCol R, Binder A, Birklein F, Deuschl G, Handwerker HO, Schattschneider J (2007): The motor system shows adaptive changes in complex regional pain syndrome. Brain 130:2671–2687. [DOI] [PubMed] [Google Scholar]
- Maldjian JA, Laurienti PJ, Kraft RA, Burdette JH (2003): An automated method for neuroanatomic and cytoarchitectonic atlas‐based interrogation of fMRI data sets. Neuroimage 19:1233–1239. [DOI] [PubMed] [Google Scholar]
- Mendell JR, Kolkin S, Kissel JT, Weiss KL, Chakeres DW, Rammohan KW (1987): Evidence for central nervous system demyelination in chronic inflammatory demyelinating polyradiculoneuropathy. Neurology 37:1291–1294. [DOI] [PubMed] [Google Scholar]
- Merabet LB, Pascual‐Leone A (2010): Neural reorganization following sensory loss: The opportunity of change. Nat Rev Neurosci 11:44–52. [DOI] [PMC free article] [PubMed] [Google Scholar]
- Mesulam MM (1998): From sensation to cognition. Brain 121(Part 6):1013–1052. [DOI] [PubMed] [Google Scholar]
- Panas M, Karadimas C, Avramopoulos D, Vassilopoulos D (1998): Central nervous system involvement in four patients with Charcot‐Marie‐Tooth disease with connexin 32 extracellular mutations. J Neurol Neurosurg Psychiatry 65:947–948. [DOI] [PMC free article] [PubMed] [Google Scholar]
- Pareyson D, Marchesi C (2009): Diagnosis, natural history, and management of Charcot‐Marie‐Tooth disease. Lancet Neurol 8:654–667. [DOI] [PubMed] [Google Scholar]
- Pascual‐Leone A, Torres F (1993): Plasticity of the sensorimotor cortex representation of the reading finger in Braille readers. Brain 116(Part 1):39–52. [DOI] [PubMed] [Google Scholar]
- Poirier C, Collignon O, Scheiber C, Renier L, Vanlierde A, Tranduy D, Veraart C, De Volder AG (2006): Auditory motion perception activates visual motion areas in early blind subjects. Neuroimage 31:279–285. [DOI] [PubMed] [Google Scholar]
- Reddy H, Floyer A, Donaghy M, Matthews PM (2001): Altered cortical activation with finger movement after peripheral denervation: Comparison of active and passive tasks. Exp Brain Res 138:484–491. [DOI] [PubMed] [Google Scholar]
- Reddy H, Bendahan D, Lee MA, Johansen‐Berg H, Donaghy M, Hilton‐Jones D, Matthews PM (2002): An expanded cortical representation for hand movement after peripheral motor denervation. J Neurol Neurosurg Psychiatry 72:203–210. [DOI] [PMC free article] [PubMed] [Google Scholar]
- Ro T, Ellmore TM, Beauchamp MS (2012): A neural link between feeling and hearing. Cereb Cortex (in press). doi: 10.1093/cercor/bhs166. [DOI] [PMC free article] [PubMed] [Google Scholar]
- Rocca MA, Valsasina P, Pagani E, Bianchi‐Marzoli S, Milesi J, Falini A, Comi G, Filippi M (2011): Extra‐visual functional and structural connection abnormalities in Leber's hereditary optic neuropathy. PLoS One 6:e17081. [DOI] [PMC free article] [PubMed] [Google Scholar]
- Roricht S, Machetanz J, Irlbacher K, Niehaus L, Biemer E, Meyer BU (2001): Reorganization of human motor cortex after hand replantation. Ann Neurol 50:240–249. [DOI] [PubMed] [Google Scholar]
- Sadato N, Pascual‐Leone A, Grafman J, Ibanez V, Deiber MP, Dold G, Hallett M (1996): Activation of the primary visual cortex by Braille reading in blind subjects. Nature 380:526–528. [DOI] [PubMed] [Google Scholar]
- Seeley WW, Menon V, Schatzberg AF, Keller J, Glover GH, Kenna H, Reiss AL, Greicius MD (2007): Dissociable intrinsic connectivity networks for salience processing and executive control. J Neurosci 27:2349–2356. [DOI] [PMC free article] [PubMed] [Google Scholar]
- Smith SM, Zhang Y, Jenkinson M, Chen J, Matthews PM, Federico A, De Stefano N (2002): Accurate, robust, and automated longitudinal and cross‐sectional brain change analysis. Neuroimage 17:479–489. [DOI] [PubMed] [Google Scholar]
- Smith SM, Fox PT, Miller KL, Glahn DC, Fox PM, Mackay CE, Filippini N, Watkins KE, Toro R, Laird AR, Beckmann CF (2009): Correspondence of the brain's functional architecture during activation and rest. Proc Natl Acad Sci USA 106:13040–13045. [DOI] [PMC free article] [PubMed] [Google Scholar]
- Stevens AA, Weaver KE (2009): Functional characteristics of auditory cortex in the blind. Behav Brain Res 196:134–138. [DOI] [PMC free article] [PubMed] [Google Scholar]
- Zephir H, Stojkovic T, Latour P, Lacour A, de Seze J, Outteryck O, Maurage CA, Monpeurt C, Chatelet P, Ovelacq E, Vermersch P (2008): Relapsing demyelinating disease affecting both the central and peripheral nervous systems. J Neurol Neurosurg Psychiatry 79:1032–1039. [DOI] [PubMed] [Google Scholar]