

Abstract
Habituation is a basic process of learning in which repeated exposure to a sensory stimulus leads to a decrease in the strength of neuronal activations and behavioral responses. In addition to increases in neuronal activity, sensory stimuli can also lead to decreases in neuronal activity. Until now, the effects of habituation on stimulus‐induced neuronal deactivations have not been investigated. We performed functional magnetic resonance imaging in 30 healthy subjects during repetitive unilateral somatosensory stimulation and combined this analysis with a psychophysiological examination of changes in the perception threshold. Consistent with the literature, we found a time‐dependent decrease of the positive blood oxygenation level‐dependent (BOLD) response (indicative of habituation) in the primary somatosensory cortex (SI) contralateral to the stimulus. In contrast, the negative BOLD response (NBR) in the ipsilateral SI did not show a decrease in amplitude; instead, an increase in amplitude was found, i.e., a stronger NBR (increased response). The increased NBR was associated with an increased perception threshold of the nonstimulated hand. These findings suggest that habituation is not primarily characterized by a decrease in the neuronal response to repeated stimuli but rather a widespread change in the balance between excitatory and inhibitory effects that favors inhibitory effects. Hum Brain Mapp 35:152–160, 2014. © 2012 Wiley‐Periodicals, Inc.
Keywords: fMRI, BOLD, somatosensory cortex, inhibition, habituation
INTRODUCTION
Habituation is a basic process of learning in which repeated exposure to a stimulus leads to decreased behavioral and neuronal responses [Thompson and Spencer, 1966; Thompson, 2009]. The process underlying habituation does not require conscious motivation or awareness and has been demonstrated in most animals down to the protozoan [Thompson and Spencer, 1966; Wood, 1988]. The principal functional purpose of habituation is to distinguish meaningful information from background stimuli, thereby protecting cortical areas from being flooded with irrelevant information.
Repetition‐related reduction in neural activity on a time scale of minutes has been demonstrated in the auditory, visual, and somatosensory networks using a variety of techniques [Bingel et al., 2007; Mobascher et al., 2010; Mutschler et al., 2010; Thompson, 2009]. Functional magnetic resonance imaging (fMRI) is particularly suited to investigate changes in neuronal activity on a time scale of minutes by measuring the blood oxygenation level‐dependent (BOLD) signal. The BOLD signal is related to the underlying neuronal activity, although the precise nature of this neurovascular coupling remains unknown [Logothetis and Pfeuffer, 2004; Logothetis et al., 2001].
Using this method, there have been some studies that have investigated habituation in the somatosensory network, demonstrating a decrease in the positive BOLD response to repeated somatosensory stimuli in multiple cortical brain areas, including the primary somatosensory cortex (SI) [Mobascher et al., 2010]. The SI is the first cortical region involved in the processing of somatosensory information. It is located in the postcentral gyrus of the parietal lobe and comprises four different cytoarchitectonic subdivisions: areas 3A, 3B, 1, and 2 [Brodmann, 1909; Vogt and Vogt, 1919]. The output of this region serves as input for subsequent analyses by higher order somatosensory areas. This dependency renders the information processing by higher order brain areas particularly susceptible to habituation‐associated modulation of SI output.
Recent studies have demonstrated that, in addition to the contralateral SI, the ipsilateral SI is also involved in the processing of somatosensory information [Hlushchuk and Hari, 2006; Iwamura et al., 1994; Kastrup et al., 2008; Lipton et al., 2006; Nihashi et al., 2005]. The posterior part of the ipsilateral SI (area 2) exhibits neuronal excitation [Iwamura et al., 1994] and a positive BOLD response [Nihashi et al., 2005], whereas areas 3b and 1 are dominated by inhibition [Lipton et al., 2006] and a negative BOLD response (NBR) [Hlushchuk and Hari, 2006; Kastrup et al., 2008]. We recently demonstrated that the NBR observed in the ipsilateral somatosensory cortex following stimulation of the median nerve is associated with elevation of the sensory threshold, suggesting an underlying inhibition or disfacilitation [Kastrup et al., 2008]. Although the physiological basis of the NBR has not been fully characterized, animal experiments have revealed a tight coupling between NBR s and decreases in neuronal activity [Shmuel et al., 2006] or enhanced inhibition [Devor et al., 2007] within sensory systems.
Although the effects of habituation on neuronal activation have been thoroughly investigated in animals, the effects of habituation on stimulus‐induced neuronal deactivation or the NBR have not been considered.
From the known effects of habituation (decreased neuronal response to repetitive stimuli), one would hypothesize an amplitude decrease of the NBR. Because of the tight correlation between the NBR in the SI and the contralateral perception threshold [Kastrup et al., 2008], a decreased NBR should result in a decreased perception threshold (higher sensitivity). From a behavioral perspective, one would expect an increased perception threshold, which should be associated with an amplitude increase of the NBR (which is in conflict with the definition of habituation). However, because the physiological basis of habituation within complex neuronal networks is incompletely understood, it remains unknown whether the effect of habituation is transferable from activation to deactivation. Either way, the solution to this question may provide information about the nature of habituation and the NBR.
In the current study, we combined fMRI with psychophysiological approaches to analyze changes in the strength of the NBR response over time and the corresponding changes in somatosensory perception induced by repetitive electrical stimulation of the median nerve in 30 healthy subjects.
MATERIALS AND METHODS
Subjects
This study was comprised of 30 healthy volunteers (mean age 25.3 ± 4.4 years (± refers to standard deviation), range 21–34 years; 16 females, 14 males) with no history of neurological or psychiatric disease. All subjects were right‐handed according to the Edinburgh Handedness Inventory. All experiments were approved by the local ethics committee, and all subjects provided written informed consent in accordance with the Declaration of Helsinki.
Stimulation Procedures
An electrical median nerve stimulus was used to investigate time‐dependent activity changes within various brain areas. The stimulus was applied unilaterally at the right wrist and consisted of 40 Hz monophasic square wave pulses (200 μs in duration) generated by a clinical neurostimulator (Constant Current Stimulator model DS7A, Digitimer, Hertfordshire, UK). Electrode paste was applied to increase electrical conductivity between the electrode and the skin. Stimulus intensities were determined individually for each subject. First, the motor threshold for thumb movement was determined. At this current intensity, subjects reported no unpleasant or painful sensations. We then reduced the current by 20% to exclude any motor response. All stimuli were presented in a block design (30 s on/30 s off), and a total of 16 stimulation blocks were delivered during the acquisition of 330 scans. Some subjects received a prolonged stimulation period (up to 24 stimuli during 490 scans), but only the first 330 scans were entered into the analysis. The timing of stimulus presentation was synchronized with MR image acquisition using the MRIs trigger signal.
Functional MRI Recordings
A 3.0‐T MR scanner (Trio, Siemens, Erlangen, Germany) was used to obtain 330 echo‐planar T * 2 weighted image volumes (EPI). The first three EPI volumes were discarded due to equilibration effects. Each functional image volume comprised 40 transaxial slices, including the entire cerebrum and cerebellum (voxel size = 3 mm × 3 mm × 3 mm, repetition time = 3 s, echo time = 35 ms). After acquisition of functional images, high‐resolution T 1‐weighted structural images with a voxel size of 1 mm × 1 mm × 1 mm were recorded and used for precise anatomical localization.
Data Analysis
Data analysis was performed using a workstation using MATLAB (Mathworks, Natick, MA) with the “gift” toolbox (http://icatb.sourceforge.net/) and SPM8 software (Wellcome Department of Cognitive Neurology, London, UK; http://www.fil.ion.ucl.ac.uk/spm). For each subject, all images were realigned to the first volume using six parameter rigid‐body transformations to correct for motion artifacts. The images were co‐registered with the subject's corresponding anatomical (T 1‐weighted) images, normalized to the Montreal Neurological Institute (MNI) standard brain to report MNI coordinates, and smoothed using a 6‐mm full‐width‐at‐half‐maximum Gaussian kernel.
Statistical analysis was performed by an independent component analysis (ICA) with the preprocessed images (realigned, coregistered, normalized, and smoothed). The number of independent components (ICs) were estimated for each subject and ranged from 26 to 35. To ensure that all the ICs were present in each individual, we used the minimum number of components that were determined in a single dataset (26). These 26 components were estimated for each experiment using the infomax algorithm implemented in the “gift” toolbox [Calhoun et al., 2001b, 2008]. The chosen number of components provides a reasonable trade‐off between preserving relevant variance in the data while easing the burden of interpretation [Calhoun et al., 2001a].
The independently obtained components were converted to T‐maps. Because we were interested in task‐related changes in the somatosensory cortex, we used this knowledge for a combined a priori temporal and spatial approach for the selection of ICs. The components were ranked by the correlation of their associated time courses with the presumed hemodynamic responses. The five ICs with the closest correlation were overlaid onto the co‐registered, T 1‐weighted 3D brain volumes from each subject and visually inspected. Additionally, the anatomical localizations of activations were mapped by using the anatomical toolbox [Eickhoff et al., 2005, 2006] (http://www.fz-juelich.de/ime/spm_anatomy_toolbox). Components whose spatial location at least partially overlapped with the SI in more than half of the subjects were selected for group analysis. According to these criteria, we selected two ICs. Next, a voxel‐wise random‐effects analysis was performed on the component image by entering the single subject component images into a one‐sample t‐test. The resulting group statistical maps were thresholded at P < 0.05 after correction for multiple comparisons (Bonferroni correction).
The same data were additionally analyzed by using a general linear model to obtain statistical parametric maps by performing multiple regression analysis. Statistical parametric maps for positive and negative T‐contrasts were calculated for the main effect of somatosensory stimulation. Functional MRI signal time courses were high‐pass filtered at 1/128 Hz to remove low frequency confounds; serial correlations were handled with an AR(1) model. Each experimental condition was modeled using a boxcar input vector convolved with the canonical hemodynamic response function. The individual maps were used to perform a random effect analysis to obtain consistent group activation patterns. The resulting group statistical maps were thresholded at P < 0.05 after correction for multiple comparisons (Bonferroni correction).
Estimation of Time‐Dependent Decreases in the BOLD Response
We were interested in the strength of the BOLD signal responses in activated areas of the somatosensory network. The anatomical localization of each area was determined with the anatomical toolbox [Eickhoff et al., 2005, 2006]. We were particularly interested in the subdivisions of the SI, namely BA3b, BA1, and BA2. The spatial locations of these subdivisions were determined at a probability of at least 80%. The 30 most significant voxels from the ICA group analysis within this area were selected, and thereafter, the time course of these voxels was extracted from the normalized (but unsmoothed) data.
These time courses were then used to calculate the percent change in amplitude of the BOLD response for each of the 16 stimulation blocks. To account for baseline drifts, all time courses were subtracted by the last value before the start of the specific stimulation block (ensuring that each hemodynamic response started with a 0% signal change). These time courses were then used to calculate the mean amplitude of the BOLD response for each of the 16 stimulation blocks by averaging the amplitude between the two maxima of the hemodynamic response (mean of scans 2–13 during each stimulation block). The 16 stimulation blocks/amplitudes were then divided into two parts composed of stimulus blocks 1–8 and 9–16. The averaged amplitudes during both parts of the experiment (mean of amplitudes 1–8 and mean of amplitudes 9–16) of each subject were then entered in a paired t‐test to determine significant differences.
Psychophysiological Experiments
We were interested in changes in somatosensory perception contralateral to and induced by repetitive electrical stimulation of the right median nerve. To measure such changes quantitatively, we used the current perception threshold (CPT), which is the minimum amount of transcutaneously applied current that an individual consistently perceives as evoking sensation. This approach has been recently proposed as a suitable method for investigating sensory function [Blankenburg et al., 2003; Davey et al., 2001; Kastrup et al., 2008; Yamashita et al., 2002]. The assessment of CPT contralateral to median nerve stimulation does not significantly alter the ipsilateral NBR [Kastrup et al., 2008; Klingner et al., 2010]. Therefore, psychophysiological experiments were performed in separate sessions (different days) using the same subjects that participated in the fMRI experiment. Monophasic, square wave current pulses (40 Hz) were delivered via ring electrodes to the tip of the left index finger (anode‐cathode separation ∼1 cm). At the beginning of each CPT measurement, the current was slowly increased until the subject reported feeling a sensation; current pulses were then turned off. This assessment of CPT was performed during concomitant electrical stimulation of the right median nerve using stimulation equipment and protocols identical to those of the fMRI study. The stimulation paradigm for the right median nerve consisted of a 40 Hz stimulus lasting 30 s followed by 30 s at rest. CPT was measured during each of the 16 stimulation periods and during the rest period following the stimulation. An additional control experiment was performed to ensure that the measured effects were due to the stimulation of the median nerve and not dependent on other factors. This control experiment was performed as described above, except no median nerve stimulation of the right side was performed.
RESULTS
Positive and Negative BOLD Responses
Electrical stimulation of the right median nerve evoked highly significant results (P < 0.05, familywise error corrected) in the random effect group analyses by using both ICA and the GLM (Table 1, Fig. 1). The ICA analysis revealed different ICs in all subjects for the left (IC‐1) and the right SI (IC‐2). The strongest positive temporal correlation to the stimulus presentation was revealed in the left SI (BA3b, BA1, and BA2), whereas the right SI component displayed the strongest negative temporal correlation to the stimulus presentation. In addition to the left SI (BA3b, BA1, and BA2), IC‐1 also included activations in the left thalamus, the left posterior parietal cortex (PPC), the left secondary somatosensory cortex (SII), the right cerebellum, and the left BA24/31 (Table 1; Fig. 1). The right SI‐IC (IC‐2) included the right SI (BA3b, BA1, and BA2), the bilateral PPC, the left cerebellum, the right SII, and the right BA31 (Table 1; Fig. 1). Additional analysis using the general linear model revealed comparable results for both primary somatosensory cortices. We found a positive BOLD response in the left SI and a NBR in the right SI. In contrast to the ICA analysis, we found no significant BOLD response in the right BA2 (Table 1; Fig. 1).
Table 1.
Cortical activation in response to right sided median nerve stimulation—Estimated by independent component analysis (GIFT) and by the general linear model (SPM)
| Brain region | Independent component analysis | General linear model | ||||||||
|---|---|---|---|---|---|---|---|---|---|---|
| x | y | z | t‐Value | IC | x | y | z | t‐Value | Contrast | |
| SI c | −51 | −27 | 48 | 24.99 | 1 | −51 | −19 | 49 | 22.02 | 1 |
| SI i | 48 | −30 | 54 | 27.84 | 2 | 36 | −19 | 55 | 17.3 | −1 |
| SII c | −45 | −24 | 18 | 12.14 | 1 | −51 | −22 | 16 | 17.19 | 1 |
| SII i | 48 | −24 | 12 | 7.87 | 2 | 60 | −19 | 19 | 15.36 | 1 |
| Thalamus c | −15 | −18 | 0 | 9.46 | 1 | −15 | −22 | −3 | 7.76 | |
| Thalamus i | 18 | −16 | −3 | 7.75 | −1 | |||||
| PPC c | −39 | −45 | 57 | 14.48 | 2 | |||||
| PPC i | 36 | −45 | 60 | 22.14 | 2 | |||||
| PCC c (BA 31) | −6 | −24 | 48 | 12.44 | 1 | |||||
| vACC c (BA 24) | −3 | −3 | 48 | 11.05 | 1 | |||||
| PCC i (BA 31) | 9 | −24 | 51 | 15.01 | 2 | |||||
| Cerebellum c | −15 | −48 | −27 | 12.60 | 2 | −42 | −46 | −35 | 8.66 | −1 |
| Cerebellum i | 18 | −51 | −27 | 13.61 | 1 | 27 | −55 | −26 | 10.20 | 1 |
MNI coordinates of the activation maxima with corresponding t‐values for right‐sided median nerve stimulation. An contrast of 1 corresponds a positive deflection of the BOLD signal (positive BOLD response), whereas a contrast of −1 corresponds to a negative deflection of the BOLD signal (negative BOLD response). The table corresponds to Figure 1. SI: primary somatosensory cortex; SII: secondary somatosensory cortex; PPC: posterior parietal cortex; PCC: posterior cingular cortex; vACC: ventral anteriorcingulate cortex; c: contralateral, i: ipsilateral.
Figure 1.
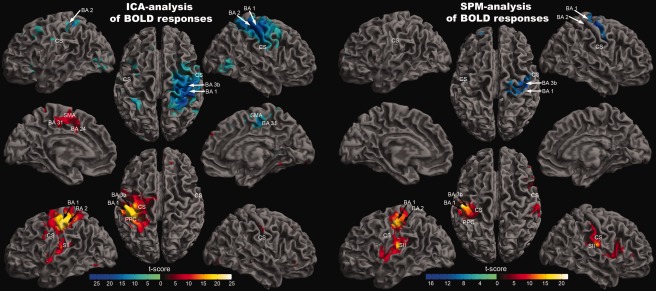
Random effect group analysis (n = 30). Activations (P < 0.05, familywise error corrected) in response to blocked (30 s) right median nerve stimulation are shown superimposed on a slightly inflated brain. The results on the left side were acquired by the use of independent component analysis (GIFT‐toolbox), whereas the results on the right side were acquired using a general linear model (SPM). On the left side of the image, yellow‐red encodes independent component 1, which is positively correlated with a predicted stimulus‐associated positive BOLD response, whereas blue encodes independent component 2, which is negatively correlated with the predicted BOLD response. On the right side of the image (SPM‐analysis), yellow‐red encodes positive deflections of the BOLD response, whereas blue encodes negative deflections. The MNI coordinates and t‐values corresponding to this figure are presented in Table 1.
Area‐Specific Habituation of the BOLD Response
Time courses of the BOLD responses were divided into two parts covering stimulation blocks 1–8 and 9–16. The mean amplitude of the BOLD response for both blocks was estimated for each subject in BA3b, BA1, and BA2. We found a lower mean amplitude during the second part of the experiment compared with the first in all areas. This amplitude decrease was tested for statistical significance by a paired t‐test across all subjects. We found a significant amplitude decrease in the right BA1 (P = 0.007) and bilateral BA2 (left: P = 0.00027; right: P = 0.0015), whereas the left BA1 (P = 0.048) and the bilateral BA3b (left: P = 0.053; right P = 0.066) did not reach statistical significance after correction for multiple comparisons (Fig. 2). The time course of the amplitude decrease is shown with a higher temporal resolution for the entire SI of both hemispheres (Fig. 3).
Figure 2.
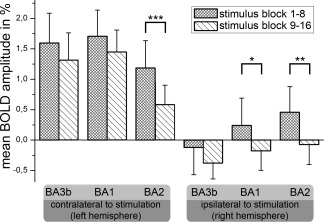
Mean amplitudes of the BOLD response measured in % signal change (y‐axis). The different areas analyzed are shown on the x‐axis (6 areas). Areas of the left hemisphere (contralateral to stimulation) are shown on the left side, whereas areas of the right hemisphere are shown on the right side (ipsilateral to stimulation). The mean BOLD amplitude during median nerve stimulation was estimated for both parts of the experiment (stimulus block 1–8 [squared] vs. 9–16 [hatched]). The error bars represent inter‐subject standard deviation. To assess statistically significant differences in the BOLD amplitude decreases between different brain areas, paired t‐tests were performed (*P < 0.05; **P < 0.005; ***P < 0.0005).
Figure 3.
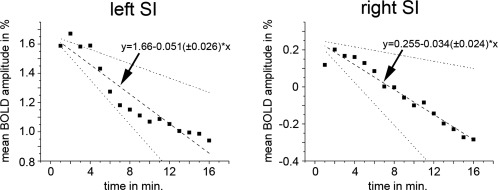
Time course of the mean amplitudes of the BOLD response of the left primary somatosensory cortex (left side) and of the right somatosensory cortex (right side) measured in % signal change (y‐axis). The BOLD amplitude during median nerve stimulation was estimated for each stimulation block and each subject in the entire activated/deactivated SI. These individual amplitude time courses were used for a linear regression analysis. The results along with the standard deviation are shown.
Psychophysiological Result/Dependence of CPT Changes on Experiment Duration
The dependence of quantitative somatosensory function on experiment duration was analyzed by determining the perceptual threshold to electrical stimulation of the left index finger (CPT) during right median nerve stimulation (Fig. 4). We found a significant increase in the CPT over time with a slope of 0.64 (±0.54) %/stimulation block (P = 0.00014). We further tested for significant changes in the CPT between the first and second part of the experiment across all subjects (paired t‐test between the individual mean in CPT during stimulation block 1–8 vs. stimulation block 9–16). We found a significant increase in the CPT between the first and second part of the experiment (P = 0.0015). A control experiment was performed to test for changes of the CPT without right‐sided median nerve stimulation. This additional experiment revealed no significant changes of the CPT over time (P = 0.64, Fig. 4).
Figure 4.
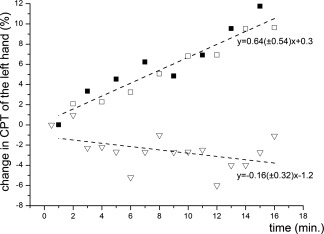
Change in CPT of the left hand. The stimulation of the right median nerve was performed as in the fMRI experiment. Additionally, the CPT of the left hand was measured during each of the 16 stimulation periods (black squares) and during the rest period following the stimulation (nonfilled squares). The triangles designate the CPT of the left hand during the control experiment (measuring the CPT of the left hand without stimulation of the right median nerve). The duration of each experiment was 16 min.
DISCUSSION
In this study, we investigated the extent and time course of habituation due to repetitive, unilateral stimulation of the median nerve, with a special focus on the NBR. We combined measuring changes in the BOLD response by fMRI with the behavioral testing of somatosensory function.
Electrical median nerve stimulation, as used in this experiment, produces robust stimulus‐related changes of the BOLD response in bilateral SI. The left and the right SI were represented by different ICs. The left SI (contralateral to stimulation) showed a positive BOLD response, which is in line with other fMRI studies [Deuchert et al., 2002; Kampe et al., 2000; Nihashi et al., 2005; Ruben et al., 2006]. A habituation of the BOLD response in the contralateral SI was recently reported during repetitive painful stimulation [Mobascher et al., 2010]. The current study shows that this result is transferable to nonpainful somatosensory stimuli. Recent animal studies have shown that the strength of the BOLD response correlates with the level of neuronal postsynaptic activity reflected in local field potentials [Logothetis et al., 2001; Mukamel et al., 2005; Niessing et al., 2005]. This suggests that a decrease in the BOLD response primarily reflects a decreased neuronal input to the corresponding brain area and decreased local processing (for review, see [Logothetis and Wandell, 2004]). Analysis of the subareas of the left SI demonstrated a decreased BOLD response in the contralateral BA2, whereas BA1 and BA3b did not show significant habituation. BA1 and BA3b are presumed to process and encode the type, location, duration, and intensity of somatosensory inputs from the contralateral body side [Schnitzler and Ploner, 2000; Zhang et al., 2007]. In particular, the encoding of stimulus intensity can be measured by fMRI in the contralateral SI. More intense somatosensory stimuli are followed by increased BOLD signal amplitudes in contralateral areas 3b and 1 [Backes et al., 2000; Klingner et al., 2010; Zhang et al., 2007]. This indicates that the measured habituation of BA1 and BA3b reflects a reduced encoding of the stimulation strength. Moreover, this result is consistent with the view that habituation increases along the processing stream to protect higher brain areas from being flooded with irrelevant information.
The SI ipsilateral to somatosensory stimulation was covered by a different IC than the contralateral SI. In agreement with previous fMRI studies [Nihashi et al., 2005], we found a positive BOLD response in BA2 (at least in the first part of the experiment), whereas BA3b and BA1 were dominated by a negative deflection of the BOLD response [Hlushchuk and Hari, 2006; Kastrup et al., 2008; Klingner et al., 2010, 2011b]. The NBR in the ipsilateral BA1 showed an amplitude increase over time (i.e., it became more strongly negative), which is one of the main findings of the current study. There is increasing evidence from animal experiments that negative deflections of the BOLD response are tightly correlated to decreases in neuronal activity, at least in sensory systems [Boorman et al., 2010; Devor et al., 2007; Shmuel et al., 2006; Yin et al., 2011]. This suggests that habituation in the ipsilateral BA1 corresponds to decreasing neuronal activity due to the repetition of somatosensory stimulation. In the case of activations, such a decrease corresponds well with the definition of habituation. However, because we investigated the NBR, the stimulus associated with decreasing activity corresponds to an increasing neuronal response (more strongly negative) during the repetition of the stimulus. This increasing response is in conflict with the assumed physiological basis of habituation (decreasing response to repetitive stimuli). An increasing response to repetitive stimulation is often referred to as sensitization. However, the underlying mechanism of sensitization is assumed to be different from habituation [Mendell, 1966; Woolf and Salter, 2000]. The body area that is represented by the deactivated BA1 (left hand) clearly showed the habituation (increase) of the perception threshold in the additional psychophysiological experiment. This result is in agreement with a previous study demonstrating a positive correlation between the strength of the NBR and the decrease of the perception threshold of the contralateral hand [Kastrup et al., 2008]. It is thought that the NBR and its associated decreased neuronal activity [Boorman et al., 2010; Shmuel et al., 2006; Yin et al., 2011] are caused by an increased inhibition of these areas [Devor et al., 2007]. This inhibition might not only result in decreased neuronal activity but also in a reduced excitability that leads to the measured increase in perception threshold. From a neuropsychological perspective, a suppression of the excitability of the ipsilateral SI during unilateral sensory stimulation can be viewed as a physiological response to optimize the differentiation of other tactile information in localized areas of the body [Drevets et al., 1995].
From a behavioral perspective, this suggests that an increasing neuronal response to a repetitive stimulus can also be called habituation if the response is a decrease in neuronal activity compared with the baseline condition. Interestingly, we did not measure any significant difference in the perceptual threshold between the stimulation and the rest conditions. This might be because the CPT was determined rather early during each 30‐s period. Thus, we measured the CPT during its rise and shortly after its maximum, which might explain the small difference between the CPT during stimulation and rest. Because we are measuring the neuronal activity only indirectly by changes of hemodynamic parameters, changes of the cerebral blood flow (CBF) or cerebral blood volume (CBV) in the activated areas have to be considered as a possible bias. In general, the BOLD signal is related to the absolute concentration of deoxygenated hemoglobin, which in turn is mainly governed by changes in CBF and CMRO2 during focal neuronal activation. Although we did not measure CBF directly, recent studies dealing with the sensorimotor cortex or visual system have clearly shown that the NBR is associated with a decrease in CBF with a preserved CMRO2/CBF coupling [Shmuel et al., 2002; Stefanovic et al., 2004] and is also associated with a decrease in local CBV [Devor et al., 2007]. Therefore, it is unlikely that the amplitude increase of the NBR is caused by an increment in CMRO2 without a concomitant change in CBF or an increase in CBV.
The current findings have further implications for our understanding of the physiological basis of habituation and the NBR. We found that the repetitive exposure to a stimulus can change an initially positive BOLD response into a more negative response by decreasing the absolute amplitude of the response (see BA2 and BA1 in Fig. 2). This transition from a PBR to an NBR could be explained if excitatory and inhibitory influences exist side by side in the same brain area as recently reported [Boorman et al., 2010]. Boorman et al. have shown that the NBR and the associated decreased neuronal activity are primarily measurable in layer V and VI, whereas layers I‐IV of the same area are dominated by a positive BOLD response and increased neuronal activity [Boorman et al., 2010]. Moreover, in the human visual cortex, the tonic level of GABA was found to correlate with decreases in the BOLD response [Muthukumaraswamy et al., 2009]. All of these facts indicate that the NBR and the PBR differ mainly in their amplitude compared with a baseline condition while sharing the same physiological basis. This is further supported by the observation that an NBR was found to end acutely at the beginning of a PBR in the same brain area without further convolution of the PBR [Klingner et al., 2011a]. We suggest that the demonstrated amplitude decrease over time might result from a changed relationship between excitatory and inhibitory influences across different cortical layers, although the net result is generally in favor of inhibition. The demonstrated increased neuronal response (more strongly negative) within the ipsilateral SI cannot be explained by reduced information flow but favors the interpretation of an active suppression as the underlying mechanism of habituation, at least in the somatosensory system.
The following question remains: what is the driver of habituation that is responsible for the balance between excitatory and inhibitory effects within the ipsilateral SI? The exact pathway mediating the ipsilateral response remains elusive, while there are some indications of a transcallosal information transfer between both BA2s (for a detailed discussion of this point, see [Hlushchuk and Hari, 2006; Iwamura et al., 2001; Klingner et al., 2011b]). BA2 has dense reciprocal connections to BA1/BA3b and may, in turn, alter the activity in these areas by cortico‐cortical connections. If habituation within the ipsilateral SI is caused mainly by a reduced transcallosal information relay, one might assume a decreased inhibitory effect by cortico‐cortical connections within the SI causing the decreased amplitude of the NBR. This is not supported by the data. However, all subareas of the SI are bidirectionally connected to the thalamus. The thalamus is able to not only modulate the information flow between cortical brain areas but also to exert an excitatory or inhibitory influence on a specific brain region [Sherman, 2007]. In our opinion, the increased amplitude of the NBR underlines the importance of the thalamus in the mechanism that causes habituation. However, further animal studies are needed to investigate this hypothesis by combining fMRI with direct measures of neuronal activity. Therefore, consideration of habituation effects on both neuronal activation and deactivation of different brain areas is important for enhancing our understanding of the underlying mechanisms of habituation and the NBR.
CONCLUSIONS
This study demonstrated an amplitude increase of the NBR due to habituation. To explain this finding, we hypothesize that habituation, at least in the SI, originates from a general change in the balance between excitatory and inhibitory effects, although the net result is generally in favor of inhibition.
REFERENCES
- Backes WH, Mess WH, van Kranen‐Mastenbroek V, Reulen JP (2000): Somatosensory cortex responses to median nerve stimulation: fMRI effects of current amplitude and selective attention. Clin Neurophysiol 111:1738–1744. [DOI] [PubMed] [Google Scholar]
- Bingel U, Schoell E, Herken W, Buchel C, May A (2007): Habituation to painful stimulation involves the antinociceptive system. Pain 131:21–30. [DOI] [PubMed] [Google Scholar]
- Blankenburg F, Taskin B, Ruben J, Moosmann M, Ritter P, Curio G, Villringer A (2003): Imperceptible stimuli and sensory processing impediment. Science 299:1864. [DOI] [PubMed] [Google Scholar]
- Boorman L, Kennerley AJ, Johnston D, Jones M, Zheng Y, Redgrave P, Berwick J (2010): Negative blood oxygen level dependence in the rat: A model for investigating the role of suppression in neurovascular coupling. J Neurosci 30:4285–4294. [DOI] [PMC free article] [PubMed] [Google Scholar]
- Brodmann K (1909): Vergleichende Lokalisationslehre der Goßhirnrinde.Leipzig:J.A. Barth. [Google Scholar]
- Calhoun VD, Adali T, McGinty VB, Pekar JJ, Watson TD, Pearlson GD (2001a): fMRI activation in a visual‐perception task: Network of areas detected using the general linear model and independent components analysis. Neuroimage 14:1080–1088. [DOI] [PubMed] [Google Scholar]
- Calhoun VD, Adali T, Pearlson GD, Pekar JJ (2001b): A method for making group inferences from functional MRI data using independent component analysis. Hum Brain Mapp 14:140–151. [DOI] [PMC free article] [PubMed] [Google Scholar]
- Calhoun VD, Liu J, Adali T (2008): A review of group ICA for fMRI data and ICA for joint inference of imaging, genetic, and ERP data. Neuroimage 45:163–172. [DOI] [PMC free article] [PubMed] [Google Scholar]
- Davey NJ, Nowicky AV, Zaman R (2001): Somatopy of perceptual threshold to cutaneous electrical stimulation in man. Exp Physiol 86:127–130. [DOI] [PubMed] [Google Scholar]
- Deuchert M, Ruben J, Schwiemann J, Meyer R, Thees S, Krause T, Blankenburg F, Villringer K, Kurth R, Curio G, Villringer A (2002): Event‐related fMRI of the somatosensory system using electrical finger stimulation. Neuroreport 13:365–369. [DOI] [PubMed] [Google Scholar]
- Devor A, Tian P, Nishimura N, Teng IC, Hillman EM, Narayanan SN, Ulbert I, Boas DA, Kleinfeld D, Dale AM (2007): Suppressed neuronal activity and concurrent arteriolar vasoconstriction may explain negative blood oxygenation level‐dependent signal. J Neurosci 27:4452–4459. [DOI] [PMC free article] [PubMed] [Google Scholar]
- Drevets WC, Burton H, Videen TO, Snyder AZ, Simpson JR Jr, Raichle ME (1995): Blood flow changes in human somatosensory cortex during anticipated stimulation. Nature 373:249–252. [DOI] [PubMed] [Google Scholar]
- Eickhoff SB, Stephan KE, Mohlberg H, Grefkes C, Fink GR, Amunts K, Zilles K (2005): A new SPM toolbox for combining probabilistic cytoarchitectonic maps and functional imaging data. Neuroimage 25:1325–1335. [DOI] [PubMed] [Google Scholar]
- Eickhoff SB, Heim S, Zilles K, Amunts K (2006): Testing anatomically specified hypotheses in functional imaging using cytoarchitectonic maps. Neuroimage 32:570–582. [DOI] [PubMed] [Google Scholar]
- Hlushchuk Y, Hari R (2006): Transient suppression of ipsilateral primary somatosensory cortex during tactile finger stimulation. J Neurosci 26:5819–5824. [DOI] [PMC free article] [PubMed] [Google Scholar]
- Iwamura Y, Iriki A, Tanaka M (1994): Bilateral hand representation in the postcentral somatosensory cortex. Nature 369:554–556. [DOI] [PubMed] [Google Scholar]
- Iwamura Y, Taoka M, Iriki A (2001): Bilateral activity and callosal connections in the somatosensory cortex. Neuroscientist 7:419–429. [DOI] [PubMed] [Google Scholar]
- Kampe KK, Jones RA, Auer DP (2000): Frequency dependence of the functional MRI response after electrical median nerve stimulation. Hum Brain Mapp 9:106–114. [DOI] [PMC free article] [PubMed] [Google Scholar]
- Kastrup A, Baudewig J, Schnaudigel S, Huonker R, Becker L, Sohns JM, Dechent P, Klingner C, Witte OW (2008): Behavioral correlates of negative BOLD signal changes in the primary somatosensory cortex. Neuroimage 41:1364–1371. [DOI] [PubMed] [Google Scholar]
- Klingner CM, Hasler C, Brodoehl S, Witte OW (2010): Dependence of the negative BOLD response on somatosensory stimulus intensity. Neuroimage 53:189–195. [DOI] [PubMed] [Google Scholar]
- Klingner CM, Ebenau K, Hasler C, Brodoehl S, Gorlich Y, Witte OW (2011a): Influences of negative BOLD responses on positive BOLD responses. Neuroimage 55:1709–1715. [DOI] [PubMed] [Google Scholar]
- Klingner CM, Huonker R, Flemming S, Hasler C, Brodoehl S, Preul C, Burmeister H, Kastrup A, Witte OW (2011b): Functional deactivations: Multiple ipsilateral brain areas engaged in the processing of somatosensory information. Hum Brain Mapp 32:127–140. [DOI] [PMC free article] [PubMed] [Google Scholar]
- Lipton ML, Fu KM, Branch CA, Schroeder CE (2006): Ipsilateral hand input to area 3b revealed by converging hemodynamic and electrophysiological analyses in macaque monkeys. J Neurosci 26:180–185. [DOI] [PMC free article] [PubMed] [Google Scholar]
- Logothetis NK, Pfeuffer J (2004): On the nature of the BOLD fMRI contrast mechanism. Magn Reson Imaging 22:1517–1531. [DOI] [PubMed] [Google Scholar]
- Logothetis NK, Wandell BA (2004): Interpreting the BOLD signal. Annu Rev Physiol 66:735–769. [DOI] [PubMed] [Google Scholar]
- Logothetis NK, Pauls J, Augath M, Trinath T, Oeltermann A (2001): Neurophysiological investigation of the basis of the fMRI signal. Nature 412:150–157. [DOI] [PubMed] [Google Scholar]
- Mendell LM (1966): Physiological properties of unmyelinated fiber projection to the spinal cord. Exp Neurol 16:316–332. [DOI] [PubMed] [Google Scholar]
- Mobascher A, Brinkmeyer J, Warbrick T, Musso F, Schlemper V, Wittsack HJ, Saleh A, Schnitzler A, Winterer G (2010): Brain activation patterns underlying fast habituation to painful laser stimuli. Int J Psychophysiol 75:16–24. [DOI] [PubMed] [Google Scholar]
- Mukamel R, Gelbard H, Arieli A, Hasson U, Fried I, Malach R (2005): Coupling between neuronal firing, field potentials, and FMRI in human auditory cortex. Science 309:951–954. [DOI] [PubMed] [Google Scholar]
- Muthukumaraswamy SD, Edden RA, Jones DK, Swettenham JB, Singh KD (2009): Resting GABA concentration predicts peak gamma frequency and fMRI amplitude in response to visual stimulation in humans. Proc Natl Acad Sci USA 106:8356–8361. [DOI] [PMC free article] [PubMed] [Google Scholar]
- Mutschler I, Wieckhorst B, Speck O, Schulze‐Bonhage A, Hennig J, Seifritz E, Ball T (2010): Time scales of auditory habituation in the amygdala and cerebral cortex. Cereb Cortex 20:2531–2539. [DOI] [PubMed] [Google Scholar]
- Niessing J, Ebisch B, Schmidt KE, Niessing M, Singer W, Galuske RA (2005): Hemodynamic signals correlate tightly with synchronized gamma oscillations. Science 309:948–951. [DOI] [PubMed] [Google Scholar]
- Nihashi T, Naganawa S, Sato C, Kawai H, Nakamura T, Fukatsu H, Ishigaki T, Aoki I (2005): Contralateral and ipsilateral responses in primary somatosensory cortex following electrical median nerve stimulation—An fMRI study. Clin Neurophysiol 116:842–848. [DOI] [PubMed] [Google Scholar]
- Ruben J, Krause T, Taskin B, Blankenburg F, Moosmann M, Villringer A (2006): Sub‐area‐specific suppressive interaction in the BOLD responses to simultaneous finger stimulation in human primary somatosensory cortex: Evidence for increasing rostral‐to‐caudal convergence. Cereb Cortex 16:819–826. [DOI] [PubMed] [Google Scholar]
- Schnitzler A, Ploner M (2000): Neurophysiology and functional neuroanatomy of pain perception. J Clin Neurophysiol 17:592–603. [DOI] [PubMed] [Google Scholar]
- Sherman SM (2007): The thalamus is more than just a relay. Curr Opin Neurobiol 17:417–422. [DOI] [PMC free article] [PubMed] [Google Scholar]
- Shmuel A, Yacoub E, Pfeuffer J, Van de Moortele PF, Adriany G, Hu X, Ugurbil K (2002): Sustained negative BOLD, blood flow and oxygen consumption response and its coupling to the positive response in the human brain. Neuron 36:1195–1210. [DOI] [PubMed] [Google Scholar]
- Shmuel A, Augath M, Oeltermann A, Logothetis NK (2006): Negative functional MRI response correlates with decreases in neuronal activity in monkey visual area V1. Nat Neurosci 9:569–577. [DOI] [PubMed] [Google Scholar]
- Stefanovic B, Warnking JM, Pike GB (2004): Hemodynamic and metabolic responses to neuronal inhibition. Neuroimage 22:771–778. [DOI] [PubMed] [Google Scholar]
- Thompson RF (2009): Habituation: A history. Neurobiol Learn Mem 92:127–134. [DOI] [PMC free article] [PubMed] [Google Scholar]
- Thompson RF, Spencer WA (1966): Habituation: a model phenomenon for the study of neuronal substrates of behavior. Psychol Rev 73:16–43. [DOI] [PubMed] [Google Scholar]
- Vogt C, Vogt O (1919): Allgemeinere Ergebnisse unserer Hirnforschung. J Psychol Neurol 25:279–462. [Google Scholar]
- Wood DC (1988): Habituation in Stentor: Produced by mechanoreceptor channel modification. J Neurosci 8:2254–2258. [DOI] [PMC free article] [PubMed] [Google Scholar]
- Woolf CJ, Salter MW (2000): Neuronal plasticity: Increasing the gain in pain. Science 288:1765–1769. [DOI] [PubMed] [Google Scholar]
- Yamashita T, Kanaya K, Sekine M, Takebayashi T, Kawaguchi S, Katahira G (2002): A quantitative analysis of sensory function in lumbar radiculopathy using current perception threshold testing. Spine (Phila Pa 1976) 27:1567–1570. [DOI] [PubMed] [Google Scholar]
- Yin H, Liu Y, Li M, Hu D (2011): Hemodynamic observation and spike recording explain the neuronal deactivation origin of negative response in rat. Brain Res Bull 84:157–162. [DOI] [PubMed] [Google Scholar]
- Zhang N, Gore JC, Chen LM, Avison MJ (2007): Dependence of BOLD signal change on tactile stimulus intensity in SI of primates. Magn Reson Imaging 25:784–794. [DOI] [PubMed] [Google Scholar]