

Abstract
Schizophrenia has been associated with abnormal task‐related brain activation in sensory and motor regions as well as social cognition network. Recently, two studies investigated temporal correlation between resting‐state functional magnetic resonance imaging (R‐fMRI) low‐frequency oscillations (LFOs) in schizophrenia but reported mixed results. This may be due to the different frequency bands used in these studies. Here we utilized R‐fMRI to measure the amplitude of low‐frequency fluctuations (ALFF) and fractional ALFF (fALFF) in three different frequency bands (slow‐5: 0.01–0.027 Hz; slow‐4: 0.027–0.08 Hz; and typical band: 0.01–0.08 Hz) in 69 patients with schizophrenia and 62 healthy controls. We showed that there were significant differences in ALFF/fALFF between the two bands (slow‐5 and slow‐4) in regions including basal ganglia, midbrain, and ventromedial prefrontal cortex. Importantly, we also identified significant interaction between frequency bands and groups in inferior occipital gyrus, precunus, and thalamus. The results suggest that the abnormalities of LFOs in schizophrenia is dependent on the frequency band and suggest that future studies should take the different frequency bands into account when measure intrinsic brain activity. Hum Brain Mapp 35:627–637, 2014. © 2012 Wiley Periodicals, Inc.
Keywords: schizophrenia, low‐frequency fluctuation, prefrontal cortex, basal ganglia, resting state, MRI
INTRODUCTION
Schizophrenia is a devastating mental disorder affecting 1% of the population worldwide [Bhugra, 2005]. It is characterized by symptoms of the false attribution of perceptual experience to an external source (hallucinations), distorted thinking (delusions), reduction in emotion and motivated behavior (negative symptoms), disorganized thought or behavior, as well as other basic sensory processing and higher cognitive functions, such as language and planning. Researchers make efforts to elucidate its neural correlates by advanced imaging techniques and analytic methods. Many functional magnetic resonance imaging (fMRI) studies have focused on exploring activation abnormalities in schizophrenia during a task state [Barbalat et al., 2009; Kindermann et al., 1997].
In typical task‐based fMRI, low‐frequency physiological noises are filtered out, while preserving the higher frequency (i.e., task related) components of the signal [Holmes et al., 1997]. However, there is accumulating evidence suggesting that the spontaneous low frequency (typically 0.01–0.1 Hz) oscillations (LFO) of the human brain measured with resting‐state fMRI are physiologically meaningful and related to neural spontaneous activity [Biswal et al., 1995]. This method is suited to study pathology as it is not confounded with task‐specific activity patterns or performance differences between patients and healthy controls. Abnormal inter‐regions functional connectivity has been identified in schizophrenia in the default network [Bluhm et al., 2007], the sensorimotor cortex, prefrontal cortex [Chai et al., 2011; Zhou et al., 2007], temporoparietal area [Vercammen et al., 2010], thalamus [Skudlarski et al., 2010], hippocampus [Zhou et al., 2008], and amygdala [Hoptman et al., 2010a], supporting the idea that schizophrenia is linked to a breakdown in cortical connectivity between distal brain regions [Friston and Frith, 1995].
Although most studies have investigated synchronization of LFO between spatially distinct brain regions, research on regional properties of the brain's intrinsic functional dynamics is lacking. Amplitude of low‐frequency fluctuation (ALFF), which measures the total power of a given time course within a specific frequency range (e.g., 0.01–0.08 Hz), has been used to examine local spontaneous patterns during resting [Zang et al., 2007]. Although ALFF is effective at detecting LFOs, it may also include LFO fluctuations over 0.1 Hz [Zou et al., 2008]. A normalized index of ALFF, fractional ALFF (fALFF) can provide a more specific measure of LFOs by measuring the power within a specific frequency range divided by the total power in the entire detectable frequency range [Zou et al., 2008].
Several groups have also reported abnormal LFO amplitudes in psychiatric diseases such as the attention‐deficit/hyperactivity disorder [Zang et al., 2007], amnestic mild cognitive impairment [Han et al., 2011], mesial temporal lobe epilepsy [Zhang et al., 2010], posttraumatic stress disorder [Yin et al., 2011], as well as schizophrenia [Hoptman et al., 2010b; Huang et al., 2010]. For example, Huang et al. 2010 found that schizophrenia patients (n = 66) exhibited significantly higher ALFF in the bilateral putamen and diminished ALFF in the medial prefrontal cortex (mPFC), compared to the healthy controls (n = 66). The ALFF was measured in the 0.01–0.08 Hz. Hoptman et al. 2010a investigated both ALFF and fractional ALFF in schizophrenias in the range 0.027–0.073 Hz. They reported higher ALFF amplitudes in patients (n = 26) than controls (n = 29) in several brain regions, including left hippocampus/parahippocampus, as well as lower ALFF amplitudes in the right precuneus/cunus, lingual gyrus, and right precentral gyrus. They also found higher fALFF amplitudes in the right parahippocampal and medial frontal gyri and lower fALFF amplitudes in the left cuneus, insula, right lingual gyrus, and right caudate in schizophrenia. The findings in these two studies are inconsistent: ALFF amplitudes in mPFC were reduced in Huang et al' study, whereas Hoptman et al. found increased fALFF amplitude in medial frontal gyri. Larger ALFF amplitudes were found in putamen in schizophrenia in Huang et al. study but not in Hoptman et al. One possibility is that the amplitudes of LFO are frequency‐dependent.
To date, most R‐fMRI studies have examined spontaneous LFO activities at a specific frequency band of 0.01–0.1 Hz because the frequency band was thought to be linked to neuronal fluctuations [Biswal et al., 1995; Fox and Raichle, 2007; Zhang and Raichle, 2010]. Nonetheless, some researchers have observed that neuronal oscillations are distributed linearly on the natural logarithmic scale and independent frequency bands are generated by distinct oscillators with specific properties and physiological functions [Buzsaki and Draguhn, 2004; Penttonen and Buzsaki, 2003]. Moreover, neighboring frequency bands within the same neuronal network may compete or interact with each other [Engel et al., 2001]. By decomposing R‐fMRI LFO into four distinct frequency bands [slow‐5 (0.01–0.027 Hz), slow‐4 (0.027–0.073 Hz), slow‐3 (0.073–0.198 Hz), and slow‐2 (0.198–0.25 Hz)], it has been shown that LFO amplitudes in the slow‐4 band were higher than that in the slow‐5 in many brain regions such as the basal ganglia, thalamus, and precuneus [Zuo et al., 2010]. Indeed, frequency‐dependent changes in the ALFF have been found in amnestic mild cognitive impairment [Han et al., 2011].
In the current study, we applied both ALFF and fALFF to examine the amplitude of LFO in schizophrenia at different frequency bands (slow‐5 (0.01–0.027 Hz), slow‐4 (0.027–0.08 Hz), as well as the typical range (0.01–0.08 Hz) to relate LFO amplitude abnormalities to specific frequency bands. We predicted that abnormalities of LFO in schizophrenia may depend on the specific frequency range examined.
MATERIAL AND METHODS
Participants
From July 2009 to December 2010, we recruited 72 patients with chronic schizophrenia, with 34 males and 36 females who were identified according to the DSM‐IV diagnostic criteria by qualified psychiatrists at the National Taiwan University Hospital. Exclusion criteria included the history of other DSM‐IV Axis I diagnoses such as bipolar disorder, schizoaffective disorder, any substance dependence or of clinically significant medical illness or head trauma. Three subjects were removed because of significant head movement during the experiment (see below). As shown in the Table 1, the average age of our 69 patients with schizophrenia was 31.7 ± 9.6 years, and mean education duration was 14.2 ± 2.1 years. Only one of them was left‐handed and the other 68 were right‐handed, according to the Edinburgh Handedness Inventory. The PANSS was employed to all patients with schizophrenia 1 week before the MRI scan or 1 week after the scan. However, five of them were not able to complete the assessment because of their poor cooperation.
Table 1.
Sample demographics
| Measure | Schizo (n = 69) | HC (n = 62) | Statistics | ||
|---|---|---|---|---|---|
| Mean | SD | Mean | SD | P | |
| Age (year) | 31.7 | 9.6 | 29.9 | 8.6 | 0.264 |
| Education (year)a | 14.2 | 2.1 | 15.3 | 2.4 | 0.008 |
| Illness duration (year) | 7.1 | 6.5 | n.a. | n.a. | n.a. |
| PANSS‐positive scale (n = 64) | 12.1 | 4.7 | n.a. | n.a. | n.a. |
| PANSS‐negative scale (n = 64) | 13.4 | 6.1 | n.a. | n.a. | n.a. |
| PANSS‐general psychopathology scale (n = 64) | 27.4 | 9.6 | n.a. | n.a. | n.a. |
| PANSS‐total (n = 64) | 52.9 | 16.8 | n.a. | n.a. | n.a. |
| PANSS‐supplement aggression risk subscale score (n = 64) | 4.1 | 2.3 | n.a. | n.a. | n.a. |
Note Demographic information for the patient sample and control sample. Mean and standard deviation are provided for continuous variables (e.g., age, education, and PANSS scales). PANSS = positive and negative syndrome scale. Schizo = schizophrenic patients. HC = healthy controls.
P < 0.01.
Sixty‐two compatible controls were recruited. Their average age was 29.9 ± 8.6 years, and their mean education duration was 15.3 ± 2.4 years. One of them was left‐handed. All of the controls are free of the DSM‐IV diagnosis of schizophrenia and other DSM‐IV Axis I diagnoses. None of them has history of neurological diseases, any substance dependence, or clinically significant head trauma. Written informed consent was obtained from all individual participants, and all of the research procedures and ethical guidelines were followed in accordance with the Institutional Review Board (IRB) of the National Taiwan University Hospital. There was a significant group difference in their personal educational attainment, P = 0.008. This was expected as schizophrenics' psychiatric disorder may usually hold back their learning achievement. Demographic data suggest our sample groups did not differ in gender distribution (χ2 = 1.423, P = 0.233) or average age (t test, P = 0.264), as well as head motion during scanning (see Table 1 and Supporting Information).
MRI Data Acquisition
All subjects underwent structural and functional MRI scan in a single session using a 3T MR system (TIM Trio, Siemens, Erlangen, Germany). A thirty‐two channel head coil was used as the RF signal receiver. Sponges were used to fix subjects head within the coil to prevent motion artifact. All images were acquired parallel to anterior‐commissure‐posterior‐commissure line with an auto‐align technique. The total scan time for each subject was about 10 min.
T2‐weighted images were acquired with a turbo spin‐echo sequence. The image parameters were as follow: TR/TE = 7,240 ms/101 ms, FOV = 240 mm × 240 mm, matrix = 256 × 256, slice thickness = 3.5 mm and flip angle = 150°. GRAPPA technique with acceleration factor of two was used. A total of forty three contiguous axial slices were acquired in ∼2 min. A magnetization‐prepared rapid gradient echo (MPRAGE) sequence was used to acquire a whole brain high‐resolution T1‐weighted MR image in a coronal view. The sequence parameters were TR/TE = 2,000 ms/2.98 ms, inversion time = 900 ms, image matrix size = 192 × 256, spatial resolution = 1 × 1 mm2, field of view (FOV) = 192 × 256 mm2, and slice thickness = 1 mm without gap. T1 scan time is about 3 min and 36 s.
The resting state fMRI was performed with a gradient‐echo echo planar sequence. Subjects were asked to relax and think of nothing in particular with eyes closed but were requested not to fall asleep. Wakefulness was assessed throughout the recording via intercom link to the scanner chamber. The fMRI acquisition parameters were as follows: TR/TE = 2,000 ms/24 ms, field of view (FOV) = 256 mm × 256 mm, matrix = 64 × 64, slice thickness = 3 mm, interleaved scanning, and flip angle = 90°. For each participant, 34 trans‐axial slices with no gap were acquired to encompass the whole brain volume. The scan time of the resting‐state fMRI was ∼6 min.
Image Preprocessing
The first 10 volumes of each functional time series were discarded because of instability of the initial MRI signal and adaptation of participants to the circumstance, leaving 170 volumes in total. The remaining fMRI images were slice acquisition corrected, head‐motion corrected (a least squares approach and a six‐parameter spatial transformation), normalized to the standard SPM5 Montreal Neurological Institute (MNI) template, and then resampled to 3‐mm3 voxels. Subjects with head motion >3.0 mm of maximal translation (in any direction of x, y, or z) or 1.0° of maximal rotation throughout the course of scanning were excluded from further analysis. After linear detrending, data was filtered using typical temporal bandpass (0.01–0.08 Hz), slow‐5 bandpass (0.01–0.027 Hz), and slow‐4 bandpass (0.027–0.073 Hz) separately. Six motion parameters, the cerebrospinal fluid (CSF), the global mean signal, and the white matter signals as nuisance covariates to reduce the effects of head motion and non‐neuronal BOLD fluctuations [Fox et al., 2006; Kelly et al., 2008]. ALFF was calculated using REST software [Song et al., 2011]. The preprocessed time series was transformed to a frequency domain with a fast Fourier transform (FFT) (parameters: taper percent = 0, FFT length = shortest) and the power spectrum was then obtained. Because the power of a given frequency is proportional to the square of the amplitude of this frequency component of the original time series in the time domain, the square root was calculated at each frequency of the power spectrum and the averaged square root was obtained across 0.01–0.08 Hz at each voxel. This averaged square root was taken as the ALFF. For standardization purposes, the ALFF of each voxel was divided by the global mean ALFF value. fALFF was calculated as the ratio of power spectrum of low‐frequency (0.01–0.08 Hz for typical frequency band, 0.01–0.027 Hz for slow‐5 bandpass, and 0.027–0.073 Hz for slow‐4 bandpass) to that of the entire frequency range.
To explore the ALFF differences between the groups, a second‐level random‐effect two‐sample t test was performed on the individual normalized ALFF maps in a voxel‐by‐voxel manner. A threshold of family‐wise error (FWE) corrected threshold of P < 0.05 at cluster level was set. All coordinates were reported in MNI coordinates, as used by SPM.
RESULTS
ALFF/fALFF (Frequency Band 0.01–0.08 Hz)
We first report ALFF results from the typical frequency band (0.01–0.08 Hz). Group differences are shown in Table 2 and Figures 1 and 2. Compared to controls, patients exhibited reduced ALFF a cluster in the left middle occipital gyrus that extends to culmen, parahippocamps gyrus, and lingual gyrus, a cluster in the postcentral gyrus and precentral gyrus, inferior parietal lobule, precunus, and left posterior insula. Patients had higher ALFF in bilateral middle temporal gyrus, right inferior frontal gyrus, and right medial frontal gyrus. Overall, our findings are quite consistent with Hoptman et al.'s 2010b results but are inconsistent with Huang et al.'s 2010 findings. For example, Huang et al. reported decreased ALFF in medial frontal lobe in schizophrenia but we found the opposite pattern. We also report the main effect of group in fALFF (Table 3).
Table 2.
Brain regions showing differences in the amplitude of low‐frequency fluctuations (ALFF, 0.01–0.08 Hz) between controls and patients with schizohrenia
| Brain regions | Z scores | MNI coordinates | ||
|---|---|---|---|---|
| X | Y | Z | ||
| Control vs. schizophrenia | ||||
| L middle occipital gyrus | 6.29 | −36 | −84 | 0 |
| L culmen | −9 | −57 | −3 | |
| R parahippocampa gyrus | 15 | −51 | 0 | |
| L lingual gyrus | −15 | −81 | −9 | |
| R lingual gyrus | 21 | −81 | −12 | |
| R postcentral gyrus | 5.78 | 51 | −18 | 54 |
| R precentral gyrus | 36 | −21 | 60 | |
| L inferior parietal lobule | 4.81 | −30 | −45 | 57 |
| Precunus | 4.28 | 0 | −54 | 63 |
| L posterior insula | 4.21 | −39 | −18 | 12 |
| L precentral gyrus | 4.01 | −51 | −12 | 42 |
| Schizophrenia vs. control | ||||
| L middle temporal gyrus | 4.72 | −54 | −27 | −18 |
| R middle temporal gyrus | 4.52 | 69 | −33 | −15 |
| R inferior frontal gyrus | 5.17 | 48 | 42 | 3 |
| R medial frontal gyrus | 4.45 | 12 | 42 | 24 |
All values P < 0.05 FWE‐corr cluster‐level.
Figure 1.
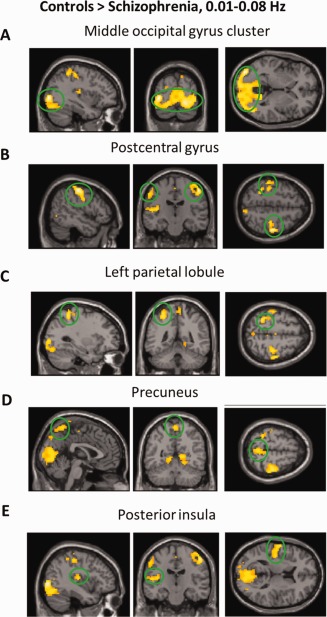
Regions that showed a significant lower ALFF in patients with schizohprenia than controls. For display purposes only, all statistical maps (P < 0.001, uncorrected) are overlayed on a T1‐weighted MNI template. [Color figure can be viewed in the online issue, which is available at http://wileyonlinelibrary.com.]
Figure 2.

Regions that showed a significant higher ALFF in patients with schizohprenia than controls. For display purposes only, all statistical maps (P < 0.001, uncorrected) are overlayed on a T1‐weighted MNI template. [Color figure can be viewed in the online issue, which is available at http://wileyonlinelibrary.com.]
Table 3.
Brain regions showing differences in the fractional amplitude of low‐frequency fluctuations (fALFF, 0.01–0.08 Hz) between controls and patients with schizohrenia
| Brain regions | Z scores | MNI coordinates | ||
|---|---|---|---|---|
| X | Y | Z | ||
| Control vs. schizophrenia | ||||
| R precentral gyrus | 4.77 | 54 | −15 | 48 |
| L fusiform gyrus | 4.72 | −39 | −72 | −18 |
| L middle occipital gyrus | −45 | −81 | 0 | |
| L fusiform gyrus | 4.65 | −30 | −78 | −18 |
| R lingual gyrus | 33 | −72 | −12 | |
| R inferior occipital gyrus | 4.11 | 36 | −87 | −12 |
| R cuneus | 21 | −78 | 6 | |
| L postcentral gyrus | −36 | −36 | 57 | |
| L inferior parietal lobule | −27 | −45 | 54 | |
| Schizophrenia vs. control | ||||
| R anterior insula | 5.18 | 48 | 9 | 6 |
| L anterior insula | 4.67 | −39 | 6 | 3 |
| L inferior parietal lobule | 4.53 | −48 | −51 | 42 |
| R medial frontal gyrus | 3.91 | 15 | 48 | 12 |
All values P < 0.05 FWE‐corr at cluster‐level.
Frequency‐Dependent Effects
Next, we examined the effect of frequency band on ALFF/fALFF. Main effects from the two‐way repeated‐measure ANOVA are shown in Figures 3 and 4. Brain regions showing a significant larger ALFF in slow 4 band than in slow 5 band were identified in the cingulate cortex, fusiform gyrus, basal ganglia, and midbrain, whereas larger ALFF in slow‐5 were found in lingual gyrus, middle temporal gyrus, inferior frontal gyrus and ventromedial frontal gyrus (see Fig. 3). These findings replicated two previous studies with a relatively large sample [Han et al., 2011; Zuo et al., 2010].
Figure 3.
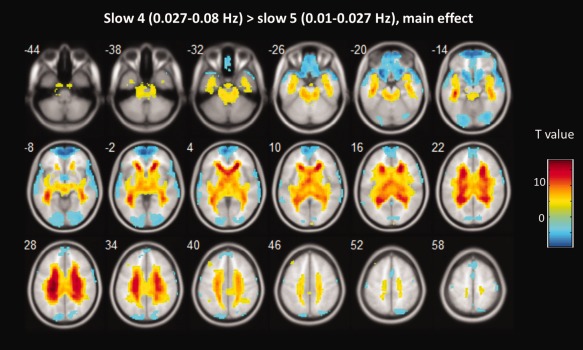
The main effect of frequency band across groups on ALFF. Hot color represents higher ALFF in the slow‐4 band than in the slow‐5 band, whereas blue cold color represents lower ALFF. The results were obtained by a two‐way repeated‐measure ANOVA. For display purposes only, all statistical maps (P < 0.001, uncorrected) are overlayed on a T1‐weighted MNI template. [Color figure can be viewed in the online issue, which is available at http://wileyonlinelibrary.com.]
Figure 4.
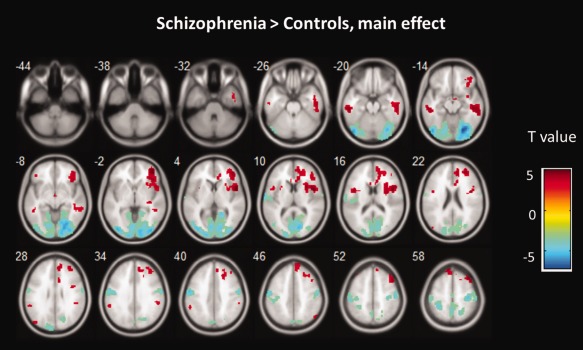
The main effect of group across frequency band on ALFF. Hot color represents higher ALFF in the schizophrenia group than in the control group, whereas blue cold color represents lower ALFF. The results were obtained by a two‐way repeated‐measure ANOVA. For display purposes only, all statistical maps (P < 0.001, uncorrected) are overlayed on a T1‐weighted MNI template. [Color figure can be viewed in the online issue, which is available at http://wileyonlinelibrary.com.]
The main effect of group identified brain regions (see Fig. 4) is similar to those reported in previous analysis using typical frequency band (0.01–0.08 Hz), as mentioned above. We observed significant interaction between frequency band and group in inferior occipital gyrus, precunus, thalamus (see Table 4). Beta values are reported to illustrate the directions of these interactions (see Fig. 5). Similar effects were found for fALFF analyses (see Table 5 and Supporting Information).
Table 4.
Brain regions showing significant interaction in the amplitude of low‐frequency fluctuations (ALFF) between group and frequency band
| Brain regions | Z scores | MNI coordinates | ||
|---|---|---|---|---|
| X | Y | Z | ||
| L Inferior occipital gyrus | 5.28 | −27 | −93 | −6 |
| R Inferior occipital gyrus | 3.75 | 27 | −84 | −6 |
| L Precuneus | 3.89 | −18 | −72 | 42 |
| Thalamus | 4.57 | 0 | −12 | 6 |
All values P < 0.05 FWE‐corr at cluster‐level.
Figure 5.
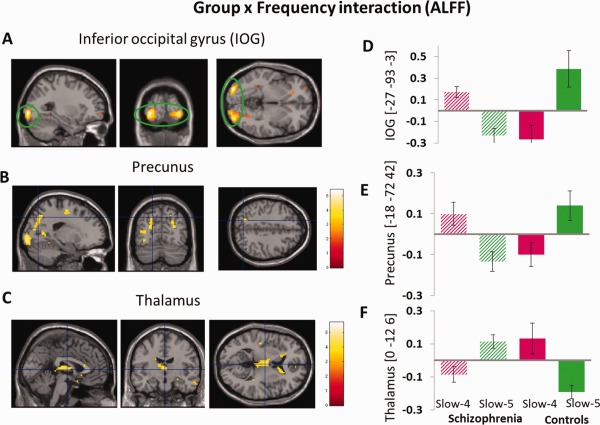
(A–C)The interaction between frequency band and group on ALFF. The results were obtained by a two‐way repeated‐measure ANOVA and post‐hoc test. The beta values for left IOG, left precunus and thalamus, were plotted (D–F) to show the directions of the interaction. For display purposes only, all statistical maps (P < 0.001, uncorrected) are overlayed on a T1‐weighted MNI template. [Color figure can be viewed in the online issue, which is available at http://wileyonlinelibrary.com.]
Table 5.
Brain regions showing significant interaction in the fractional amplitude of low‐frequency fluctuations (fALFF) between group and frequency band
| Brain regions | Z scores | MNI coordinates | ||
|---|---|---|---|---|
| X | Y | Z | ||
| L inferior occipital gyrus | 5.45 | −21 | −90 | −12 |
| R inferior occipital gyrus | 5.37 | 27 | −90 | −9 |
| R precuneus | 3.89 | 27 | −72 | 27 |
| L caudate | 4.18 | −9 | 21 | 0 |
| R caudate | 4.92 | 9 | 21 | 9 |
| R thalamus | 15 | −21 | 15 | |
DISCUSSION
In the present study, we examined changes in LFO amplitude (i.e., ALFF and fALFF) in schizophrenia at different frequency bands. We found that LFO amplitudes for slow‐4 were higher in cingulate cortex, fusiform gyrus, basal ganglia, and midbrain, and lower in lingual gyrus, middle temporal gyrus, inferior frontal gyrus and ventromedial frontal gyrus, comparison to LFO amplitudes in slow‐5. Overall, patients with schizophrenia showed abnormal ALFF/fALFF in middle occipital gyrus, inferior parietal lobule, precentral and postcentral gyrus, precunus, insula, middle temporal gyrus and medial and inferior frontal gyrus. Importantly, we found that several brain regions (i.e., inferior occipital gyrus, precunus, and thalamus) exhibited significant interaction between frequency band and group. Our findings demonstrate that abnormal spontaneous neural activity in schizophrenia is frequency dependent.
Greater ALFF/fALFF in the slow‐5 band than in the slow‐4 band was identified in widespread cortical regions, including mPFC, temporal and lingual gyrus. In contrast, greater ALFF/fALFF in the slow‐4 band was identified mainly in subcortical regions, including basal ganglia, midbrain and hippocampus. Although the origins and functional significances of slow‐4 and slow‐5 frequency band remain unclear, previous studies have suggested that lower frequency oscillations allow for an integration of large neuronal networks whereas higher frequency oscillations are confined to small neuronal space [Buzsaki and Draguhn, 2004]. Because most neuronal connections are local, the period of oscillation is constrained by the size of neuronal pool engaged in a given cycle [Buzsaki and Draguhn, 2004; Csicsvari et al., 2003]. The cortical regions (e.g., mPFC, temporal and occipital gyrus) have relatively large sizes and may contribute the long distance connections in very large networks. In contrast, phylogenetically older subcortical regions (e.g., basal banglia, midbrain, and hippocampal regions) may mainly contribute to fast local events, which are modulated by widespread slow oscillations [Buzsaki and Draguhn, 2004]. This is also consistent with the idea that cortical regions exert influences over subcortical regions [Csicsvari et al., 2003]. The network mechanisms of these LFOs are interesting topics for future research.
Neural oscillations are a fundamental mechanism for coordinated brain activity during normal functioning. A recent patient study showed that reduced BOLD fluctuations contribute to behavioral regression and progressive loss of developmental milestones, suggesting that intrinsic, coherent neuronal signaling is essential to the development and maintenance of the brain functions [Pizoli et al., 2011]. Recent evidence from electrophysiological, physiological and anatomical studies suggests that impairment in coherent and coordinated activity in brain circuits may have a central role in the pathophysiology of schizophrenia [Uhlhaas and Singer, 2010]. Our group differences results show that schizophrenia is associated with altered LFO amplitudes in widespread brain areas rather than circumscribed cortical regions. These findings are similar to results in Hoptman et al. 2010a study but inconsistent with findings in Huang et al. 2010, which reported a more restricted pattern of group differences on LFOs amplitude (e.g., larger ALFF in mPFC and smaller ALFF in putamen in schizophrenia).
The prefrontal cortical function in schizophrenia is extensively studied. Based on a wealth of research, it has been proposed that schizophrenia is associated with hypofrontality, a failure to activate frontal systems during prefrontal‐cortex‐related cognitive activity [Spironelli et al., 2011]. However, recent task‐based fMRI studies have documented areas of increased prefrontal activation (“hyperfrontality”) in schizophrenia, including the mPFC [Callicott et al., 2000; Manoach, 2003]. Collectively, findings of both hypo‐and hyperfrontality during tasks performance are likely valid reflections of prefrontal dysfunction in schizophrenia. Furthermore, the controversy may be caused by methodological factors including analytic method, heterogeneity of clinical phenotype of schizophrenia, and task parameters with regard to the domain of information represented and processes required [Manoach, 2003]. It has been argued that the hyperfrontality seen in the mPFC in schizophrenia actually represents a failure to deactivate, which may be resulted from a high baseline [Doody et al., 1998]. Our findings that schizophrenia patients exhibited larger ALFF/fALFF in mPFC provide insights into this issue by showing a high mPFC baseline in schizophrenia. Nevertheless, the activation pattern of mPFC in schizophrenia under resting state is far from conclusive and warrants more studies.
Previous studies have demonstrated visual and auditory sensory processing dysfunction revealed by evoked potentials showing abnormalities at the level of lateral geniculate nucleus or primary visual cortex [Butler et al., 2008]. Instead of using evoked potentials, we also found reduced LFO amplitude in occipital cortex in patients with schizophrenia on resting state fMRI, consistent with the hypothesis that schizophrenia is associated with low level sensory functions [Bilder et al., 2000; Butler et al., 2001, 2005; Rabinowicz et al., 2000]. For instant, in some studies, magnocellular deficits were found in schizophrenia, which may lead to their higher‐level visual processing difficulties as well [Butler et al., 2005]. Compared with normal individuals, patients with schizophrenia need 75% greater time to process magnocellular‐aimed stimuli, and 20% longer duration to detect parvocellular‐aimed stimuli in the visual backwards masking experiment [Schechter et al., 2003]. Interestingly, in our study, the signal changes in the occipital cortex were also modulated by frequency band. The underlying neural mechanisms of these interactions in temporal and frequency domains are interesting topics for further investigation.
The present study may assist in clarifying the previous contradictory LFO amplitude findings by illustrating that the FC disparity between schizophrenia patients and healthy controls is strongly modulated by frequency band. However, many inconsistent findings cannot simply be explained by the frequency band effect. It is important to note that participants in Huang et al. 2010 are treatment‐naive, first‐episode schizophrenia patients, whereas most patients in our study and patients in Hoptman et al. 2010a are medicated and not first‐episode. Lui et al. [2010] has reported a short‐term effect of antipsychotic treatment on cerebral function in drug‐naïve first‐episode schizophrenia revealed by resting state fMRI [Lui et al., 2010]. Medication used in the patients might account for the differences in LFOs. Future studies should further explore this possibility.
Some limitations in our study are worth mentioning. First, although we instructed participants to close their eyes during scanning, but without eye tracking or other visual monitoring equipment, we cannot rule out the possibility that some participants may fail to comply with this instruction during the whole resting session. It has been shown that the type of a resting condition (eyes open or eyes closed) can influence ALFF in mPFC, parahippocampal gyrus, cingulate cortex, and precuneus [Yan et al., 2009]. Future studies may take the resting condition into account and investigate whether and how it influences LFOs in specific frequency band. Second, we did not examine the full spectrum of cognitive functions and social behaviors in our sample. Future investigation could focus on the relationships between LFO alterations and function deficits. Finally, the nature of these resting state signal fluctuations remains unclear. Future studies are necessary to investigate the biological and functional significance of LFOs. Nevertheless, the consistency between regions found abnormal in schizophrenia using task‐based fMRI and those identified in our R‐fMRI suggest that R‐fMRI can reveal meaningful and important regional abnormality. The amplitude of low‐frequency BOLD fluctuations may have easier clinical applicability than standard fMRI. Finally, although we have taken great care in dealing with subject motion, it is still possible that some of the effects reported here can be accounted for by motion‐induced artifact. A recent study shows that the motion induced artifacts occur with movements on the order of a few tenths of a millimeter or less and produce systematic but spurious correlations in functional connectivity, such that long‐distance correlations are decreased by subject motion, whereas many short‐distance correlations are increased [Power et al., 2012]. The ALFF/fALFF measurements are not correlation‐based and whether small head motion induced artifacts influence ALFF/fALFF are still unclear. Nevertheless, a study by Yan et al. 2012 indicates very little head motion effect upon ALFF/fALFF measurement in resting‐state fMRI. While easily adoptable for head motion evaluation and correction [Power et al., 2012], future studies should be careful to interpret the results of removing timepoints from analyses that examine frequency oscillations or that highlight a specific frequency band in the BOLD signal.
In conclusion, this resting‐state fMRI study revealed abnormal LFO in sensorimotor cortex and striatum in schizophrenia. Importantly, we showed that the basal ganglia and vmPFC exhibited significantly different LFO amplitudes in different frequency bands and LFO amplitudes abnormalities in schizophrenia were frequency‐dependent. Future studies on LFO may examine ALFF/fALFF in different frequencies (e.g., show‐4 and slow‐5).
Supporting information
Supporting Information Figure 1.
Supporting Information Figure 2.
Supporting Information Figure 3.
Supporting Information Table 1.
Acknowledgments
The authors thank all of the participants for their involvement in this study.
REFERENCES
- Barbalat G, Chambon V, Franck N, Koechlin E, Farrer C (2009): Organization of cognitive control within the lateral prefrontal cortex in schizophrenia. Arch Gen Psychiatry 66:377–386. [DOI] [PubMed] [Google Scholar]
- Bhugra D (2005): The global prevalence of schizophrenia. Plos Med 2:372–373. [DOI] [PMC free article] [PubMed] [Google Scholar]
- Bilder RM, Goldman RS, Robinson D, Reiter G, Bell L, Bates JA, Pappadopulos E, Willson DF, Alvir JM, Woerner MG, et al. (2000): Neuropsychology of first‐episode schizophrenia: Initial characterization and clinical correlates. Am J Psychiatry 157:549–559. [DOI] [PubMed] [Google Scholar]
- Biswal B, Yetkin FZ, Haughton VM, Hyde JS (1995): Functional connectivity in the motor cortex of resting human brain using echo‐planar MRI. Magn Reson Med 34:537–541. [DOI] [PubMed] [Google Scholar]
- Bluhm RL, Miller J, Lanius RA, Osuch EA, Boksman K, Neufeld RW, Theberge J, Schaefer B, Williamson P (2007): Spontaneous low‐frequency fluctuations in the BOLD signal in schizophrenic patients: Anomalies in the default network. Schizophr Bull 33:1004–1012. [DOI] [PMC free article] [PubMed] [Google Scholar]
- Butler PD, Schechter I, Zemon V, Schwartz SG, Greenstein VC, Gordon J, Schroeder CE, Javitt DC (2001): Dysfunction of early‐stage visual processing in schizophrenia. Am J Psychiatry 158:1126–1133. [DOI] [PubMed] [Google Scholar]
- Butler PD, Zemon V, Schechter I, Saperstein AM, Hoptman MJ, Lim KO, Revheim N, Silipo G, Javitt DC (2005): Early‐stage visual processing and cortical amplification deficits in schizophrenia. Arch Gen Psychiatry 62:495–504. [DOI] [PMC free article] [PubMed] [Google Scholar]
- Buzsaki G, Draguhn A (2004): Neuronal oscillations in cortical networks. Science 304:1926–1929. [DOI] [PubMed] [Google Scholar]
- Callicott JH, Bertolino A, Mattay VS, Langheim FJ, Duyn J, Coppola R, Goldberg TE, Weinberger DR (2000): Physiological dysfunction of the dorsolateral prefrontal cortex in schizophrenia revisited. Cereb Cortex 10:1078–1092. [DOI] [PubMed] [Google Scholar]
- Chai XJ, Whitfield‐Gabrieli S, Shinn AK, Gabrieli JD, Nieto Castanon A, McCarthy JM, Cohen BM, Ongur D (2011): Abnormal medial prefrontal cortex resting‐state connectivity in bipolar disorder and schizophrenia. Neuropsychopharmacology 36:2009–2017. [DOI] [PMC free article] [PubMed] [Google Scholar]
- Csicsvari J, Jamieson B, Wise KD, Buzsaki G (2003): Mechanisms of gamma oscillations in the hippocampus of the behaving rat. Neuron 37:311–322. [DOI] [PubMed] [Google Scholar]
- Doody GA, Johnstone EC, Sanderson TL, Owens DGC (1998): Social, medical and psychiatric aspects of schizophrenia in people with pre‐morbid cognitive impairment. Schizophrenia Res 29:49–49(1). [Google Scholar]
- Engel AK, Fries P, Singer W (2001): Dynamic predictions: Oscillations and synchrony in top‐down processing. Nat Rev Neurosci 2:704–716. [DOI] [PubMed] [Google Scholar]
- Fox MD, Raichle ME (2007): Spontaneous fluctuations in brain activity observed with functional magnetic resonance imaging. Nat Rev Neurosci 8:700–711. [DOI] [PubMed] [Google Scholar]
- Fox MD, Corbetta M, Snyder AZ, Vincent JL, Raichle ME (2006): Spontaneous neuronal activity distinguishes human dorsal and ventral attention systems. Proc Natl Acad Sci USA 103:10046–10051. [DOI] [PMC free article] [PubMed] [Google Scholar]
- Friston KJ, Frith CD (1995): Schizophrenia—A disconnection syndrome. Clin Neurosci 3:89–97. [PubMed] [Google Scholar]
- Han Y, Wang J, Zhao Z, Min B, Lu J, Li K, He Y, Jia J (2011): Frequency‐dependent changes in the amplitude of low‐frequency fluctuations in amnestic mild cognitive impairment: A resting‐state fMRI study. Neuroimage 55:287–295. [DOI] [PubMed] [Google Scholar]
- Holmes AP, Josephs O, Buchel C, Friston KJ (1997): Statistical modelling of low‐frequency confounds in fMRI. Neuroimage 5:S480. [Google Scholar]
- Hoptman MJ, D'Angelo D, Catalano D, Mauro CJ, Shehzad ZE, Kelly AM, Castellanos FX, Javitt DC, Milham MP (2010a): Amygdalofrontal functional disconnectivity and aggression in schizophrenia. Schizophr Bull 36:1020–1028. [DOI] [PMC free article] [PubMed] [Google Scholar]
- Hoptman MJ, Zuo XN, Butler PD, Javitt DC, D'Angelo D, Mauro CJ, Milham MP (2010b): Amplitude of low‐frequency oscillations in schizophrenia: A resting state fMRI study. Schizophr Res 117:13–20. [DOI] [PMC free article] [PubMed] [Google Scholar]
- Huang XQ, Lui S, Deng W, Chan RC, Wu QZ, Jiang LJ, Zhang JR, Jia ZY, Li XL, Li F, et al. (2010): Localization of cerebral functional deficits in treatment‐naive, first‐episode schizophrenia using resting‐state fMRI. Neuroimage 49:2901–2906. [DOI] [PubMed] [Google Scholar]
- Kelly AMC, Uddin LQ, Biswal BB, Castellanos FX, Milham MP (2008): Competition between functional brain networks mediates behavioral variability. Neuroimage 39:527–537. [DOI] [PubMed] [Google Scholar]
- Kindermann SS, Karimi A, Symonds L, Brown GG, Jeste DV (1997): Review of functional magnetic resonance imaging in schizophrenia. Schizophr Res 27:143–156. [DOI] [PubMed] [Google Scholar]
- Manoach DS (2003): Prefrontal cortex dysfunction during working memory performance in schizophrenia: Reconciling discrepant findings. Schizophr Res 60:285–298. [DOI] [PubMed] [Google Scholar]
- Penttonen M, Buzsaki G (2003): Natural logarithmic relationship between brain oscillators. Thalamus Relat Syst 2:145–152. [Google Scholar]
- Pizoli CE, Shah MN, Snyder AZ, Shimony JS, Limbrick DD, Raichle ME, Schlaggar BL, Smyth MD (2011): Resting‐state activity in development and maintenance of normal brain function. Proc Natl Acad Sci USA 108:11638–11643. [DOI] [PMC free article] [PubMed] [Google Scholar]
- Power JD, Barnes KA, Snyder AZ, Schlaggar BL, Petersen SE (2012): Spurious but systematic correlations in functional connectivity MRI networks arise from subject motion. Neuroimage 59:2142–2154. [DOI] [PMC free article] [PubMed] [Google Scholar]
- Rabinowicz EF, Silipo G, Goldman R, Javitt DC (2000): Auditory sensory dysfunction in schizophrenia: Imprecision or distractibility? Arch Gen Psychiatry 57:1149–1155. [DOI] [PubMed] [Google Scholar]
- Skudlarski P, Jagannathan K, Anderson K, Stevens MC, Calhoun VD, Skudlarska BA, Pearlson G (2010): Brain connectivity is not only lower but different in schizophrenia: A combined anatomical and functional approach. Biol Psychiatry 68:61–69. [DOI] [PMC free article] [PubMed] [Google Scholar]
- Song X‐W, Dong Z‐Y, Long X‐Y, Li S‐F, Zuo X‐N, Zhu C‐Z, He Y, Yan C‐G, Zang Y‐F (2011): REST: A toolkit for resting‐state functional magnetic resonance imaging data processing. PLoS One 6:e25031. [DOI] [PMC free article] [PubMed] [Google Scholar]
- Spironelli C, Angrilli A, Calogero A, Stegagno L (2011): Delta EEG band as a marker of left hypofrontality for language in schizophrenia patients. Schizophr Bull 37:757–767. [DOI] [PMC free article] [PubMed] [Google Scholar]
- Uhlhaas PJ, Singer W (2010): Abnormal neural oscillations and synchrony in schizophrenia. Nat Rev Neurosci 11:100–113. [DOI] [PubMed] [Google Scholar]
- Vercammen A, Knegtering H, den Boer JA, Liemburg EJ, Aleman A (2010): Auditory hallucinations in schizophrenia are associated with reduced functional connectivity of the temporo‐parietal area. Biol Psychiatry 67:912–918. [DOI] [PubMed] [Google Scholar]
- Yan C, Liu D, He Y, Zou Q, Zhu C, Zuo X, Long X, Zang Y (2009): Spontaneous brain activity in the default mode network is sensitive to different resting‐state conditions with limited cognitive load. PLoS One 4:e5743. [DOI] [PMC free article] [PubMed] [Google Scholar]
- Yan C, Cheung B, Colcombe S, Craddock C, Li Q, Kelly C, Di Martino A, Castellanos FX, Milham M (2012): The motion crisis in functional connectomics: Damage assessment and control for resting‐state fMRI. Paper presented at the Third Biennial Conference on Resting State Brain Connectivity, Magdeburg, Germany. Available at: http://www.conventus.de/fileadmin/media/2012/resting/abstracts/25_Abstract.pdf
- Yin Y, Li L, Jin C, Hu X, Duan L, Eyler LT, Gong Q, Song M, Jiang T, Liao M, et al. (2011): Abnormal baseline brain activity in posttraumatic stress disorder: A resting‐state functional magnetic resonance imaging study. Neurosci Lett 498:185–189. [DOI] [PubMed] [Google Scholar]
- Zang YF, He Y, Zhu CZ, Cao QJ, Sui MQ, Liang M, Tian LX, Jiang TZ, Wang YF (2007): Altered baseline brain activity in children with ADHD revealed by resting‐state functional MRI. Brain Dev 29:83–91. [DOI] [PubMed] [Google Scholar]
- Zhang D, Raichle ME (2010): Disease and the brain's dark energy. Nat Rev Neurol 6:15–28. [DOI] [PubMed] [Google Scholar]
- Zhang Z, Lu G, Zhong Y, Tan Q, Chen H, Liao W, Tian L, Li Z, Shi J, Liu Y (2010): fMRI study of mesial temporal lobe epilepsy using amplitude of low‐frequency fluctuation analysis. Hum Brain Mapp 31:1851–1861. [DOI] [PMC free article] [PubMed] [Google Scholar]
- Zhou Y, Liang M, Jiang T, Tian L, Liu Y, Liu Z, Liu H, Kuang F (2007): Functional dysconnectivity of the dorsolateral prefrontal cortex in first‐episode schizophrenia using resting‐state fMRI. Neurosci Lett 417:297–302. [DOI] [PubMed] [Google Scholar]
- Zhou Y, Shu N, Liu Y, Song M, Hao Y, Liu H, Yu C, Liu Z, Jiang T (2008): Altered resting‐state functional connectivity and anatomical connectivity of hippocampus in schizophrenia. Schizophr Res 100:120–132. [DOI] [PubMed] [Google Scholar]
- Zou QH, Zhu CZ, Yang Y, Zuo XN, Long XY, Cao QJ, Wang YF, Zang YF (2008): An improved approach to detection of amplitude of low‐frequency fluctuation (ALFF) for resting‐state fMRI: Fractional ALFF. J Neurosci Methods 172:137–141. [DOI] [PMC free article] [PubMed] [Google Scholar]
- Zuo XN, Di Martino A, Kelly C, Shehzad ZE, Gee DG, Klein DF, Castellanos FX, Biswal BB, Milham MP (2010): The oscillating brain: Complex and reliable. Neuroimage 49:1432–1445. [DOI] [PMC free article] [PubMed] [Google Scholar]
Associated Data
This section collects any data citations, data availability statements, or supplementary materials included in this article.
Supplementary Materials
Supporting Information Figure 1.
Supporting Information Figure 2.
Supporting Information Figure 3.
Supporting Information Table 1.