

Abstract
At present, our knowledge about seasonal affective disorder (SAD) is based mainly up on clinical symptoms, epidemiology, behavioral characteristics and light therapy. Recently developed measures of resting‐state functional brain activity might provide neurobiological markers of brain disorders. Studying functional brain activity in SAD could enhance our understanding of its nature and possible treatment strategies. Functional network connectivity (measured using ICA‐dual regression), and amplitude of low‐frequency fluctuations (ALFF) were measured in 45 antidepressant‐free patients (39.78 ± 10.64, 30 ♀, 15 ♂) diagnosed with SAD and compared with age‐, gender‐ and ethnicity‐matched healthy controls (HCs) using resting‐state functional magnetic resonance imaging. After correcting for Type 1 error at high model orders (inter‐RSN correction), SAD patients showed significantly increased functional connectivity in 11 of the 47 identified RSNs. Increased functional connectivity involved RSNs such as visual, sensorimotor, and attentional networks. Moreover, our results revealed that SAD patients compared with HCs showed significant higher ALFF in the visual and right sensorimotor cortex. Abnormally altered functional activity detected in SAD supports previously reported attentional and psychomotor symptoms in patients suffering from SAD. Further studies, particularly under task conditions, are needed in order to specifically investigate cognitive deficits in SAD. Hum Brain Mapp 35:161–172, 2014. © 2012 Wiley Periodicals, Inc.
Keywords: seasonal affective disorder, fMRI, resting‐state, functional connectivity, ICA, ALFF
INTRODUCTION
Seasonal affective disorder (SAD) was first described in 1984 [Rosenthal et al., 1984] and is considered a subtype of either recurrent major depressive disorder (MDD) or bipolar affective disorder in which depressive episodes regularly begin in one season and remit in another season [American Psychiatric Association, 2000]. The winter‐type of SAD manifests as atypical symptoms of depression [Jacobsen et al., 1987; Rosenthal et al., 1984]. Recent evidence suggests a circadian basis for SAD [Lewy et al., 2006; Wehr et al., 2001]. The phase shift hypothesis suggests that SAD patients experience a circadian phase delay in winter and that early morning bright light exposure helps alleviate symptoms by correcting this phase shift delay [Lewy, 1999; Lewy et al., 1987, 2000]. Cohen et al. [2000] using positron emission tomography (PET) scanning have reported lower global metabolic rate in SAD patients relative to healthy controls.
Functional magnetic resonance imaging (fMRI) enables the detection of task responses as well as spontaneous activity of the living human brain. Temporal similarities in blood oxygen level‐dependent (BOLD) signal fluctuations detected at rest are thought to reflect functional connectivity of different brain regions [Beckmann et al., 2005; Biswal et al., 1995; Cordes et al., 2000; Fox et al., 2005; Greicius et al., 2003; Lowe et al., 2000]. Recently, independent component analysis (ICA) has become one of the most often used methods to detect functionally connected brain regions [Biswal et al., 2001; Calhoun et al., 2001; Kiviniemi et al., 2003; Mckeown et al., 1998]. A number of studies have shown altered functional connectivity in disorders including schizophrenia [Calhoun et al., 2009; Garrity et al., 2007; Jafri et al., 2008], Alzheimer's disease or dementia [Greicius et al., 2004; Rombouts et al., 2009; Seeley et al., 2009], depression [Anand et al., 2005; Greicius et al., 2007; Sheline et al., 2010; Veer et al., 2010; Zhou et al., 2009], epilepsy [Lui et al., 2008; Zhang et al., 2009], Huntington's disease [Wolf et al., 2008], amyotrophic lateral sclerosis [Mohammadi et al., 2009], and multiple sclerosis [Lowe et al., 2002].
Amplitude of low‐frequency fluctuations (ALFF) [Zang et al., 2007] involves the spectral decomposition of the time series data with a focus on the relative amplitude that resides in low‐frequency ranges. At rest, ALFF is higher and dominant in brain areas constituting the default mode network [Raichle et al., 2001] than in other regions [Yang et al., 2007; Zou et al., 2008]. In addition, ALFF also has been used to study disorders such as early Alzheimer's disease, attention deficit hyperactivity disorder (ADHD), post‐traumatic stress disorder, epilepsy, and schizophrenia [Hoptman et al., 2010; Huang et al., 2010; Wang et al., 2011; Yin et al., 2011; Zang et al., 2007; Zhang et al., 2008, 2010].
In this article, we implemented both ICA and ALFF analyses in order to achieve a comprehensive understanding of the resting‐state functional alterations involved in SAD. ICA functional connectivity reflects the level of integration of functional brain activity at the network level. Complementarily, ALFF measures reflect spontaneous synchronous neural activity at the voxel level.
Despite a multitude of studies describing altered functional brain activity in mood disorders, SAD remains largely unexplored. There are no previous fMRI studies addressing functional brain activity in SAD. Based on the core symptoms reported in SAD, we expected altered functional connectivity and ALFF in brain areas associated with attention (including middle frontal gyrus, middle temporal gyrus and lateral occipital cortex) and affective processing (including prefrontal cortex, amygdala, anterior cingulate, insula, cerebellum and limbic areas).
MATERIALS AND METHODS
Subjects
Given the fact that winter SAD is far more prevalent than summer SAD, the term SAD usually refers to winter SAD and is used accordingly in this article hereafter. This research is part of the ongoing SAD and light therapy project started in 2009 at Oulu University, Finland. In our study, patients with SAD were recruited through advertisements in two waves during January to February 2009 (first wave) and November 2009 to January 2010 (second wave) in the city of Oulu, Finland (latitude 65°01′N). The first wave represents the pilot study of the SAD and light therapy project, while the second wave represents the continuation of the same project. The ethical committee of Oulu University Hospital has approved the study for which the subjects have been recruited, and informed consent has been obtained from each subject individually according to the Helsinki declaration.
After signing the informed consent for participation in this study, all subjects were interviewed by an experienced psychiatrist (A.L. or M.T.). Diagnostic and Statistical Manual of Mental Disorders [American Psychiatric Association, 1994] diagnoses for recurrent major depression (moderate or severe) were obtained using the Mini International Neuropsychiatric Interview (MINI) [Sheehan et al., 1998]. In addition, patients had to fulfill the diagnostic criteria for “seasonal pattern” according to DSM‐IV‐TR [American Psychiatric Association, 2000] (although the diagnostic criteria for “seasonal pattern” can be applied to a diagnosis of major depressive episodes in both bipolar (I and II) disorder and recurrent MDD [American Psychiatric Association, 2000], only patients with recurrent unipolar depression were included in the present study to increase the homogeneity). Forty‐five subjects (39.78 ± 10.64, 30 ♀, 15 ♂) were diagnosed with SAD.
The severity of depressive symptoms were assessed in the first wave by using the 17‐item Hamilton Depression Rating Scale (HAMD‐17) [Hamilton, 1960], and in the second wave by Structured Interview Guide for the Hamilton Depression Rating Scale, Seasonal Affective Disorders (SIGH‐SAD) [Williams et al., 1994]; in the first wave, those with HAMD‐17 sum score = 22, and in the second wave, those with HAMD‐21 (21‐item HAMD included in the SIGH‐SAD) sum score = 22 were included in the present study. Student's t‐test was used to compare the mean sum scores of HAMD‐17, and also the Mann–Whitney U test was also used to compare the number of earlier SAD episodes as well as the length of the current SAD episodes between wave 1 and wave 2. The statistical analyses were performed by using the SAS, version 9.2 (SAS Institute, Cary, NC).
The exclusion criteria were as follows: lifetime psychotic disorder, other concurrent DSM‐IV axis I except anxiety disorder, clinically significant DSM‐IV axis II disorder, substance abuse or dependence, tobacco smoking, life‐time suicide attempt or suicide ideations during the past month, unstable physical disorder, psychotropic medications or corresponding herbal preparations, bright light therapy for the current episode, ocular disorders except myopia/hyperopia. Furthermore, pregnant candidates were excluded. In addition, normal exclusion criteria for MRI scanning were used. All SAD patients except four had no comorbid physical disorders (in the second wave: the first patient with arterial hypertension controlled by an angiotensin II receptor antagonist; the second patient suffers from arterial hypertension and hypercholesterolemia controlled by angiotensin II receptor antagonist and statins, respectively; the third patient is diagnosed with androgenic alopecia which is controlled by finasteride; and the fourth patient suffers from menopausal syndrome, using estradiol).
Forty‐five age‐, gender‐ and ethnicity‐matched HCs (no concomitant medications) from the general population were recruited in different resting‐state studies (Dementia and multimodal estimation of brain oscillations, 22 and 23 respectively) (see Supporting Information Table S1). Beck Depression Inventory‐II (BDI‐II) was used to screen some of the HCs (22 subjects) to confirm the absence of a history of depression (BDI‐II < 5).
Imaging Methods and Data Preprocessing
The fMRI dataset we examined in the present study was identical with those we analyzed in our previous study [Abou Elseoud et al., 2011]. The detailed characteristics of the imaging methods and data preprocessing have been previously described [Abou Elseoud et al., 2011]. In brief, resting‐state BOLD data were collected from all subjects using the same protocol during the same winter period. Resting‐state BOLD data were collected on a GE Signa 1.5 T whole body system with an eight‐channel receive coil, using an EPI GRE sequence (TR 1,800 ms, TE 40 ms, 280 time points, 28 oblique axial slices, slice thickness 4 mm, interslice space 0.4, covering the whole brain, FOV 25.6 cm × 25.6 cm, with 64 × 64 matrix, parallel imaging factor 2, and a flip angle of 90°). T1‐weighted scans were imaged using three‐dimensional FSPGR BRAVO sequence (TR 12.1 ms, TE 5.2 ms, slice thickness 1.0 mm, FOV 24.0 cm, matrix 256 × 256, and flip angle 20°, and NEX 1) in order to obtain anatomical images for coregistration of the fMRI data to standard space coordinates.
Head motion in the fMRI data was corrected using multiresolution rigid body coregistration of volumes, as implemented in FSL 3.3 MCFLIRT software [Jenkinson et al., 2002]. Brain extraction was carried out for motion corrected BOLD volumes with optimization of the deforming smooth surface model, as implemented in FSL 3.3 BET software [Smith, 2002]. Then, the BOLD volumes were spatially smoothed with Gaussian kernel (7.5 mm FWHM) and voxel time series were high‐pass filtered using a Gaussian linear filter with a 100‐s cutoff. The FSL 4.1.4 fslmaths tool was used for these steps. Multiresolution affine coregistration as implemented in the FSL 4.1.4 FLIRT software [Jenkinson et al., 2002] was used to coregister mean nonsmoothed fMRI volumes to three‐dimensional FSPGR volumes of corresponding subjects, and three‐dimensional FSPGR volumes to the Montreal Neurological Institute (MNI) standard structural space template (available at: MNI152_T1_2mm_brain template included in FSL). However, for computational reasons pertaining to later analysis steps, 4 mm resolution was retained after spatial normalization.
ICA Analysis
In our previous study, we addressed the influence of ICA model order selection on the patterns of between‐group differences [Abou Elseoud et al., 2011]. However, the present study describes SAD functional connectivity alterations at its optimal hierarchical level as discussed in our previous work [Abou Elseoud et al., 2011]. ICA analysis has been conducted as previously described [Abou Elseoud et al., 2011]. Briefly, ICA analysis was carried out using FSL 4.1.4 MELODIC software implementing probabilistic independent component analysis (PICA) [Beckmann et al., 1995] (Fig. 1). Multisession temporal concatenation tool in MELODIC was used to perform PICA related preprocessing and data conditioning in group analysis setting. ICA using 70 independent component maps (IC maps) was applied to detect RSNs. The IC maps were thresholded using an alternative hypothesis test based on fitting a Gaussian/gamma mixture model to the distribution of voxel intensities within spatial maps [Beckmann et al., 2005] and controlling the local false‐discovery rate at P < 0.5. The between‐subject analysis of the resting data was carried out using a regression technique (dual regression) that allows for voxel‐wise comparisons of resting‐state fMRI [Abou Elseoud et al., 2011; Beckmann et al., 2009; Flippini et al., 2007; Littow et al., 2010; Veer et al., 2010].
Figure 1.
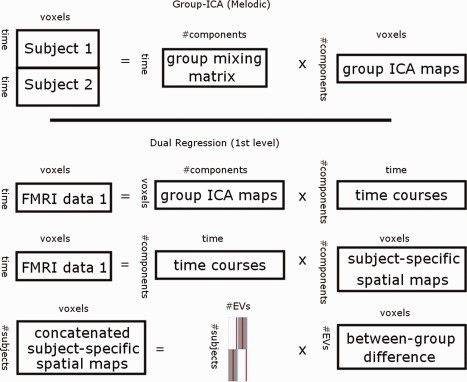
Top, Framework of the group independent component analysis (ICA) (concatenation approach, as implemented in MELODIC). Individual fMRI datasets are concatenated temporally (after performing group‐based PCA reduction on each individual fMRI dataset). Temporally concatenated group‐data reduced by principle component analysis (PCA) reduction. Then using ICA group ICA maps and group mixing matrix are estimated. Bottom, Dual‐regression approach involves (1) spatial regression of ICA maps into each subject's fMRI data to find subject‐specific time‐courses, (2) back regression of these time‐courses into the subject's fMRI data to detected subject‐specific ICA maps. Subject‐specific ICA maps enable voxel‐wise statistical testing across subjects, separately for each original group‐ICA map (to detect between‐group differences).
Statistical Analysis and Correction for Multiple Comparisons
First‐level multiple comparisons correction
Initially, between‐group statistical difference was assessed nonparametrically using permutation testing implemented in FSL's Randomise tool (v2.1), incorporating also threshold‐free cluster enhancement (TFCE) [Smith and Nichols, 2009] for cluster‐like statistic and use of maximal statistics for multiple comparisons correction. This involved deriving null distributions of TFCE‐values for the contrasts reflecting the between‐group effects by performing 5,000 random permutations of group labels and testing the difference between groups against distribution of maximal statistic values from all permutations [Nichols and Holmes, 2002]. This resulted in 22 RSNs with significant (P < 0.05, corrected for family‐wise errors for each RSN map separately) increased functional connectivity (see Supporting Information Fig. S1). However, as we previously discussed [Abou Elseoud et al., 2011], current multiple comparison correction method corrects the results at the IC level, but does not adjust for the risk of Type 1 error (false positives) induced by increasing the number of components tested simultaneously at high model orders.
Second‐level multiple comparisons correction (inter‐RSN correction for ICA‐derived RSNs)
Temporally concatenated subject‐specific maps of each IC created by the initial dual‐regression run (regression of spatial ICs into each subject's four‐dimensional data) for each RSN were spatially concatenated in the y‐direction (Fig. 2). Then, statistical analysis using permutation testing (implemented in the FSL's Randomise tool, 10,000 random permutations) was performed on the resulted concatenated map (90 subjects temporally concatenated and 47 ICs spatially concatenated y‐direction).
Figure 2.
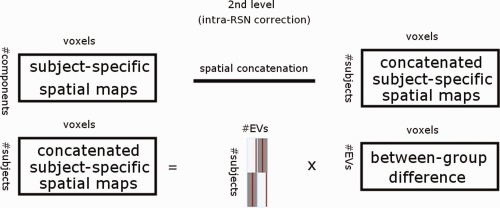
Inter‐RSN correction framework. Subject‐specific spatial ICA maps are spatially concatenated before permutation tests as a procedure to account for false positives when testing multiple ICA maps.
After brain extraction, voxels outside the brain are set to zero and consequently nonzero voxels in maps remain spatially disjoint after spatial concatenation. Therefore, the computation of TFCE‐statistic (and other cluster‐related statistics) in individual maps remain unaffected with respect to concatenation. In practice, the second‐level (inter‐RSN) multiple comparison correction computes maximal statistic for each permutation over TFCE‐statistics of all voxels of the concatenated maps (relative to the initial analysis that computes TFCE‐statistics in each map separately). Then, the resulting distribution of maximal values is used to derive threshold levels for P values.
The resulting statistical between‐group difference map was thresholded at P < 0.05 (corrected for family‐wise errors within and between all concatenated RSN maps), resampled into 2 mm, and then divided into 47 ICs.
ALFF Calculation
The ALFF was calculated with an approach similar to that used in previous studies [Lui et al., 2010; Yang et al., 2007]. Calculations were performed using REST software (available at: http://restfmri.net). Preprocessed datasets were resampled into 3 mm resolution. Linear trends were removed and a bandpass filtering (0.01–0.1 Hz) was performed to remove low‐frequency drift and high‐frequency respiratory and cardiac noise. Then, the filtered time series were transformed to frequency domain using fast Fourier‐transform (FFT) (parameters: taper percent = 0, FFT length = shortest) and the power spectrum was obtained. Since the power of a given frequency is proportional to the square of the amplitude of this frequency component in the original time series in time domain, the power spectrum obtained by FFT was square rooted and then averaged at each voxel. This averaged square root was taken as the ALFF. For normalization purposes, the ALFF of each voxel was divided by the global mean ALFF value to normalize data across subjects analogous to approaches used in PET studies [Raichle et al., 2001].
The FSL's Randomise tool was used to perform statistical analyses comparing SAD patients and HCs nonparametrically using permutation testing (5,000 random permutations). The resulting statistical map (ALFF) was resampled into 2 mm and thresholded at P < 0.05 (corrected for family‐wise errors) for illustration purposes.
Additionally, as a separate analysis, estimates of ALFF individual maps were included in the permutation test as a demeaned voxel‐wise covariate to test whether ALFF values have influenced the detected increased functional connectivity in the RSNs. Also, in order to assess the correlation between HAMD‐scores from the patients' group and ALFF/ ICA connectivity maps, HAMD‐scores have been included in the permutation testing of both ALFF and ICA analyses. Both ALFF and HAMD covariance tests were performed in the inter‐RSN y‐concatenated Randomise analysis with 10,000 permutations.
Anatomical Characterization of the Results
The Juelich histological atlas [Eickhoff et al., 2007] and the Harvard‐Oxford cortical and subcortical atlases (Harvard Center for Morphometric Analysis) provided with the FSL software were used to identify the anatomical characteristics of both RSNs and between‐group differences.
RESULTS
Psychological Data
The mean HAMD‐17 sum score in the first and second wave were 23.7 ± 1.9 and 22.5 ± 1.9, respectively. The mean SIGH‐SAD‐29 score in the second wave was 37.0 ± 4.7 with an Atypical Symptom Scale (HAMD 8‐item atypical) score of 12.7 ± 4.0. The median number of earlier SAD episodes in the first and in the second wave was 4.6 (2–7), and 6.0 (4–10), respectively (Table 1). Only six patients (two patients in the first wave and four in the second) reported having nonseasonal depressive episode (s) (Table 1).
Table 1.
Characteristics of the patients diagnosed with Seasonal Affective Disorder (SAD) in January to February 2009 (first wave) and November 2009 to January 2010 (second wave) in the city of Oulu, Finland (latitude 65°01′N)
| Wave I | Wave II | ||
|---|---|---|---|
| Age (yr) | 36.3 ± 7.2 | 42.9 ± 11.8 | P = 0.026 |
| Males (%) | x | y | |
| Mean HAMD‐17 | 23.7 ± 1.9 | 22.5 ± 1.9 | P = 0.045 |
| Mean HAMD‐21 | NA | 24.3 ± 2.1 | |
| Mean HAMD‐8‐item atypical | NA | 12.7 ± 4.0 | |
| Mean HAMD‐29 | NA | 37.0 ± 4.7 | |
| No. earlier SAD episodes | 4.5 (2.0–7.0) | 6.0 (4.0–10.0) | P = 0.098 |
| No. patients with earlier MDD‐periods SAD episodes | Two patients with one MDD‐period outside winter period | Three patients with 1 other MDD period; one patient with two other MDD periods | |
| Duration (in weeks) of the current SAD‐episode | 11.5 (8.0–14.0) | 9.0 (5.0–12.0) | P = 0.078 |
| Subjects with co‐occurring anxiety disorder | 1 Social phobia | 5 GAD | |
| 3 Social phobia | |||
| 1 Panic disorder |
HAMD = Hamilton depression rating scale; mean ± standard deviation; median (interquartile range).
Altered Functional Connectivity in SAD
Segmentation of the brain functionality into detailed subnetworks using a high model order ICA of 70 components yielded 47 RSNs. Our initial results (First‐level multiple comparisons correction) revealed that SAD patients compared with HCs showed statistically significant increases in functional connectivity in 22 RSNs out of the 47 identified networks (Supporting Information Fig. S1, Table 2). However, as previously discussed [Abou Elseoud et al., 2011], the applied multiple comparison correction method corrects the results at the IC level without adjusting for the risk of false positives induced by increasing the number of concurrently analyzed RSNs at high model orders. Therefore, we conducted an inter‐RSN correction (see Methods). This new approach revealed significant increased connectivity in 11 RSNs (Fig. 3, Table 2). However, interestingly, in the opposite contrast there were no significant reductions in functional connectivity in SAD patients compared to HCs.
Table 2.
Resting‐state networks (RSNs) showing increased functional connectivity in SAD
| 1st level correction P < 0.05 | Inter‐RSN correction P < 0.05 | ALFF voxel‐wise covariate P < 0.05 | ||||||||||||||||
|---|---|---|---|---|---|---|---|---|---|---|---|---|---|---|---|---|---|---|
| RSN | Voxels | X | Y | Z | Mean t‐score | Std | Voxels | X | Y | Z | Mean t‐score | Std | Voxels | X | Y | Z | Mean t‐score | Std |
| 1 | 534 | 20 | 44 | 64 | 2.9 | 0.34 | 2 | 20 | 44 | 64 | 4.65 | 0 | ||||||
| 2 | 373 | 66 | 46 | 62 | 3.24 | 0.39 | 31 | 66 | 46 | 62 | 4 | 0.1 | ||||||
| 3 | 261 | 60 | 50 | 62 | 3.45 | 0.55 | 24 | 60 | 50 | 62 | 4.9 | 0.31 | 5 | 60 | 48 | 62 | −l1.53 | 0.6 |
| 4 | 675 | 18 | 32 | 52 | 3.31 | 0.45 | 154 | 18 | 32 | 52 | 3.86 | 0.27 | 20 | 18 | 32 | 44 | 0.13 | 0.3 |
| 5 | 1036 | 46 | 24 | 44 | 2.89 | 0.36 | 27 | 46 | 24 | 44 | 3.94 | 0.21 | 10 | 48 | 24 | 44 | 0.46 | 0.48 |
| 6 | 1067 | 32 | 24 | 50 | 3 | 0.42 | 96 | 32 | 24 | 50 | 3.81 | 0.28 | 6 | 28 | 24 | 48 | 0.25 | 0.45 |
| 7 | 1205 | 74 | 84 | 34 | 2.75 | 0.36 | 90 | 46 | 16 | 34 | 3.68 | 0.08 | ||||||
| 8 | 723 | 36 | 22 | 30 | 3 | 0.4 | 36 | 36 | 22 | 30 | 4.42 | 0.19 | 8 | 36 | 22 | 30 | 13.34 | 9.49 |
| 9 | 1504 | 52 | 22 | 52 | 2.65 | 0.33 | 3 | 36 | 22 | 34 | 3.98 | 0.04 | ||||||
| 10 | 3903 | 26 | 18 | 36 | 2.94 | 0.54 | 2852 | 26 | 18 | 36 | 3.26 | 0.43 | 1083 | 26 | 22 | 30 | 0.84 | 0.74 |
| 11 | 2217 | 68 | 22 | 38 | 2.72 | 0.47 | 286 | 68 | 22 | 38 | 3.6 | 0.41 | 99 | 66 | 20 | 38 | 3.95 | 0.46 |
| 12 | 482 | 36 | 54 | 38 | 2.81 | 0.34 | ||||||||||||
| 13 | 123 | 32 | 72 | 56 | 2.96 | 0.28 | ||||||||||||
| 14 | 225 | 44 | 42 | 50 | 2.9 | 0.23 | ||||||||||||
| 15 | 1662 | 66 | 18 | 30 | 2.56 | 0.26 | ||||||||||||
| 16 | 54 | 12 | 64 | 46 | 3.42 | 0.25 | ||||||||||||
| 17 | 12 | 38 | 44 | 56 | 3.65 | 0.2 | ||||||||||||
| 18 | 150 | 62 | 32 | 50 | 3.1 | 0.29 | ||||||||||||
| 19 | 213 | 14 | 38 | 48 | 3.34 | 0.21 | ||||||||||||
| 20 | 322 | 60 | 62 | 40 | 3.84 | 0.29 | ||||||||||||
| 21 | 227 | 18 | 36 | 26 | 3.23 | 0.23 | ||||||||||||
| 22 | 949 | 68 | 80 | 56 | 2.96 | 0.29 | ||||||||||||
Results (corrected P < 0.05) are shown for the initially detected 22 resting‐state networks (RSNs), and for inter‐RSN correction (11 RSNs, P < 0.05). In addition, ALFF covariate results showed significant increased connectivity in 7 RSNs. Increased connectivity is demonstrated by, the number of voxels, mean t‐score, standard deviation and MNI coordinates (in mm). Numbering corresponds to the RSNs shown in Figure 3.
Figure 3.
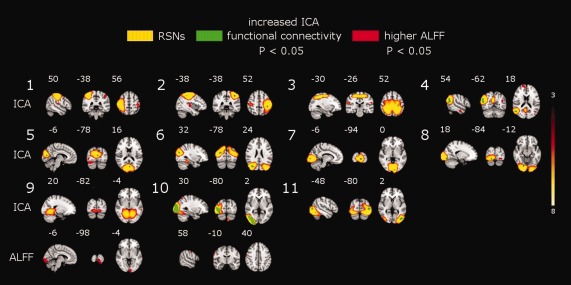
Top, Eleven resting‐state networks (RSNs) (red‐yellow) showing increased functional connectivity (green) in SAD patients. SAD‐related increased functional connectivity involves the sensorimotor (RSNs 1–3), attentional (RSN 4) and visual (RSNs 5–11) networks. The left hemisphere corresponds to the right side. The t‐score threshold is shown at the right. Numbers at the bottom left of the images refer to MNI coordinates (xyz). Bottom, ALFF between‐group difference map show significant higher ALFF in the visual and right sensorimotor cortex. Results are corrected for multiple comparisons (inter‐RSN correction, P < 0.05).
Sensorimotor and Attention Networks
SAD patients showed increased functional connectivity involving three different functional networks (Fig. 3, RSNs 1–3). The bilateral increased connectivity across the pre‐ and postcentral gyri might possibly indicate altered sensorimotor functions in SAD. RSN 4 consists of brain areas involved in attention and working memory. In this network, increased functional connectivity was detected in the right middle temporal gyrus, right angular gyrus and right lateral occipital cortex (Fig. 3, RSN 4).
Visual Networks
RSNs 5–11 show seven different functional networks covering most of the striate (primary visual cortex, V1) and extrastriate (V2 and V5) visual cortices (Fig. 3). At this level of functional segmentation (70 ICs), the visual cortex was segmented into 10 RSNs covering the entire visual cortex [Abou Elseoud et al., 2011]. SAD patients relative to HCs showed increased functional connectivity across a wide range of these visual cortical areas (see Table 2). This finding might possibly point toward altered visual processing of various visual properties such as motion, depth, color, shape, etc. [Grill‐Spector and Malach, 2004].
Regional Cerebral Function
SAD patients relative to HCs showed significant higher ALFF in two clusters distributed over the left visual and right motor cortex (Fig. 3, Table 3). SAD patients showed no significant reductions in ALFF compared to HCs.
Table 3.
ALFF results showed brain areas with significant higher ALFF in SAD patients compared with healthy controls
| Brain area | Voxels | X | Y | Z |
|---|---|---|---|---|
| Visual cortex V2 BA18 | 712 | 54 | 16 | 26 |
| Visual cortex V1 BA17 | 663 | 54 | 16 | 26 |
| Primary somatosensory cortex BA3b R | 122 | 16 | 56 | 58 |
| Primary somatosensory cortex BA1 R | 114 | 16 | 56 | 58 |
| Secondary somatosensory cortex | 103 | 12 | 62 | 48 |
| Primary motor cortex BA4p R | 84 | 16 | 56 | 58 |
| Primary somatosensory cortex BA2 R | 77 | 16 | 56 | 58 |
| Primary motor cortex BA4a R | 72 | 16 | 56 | 58 |
| Premotor cortex BA6 R | 65 | 16 | 57 | 58 |
| Primary somatosensory cortex BA3a R | 49 | 14 | 58 | 53 |
| Secondary somatosensory cortex | 33 | 12 | 58 | 52 |
| Broca's area BA44 R | 21 | 12 | 62 | 46 |
| Primary auditory cortex TE1.2 R | 14 | 12 | 60 | 40 |
Significant increases in ALFF (corrected for multiple comparisons, P < 0.05) are demonstrated by: the anatomical brain areas, number of voxels and MNI coordinates (in mm).
Including ALFF maps as a voxel‐wise covariate (as included in inter‐RSN correction) revealed significant increased connectivity in 11 RSNs (Table 2). Interestingly, the number of voxels with significant increased connectivity generally decreased. The new results revealed no significant increased connectivity in RSN 7. Moreover, HAMD‐score correlation analysis showed no significant correlation between HAMD‐scores and neither ALFF nor ICA functional connectivity in SAD patients.
DISCUSSION
To our knowledge, this is the first resting‐state fMRI study measuring regional amplitude of oxygenation fluctuations and functional network connectivity in antidepressant‐free SAD population. Our results revealed significant increased functional connectivity in SAD patients relative to HCs in a number of RSNs mainly involved in sensorimotor, attention, and visual processing, (Fig. 3, Table 2). In addition, SAD patients showed also significantly higher ALFF in the visual and right sensorimotor cortex. Importantly, increased functional connectivity was accompanied with higher ALFF in the left visual and right sensorimotor cortex (see Fig. 3). In this article, we will discuss in detail the ICA inter‐RSN correction results that represent statistically significant alterations in functional connectivity controlled for false positives present at high ICA model orders.
Patterns of resting‐state functional connectivity are significantly influenced by the anatomical and functional architecture of the brain [Honey et al., 2007]. SAD‐related increased functional connectivity was detected in widely distributed visual and sensorimotor networks, as well as in the attentional network. These connectivity changes indicate abnormal functional processing that possibly reflects less specialized cognitive processing, particularly in the visual and sensorimotor networks. Additionally, our results showed significant increased ALFF in the visual and right sensorimotor cortex. ALFF measures the amplitude of dynamic spontaneous activity fluctuation within a single voxel. At the voxel level, this may indicate that certain brain voxels (i.e. in the visual and right sensorimotor) tend to be functionally overactive. ALFF results support the detected pattern of increased ICA functional connectivity in the visual and sensorimotor networks. It also provides new insights into the stimulating effect of seasonal depression on visual and sensorimotor processing. Interestingly, ALFF covariant analysis still showed significant increased functional connectivity in all RSNs (except RSNs 1, 2, 7 and 9) that inter‐RSN correction yielded. Notably, ALFF covariant results revealed a general reduction in (see Table 2) the number of voxels with significant increased connectivity. In general, these findings indicate that ICA increased connectivity was influenced by the detected higher ALFF values in SAD patients. Although these results might suggest a linkage between increased ICA functional connectivity and ALFF in some RSNs, direct comparisons of ICA and ALFF results seem to be problematic due to their different nature and also differences in the level of noise corrections. Investigation of the relationship between ALFF and ICA connectivity at similar noise/artifact conditions will be mandatory before definite conclusions can be made.
A previous PET study has shown lower global metabolic rate (results uncorrected) in seven patients with SAD compared with HCs [Cohen et al., 1992]. However, on the other hand, our results revealed significantly increased functional connectivity and ALFF in SAD patients compared with HCs. Discrepancies in the results can be attributed to (1) different sample sizes, (2) multiple comparisons correction, (3) possible biological differences between the two patient populations, or (4) methodological differences between the two studies.
Primary Sensory Networks
A wide range of functional networks with altered connectivity were located mostly in the occipital cortex (striate and extrastriate). These networks (RSNs 5–11) also exhibit most of the functional connectivity increases among the entire 11 RSNs (see Table 2). Similarly, higher ALFF was detected in the visual cortex. These findings are consistent with results showing increased occipital activity in depressed individuals that has been attributed to a reduction in γ‐aminobutyric acid (GABA) concentration [Sanacora et al., 1999, 1998]. Sensorimotor impairment in the form of cortical and subcortical sensorimotor deficits has been reported in depressed subjects compared to HCs [Davis et al., 2010]. Psychomotor symptoms associated with depressed mood are often thought to have an impact on both the speed of thinking and the execution of motor responses [Sobin and Sackeim, 1997]. Our results showed increases in functional connectivity involving premotor areas, primary motor and somatosensory cortices (RSN 1–3), as well as higher ALFF in the right motor cortex. These findings might possibly explain some previously reported cognitive impairments associated with SAD, e.g., perception, attention, memory retrieval [Michalon et al., 1997; O'Brien et al., 1993; Sullivan and Payne, 2007].
Attention Network
Attention deficit is a common symptom in SAD patients [Sigmon et al., 2007; Spinks and Dalgleish, 2001]. Our findings reflect selective changes of functional connectivity in RSN 4 involving brain areas associated with attention processing. According to cognitive theory, attention in individuals suffering from SAD is directed toward negative content stimuli due to negative schema. Attentional bias has been demonstrated when, compared with healthy subjects, SAD patients have taken longer time to color name words that carry negative content compared with neutral or positive words [Drake et al., 1996; Sigmon et al., 2007; Spinks and Dalgleish, 2001]. In addition, cognitive models of depression propose that attentional bias plays a role in the development and maintenance of depression [Beck et al., 1979]. Increased functional connectivity in the right attention network (right lateral occipital cortex, right middle temporal gyrus, and angular gyrus) may suggest abnormally enhanced attentional processing, which may underlie the delay in coloring words with negative content.
Brain Areas Associated With Affective Processing
As mentioned earlier, the current study aimed to study resting‐state activity in SAD at both the functional network level and the voxel level, in order to provide better understanding of resting‐state functional alterations in SAD. Both HAMD‐17 and SIGH‐SAD scores for our sample of SAD patients indicate severe depressive state. Previous studies in mood disorders have reported functional alterations in brain regions commonly associated with affective processing [Chai et al., 2011; Passarotti et al., 2011; Van den Heuvel et al., 2011; Veer et al., 2010]. Our results (inter‐RSN correction) revealed no significant changes in functional connectivity or ALFF in those brain areas associated with affective processing, such as the amygdala, prefrontal cortex, anterior cingulate, insula, striatum, cerebellum or limbic areas. However, our initial ICA results (first level) notably showed abnormal increased connectivity in brain areas involved in mood processing, including the prefrontal cortex, caudate and hippocampus (see Supporting Information Fig. S1). Importantly, the inter‐RSN correction is a more conservative approach that results in eliminating not only false positives, but also to some extent has the possibility of removing some true effects. Alternatively, it might be that the mood processing component of SAD is not as functionally pronounced as in other mood disorders such as MDD.
Methodological Considerations
As we mentioned earlier, the main focus of this study was to explore resting‐state functional brain alterations in SAD. Therefore, detailed discussion of the newly introduced methods for corrections is beyond the scope of this article. However, it is important to briefly discuss the following point: the analysis involving concatenation all identified 47 RSNs (inter‐RSN) showed significant increased connectivity in 11 RSNs. Notably, the number of brain voxels showing significant increased connectivity reduced (Table 2). This reduction is probably due to increasing the number of the voxels being tested (47 maps) producing increasing number of large (TFCE) statistics for each permutation. The computation of maximal statistic for each permutation over all voxels picks up these additional large values making the tails of maximal value distribution larger. Consequently, as P values are computed from this widened distribution some of the previously detected voxels fail to exceed the resulted threshold (P < 0.05). In addition to that, applying Bonferroni correction as a conservative multiple comparison correction to the RSNs from the initial dual‐regression analysis would mean using a threshold of α = αFEW V, where V is the number of tests (for V = 47, P < 0.00106). Notably, thresholding the significant differences from the original analysis using that threshold results in no voxels surviving the Bonferroni correction in all RSNs. These findings are encouraging for ICA‐based analyses in which it is important to control for false positives, and meanwhile inter‐RSN correction can be applied without being too conservative.
Previously, we have shown that the number of RSNs showing significant between‐group difference increases as a function of ICA model order [Abou Elseoud et al., 2011]. Moreover, using the same data, eight model orders were previously estimated in order to optimize the level at which between‐group differences were finely described [Abou Elseoud et al., 2011]. ICA high model orders relative to lower model orders are known to incorporate higher rates of false positives. In this article, we demonstrate that inter‐RSN correction could be used to control for false positives encountered at high model orders. Therefore, based on these findings we suggest performing the inter‐RSN correction in conjunction with model order optimization.
The limitations of our study were as follows. First, with regard to diagnostic tools, SIGH‐SAD was not used in the pilot phase (Wave I) of the study. However, in Wave I, the depressive symptoms of patients with SAD were severe even according to HAMD‐17, and only two patients had a history of only one earlier nonseasonal depression episode. Given the fact that a diagnosis of depression was ascertained by MINI, and also that the DSM‐IV‐TR criteria were used to diagnose the seasonal pattern of SAD, we believe that our patients represent a clear cut SAD population. Second, the prevalence of a comorbid anxiety disorder in depressed patients is very high. Therefore, it is practically difficult to conduct a mood disorder investigation in the absence of accompanying anxiety. In our study, 10 patients were diagnosed with a comorbid anxiety disorder (Table 1). Unlike nonseasonal MDD [Engels et al., 2010], the influence of comorbid anxiety in SAD is not well studied. Therefore, there is a need to explore the influence of SAD‐related comorbid anxiety in specifically designed studies with a larger sample size. In addition, in this study, our subjects were not matched for handedness.
In summary, we have demonstrated for the first time altered functional brain activity is unmedicated SAD population. Increased functional connectivity was detected in RSNs associated with visual, sensorimotor and attentional processing. Also, our findings showing convergent increased ALFF and functional connectivity might reflect less specialized cognitive processing in SAD. Further studies, particularly under task conditions, are needed in order to specifically investigate cognitive deficits in SAD.
Supporting information
Supporting Information Figure and Table.
ACKNOWLEDGMENTS
The granting bodies did not have any role in any of the following aspects of this study: design, data collection, management, data analysis and interpretation of results and findings, or preparation, review or manuscript approval. M.T. has been reimbursed by two medical companies (Wyeth and Pfizer) for attending two conferences, have been paid fee for speaking in different occasions by Eli Lilly, Astra Zeneca, BMS, and Pfizer. In addition, M.T. is a minor shareholder in Valkee Ltd. J.S. is a shareholder and CEO of Valkee Ltd. company (Oulu, Finland), which is a producer and developer of the bright light devices for SAD. A.A. is also a shareholder and CTO of Valkee Ltd. M.T. is also a minor shareholder in Valkee Ltd.
Jukka Remes ideated the subject‐wise spatial concatenation of ICA maps before permutation tests as a procedure to account for multiple comparisons at high‐model orders.
REFERENCES
- Abou Elseoud A, Littow H, Remes J, Starck T, Nikkinen J, Nissilä J, Timonen M, Tervonen O, Kiviniemi V (2011): Group‐ICA model order highlights patterns of functional brain connectivity. Front Syst Neurosci 5:37 [DOI] [PMC free article] [PubMed] [Google Scholar]
- Abou Elseoud A, Starck T, Remes J, Nikkinen J, Tervonen O, Kiviniemi V (2010): The effect of model order selection in group PICA. Hum Brain Mapp 31:1207–1216. [DOI] [PMC free article] [PubMed] [Google Scholar]
- American Psychiatric Association (1994): Diagnostic and Statistical Manual of Mental Disorders, Fourth editionWashington DC:American Psychiatric Association. [Google Scholar]
- American Psychiatric Association (2000): Diagnostic and Statistical Manual of Mental Disorders, Fourth edition, text revisionWashington DC:American Psychiatric Association. [Google Scholar]
- Anand A, Li Y, Wang Y, Wu J, Gao S, Bukhari L, Mathews VP, Kalnin A, Lowe MJ (2005): Activity and connectivity of brain mood regulating circuit in depression: A functional magnetic resonance study. Biol Psychiatry 57:1079–1088. [DOI] [PubMed] [Google Scholar]
- Beck AT, Rush AJ, Shaw BF, Emery G (1979): Cognitive Therapy of Depression.New York:Guilford Press. [Google Scholar]
- Beckmann CF, DeLuca M, Devlin JT, Smith SM (2005): Investigations into resting‐state connectivity using independent component analysis. Philos Trans R Soc Lond B Biol Sci 360:1001–1013. [DOI] [PMC free article] [PubMed] [Google Scholar]
- Beckmann CF, Mackay C, Filippini N, Smith SM, (2009): Group comparison of resting‐state FMRI data using multi‐subject ICA and dual regression. 15th Annual Meeting of Organization of Human Brain Mapping, June 18‐23, San Francisco, poster 441 SU‐AM.
- Beckmann CF, Smith SM (2004): Probabilistic independent component analysis for functional magnetic resonance imaging. IEEE Trans Med Imaging 23:137–152. [DOI] [PubMed] [Google Scholar]
- Biswal B, Yetkin FZ, Haughton VM, Hyde JS (1995): Functional connectivity in the motor cortex of resting human brain using echo‐planar MRI. Magn Reson Med 34:537–541. [DOI] [PubMed] [Google Scholar]
- Biswal BB, Ulmer JL (1999): Blind source separation of multiple signal sources of fMRI data sets using independent component analysis. J Comput Assist Tomogr 23:265–271. [DOI] [PubMed] [Google Scholar]
- Calhoun VD, Adali T, Pearlson GD, Pekar JJ (2001): Spatial and temporal independent component analysis of functional MRI data containing a pair of task‐related waveforms. Hum Brain Mapp 13:43–53. [DOI] [PMC free article] [PubMed] [Google Scholar]
- Calhoun VD, Eichele T, Pearlson G (2009): Functional brain networks in schizophrenia: A review. Front Hum Neurosci 3:17. [DOI] [PMC free article] [PubMed] [Google Scholar]
- Chai XJ, Whitfield‐Gabrieli S, Shinn AK, Gabrieli JD, Nieto Castañón A, McCarthy JM, Cohen BM, Ongür D (2011): Abnormal medial prefrontal cortex resting‐state connectivity in bipolar disorder and schizophrenia. Neuropsychopharmacology 36:2009–2017. [DOI] [PMC free article] [PubMed] [Google Scholar]
- Cohen RM, Gross M, Nordahl TE, Semple WE, Oren DA, Rosenthal N (1992): Preliminary data on the metabolic brain pattern of patients with winter seasonal affective disorder. Arch Gen Psychiatry 49:545–552. [DOI] [PubMed] [Google Scholar]
- Cordes D, Haughton VM, Arfanakis K, Wendt GJ, Turski PA, Moritz CH, Quigley MA, Meyerand ME (2000): Mapping functionally related regions of brain with functional connectivity in the cerebral cortex in “resting‐state” data. Am J Neuroradiol 22:1326–1333. [Google Scholar]
- Davis AS, Horwitz JL, Noggle CA, Dean RS, Davis KM (2010): Cortical and subcortical sensorimotor impairment in patients with major depression: A preliminary analysis. Int J Neurosci 120:352–354. [DOI] [PubMed] [Google Scholar]
- Drake CL, Schwartz PJ, Turner EH, Rosenthal NE (1996): Cognitive performance in seasonal affective disorder: Pattern recognition and the Stroop task. J Nerv Ment Dis 184:56–59. [DOI] [PubMed] [Google Scholar]
- Eickhoff SB, Paus T, Caspers S, Grosbras MH, Evans AC, Zilles K, Amunts K (2007): Assignment of functional activations to probabilistic cytoarchitectonic areas revisited. Neuroimage 36:511–521. [DOI] [PubMed] [Google Scholar]
- Engels AS, Heller W, Spielberg JM, Warren SL, Sutton BP, Banich MT, Miller GA (2010): Co‐occurring anxiety influences patterns of brain activity in depression. Cogn Affect Behav Neurosci 10:141–156. [DOI] [PMC free article] [PubMed] [Google Scholar]
- Filippini N, Maclntosh B, Hough M, Goodwin G, Frisoni G, Smith S, Matthews P, Beckmann C, Mackay C (2009): Distinct patterns of brain activity in young adults carrying the APOE‐ε4 allele. Proc Natl Acad Sci USA 106:7209–7214. [DOI] [PMC free article] [PubMed] [Google Scholar]
- Fox MD, Snyder AZ, Vincent JL, Corbetta M, Van Essen DC, Raichle ME (2005): The human brain is intrinsically organized into dynamic, anticorrelated functional networks. Proc Natl Acad Sci USA 102:9673–9678. [DOI] [PMC free article] [PubMed] [Google Scholar]
- Garrity AG, Pearlson GD, McKiernan K, Lloyd D, Kiehl KA, Calhoun VD (2007): Aberrant “default mode” functional connectivity in schizophrenia. Am J Psychiatry 164:450–457. [DOI] [PubMed] [Google Scholar]
- Greicius MD, Flores BH, Menon V, Glover GH, Solvason HB, Kenna H, Reiss AL, Schatzberg AF (2007): Resting‐state functional connectivity in major depression: Abnormally increased contributions from subgenual cingulate cortex and thalamus. Biol Psychiatry 62:429–437. [DOI] [PMC free article] [PubMed] [Google Scholar]
- Greicius MD, Krasnow B, Reiss AL, Menon V (2003): Functional connectivity in the resting brain: A network analysis of the default mode hypothesis. Proc Natl Acad Sci USA 100:253–258. [DOI] [PMC free article] [PubMed] [Google Scholar]
- Greicius MD, Srivastava G, Reiss AL, Menon V (2004): Default‐mode network activity distinguishes Alzheimer's disease from healthy aging: evidence from functional MRI. Proc Natl Acad Sci USA 101:4637–4642. [DOI] [PMC free article] [PubMed] [Google Scholar]
- Grill‐Spector K, Malach R (2004): The human visual cortex. Annu Rev Neurosci 27:649–677. [DOI] [PubMed] [Google Scholar]
- Hamilton M (1960): A rating scale for depression. J Neurol Neurosurg Psychiatry 23:56–62. [DOI] [PMC free article] [PubMed] [Google Scholar]
- Hoptman MJ, Zuo XN, Butler PD, Javitt DC, D'Angelo D, Mauro CJ, Milham MP (2010): Amplitude of low‐frequency fluctuations in schizophrenia: a resting state fMRI study. Schizophr Res 117:13–20. [DOI] [PMC free article] [PubMed] [Google Scholar]
- Huang XQ, Lui S, Deng W, Chan RC, Wu QZ, Jiang LJ, Zhang JR, Jia ZY, Li XL, Li F, Chen L, Li T, Gong QY (2010): Localization of cerebral functional deficits in treatment‐naive, first‐episode schizophrenia using resting‐state fMRI. Neuroimage 49:2901–2906. [DOI] [PubMed] [Google Scholar]
- Honey CJ, Kotter R, Breakspear M, Sporns O (2007): Network structure of cerebral cortex shapes functional connectivity on multiple time scales. Proc Natl Acad Sci USA 104:10240–10245. [DOI] [PMC free article] [PubMed] [Google Scholar]
- Jacobsen FM, Wehr TA, Sack DA, James SP, Rosenthal NE (1987): Seasonal affective disorder: A review of the syndrome and its public health implications. Am J Public Health 77:57–60. [DOI] [PMC free article] [PubMed] [Google Scholar]
- Jafri MJ, Pearlson GD, Stevens M, Calhoun VD (2008): A method for functional network connectivity among spatially independent resting‐state components in schizophrenia,Neuroimage 39:1666–1168. [DOI] [PMC free article] [PubMed] [Google Scholar]
- Jenkinson M, Bannister P, Brady M, Smith S (2002): Improved optimization for the robust and accurate linear registration and motion correction of brain images. Neuroimage 17:825–841. [DOI] [PubMed] [Google Scholar]
- Kiviniemi V, Kantola JH, Jauhiainen J, Hyvarinen A, Tervonen O (2003): Independent component analysis of nondeterministic fMRI signal sources. Neuroimage 19:253–260. [DOI] [PubMed] [Google Scholar]
- Kiviniemi V, Starck T, Remes J, Long X, Nikkinen J, Haapea M, Veijola J, Moilanen I, Isohanni M, Zang YF, Tervonen O (2009): Functional segmentation of the brain cortex using high model order group PICA. Hum Brain Mapp 30:3865–3886. [DOI] [PMC free article] [PubMed] [Google Scholar]
- Lewy AJ (1999): The dim light melatonin onset, melatonin assays and biological rhythms research in humans. Biol Signals Recept 8:79–83. [DOI] [PubMed] [Google Scholar]
- Lewy AJ, Lefler BJ, Emens JS, Bauer VK (2006): The circadian basis of winter depression. Proc Natl Acad Sci USA 103:7414–7419. [DOI] [PMC free article] [PubMed] [Google Scholar]
- Lewy AJ, Sack RL, Miller LS, Hoban TM (1987): Antidepressant and circadian phase‐shifting effects of light. Science 235:352–354. [DOI] [PubMed] [Google Scholar]
- Littow H, Abou Elseoud A, Haapea M, Isohanni M, Moilanen I, Mankinen K, Nikkinen J, Rahko J, Rantala H, Remes J, Starck T, Tervonen O, Veijola J, Beckmann C, Kiviniemi VJ (2010): Age‐related differences in functional nodes of the brain cortex—A high model order group ICA study. Front Syst Neurosci 4:32. [DOI] [PMC free article] [PubMed] [Google Scholar]
- Lowe MJ, Dzemidzic M, Lurito JT, Mathews VP, Phillips MD (2000): Correlations in low‐frequency BOLD fluctuations reflect cortico‐cortical connections. Neuroimage 12:582–587. [DOI] [PubMed] [Google Scholar]
- Lowe MJ, Phillips MD, Lurito JT, Mattson D, Dzemidzic M, Mathews VP (2002): Multiple sclerosis: Low‐frequency temporal blood oxygen level‐dependent fluctuations indicate reduced functional connectivity initial results. Radiology 224:184–192. [DOI] [PubMed] [Google Scholar]
- Lui S, Li T, Deng W, Jiang L, Wu Q, Tang H, Yue Q, Huang X, Chan RC, Collier DA, Meda SA, Pearlson G, Mechelli A, Sweeney JA, Gong Q (2010): Short‐term effects of antipsychotic treatment on cerebral function in drug‐naive first‐episode schizophrenia revealed by “resting state” functional magnetic resonance imaging. Arch Gen Psychiatry 67:783–792. [DOI] [PubMed] [Google Scholar]
- Lui S, Ouyang L, Chen Q, Huang X, Tang H, Chen H, Zhou D, Kemp GJ, Gong Q (2008): Differential interictal activity of the precuneus/posterior cingulate cortex revealed by resting state functional MRI at 3T in generalized vs. partial seizure. J Magn Reson Imaging 27:1214–1220. [DOI] [PubMed] [Google Scholar]
- Mckeown MJ, Jung TP, Makeig S, Brown G, Kindermann SS, Lee TW, Seinowski TJ (1998): Spatially independent activity patterns in functional MRI data during the stroop color‐naming task. Proc Natl Acad Sci USA 95:803–810. [DOI] [PMC free article] [PubMed] [Google Scholar]
- Michalon M, Eskes GA, Mate‐Kole CC (1997): Effects of light therapy on neuropsychological function and mood in seasonal affective disorder. J Psychiatry Neurosci 22:19–28. [PMC free article] [PubMed] [Google Scholar]
- Mohammadi B, Kollewe K, Samii A, Krampfl K, Dengler R, Münte T (2009): Changes of resting state brain networks in amyotrophic lateral sclerosis. Exp Neurol 217:147–153. [DOI] [PubMed] [Google Scholar]
- Nichols TE, Holmes AP (2002): Nonparametric permutation tests for functional neuroimaging: A primer with examples. Hum Brain Mapp 15:1–25. [DOI] [PMC free article] [PubMed] [Google Scholar]
- Nicolelis MA, Shuler M (2001): Thalamocortical and corticocortical interactions in the somatosensory system. Prog Brain Res 130:90–110. [PubMed] [Google Scholar]
- O'Brien JT, Sahakian BJ, Checkley SA (1993): Cognitive impairments in patients with seasonal affective disorder. Br J Psychiatry 163:338–343. [DOI] [PubMed] [Google Scholar]
- Passarotti AM, Sweeney JA, Pavuluri MN (2011): Fronto‐limbic dysfunction in mania pre‐treatment and persisitnent amygdala over activity post‐treatment in pediatric bipolar disorder. Psychopharmacology (Berl) 216:485–499. [DOI] [PMC free article] [PubMed] [Google Scholar]
- Raichle ME, MacLeod AM, Snyder AZ, Powers WJ, Gusnard DA, Shulman GL (2001): A default mode of brain function. Proc Natl Acad Sci USA 98:676–682. [DOI] [PMC free article] [PubMed] [Google Scholar]
- Rombouts SARB, Damoiseaux JS, Goekoop R, Barkhof F, Scheltens P, Smith SM, Beckmann CF (2009): Model‐free group analysis shows altered bold fMRI networks in dementia. Hum Brain Mapp 30:256–266. [DOI] [PMC free article] [PubMed] [Google Scholar]
- Rosenthal NE, Sack DA, Gillin JC, Lewy AJ, Goodwin FK, Davenport Y, Mueller PS, Newsome DA, Wehr TA (1984): Seasonal affective disorder. A description of the syndrome and preliminary findings with light therapy. Arch Gen Psychiatry 41:72–80. [DOI] [PubMed] [Google Scholar]
- Sanacora G, Gueorguieva R, Epperson CN, Wu YT, Appel M, Rothman DL, Krystal JH, Mason GF (2004): Subtype‐specific alterations of gamma‐aminobutyric acid and glutamate in patients with major depression. Arch Gen Psychiatry 61:705–713. [DOI] [PubMed] [Google Scholar]
- Sanacora G, Mason GF, Rothman D, Behar K, Hyder F, Petroff O (1999): Reduced cortical g‐aminobutyric acid levels in depressed patients determined by proton magnetic spectroscopy. Arch Gen Psychiatry 56:1043–1047. [DOI] [PubMed] [Google Scholar]
- Seeley WW, Crawford RK, Zhou J, Miller BL, Greicius MD (2009): Neurodegenerative diseases target large‐scale human brain networks. Neuron 62:42–52. [DOI] [PMC free article] [PubMed] [Google Scholar]
- Sheehan DV, Lecrubier Y, Sheehan KH, Amorim P, Janavs J, Weiller E, Hergueta T, Baker R, Dunbar GC (1998): The Mini‐International Neuropsychiatric Interview (M.I.N.I.): The development and validation of a structured diagnostic psychiatric interview for DSM‐IV and ICD‐10. J Clin Psychiatry 59(Suppl 20):S22–S33, quiz 34‐57. [PubMed] [Google Scholar]
- Sheline YI, Prince JL, Yan Z, Mintun MA (2010): Resting‐state functional MRI in depression unmasks increased connectivity between networks via the dorsal nexus. Proc Natl Acad Sci USA 107:11020–11025. [DOI] [PMC free article] [PubMed] [Google Scholar]
- Sigmon S, Whitcomb‐Smith S, Boulard N, Pells J, Hermann B, Edenfield T, Lamattina S, Schartel J (2007): Seasonal reactivity: Attentional bias and psychophysiological arousal in seasonal and nonseasonal depression. Cogn Ther Res 31:619–638. [DOI] [PubMed] [Google Scholar]
- Smith SM (2002): Fast robust automated brain extraction. Hum Brain Mapp 17:143–155. [DOI] [PMC free article] [PubMed] [Google Scholar]
- Smith SM, Nichols TS (2009): Threshold‐free cluster enhancement: Addressing problems of smoothing, threshold dependence and localisation in cluster inference. Neuroimage 44:83–98. [DOI] [PubMed] [Google Scholar]
- Sobin C, Sackeim HA (1997): Psychomotor symptoms of depression. Am J Psychiatry 154:4–17. [DOI] [PubMed] [Google Scholar]
- Spinks H, Dalgleish T (2001): Attentional processing and levels of symptomatology in seasonal affective disorder (SAD): A preliminary longitudinal study. J Affect Disord 62:229–232. [DOI] [PubMed] [Google Scholar]
- Sullivan B, Payne TW (2007): Affective disorders and cognitive failures: A comparison of seasonal and nonseasonal depression. Am J Psychiatry 164:1663–1667. [DOI] [PubMed] [Google Scholar]
- Van den Heuvel OA, Mataix‐Cols D, Zwitser G, Cath DC, Van der Werf YD, Groenewegen HJ, Van Balkom AJ, Veltman DJ (2011): Common limbic and frontal‐striatal disturbances in patients with obsessive compulsive disorder, panic disorder and hypochondriasis. Psychol Med 5:1–12. [DOI] [PubMed] [Google Scholar]
- Veer IM, Beckmann CF, van Tol MJ, Ferrarini L, Milles J, Veltman DJ, Aleman A, van Buchem MA, van der Wee NJ, Rombouts SA (2010): Whole brain resting‐state analysis reveals decreased functional connectivity in major depression. Front Syst Neurosci 4:41. [DOI] [PMC free article] [PubMed] [Google Scholar]
- Wang Z, Yan C, Zhao C, Qi Z, Zhou W, Lu J, He Y, Li K (2011): Spatial patterns of intrinsic brain activity in mild cognitive impairment and Alzheimer's disease: A resting‐state functional MRI study. Hum Brain Mapp 32:1720–1740. [DOI] [PMC free article] [PubMed] [Google Scholar]
- Wehr TA, Duncan WC Jr, Sher L, Aeschbach D, Schwartz PJ, Turner EH, Postolache TT, Rosenthal NE (2001): A circadian signal of change of season in patients with seasonal affective disorder. Arch Gen Psychiatry 58:1108–1114. [DOI] [PubMed] [Google Scholar]
- Williams J, Link M, Rosenthal N, Terman M (1988): Structured Interview Guide for the Hamilton Depression Rating Scale‐Seasonal Affective Disorder Version (SIGH‐SAD).New York:New York Psychiatric Institute. [Google Scholar]
- Wolf RC, Sambataro F, Vasic N, Schönfeldt‐Lecuona C, Ecker D, Landwehrmeyer B (2008): Aberrant connectivity of lateral prefrontal networks in presymptomatic Huntington's disease. Exp Neurol 213:137–144. [DOI] [PubMed] [Google Scholar]
- Yang H, Long XY, Yang Y, Yan H, Zhu CZ, Zhou XP, Zang YF, Gong QY (2007): Amplitude of low frequency fluctuation within visual areas revealed by resting‐state functional MRI. Neuroimage 36:144–152. [DOI] [PubMed] [Google Scholar]
- Yin Y, Li L, Jin C, Hu X, Duan L, Eyler LT, Gong Q, Song M, Jiang T, Liao M, Zhang Y, Li W (2011): Abnormal baseline brain activity in posttraumatic stress disorder: A resting‐state functional magnetic resonance imaging study. Neurosci Lett 498:185–189. [DOI] [PubMed] [Google Scholar]
- Zang YF, He Y, Zhu CZ, Cao QJ, Sui MQ, Liang M, Tian LX, Jiang TZ, Wang YF (2007): Altered baseline brain activity in children with ADHD revealed by resting‐state functional MRI. Brain Dev 29:83–91. [DOI] [PubMed] [Google Scholar]
- Zhang D, Snyder AZ, Fox MD, Sansbury MW, Shimony JS, Raichle ME (2008): Intrinsic functional relations between human cerebral cortex and thalamus. J Neurophysiol 100:1740–1748. [DOI] [PMC free article] [PubMed] [Google Scholar]
- Zhang D, Snyder AZ, Shimony JS, Fox MD, Raichle ME (2010): Noninvasive functional and structural connectivity mapping of the human thalamocortical system. Cereb Cortex 20:1187–1194. [DOI] [PMC free article] [PubMed] [Google Scholar]
- Zhang Z, Lu G, Zhong Y, Tan Q, Yang Z, Liao W, Chen Z, Shi J, Liu Y (2009): Impaired attention network in temporal lobe epilepsy: A resting fMRI study. Neurosci Lett 458:97–101. [DOI] [PubMed] [Google Scholar]
- Zhou Y, Yu C, Zheng H, Liu Y, Song M, Qin W, Li K, Jiang T (2009): Increased neural resources recruitment in the intrinsic organization in major depression. J Affect Disord 121:220–230. [DOI] [PubMed] [Google Scholar]
- Zou QH, Zhu CZ, Yang Y, Zuo XN, Long XY, Cao QJ, Wang YF, Zang YF (2008): An improved approach to detection of amplitude of low‐frequency fluctuations (ALFF) for resting‐state fMRI: Fractional ALFF. J Neurosci Methods 172:137–141. [DOI] [PMC free article] [PubMed] [Google Scholar]
Associated Data
This section collects any data citations, data availability statements, or supplementary materials included in this article.
Supplementary Materials
Supporting Information Figure and Table.