

Abstract
Theoretical models of addiction suggest that a substance use disorder represents an imbalance between hypersensitive motivational processes and deficient regulatory executive functions. Working‐memory (a central executive function) may be a powerful predictor of the course of drug use and drug‐related problems. Goal of the current functional magnetic resonance imaging study was to assess the predictive power of working‐memory network function for future cannabis use and cannabis‐related problem severity in heavy cannabis users. Tensor independent component analysis was used to investigate differences in working‐memory network function between 32 heavy cannabis users and 41 nonusing controls during an N‐back working‐memory task. In addition, associations were examined between working‐memory network function and cannabis use and problem severity at baseline and at 6‐month follow‐up. Behavioral performance and working‐memory network function did not significantly differ between heavy cannabis users and controls. However, among heavy cannabis users, individual differences in working‐memory network response had an independent effect on change in weekly cannabis use 6 months later (ΔR 2 = 0.11, P = 0.006, f 2 = 0.37) beyond baseline cannabis use (ΔR 2 = 0.41) and a behavioral measure of approach bias (ΔR 2 = 0.18): a stronger network response during the N‐back task was related to an increase in weekly cannabis use. These findings imply that heavy cannabis users requiring greater effort to accurately complete an N‐back working‐memory task have a higher probability of escalating cannabis use. Working‐memory network function may be a biomarker for the prediction of course and treatment outcome in cannabis users. Hum Brain Mapp 35:2470–2482, 2014. © 2013 Wiley Periodicals, Inc.
Keywords: cannabis, working‐memory, fMRI, N‐back, cannabis use disorder
INTRODUCTION
There is great variability in individual vulnerability to develop Substance Use Disorders [SUDs; see review: Swendsen and Le Moal, 2011]. Epidemiological studies estimate that one of 10 weekly cannabis users develops a cannabis use disorder [Degenhardt et al., 2008]. To prevent those cannabis users from lapsing into chronic abuse, better understanding of neurobiological processes underlying the progression from recreational substance use toward SUDs is needed.
Despite awareness of reasons why not to use, someone with a SUD continues to use. Theoretical models suggest that SUDs are related to an imbalance between motivational processes and regulatory executive functions [Koob and Volkow, 2010; Robinson and Berridge, 2003; Wiers et al., 2007]: Potent and relatively automatically triggered motivations to use (craving; cue‐reactivity) combined with deficient executive resources (e.g., disinhibition) promote escalation of substance use and relapse after abstinence. Therefore, individual differences in executive functioning may be an important contributor to the individual risk to develop SUDs.
Working memory is a central executive function that refers to the capacity to maintain and manipulate online information and its integrity is required for a broad range of cognitive functions [Baddeley, 2010; Kane and Engle, 2002]. Working‐memory capacity constrains attentional control and is especially important when interfering signals trigger behavioral tendencies conflicting with pursued goals [Kane and Engle, 2002]. This suggests that when motivational processes to use are strong, people with good working‐memory are better equipped to resist drugs than people with poor working‐memory. Indeed, recent studies have shown that individual differences in working‐memory capacity moderate the relationship between cognitive motivational processes and (future) substance use [Grenard et al., 2008; Thush et al., 2008]. Moreover, interventions that train working‐memory have been found effective in improving cognitive dysfunction in stimulant dependent individuals [Bickel et al., 2011], and in reducing alcohol intake in problem drinkers [Houben et al., 2011]. Also, both acute and chronic substance uses (including cannabis) have been associated with working‐memory impairments [Fernandez‐Serrano et al., 2011]. These findings suggest a bidirectional relationship between working‐memory and SUDs and underscore the potential of working‐memory improvement as a tool in prevention and treatment.
The neural network underlying working‐memory has been well characterized. It involves a widespread fronto‐parietal network including the dorsolateral prefrontal cortex (DLPFC), ventrolateral prefrontal cortex (VLPFC), premotor cortex, lateral/medial parietal cortex, paracingulate gyrus, and frontal pole [Owen et al., 2005; Wager and Smith, 2003]. Working‐memory tasks generally require sustained attention, information storage, memory for temporal order, updating, and manipulation of information. In an attempt to map these functions onto the working‐memory network, a meta‐analysis of 60 studies [Wager and Smith, 2003] indicated that the parietal lobe responds to executive demand with a dorsal–ventral dissociation between processing of spatial and nonspatial information, respectively. The prefrontal cortex shows a less clear dorsal–ventral dissociation between executive demand and simple information storage, the premotor cortex and DLPFC responding most strongly during updating and remembering temporal order, whereas information manipulation is associated with DLPFC, VLPFC, and frontal pole activation. The paracingulate gyrus is involved when sustained attention is required to perform the task. As working‐memory integrity is required for many cognitive functions, numerous cognitive tasks activate this network, and therefore, it has been referred to as a more general task‐positive network [Fox et al., 2005].
Cannabis use has been shown to affect working‐memory network function. Heavy cannabis use has been associated with hyperactivity of the network during a working‐memory task, despite normal performance [e.g., Jacobsen et al., 2007; Jager et al., 2010; Kanayama et al., 2004; Padula et al., 2007; Schweinsburg et al., 2010]. These findings support the hypothesis that cannabis users need additional effort to perform the task, reflected in higher working‐memory network activations. Alternatively, it has also been suggested that cannabis users engage in a compensatory task strategy by recruiting additional brain areas [e.g., Kanayama et al., 2004; Padula et al., 2007; Schweinsburg et al., 2010]. Within cannabis users working‐memory network function appears to interact with onset of cannabis use [Becker et al., 2010], nicotine withdrawal [Jacobsen et al., 2007], and alcohol use [Schweinsburg et al., 2011]. There are also indications that cannabis abstinence may result in recovery of working‐memory [Hanson et al., 2010] and underlying network function [Schweinsburg et al., 2010].
To the best of our knowledge, there are no published studies investigating the predictive power of working‐memory network function for future substance use. Given its suggested role in the development of SUDs, the goal of the present study was to assess the predictive power of working‐memory network function for future cannabis use and problem severity. A community sample of 32 heavy cannabis users and 41 noncannabis using matched controls performed an N‐back working memory task during which brain activity was recorded. Tensor independent component analysis [Tensor‐ICA, Beckmann and Smith, 2005] was used to identify and investigate functional characteristics of the working‐memory network [Owen et al., 2005; Wager and Smith, 2003]. ICA is a well‐established model‐free method to detect functional connectivity networks, and the tensorial extension provides a tool to simultaneously assess temporal, spatial, and intersubject network dynamics during a task [Beckmann and Smith, 2005]. In contrast to univariate analyses based on the general linear model (GLM), ICA provides information about the interactions between different areas, rather than information about activation amplitude of single areas. Given that cognitive deficits in neuropsychiatric disorders are generally not restricted to a single brain region [Kim et al., 2009], multivariate approaches like ICA may prove to be more sensitive than standard GLM analyses. We expected stronger working‐memory network response in heavy cannabis users compared to controls. Moreover, we expected individual differences in network response strength to predict cannabis use and problem severity after 6 months. We further aimed to establish the unique variance explained by this method after controlling for simpler (and cheaper) behavioral indices predicting cannabis use and problem severity.
MATERIALS AND METHODS
The present study was part of a prospective study investigating the role of neurocognitive processes in predicting the course of drug use in heavy cannabis users [Cousijn et al., 2011, 2012a,2012b,2012c]. In the current report, only participants performing the N‐back are described. The medical ethical committee of the Academic Medical Centre of the University of Amsterdam approved the study and all participants signed informed consent before participation.
Participants
Thirty‐two heavy cannabis and 41 noncannabis users using controls aged 18–25 were recruited through advertisements on the Internet and in cannabis outlets. Groups were matched for age, gender, education, estimated intelligence [Schmand et al., 1991], and alcohol use [Saunders et al., 1993]. Heavy cannabis use was defined as using cannabis more than 10 days per month for at least 2 years and not seeking treatment or having received treatment for cannabis use. Participants in the control group smoked less than 50 cannabis joints during their life and did not use cannabis during the past year (five controls used more than 10 joints lifetime). Drug and alcohol use was controlled for by excluding participants with an Alcohol Use Disorder Identification Test [AUDIT, Saunders et al., 1993] score higher than 10, smoking more than 20 cigarettes daily, a positive urine screen for alcohol, amphetamines, benzodiazepines, opioids or cocaine, or using noncannabinoïd drugs in total on more than 100 occasions (five participants >10 occasions, no participant >25 occasions). Other exclusion criteria were general MRI contraindications, major physical disorders, and psychiatric disorders (including the presence of any psychotic symptoms), which were assessed with the Mini‐International Neuropsychiatric Interview [Dutch version 5.0.0; Sheehan et al., 1998]. Additionally, severity of depressive and ADHD symptoms was assessed with the Beck Depression Inventory [BDI; Beck et al., 1961] and a self‐report ADHD rating scale [Kooij et al., 2005], respectively. All participants were asked to refrain from alcohol and drugs (except for nicotine and caffeine) 24‐h prior testing. Although urine analysis of THC metabolites is insensitive to 24‐h abstinence, it increases accuracy of self‐reported substance use [Roese and Jamieson, 1993]. Therefore, urine samples were taken to control for recent illicit substance use (all heavy cannabis users scored positive for cannabis use, all controls scored negative). Testing took place in late afternoon. Participants were financially compensated for their participation.
Questionnaires at Baseline and Follow‐Up
Problem severity of cannabis use during the last 6 months was assessed with the Cannabis Use Disorder Identification Test [CUDIT, Adamson and Sellman, 2003]. The CUDIT is a screening‐instrument for at‐risk cannabis use and consists of 10 items on cannabis use‐frequency and severity of cannabis use‐related problems. Severity of nicotine related problems during the last 6 months was measured with the Fagerström Test for Nicotine Dependence [FTND, Heatherton et al., 1991]. In addition, a query on past and present cannabis and nicotine use was administered. After 6 months, participants were contacted for a telephone interview on present drug (e.g., cannabis, tobacco, alcohol) use and related problems using the same questionnaires.
N‐Back Task
Participants performed a letter N‐back task during which functional magnetic resonance imaging (fMRI)‐BOLD responses were recorded. The task consisted of alternating blocks with three load levels: 0‐back, 1‐back, and 2‐back. During each block, participants viewed a stream of 15 letters with five targets. In 0‐back blocks, participants were instructed to indicate when the target letter “X” appeared on the screen. In 1‐back blocks, participants had to decide if the letter on the screen was identical to the previous one. In 2‐back blocks, targets were those letters identical to the letter presented two trials back. Participants were instructed to press a right response box button for targets and a left button for nontargets. The 0‐back blocks provide a letter recognition baseline, whereas the 1‐back and 2‐back blocks represent measures of working‐memory at low and high load, respectively [Jaeggi et al., 2010]. Blocks lasted 30 s (each stimulus lasted 2 s) and interblock interval was 5 s, during which the block instructions were repeated. Each load level was repeated four times resulting in a 7‐min task of 12 blocks (Fig. 2C). Block order was the same for each participant. Letters were projected on a screen viewed through a mirror attached to the MRI head coil. Before scanning, the participants briefly practiced the task outside the scanner.
Figure 2.
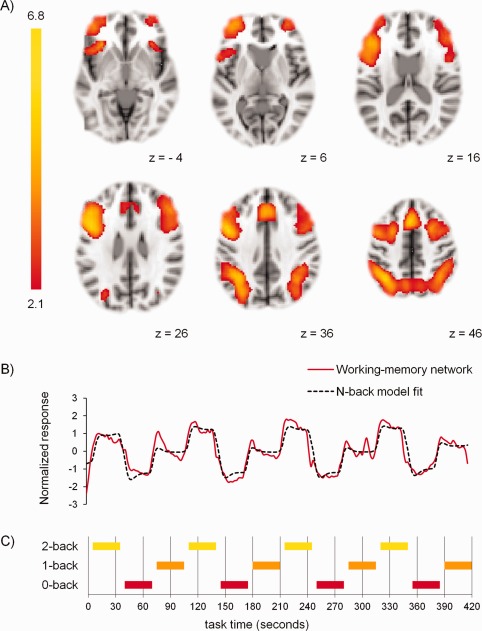
Spatial and temporal characteristics of the working‐memory network extracted by tensor‐ICA across groups. (A) Spatial characteristics. Significant clusters are overlaid on a standard MNI brain. Right side of the brain is depicted at right side. (B) Temporal characteristics. y‐Axis: normalized response, x‐axis: time (s), red line: network time‐course, black dotted line: task‐model time‐course. (C) Task‐model: order of 0‐back, 1‐back, and 2‐back blocks during N‐back task, x‐axis: time (s). [Color figure can be viewed in the online issue, which is available at http://wileyonlinelibrary.com.]
Imaging Parameters
A 3T MRI scanner (Philips Intera, Best, The Netherlands) with a phased array SENSE RF eight‐channel receiver head coil was used for image acquisition. At start of each scan‐session a T 1 structural image was acquired (T 1 turbo field echo, TR 9.6 s, TE 4.6 ms, 182 slices, slice thickness 1.2 mm, FOV 256 × 256 mm, in‐plane resolution 1 × 1 mm, flip angle 8°). During the N‐back task, BOLD signal was measured with a T 2* gradient‐echo EPI sequence (TR 2.29 s, TE 30 ms, 38 slices, slice thickness 3 mm, interslice gap 0.3 mm, FOV 220 × 220 mm, in‐plane resolution 2.3 × 2.3 mm, flip angle 80°, sequential slice acquisition). Data preprocessing was conducted with FEAT (fMRI Expert Analysis Tool) version 4.1, part of FSL (FMRIB's Software Library, http://www.fmrib.ox.ac.uk/fsl). First, nonbrain tissue and skull was removed with BET (Brain Extraction Tool). Images were then slice‐time aligned, motion corrected, high‐pass filtered in the temporal domain (sigma=50 s), spatially smoothed with a 5‐mm full‐with‐half‐maximum Gaussian kernel, and prewhitened [Woolrich et al., 2001]. Next, functional data were registered to the participants' structural image and transformed to MNI space (Montreal Neurological Institute) using FLIRT (FMRIB's Linear Image Registration Tool).
Statistical Analysis
Demographics, scores on questionnaires, and N‐back behavioral performance were compared between groups with standard univariate analysis of variance (ANOVA) in SPSS for Windows (v.16.0). N‐back behavioral performance was assessed in terms of median reaction time of correct responses and accuracy (proportion correct – error responses).
fMRI time‐series analysis was carried out using Tensor‐ICA [Beckmann and Smith, 2005] implemented in MELODIC (Multivariate Exploratory Linear Decomposition into Independent Components), part of FSL. Tensor‐ICA enables model‐free fMRI analysis of multiple participants and groups by means of a three‐way data decomposition into independent components (ICs) representing both signal and artifacts in the data in terms of temporal, spatial, and participant‐dependent variations [for a detailed description of Tensor‐ICA and a comparison with other methods, see Beckmann and Smith, 2005]. Each IC is finally represented by a normalized time‐course and a spatial map of normalized z‐scores reflecting the degree to which each voxel time‐course correlated with the overall IC time‐course. Melodic also provides the relative effect‐size per participant for the spatio‐temporal functional activation pattern of a given component, thereby providing information regarding the relative strength of a component per participant. These relative effect‐sizes per participant are represented by an arbitrary unit calculated form the rank‐1 approximation [Beckmann and Smith, 2005].
After tensor‐ICA decomposition, the IC representing the working‐memory network as described in a meta‐analysis of 24 normative N‐back fMRI studies [Owen et al., 2005] was identified. ICs with motion artifacts, a mean power above 0.1 Hz, or driven by one participant were excluded from analysis. Of the remaining components, spatial maps thresholded at Z > 2.3 were compared with the statistical working‐memory meta‐analysis map thresholded at Z > 2.3 [Owen et al., 2005]. Overlap between the meta‐analysis map and ICs was calculated in terms of percentage significant meta‐analysis voxels falling within the thresholded IC map. Talairach Daemon database implemented in FSL and the LONI probability atlas [Shattuck et al., 2008] were used to verify significant cluster locations.
Within the GLM framework implemented in MELODIC it was assessed if the network responded to task load. Differences in network function between heavy cannabis users and controls were investigated in multiple steps. First, individual network effect size (i.e., degree to which individual data contributed to the overall network) was compared between groups to assess differences in individual network response strength. Second, individual structural maps of the network were compared to assess voxelwise spatial differences. These structural maps were reconstructed form the group network map with a dual regression approach [Filippini et al., 2009], which uses the network time‐course in a temporal regression against the individual fMRI data. The individual maps were compared using nonparametric permutation‐testing with 10,000 permutations. The resulting group differences maps were thresholded with a TFCE (Threshold‐Free Cluster Enhancement) approach [Smith and Nichols, 2009], P < 0.05 corrected for multiple comparisons. Third, activation amplitude of each network area was compared with a simple t‐test, Bonferroni corrected for multiple comparisons by dividing the critical P value of .05 by the total number of tests. For this purpose, percent BOLD signal change for 1‐back > 0‐back and 2‐back > 0‐back contrast was quantified per participant for each area within the network with Featquery (implemented in FSL).
Within heavy cannabis users, Pearson correlations were calculated to investigate associations between individual network strength and history of cannabis use, using baseline weekly use (grams), lifetime use (number of joints), duration of heavy use (years), and baseline problem severity (CUDIT).
The predictive relationship between working‐memory network‐function and change in cannabis use and problem severity was investigated in two steps. First, Pearson correlations were calculated between individual network strength and change in cannabis use (gram per week follow‐up – gram per week baseline) and change in problem severity (CUDIT follow‐up – CUDIT baseline). Second, hierarchical multiple regression analyses was used to assess the unique predictive effects of individual working‐network strength for weekly cannabis use (grams) and problem severity (CUDIT) at 6 months follow‐up. As the relative high costs of fMRI may exceed clinical benefits, the unique variance explained by the individual network strength was assessed after controlling for simpler (and cheaper) behavioral predictors, that is, baseline cannabis use and approach‐bias. Within the present sample we previously showed that prospective cannabis use could be predicted by the presence of cannabis approach‐bias (e.g., faster approach vs. avoid responses) as measured with a joystick Approach‐Avoidance Task [AAT; Cousijn et al., 2011]. During the AAT, participants pushed and pulled a joystick in response to the rotation of cannabis and neutral images. The relative RT difference between cannabis push and cannabis pull responses provides an index of approach bias [Cousijn et al., 2011].
RESULTS
Sample Characteristics
Heavy cannabis users and controls did not differ significantly in age (t 71 = 1.06, P = 0.29), gender (X 2 = 0.04, P = 0.85), IQ (t 71 = 0.36, P = 0.72), and alcohol use and problems (AUDIT, t 71 = 1.65, P = 0.10). However, heavy cannabis users scored higher on measures of nicotine use [smokers (%), X 2 = 20.05, P < 0.001; smoking duration (years), t 71 = 5.07, P < 0.001; cigarettes per day, t 71 = 4.18, P < 0.001; FTND, t 71 = 5.44, P < 0.001], depression symptoms (t 71 = 2.24, P = 0.028), and ADHD symptoms (t 71 = 3.23, P = 0.002), see Table 1.
Table 1.
Sample characteristics
| Heavy cannabis users | Controls | |||
|---|---|---|---|---|
| Baseline | Six‐month follow‐up | Baseline | Six‐month follow‐up | |
| N (% female) | 32 (34) | 30 (34) | 41 (37) | 41 (37) |
| Age, mean (SD) | 21.4 (2.4) | 21.9 (2.4) | 22.0 (2.3) | 22.5 (2.4) |
| Verbal IQ (Dutch Reading Test), mean (SD) | 104.3 (5.4) | – | 104.9 (7.4) | – |
| Alcohol use and related problems (AUDIT), mean (SD) | 6.2 (3.3) | 5.7 (3.3) | 5.0 (3.4) | 4.7 (3.2) |
| Beck Depression Inventory, mean (SD) | 7.1 (5.5) | – | 4.3 (5.0)a | – |
| ADHD self‐rating scale, mean (SD) | 5.7 (4.4) | – | 2.9 (3.0)a | – |
| Cigarette smoking (%) | 69 | 63 | 17a | 22a |
| FTND score, mean (SD) | 2.8 (2.4) | 2.9 (2.5) | 0.5 (1.2)a | 0.6 (1.2)a |
| Duration cigarette smoking (years), mean (SD) | 3.8 (3.6) | 3.8 (3.8) | 0.6 (1.6)a | 0.7 (1.7)a |
| Cigarettes per day, mean (SD) | 6.9 (7.3) | 7.6 (7.0) | 1.4 (3.6)a | 1.3 (3.0)a |
| Cannabis use lifetime (number of joints), mean (SD) | 1,619.5 (1,428.9) | 1,636.7 (1,338.1) | 4.8 (9.3) | 5.3 (10.2) |
| Cannabis use and related problems (CUDIT), mean (SD) | 12.5 (5.8) | 9.6 (6.6)b | 0 (0) | 0.2 (0.5) |
| Duration heavy cannabis use (years), mean (SD) | 2.5 (1.9) | 3.0 (1.9) | – | – |
| Onset heavy cannabis use (age), mean (SD) | 18.9 (2.3) | 18.9 (2.4) | ||
| Current cannabis use days/week, mean (SD) | 5.0 (1.5) | 4.9 (2.1) | – | – |
| Current cannabis use gram/week, mean (SD) | 3.1 (2.3) | 3.0 (3.0) | – | – |
| Self‐reported abstinence (days), mean (SD) | 1.8 (2.3) | |||
P < 0.001 for group comparison.
P < 0.05 baseline follow‐up comparison.
N‐Back Behavioral Performance
RTs and accuracy were analyzed using a mixed ANOVA with group (heavy cannabis users vs. controls) as between‐subject factor and memory‐load as within subject factor with three levels (0‐back, 1‐back, and 2‐back). Analysis of both RTs and accuracy indicated a main effect of memory‐load (F 2,70 = 31.86, P < 0.001, η 2 = 0.48 and F 2,70 = 61.47, P < 0.001, η 2 = 0.64, respectively) that did not differ between groups (F 2,70 = 0.24, P = 0.79 and F 2,70 = 1.58, P = 0.21, respectively). Consistent with normative N‐back performance [Owen et al., 2005], RTs increased (1‐back vs. 0‐back, t 72 = 8.18, P < 0.001, d = 0.96; 2‐back vs. 1‐back, t 72 = 8.85, P < 0.001, d = 1.04) and accuracy decreased with increasing memory load (1‐back vs. 0‐back, t 72 = 2.98, P = 0.004, d = 0.35; 2‐back vs. 1‐back, t 72 = 5.81, P < 0.001, d = 0.68; see Fig. 1A,B). For the highest memory load, a post hoc t‐test indicated that RTs and accuracy during 2‐back did not differ between groups (t 71 = 0.07, P = 0.94 and t 71 = 0.87, P = 0.39).
Figure 1.
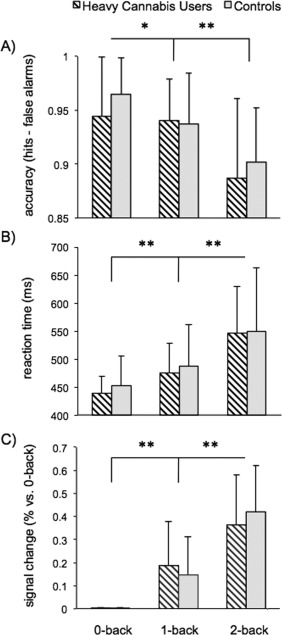
N‐back behavioral performance and network activation per memory load level in heavy cannabis users and controls. (A) 0‐back, 1‐back, and 2‐back average group accuracy expressed as proportion correct responses minus errors with standard deviation error bars. (B) 0‐back, 1‐back, and 2‐back median group RT of correct responses with standard deviation error bars. (C) Working‐memory network activity during 1‐back and 2‐back expressed as percent signal change of 0‐back with standard deviation error bars. *P < 0.05, **P < 0.001.
Working‐Memory Network Selection
Tensor‐ICA reduced the N‐back data of 73 participants to 45 ICs explaining 87% of the variance in the data. Of these components, 18 were excluded from analysis: nine contained motion artifacts, two had a mean power above 0.1 Hz, and seven were driven by one participant. From the remaining 27 components, the working‐memory network was identified. The best‐matched component showed an 89% overlap with the meta‐analysis map provided by Owen et al. (second‐best component 61%).
Working‐Memory Network Functionality1
The working‐memory network comprised of the bilateral frontal pole, VLPFC, DLPFC, premotor cortex, paracingulate cortex, and inferior parietal cortex (Fig. 2A). The network's time‐course strongly correlated with the modeled N‐back time‐course (r = 0.92, P < 0.001; Fig. 2B). GLM analysis showed that network response strength significantly increased with task load (1‐back > 0‐back, Z = 18.27, P < 0.001; 2‐back > 1‐back and 0‐back, Z = 16.87, P < 0.001; Fig. 1C). Network strength did not differ significantly between heavy cannabis users and controls (Z = 0.31, P = 0.38). Further, dual‐regression analysis indicated that there were no significant voxelwise spatial differences between groups regarding the working‐memory network. Also, activity amplitude of areas within the network did not significantly differ between heavy cannabis users and controls (Table 2). A post hoc analysis with the 11 other ICs which significantly reacted to task load (P < 0.001, Bonferroni corrected for number of ICs) also did not reveal significant group differences. Within heavy cannabis users, network strength was not significantly correlated with history of cannabis use and baseline problem severity (r < 0.13, P > 0.49).
Table 2.
Activation amplitude in working‐memory network: 1‐back versus 0‐back and 2‐back versus 0‐back per region in heavy cannabis users and controls
| Brain region | MNI coordinates | Z max | 1‐Bach vs. 0‐back | 2‐Back vs. 0‐back | ||||||
|---|---|---|---|---|---|---|---|---|---|---|
| x | y | z | Cannabis users | controls | P | Cannabis users | Controls | P | ||
| Frontal pole, L | −38 | 54 | 4 | 5.25 | 0.24 (0.05) | 0.14 (0.04) | 0.12 | 0.44 (0.05) | 0.36 (0.05) | 0.26 |
| Frontal pole, R | 34 | 54 | 4 | 4.00 | 0.19 (0.05) | 0.14 (0.04) | 0.41 | 0.36 (0.04) | 0.33 (0.05) | 0.65 |
| Ventrolateral prefrontal, L | −30 | 26 | −8 | 5.27 | 0.23 (0.05) | 0.13 (0.03) | 0.05 | 0.42 (0.05) | 0.38 (0.04) | 0.57 |
| Ventrolateral prefrontal, R | 34 | 26 | −4 | 3.86 | 0.26 (0.05) | 0.11 (0.04) | 0.02 | 0.51 (0.06) | 0.37 (0.05) | 0.09 |
| Dorsolateral prefrontal, L | −46 | 10 | 32 | 6.81 | 0.21 (0.03) | 0.16 (0.03) | 0.23 | 0.42 (0.05) | 0.46 (0.05) | 0.55 |
| Dorsolateral prefrontal, R | 50 | 18 | 28 | 4.73 | 0.24 (0.04) | 0.18 (0.03) | 0.24 | 0.42 (0.05) | 0.46 (0.04) | 0.52 |
| Premotor, L | 30 | 10 | 52 | 5.33 | 0.25 (0.05) | 0.20 (0.03) | 0.41 | 0.44 (0.06) | 0.48 (0.05) | 0.56 |
| Premotor, R | −26 | 2 | 56 | 5.72 | 0.20 (0.03) | 0.19 (0.02) | 0.88 | 0.39 (0.04) | 0.40 (0.03) | 0.78 |
| Paracingulate, LR | −4 | 18 | 44 | 6.08 | 0.18 (0.05) | 0.16 (0.04) | 0.75 | 0.41 (0.06) | 0.50 (0.05) | 0.26 |
| Inferior parietal, L | −34 | −54 | 42 | 6.40 | 0.25 (0.04) | 0.21 (0.03) | 0.42 | 0.47 (0.05) | 0.53 (0.05) | 0.36 |
| Inferior parietal, R | 38 | −54 | 44 | 5.16 | 0.24 (0.03) | 0.19 (0.03) | 0.32 | 0.42 (0.04) | 0.42 (0.04) | 0.96 |
L, left hemisphere; R, right hemisphere; MNI, Montreal Neurological Institute; MNI coordinates of maximum Z‐scores are shown for each region; Values represent average percent signal change over all significant voxels within a region.
Heavy cannabis users scored higher on measures nicotine use, (FTND, duration of cigarette smoking, and cigarettes per day), ADHD, and depression. However, working‐memory network strength did not covary with these measures and did not differ between smoking and nonsmoking heavy cannabis users.
Predictors of Cannabis Use After 6 Months2, 3, 4
Six months after baseline a 97% follow‐up rate was achieved (two nonresponders among the 32 heavy cannabis users). Average cannabis problem severity significantly decreased in heavy cannabis users (t 29 = 2.3, P = 0.026, Table 1). Cannabis use frequencies and measures of alcohol and nicotine use did not change in heavy cannabis users or controls (Table 1). None of the heavy cannabis users sought treatment for their cannabis use during the past 6 months.
Working‐memory network response strength was positively associated with cannabis use at follow‐up (Fig. 3C, n = 30, R 2 = 0.25, P = 0.005) and change in cannabis use at follow‐up (Fig. 3D, baseline use – follow‐up use, n = 30, R 2 = 0.29, P = 0.002), but not with cannabis use at baseline (Fig. 3B, n = 30, R 2 = 0.02, P = 0.42), indicating that a stronger network response was related to higher levels of cannabis use after 6 months. Moreover, baseline use was positively associated with cannabis use at follow‐up (Fig. 3A, n = 30, R 2 = 0.42, P < 0.001).
Figure 3.
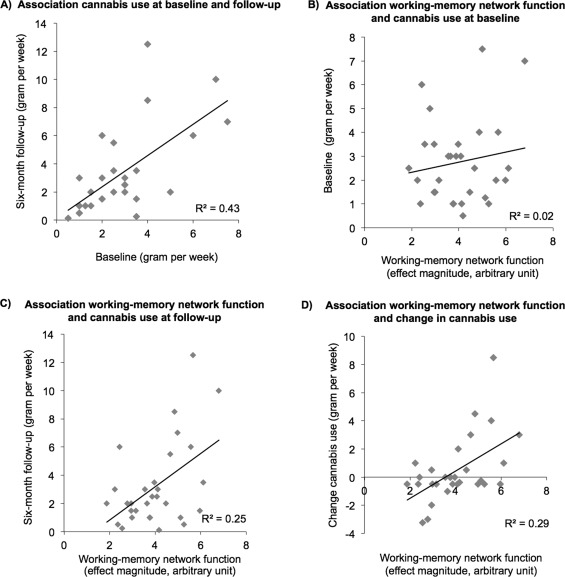
Direct relationships between weekly cannabis use at baseline, weekly cannabis use at 6‐month follow‐up, and working‐memory network function in heavy cannabis users (n = 30). (A) Association weekly cannabis at baseline and 6‐month follow‐up in gram per week, R 2 = 0.42, p < 0.001. (B) Association working‐memory network response strength and weekly cannabis use at baseline, R 2 = 0.02, P = 0.42. (C) Association working‐memory network response strength and weekly cannabis use at 6‐month follow‐up, R 2 = 0.25, P = 0.005. (D) Association working‐memory network response strength and change in weekly cannabis use at 6‐month follow‐up (cannabis use follow‐up – cannabis use baseline), R 2 = 0.29, P = 0.002. Response strength of the working‐memory network is expressed as the participant effect magnitude (arbitrary unit) derived from the Tensor‐ICA analysis.
Within the present sample, cannabis use at follow‐up was previously found to be predicted by a cannabis approach‐bias using the AAT [Cousijn et al., 2011]. To assess the unique predictive relationship between working‐memory network function and cannabis use at follow‐up, a hierarchical multiple regression analysis was performed. In the hierarchical regression model, baseline weekly use was entered in the first step, approach‐bias in the second step, and working‐memory network response strength in the third step. Only participants who completed the N‐back task, AAT, and follow‐up (n = 29) were included in the analyses. Preliminary analyses indicated no violation of the assumption of normality, linearity, multicollinearity, and homoscedasticity (maximum Cook's distance = 0.43, maximum standardized residual = 3.0). The final model explained 70% (adjusted 67%) of the variance in cannabis use at follow‐up, F 3,25 = 19.71, P < 0.001, f2 = 2.33 (Table 3). Baseline weekly cannabis use explained 41% of the variance in cannabis use at follow‐up F 1,27 = 19.15, P < 0.001, f2 = 0.70, on top of which approach‐bias explained an additional 18%, F change1,26 = 11.41, P = 0.002, f2 = 0.44. After correction for variance explained by baseline weekly cannabis use and the approach‐bias, working‐memory network reactivity explained an additional 11% of the variance in cannabis use at follow‐up, F change1,25 = 9.20, P = 0.006, f2 = 0.37 (16% when approach‐bias was omitted form the model, F change1,27 = 10.7, P = 0.003, f2 = 0.41). Participants with stronger working‐memory network reactivity used more cannabis after 6 months. In the final model, baseline weekly cannabis use and the approach‐bias remained significant predictors (P < 0.001 and P = 0.005, respectively). No associations were found between working‐memory network functionality and cannabis problem severity at follow‐up.
Table 3.
Hierarchical multiple regression analysis for variables predicting weekly cannabis use (gram) at 6‐month follow‐up in heavy cannabis users (n = 29)
| B | SE B | β | P | |
|---|---|---|---|---|
| Step 1: Change R 2: 0.41, f 2 = 0.70 | <0.001 | |||
| Baseline weekly use | 1.10 | 0.25 | 0.64** | <0.001 |
| Step 2: Change R2: 0.18, f 2 = 0.44 | 0.002 | |||
| Baseline weekly use | 1.28 | 0.22 | 0.75** | <0.001 |
| Behavioral approach‐bias | 0.02 | 0.01 | 0.44* | <0.002 |
| Step 3: Change R 2: 0.11, f 2 = 0.37 | 0.006 | |||
| Baseline weekly use | 1.14 | 0.20 | 0.67** | <0.001 |
| Behavioral approach‐bias | 0.02 | 0.01 | 0.35* | 0.005 |
| Working‐memory network | 0.28 | 0.28 | 0.35* | 0.006 |
Final model R 2: 0.70**, adjusted R 2 0.67*. SE: standard error.
DISCUSSION
The goal of this fMRI study was to assess the predictive power of working‐memory network function for predicting future cannabis use and cannabis‐related problems. During the N‐back working‐memory task, both behavioral performance and working‐memory network function in terms of strength, location, and activation amplitude did not differ between heavy cannabis users and controls. However, individual differences in network response strongly predicted weekly cannabis use after 6 months in heavy cannabis users, over and beyond behavioral predictors of cannabis use: higher response strength was related to increases in weekly cannabis use. These findings suggest that increased effort during the task (indicative of a relatively weak working‐memory system in a subgroup of the cannabis users) is a risk factor for escalating substance use, which is in line with SUD models [Koob and Volkow, 2010; Wiers et al., 2007] and with previous studies on the predictive association between working‐memory, motivational processes, and substance abuse [Grenard et al., 2008; Thush et al., 2008]. Moreover, these findings indicate that working‐memory may be a suitable target for interventions.
Although heavy substance use is prerequisite, SUD risk depends on complex interactions between numerous factors, ranging from specific genetic to social factors [Swendsen and Le Moal, 2011]. The balance between sensitized conditioned responses toward substance use and regulatory executive functions is suggested to play an important role in determining SUD vulnerability [Koob and Volkow, 2010; Wiers et al., 2007]. Indeed, in the same participants we previously showed that the potent response to automatically approach rather than avoid cannabis (approach‐bias) predicted cannabis use after 6 months. With a regression model including weekly cannabis use, approach‐bias, and working‐memory network function, we explained a substantial amount (67%) of the variance in future cannabis use. Baseline weekly cannabis use was the strongest predictor (41%), but behavioral approach bias and working‐memory network response also added substantially to the prediction of change in future cannabis use (all Cohen's f2 effect sizes ≥0.37). These factors may provide an integrative model of SUD risk. Important to note, however, in the current sample of heavy cannabis users weekly cannabis use did not change whereas cannabis use related problems decreased after 6 months. To further delineate the role of working‐memory and approach‐bias additional research in more chronic or dependent cannabis users is needed.
Interestingly, both working‐memory training and approach‐bias retraining potentially improve treatment outcome [Bickel et al., 2011; Houben et al., 2011; Wiers et al., 2011; Wiers et al., 2010]. However, instead of one standard treatment, the heterogeneity of SUDs calls for personalized treatment [Oslin, 2011]. Assessing working‐memory network function and strength of approach action tendencies may provide insight into who will benefit from working‐memory training and approach‐bias‐retraining. Future research efforts should be aimed at confirming these inferences.
The working‐memory network identified with tensor‐ICA consisted of the frontal pole, VLPFC, DLPFC, premotor cortex, paracingulate cortex, and inferior parietal cortex, which is consistent with normative working‐memory studies [Owen et al., 2005; Wager and Smith, 2003]. Working‐memory has been considered a central executive function [Baddeley, 2010; Kane and Engle, 2002] and the underlying network plays a role in many cognitive tasks [Fox et al., 2005]. This raises the question whether the association between working‐memory network function and cannabis use can be generalized to overall executive functioning, predicting that relatively poor (but not necessarily dysfunctional) working‐memory network function under any executive function task could predict future substance use. This view is supported by recent behavioral studies [Houben and Wiers, 2009; Wiers et al., 2009] although more prospective studies are needed to investigate these issues.
The suggested role of working‐memory in the development and maintenance of SUDs implies its direct involvement in the regulation of motivational processes. In contrast, working‐memory has generally been considered a cold regulatory process, whereas cognitive regulation of motivational information has primary been linked to the anterior cingulate cortex and the medial parts of the PFC [Ochsner et al., 2012]. However, it has been shown that performance of a working‐memory task in a positive emotional context reduces activation of the ventral striatum [Erk et al., 2007]. It may be that the working‐memory network supports active reappraisal of motivational information by directing attention toward reducing the emotional responses elicited by substance related cues and holding in mind the purpose of doing so [Ochsner et al., 2012]. However, these inferences need to be tested.
Cannabis abuse has repeatedly been associated with hyperactivity of the working‐memory network, despite normal task performance (e.g., Jacobsen et al., 2007; Jager et al., 2010; Kanayama et al., 2004; Padula et al., 2007; Schweinsburg et al., 2010]. Outside the mri‐scanner, cannabis abuse has been linked to working‐memory impairments [Fernandez‐Serrano et al., 2011]. In the present study, increased memory load was associated with increased network response, slowed behavioral responses, and decreased accuracy over groups. Based on these observations it is intuitive to conclude that individual differences in network functionality reflect differences in task difficulty and effort needed to perform the task. However, since we did not observe a direct relationship between network reactivity and behavioral performance we cannot confirm this hypothesis. The lack of a relationship between network reactivity and performance may be explained by the N‐Back's low reliability as a behavioral measure of working memory (especially at lower load levels; Jeaggi et al. 2010]. Also, performance at the highest load (2‐back) remained high in our sample suggesting a ceiling effect. To the best of our knowledge, there are no studies showing hyperactivation combined with poor performance in cannabis users. Whether increased network reactivity reflected increased effort (and relatively poor network functions), remains speculative.
In contract to our hypotheses, network function and location did not differ between groups [However, a trend was observed in the VLPFC (Table 2)]. A post hoc analysis indicated no group differences in any of the other tensor‐ICA networks, arguing against the alternative hypothesis that cannabis users use a compensatory task strategy by recruiting additional brain areas [Kanayama et al., 2004; Padula et al., 2007; Schweinsburg et al., 2008, 2010]. Equal performance in heavy cannabis users and controls and lack of a significant association between history of cannabis use and working‐memory network reactivity argues against subacute or chronic cannabis effects on working‐memory. The association between cannabis use and working‐memory observed in this study and other studies might therefore reflect a pre‐existing risk factor rather than a consequence of cannabis use. However, this remains to be investigated as cannabis abstinence has also been found to result in working‐memory recovery [Hanson et al., 2010; Schweinsburg et al., 2010]. Moreover, early onset of heavy cannabis use may be associated with greater impairments of the working‐memory network as hyperactivity during a working‐memory task has only been reported in adolescent heavy cannabis users [e.g., Jacobsen et al., 2007; Jager et al., 2010; Padula et al., 2007; Schweinsburg et al., 2010] and in long‐term daily cannabis users [Kanayama et al., 2004]. Early onset has been associated with increased cortical activity in adult cannabis users [Becker et al., 2010]. The relatively late onset (M = 18.8 years) and short duration (M = 2.5 years) of heavy cannabis use in our sample may explain the lack of group differences in the current study. Alternatively, ceiling effects in the N‐Back performance [89% accuracy for the highest memory load (2‐back)] may have obscured cannabis induced working‐memory deficits. To achieve higher variability in performance, it is recommended to include a 3‐back level in future research. However, given its low reliability as a behavioral measure of working memory [Jeaggi et al. 2010], one may alternatively consider including a reliable working‐memory task outside the MRI scanner.
Some potential limitations must be taken into account. Nicotine use, symptoms of depression, and symptoms of ADHD were higher in the heavy cannabis users. Even though scores on these measures were relatively low and did not covary with working‐memory network function in heavy cannabis users, they may still confound the observed results. A post hoc regression analysis indicated that, after correction for symptoms of depression and ADHD, nicotine use, and alcohol use, working‐memory network functionality (P = 0.036) and the behavioral approach‐bias (P = 0.006) remained significant predictors of cannabis use. This post‐hoc analysis indicated that subclinical psychiatric symptoms of ADHD and depression were unlikely to impact our findings. Although none of the participants had any psychotic symptom [verified with the Mini‐International Neuropsychiatric Interview; Sheehan et al., 1998], potential confounding effects of subthreshold psychotic symptoms cannot be fully excluded. Note, however, that an ecologically valid group of individuals with a cannabis use disorder may display considerable comorbid externalizing disorders, so that controlling for (subclinical) psychiatric symptoms may remove valuable variance. Finally, it has been suggested that multivariate approaches like ICA may be more sensitive than standard GLM analysis in detecting abnormal network functionality [Kim et al., 2009]. The current study does not provide support for this notion as a post hoc standard GLM analysis revealed similar results to the tensor‐ICA analysis (see footnote 1 and 2).
In summary, the current fMRI study is the first to demonstrate that individual differences working‐memory network function predicts change in cannabis use in heavy cannabis users. Behavioral performance and brain functionality during an N‐Back working‐memory task did not differ between heavy cannabis users and controls. These finding imply that heavy cannabis users who require greater effort for adequate N‐back working‐memory task performance have a higher probability of increasing drug use. As such, working‐memory network function may be used to identify individuals at‐risk for cannabis use escalation and the development of a cannabis use disorder and may be a new target for prevention and treatment.
ACKNOWLEDGMENTS
The authors thank Esther Beraha for her assistance in recruiting and testing participants. Scanning costs were partly funded by a grant of the Amsterdam Brain Imaging Platform.
Footnotes
A standard higher‐level GLM analyses with Feat yielded similar results. Brain activations related to the 2‐back versus 0‐back and 1‐back versus 0‐back contrasts did not significantly differ between heavy cannabis users and controls (Z > 2.3, whole‐brain cluster corrected at P < 0.05).
A GLM approach yielded similar results. Average percent signal change extracted form the 2‐back versus 0‐back main effect over groups (Z > 2.3, whole‐brain cluster corrected at P < 0.05) explained an additional 8% of the variance in cannabis use at follow‐up, F change1,25 = 3.35, P = 0.019. No predictive association was observed for 1‐back versus 0‐back related activity.
Cannabis use in one participant increased 8.5 g/week (3.5 SD from the mean increase). This participant remained in the analyses as cannabis use at baseline and follow‐up did not deviate >3 SD from the mean, and regression analysis diagnostics did not identify this participant as an outlier. When this participant is excluded from analyses, the approach‐bias (P = 0.006) and working‐memory network reactivity (P = 0.005) remained significant predictors of cannabis use after 6 months. Moreover, direct relationships between weekly cannabis use at baseline, weekly cannabis use at 6‐month follow‐up, and working‐memory network function in heavy cannabis users were unaffected.
The approach‐bias (P = 0.006) and working‐memory network reactivity (P = 0.036) remained significant predictors of cannabis use after 6 months after correction for depression symptoms (BDI), ADHD symptoms, nicotine use (FTND, cigarettes per day, duration of smoking), problem severity of alcohol use (AUDIT), and problem severity of cannabis use (CUDIT).
REFERENCES
- Adamson SJ, Sellman JD. (2003): A prototype screening instrument for cannabis use disorder: The Cannabis Use Disorders Identification Test (CUDIT) in an alcohol‐dependent clinical sample. Drug Alcohol Rev 22:309–315. [DOI] [PubMed] [Google Scholar]
- Baddeley A. (2010): Working memory. Curr Biol 20:R136–R140. [DOI] [PubMed] [Google Scholar]
- Beck AT, Ward CH, Mendelson M, Mock J, Erbaugh J. (1961): An inventory for measuring depression. Arch Gen Psychiatry 4:561–571. [DOI] [PubMed] [Google Scholar]
- Becker B, Wagner D, Gouzoulis‐Mayfrank E, Spuentrup E, Daumann J. (2010): The impact of early‐onset cannabis use on functional brain correlates of working memory. Prog Neuropsychopharmacol Biol Psychiatry 34:837–845. [DOI] [PubMed] [Google Scholar]
- Beckmann CF, Smith SM. (2005): Tensorial extensions of independent component analysis for multisubject fMRI analysis. Neuroimage 25:294–311. [DOI] [PubMed] [Google Scholar]
- Bickel WK, Yi R, Landes RD, Hill PF, Baxter C. (2011): Remember the future: Working memory training decreases delay discounting among stimulant addicts. Biol Psychiatry 69:260–265. [DOI] [PMC free article] [PubMed] [Google Scholar]
- Cousijn J, Goudriaan AE, Ridderinkhof KR, Veltman DJ, Van Den Brink W, Wiers RW. (2012a): Neural responses associated with cue‐reactivity in frequent cannabis users. Addic Biol, doi: 10.1111/j.1369‐1600.2011.00417.x. [DOI] [PubMed] [Google Scholar]
- Cousijn J, Goudriaan AE, Wiers RW. (2011): Reaching out towards cannabis: Approach‐bias in heavy cannabis users predicts changes in cannabis use. Addiction 106:1667–1674. [DOI] [PMC free article] [PubMed] [Google Scholar]
- Cousijn J, Wiers RW, Ridderinkhof KR, van den Brink W, Veltman DJ, Goudriaan AE. (2012b): Grey matter alterations associated with cannabis use: Results of a VBM study in heavy cannabis users and healthy controls. Neuroimage 59:3845–3851. [DOI] [PubMed] [Google Scholar]
- Cousijn J, Wiers RW, Ridderinkhof KR, van den Brink W, Veltman DJ, Porrino LJ, Goudriaan AE. (2012c): Individual differences in decision making and reward processing predict changes in cannabis use: A prospective functional magnetic resonance imaging study. Addict Biol, doi:10.1111/j.1369‐1600.2012.00498.x. [DOI] [PubMed] [Google Scholar]
- Degenhardt L, Chiu WT, Sampson N, Kessler RC, Anthony JC, Angermeyer M, Bruffaerts R, de Girolamo G, Gureje O, Huang Y, Karam A, Kostyuchenko S, Lepine JP, Mora ME, Neumark Y, Ormel JH, Pinto‐Meza A, Posada‐Villa J, Stein DJ, Takeshima T, Wells JE (2008): Toward a global view of alcohol, tobacco, cannabis, and cocaine use: Findings from the WHO World Mental Health Surveys. PLoS Med 5:e141. [DOI] [PMC free article] [PubMed] [Google Scholar]
- Erk S, Kleczar A, Walter H. (2007): Valence‐specific regulation effects in a working memory task with emotional context. Neuroimage 37:623–632. [DOI] [PubMed] [Google Scholar]
- Fernandez‐Serrano MJ, Perez‐Garcia M, Verdejo‐Garcia A. (2011): What are the specific vs. generalized effects of drugs of abuse on neuropsychological performance? Neurosci Biobehav Rev 35:377–406. [DOI] [PubMed] [Google Scholar]
- Filippini N, MacIntosh BJ, Hough MG, Goodwin GM, Frisoni GB, Smith SM, Matthews PM, Beckmann CF, Mackay CE. (2009): Distinct patterns of brain activity in young carriers of the APOE‐epsilon4 allele. Proc Natl Acad Sci U S A 106:7209–7214. [DOI] [PMC free article] [PubMed] [Google Scholar]
- Fox MD, Snyder AZ, Vincent JL, Corbetta M, Van Essen DC, Raichle ME. (2005): The human brain is intrinsically organized into dynamic, anticorrelated functional networks. Proc Natl Acad Sci U S A 102:9673–9678. [DOI] [PMC free article] [PubMed] [Google Scholar]
- Grenard JL, Ames SL, Wiers RW, Thush C, Sussman S, Stacy AW. (2008): Working memory capacity moderates the predictive effects of drug‐related associations on substance use. Psychol Addict Behav 22:426–432. [DOI] [PMC free article] [PubMed] [Google Scholar]
- Hanson KL, Winward JL, Schweinsburg AD, Medina KL, Brown SA, Tapert SF. (2010): Longitudinal study of cognition among adolescent marijuana users over three weeks of abstinence. Addict Behav 35:970–976. [DOI] [PMC free article] [PubMed] [Google Scholar]
- Heatherton TF, Kozlowski LT, Frecker RC, Fagerstrom KO. (1991): The Fagerstrom Test for Nicotine Dependence: A revision of the Fagerstrom Tolerance Questionnaire. Br J Addict 86:1119–1127. [DOI] [PubMed] [Google Scholar]
- Houben K, Wiers RW. (2009): Response inhibition moderates the relationship between implicit associations and drinking behavior. Alcohol Clin Exp Res 33:626–633. [DOI] [PubMed] [Google Scholar]
- Houben K, Wiers RW, Jansen A. (2011): Getting a grip on drinking behavior: Training working memory to reduce alcohol abuse. Psychol Sci 22:968–975. [DOI] [PubMed] [Google Scholar]
- Jacobsen LK, Pugh KR, Constable RT, Westerveld M, Mencl WE. (2007): Functional correlates of verbal memory deficits emerging during nicotine withdrawal in abstinent adolescent cannabis users. Biol Psychiatry 61:31–40. [DOI] [PubMed] [Google Scholar]
- Jaeggi SM, Buschkuehl M, Perrig WJ, Meier B. (2010): The concurrent validity of the N‐back task as a working memory measure. Memory 18:394–412. [DOI] [PubMed] [Google Scholar]
- Jager G, Block RI, Luijten M, Ramsey NF. (2010): Cannabis use and memory brain function in adolescent boys: A cross‐sectional multicenter functional magnetic resonance imaging study. J Am Acad Child Adolesc Psychiatry 49:561–572. [DOI] [PMC free article] [PubMed] [Google Scholar]
- Kanayama G, Rogowska J, Pope HG, Gruber SA, Yurgelun‐Todd DA. (2004): Spatial working memory in heavy cannabis users: A functional magnetic resonance imaging study. Psychopharmacology (Berl) 176:239–247. [DOI] [PubMed] [Google Scholar]
- Kane MJ, Engle RW. (2002): The role of prefrontal cortex in working‐memory capacity, executive attention, and general fluid intelligence: An individual‐differences perspective. Psychon Bull Rev 9:637–671. [DOI] [PubMed] [Google Scholar]
- Kim DI, Mathalon DH, Ford JM, Mannell M, Turner JA, Brown GG, Belger A, Gollub R, Lauriello J, Wible C, O'Leary D, Lim K, Toga A, Potkin SG, Birn F, Calhoun VD (2009): Auditory oddball deficits in schizophrenia: An independent component analysis of the fMRI multisite function BIRN study. Schizophr Bull 35:67–81. [DOI] [PMC free article] [PubMed] [Google Scholar]
- Koob GF, Volkow ND. (2010): Neurocircuitry of addiction. Neuropsychopharmacology 35:217–238. [DOI] [PMC free article] [PubMed] [Google Scholar]
- Ochsner KN, Silvers JA, Buhle JT. (2012): Functional imaging studies of emotion regulation: A synthetic review and evolving model of the cognitive control of emotion. Ann N Y Acad Sci 1251:E1–E24. [DOI] [PMC free article] [PubMed] [Google Scholar]
- Oslin D. (2011): Personalized addiction treatment: How close are we? Alcohol Alcohol 46:231–232. [DOI] [PubMed] [Google Scholar]
- Owen AM, McMillan KM, Laird AR, Bullmore E. (2005): N‐back working memory paradigm: A meta‐analysis of normative functional neuroimaging studies. Hum Brain Mapp 25:46–59. [DOI] [PMC free article] [PubMed] [Google Scholar]
- Padula CB, Schweinsburg AD, Tapert SF. (2007): Spatial working memory performance and fMRI activation interaction in abstinent adolescent marijuana users. Psychol Addict Behav 21:478–487. [DOI] [PMC free article] [PubMed] [Google Scholar]
- Robinson TE, Berridge KC. (2003): Addiction. Annu Rev Psychol 54:25–53. [DOI] [PubMed] [Google Scholar]
- Roese NJ, Jamieson DW. (1993): Twenty years of bogus pipeline research: A critical review and meta‐analysis. Psychol Bull 114:363–375. [Google Scholar]
- Saunders JB, Aasland OG, Babor TF, de la Fuente JR, Grant M. (1993): Development of the Alcohol Use Disorders Identification Test (AUDIT): WHO Collaborative Project on Early Detection of Persons with Harmful Alcohol Consumption—II. Addiction 88:791–804. [DOI] [PubMed] [Google Scholar]
- Schmand B, Bakker D, Saan R, Louman J. (1991): The Dutch Reading Test for Adults: A measure of premorbid intelligence level. Tijdschr Gerontol Geriatr 22:15–19. [PubMed] [Google Scholar]
- Schweinsburg AD, Nagel BJ, Schweinsburg BC, Park A, Theilmann RJ, Tapert SF. (2008): Abstinent adolescent marijuana users show altered fMRI response during spatial working memory. Psychiatry Res 163:40–51. [DOI] [PMC free article] [PubMed] [Google Scholar]
- Schweinsburg AD, Schweinsburg BC, Medina KL, McQueeny T, Brown SA, Tapert SF. (2010): The influence of recency of use on fMRI response during spatial working memory in adolescent marijuana users. J Psychoactive Drugs 42:401–412. [DOI] [PMC free article] [PubMed] [Google Scholar]
- Schweinsburg AD, Schweinsburg BC, Nagel BJ, Eyler LT, Tapert SF. (2011): Neural correlates of verbal learning in adolescent alcohol and marijuana users. Addiction 106:564–573. [DOI] [PMC free article] [PubMed] [Google Scholar]
- Shattuck DW, Mirza M, Adisetiyo V, Hojatkashani C, Salamon G, Narr KL, Poldrack RA, Bilder RM, Toga AW. (2008): Construction of a 3D probabilistic atlas of human cortical structures. Neuroimage 39:1064–1080. [DOI] [PMC free article] [PubMed] [Google Scholar]
- Sheehan DV, Lecrubier Y, Sheehan KH, Amorim P, Janavs J, Weiller E, Hergueta T, Baker R, Dunbar GC. (1998): The Mini‐International Neuropsychiatric Interview (M.I.N.I.): The development and validation of a structured diagnostic psychiatric interview for DSM‐IV and ICD‐10. J Clin Psychiatry 59(Suppl 20):22–33. [PubMed] [Google Scholar]
- Smith SM, Nichols TE. (2009): Threshold‐free cluster enhancement: Addressing problems of smoothing, threshold dependence and localisation in cluster inference. Neuroimage 44:83–98. [DOI] [PubMed] [Google Scholar]
- Swendsen J, Le Moal M. (2011): Individual vulnerability to addiction. Ann N Y Acad Sci 1216:73–85. [DOI] [PubMed] [Google Scholar]
- Thush C, Wiers RW, Ames SL, Grenard JL, Sussman S, Stacy AW. (2008): Interactions between implicit and explicit cognition and working memory capacity in the prediction of alcohol use in at‐risk adolescents. Drug Alcohol Depend 94:116–124. [DOI] [PMC free article] [PubMed] [Google Scholar]
- Wager TD, Smith EE. (2003): Neuroimaging studies of working memory: A meta‐analysis. Cogn Affect Behav Neurosci 3:255–274. [DOI] [PubMed] [Google Scholar]
- Wiers RW, Bartholow BD, van den Wildenberg E, Thush C, Engels RC, Sher KJ, Grenard J, Ames SL, Stacy AW. (2007): Automatic and controlled processes and the development of addictive behaviors in adolescents: A review and a model. Pharmacol Biochem Behav 86:263–283. [DOI] [PubMed] [Google Scholar]
- Wiers RW, Beckers L, Houben K, Hofmann W. (2009): A short fuse after alcohol: Implicit power associations predict aggressiveness after alcohol consumption in young heavy drinkers with limited executive control. Pharmacol Biochem Behav 93:300–305. [DOI] [PubMed] [Google Scholar]
- Wiers RW, Rinck M, Kordts R, Houben K, Strack F. (2010): Retraining automatic action‐tendencies to approach alcohol in hazardous drinkers. Addiction 105:279–287. [DOI] [PubMed] [Google Scholar]
- Wiers RW, Eberl C, Rinck M, Becker ES, Lindenmeyer J. (2011): Retraining automatic action tendencies changes alcoholic patients' approach bias for alcohol and improves treatment outcome. Psychol Sci 22:490–497. [DOI] [PubMed] [Google Scholar]
- Woolrich MW, Ripley BD, Brady M, Smith SM. (2001): Temporal autocorrelation in univariate linear modeling of fMRI data. Neuroimage 14:1370–1386. [DOI] [PubMed] [Google Scholar]