

Abstract
Parkinson's disease (PD) is a neurodegenerative disorder associated with the striatum. Previous studies indicated that subdivisions of the striatum with distinct functional connectivity profiles contribute to different pathogeneses in PD. Segregated structural covariance (SC) pattern between the striatum and neocortex observed in healthy subjects, however, remain unknown in PD. The purpose of this study is to map and compare the subregional striatal SC network organization between 30 healthy controls and 48 PD patients and to investigate their association with the disease severity. The striatal SC network was statistically inferred by correlating the mean gray matter (GM) volume of six striatal subdivisions (including the bilateral dorsal caudate, superior ventral striatum, inferior ventral striatum, dorsal caudal putamen, dorsal rostral putamen, and ventral rostral putamen) with the entire neocortical GM volume in voxel‐wise manner. The PD patients revealed marked atrophy in the striatum, cerebellum, and extra‐striatum neocortices. As predicted, segregated striatal SC network patterns were observed in both groups. This suggests that in PD, pathological processes occurring in the striatum affect the same striato‐cortical networks that covary with the striatum in healthy brains. The PD patients further demonstrated atypical striatal SC patterns between the caudate, parahippocampus temporal cortices, and cerebellum, which corresponded to dopaminergic associated network. The areas with significant group differences in SC were further associated with disease severity. Our findings support previous studies indicating that PD is associated with altered striato‐cortical networks, and suggest that structural changes in the striatum may result in a cascade of alterations in multiple neocortices. Hum Brain Mapp 36:1567–1584, 2015. © 2014 Wiley Periodicals, Inc.
Keywords: cerebellum, connectivity, dopamine, magnetic resonance imaging, movement disorder, neuroplasticity, subcortical
INTRODUCTION
Parkinson's disease (PD) is a common neurodegenerative disease involving movement disorders of the central nervous system. The basal ganglia, innervated by the dopaminergic system, are one of the most seriously affected brain areas in PD [Tritsch and Sabatini, 2012]. The striatum, which is a major component of basal ganglia, plays a central role in reward‐guided habit formation, action selection, and appropriate movement. It is the gatekeeper for the reciprocal flow of information between the cortical and the subcortical structures [Park et al., 2012]. Dysregulation or disconnection between the striatum and other neocortex areas have been found to be related to clinical impairments associated with PD [Helmich et al., 2010; Litvak et al., 2011; Poston and Eidelberg, 2012; Wu et al., 2011].
In a previous study, functionally distinct neural circuits were found to be associated with different striatal subdivisions based on their distributed cortical regions [Postuma and Dagher, 2006]. Using resting state functional magnetic resonance imaging (MRI), Di Martino et al. [2008] demonstrated a similar distinct functional connectivity profile of striatal subdivisions that corresponded to the hypothesized motor, cognitive, and affective divisions in the human striatal system. Widespread psychopathological conditions associated with deficits in emotion, executive function, and motor system [Jankovic, 2008] in PD may result from functional/structural alterations in not only the striatal subregions but also its upper and lower streamline regions which build up networks. These findings suggest that evaluating the striatum in isolation is insufficient for understanding the pathophysiology of PD.
Recently, the results of large‐scale network‐based studies have shown that different neurodegenerative diseases may target different brain networks that initiated from the disease specific vulnerable regions [Seeley et al., 2009]. The fundamental concept of network degeneration hypothesis is that functionally associated areas modulate regional microstructures as a result of mutually trophic influences [Ferrer et al., 1995] or similar episode‐covaried plasticity [Draganski et al., 2004; Mechelli et al., 2005]. This hypothesis is supported by the observation that subsequently affected regions in neurodegenerative diseases often bear known anatomical connections with the sites of the initial injury [Seeley et al., 2008]. Therefore, it is possible that landmarks of PD, such as the striatum, are also closely associated with subsequent neocortical changes in disease development. This hypothesis, however, has not been studied thoroughly. Assessing the relationship between the anatomy of the striatal subdivisions and their associated neocortex can provide insight into the pathophysiology of PD.
Although striatal atrophy is a hallmark of PD, MRI volumetric studies have also shown extensive extra‐striatum pathology [Pan et al., 2012]. This finding raises the question of whether PD might originate from an abnormality in structural interaction between the striatum and selective vulnerably gray matter (GM). In addition to the functional study, diffusion tensor images, valuable in evaluating the microarchitecture of white matter (WM), have successfully displayed segregated and integrative connectivity patterns in the basal ganglia [Draganski et al., 2008]. Therefore, the clinical phenotype of PD may be involved in not only the striatal subdivisions but also corresponding striatal‐cortical networks through direct or indirect structural links.
Recently, structural covariance (SC) has been proposed as a surrogate method for assessing large‐scale structural network patterns between different cerebral regions using correlation analysis between the study‐specific regional GM volume and the entire brain in a voxel‐wise manner [Mechelli et al., 2005]. The SC network analyses have demonstrated how neural systems build large‐scale SC during development [Zielinski et al., 2010]. These findings suggest that SC network approaches can provide a powerful tool for understanding human brain maturation. Furthermore, SC is likely to be determined by both genetic and environmental factors and may be the basis for differences in individual behavior [Mechelli et al., 2005]. Using SC analysis, Soriano‐Mas et al. [2013] demonstrated that SC in the striatum may depend on the existence of functional connectivity between regions. The results of their study suggest that SC might be mediated directly or indirectly by mutually trophic influences of WM tracts [Mechelli et al., 2005] or depend on the release of use‐related trophic factors, which may link synaptic density and neuropil mass within functionally connected regions [Seeley et al., 2009]. This approach has also been widely used in studying different kinds of disease populations and indicated that SC may be used as a method for exploring structure network properties undergoing similar and divergent pathological processes in disease conditions [Bernhardt et al., 2008, 2009; Modinos et al., 2009].
Based on neuropathology [Tritsch and Sabatini, 2012], neuroimaging [Helmich et al., 2010; Pan et al., 2012], and evidence from animal models [Pickrell et al., 2011], we hypothesized that PD may be related to striatal structural network alterations. To test this hypothesis, first, we used T1‐VBM to explore the striatum and extra‐striatal cortical volume atrophy in PD. Second, we use voxel‐wise SC to delineate shared and distinct networks of volumetric intercorrelations among six striatal subdivisions [the bilateral dorsal caudate (DC), superior ventral striatum (VSs), inferior ventral striatum (VSi), dorsal caudal putamen (DCP), dorsal rostral putamen (DRP), and ventral rostral putamen (VRP)] [Di Martino et al., 2008; Soriano‐Mas et al., 2013] and other cortical areas in healthy controls and PD patients. The goal of this study is to determine whether PD patients show segregated SC network patterns of striatal subdivisions which were similar to those found in healthy subjects and the presence of altered striatal‐cortical networks. Finally, an exploratory examination of possible relationships between the area with significant differences in SC in the two groups and clinical variables was also conducted.
MATERIALS AND METHODS
Participants
The study was approved by the Local Ethics Committee on Human Research of Kaohsiung Chang Gung Memorial Hospital in Taiwan. All participants or their guardians provided written informed consent prior to this study. Forty‐eight right‐handed PD patients (21 men and 27 women, mean age 61.7 ± 11.3 years) with no history of neurological or psychiatric illnesses, psychotropic medication, and contraindication to MRI or Madopar (L‐dopa), were prospectively enrolled at the Neurology Department of Kaohsiung Chang Gung Memorial Hospital. Patients were included if they had idiopathic PD diagnosed according to the Parkinson's Disease Society's criteria for idiopathic PD [Hughes et al., 1992] by an experienced neurologist. Of the total number of patients, 10 had never used any anti‐Parkinson's medication, whereas the others used dopaminergic medication (levodopa and dopamine agonists). The disease severity and functional status of each patient were evaluated with the Unified Parkinson's Disease Rating Scale (UPDRS) [Gasser et al., 2003], the modified Hoehn and Yahr stages (HY‐stage) [Goetz et al., 2004], and the Schwab and England activities of daily living scale (SE‐ADL) [Schwab and Engeland, 1969] in “OFF” state. The UPDRS is the scale most commonly used to follow the longitudinal course of PD and consists of evaluation via interview and clinical observation. The UPDRS was developed as a compound scale to capture multiple aspects of PD. It assesses both motor disability (Part II: Activities of daily living) and motor impairment (Part III: Motor section). In addition, Part I addresses mental dysfunction and mood, and Part IV assesses treatment‐related motor and nonmotor complications. The modified HY‐stage provides a global assessment of severity in PD based on clinical findings and functional disability. It is a commonly used system for describing how the symptoms of PD progress from stages 1 through 5. The higher rates describe an increased severity of the disease. The SE‐ADL estimates the abilities of PD patients relative to a completely independent situation. A score of 100% indicates a completely independent patient, while a score of 0% indicates an individual in whom vegetative functions are no longer present.
The patients' disease duration was 6.0 ± 0.6 years, defined as the time since the patient subjectively noticed their first symptoms. For comparison, 30 sex‐ and age‐matched healthy subjects (16 men and 14 women, mean ages 59.1 ± 5.9 years) without medical history of neurologic diseases or psychiatric illnesses, alcohol/ substance abuse, or head injury, and with similar levels of education, were recruited.
MR Image Acquisition
All participants underwent MR imaging on a 3.0 Tesla whole‐body GE Signa MRI system (General Electric Healthcare, Milwaukee, WI) using a standard eight‐channel phase array head coil. Structural images were acquired using standard T1‐weighted three‐dimensional fluid‐attenuated inversion recovery fast spoiled gradient‐recalled echo pulse sequence with the following imaging parameters: TR/TE/TI = 9.5/3.9/450 ms; flip angle = 15°; NEX = 1; field of view = 240 × 240 mm2; slice thickness = 1.3 mm; matrix size = 512 × 512; voxel size = 0.47 × 0.47 × 1.3 mm3; and 110 contiguous slices that aligned to the anterior commissure‐posterior commissure. An additional axial T2‐weighted fast spin‐echo sequence (TR/TE/TI = 4200/102 ms; echo train length = 18; NEX = 2; FOV = 240 mm2; slice thickness = 5 mm; matrix size = 320 × 256; and 18 slices) and an axial T2‐weighted fluid‐attenuated inversion‐recovery sequence (TR/TE/TI = 8000/100/2000 ms; NEX = 1; FOV = 240 mm2; slice thickness = 5 mm; matrix size = 320 × 256; and 18 slices) were also acquired to identify any brain abnormities. An experienced neuroradiologist who was blinded to the participants' statuses checked all MR scans visually to ensure that the participants were free from significant brain injuries. None of the participants in the study was excluded from this neuroradiological evaluation. The total scanning time for this protocol was 20 min for each participant.
DARTEL‐Based Voxel‐Based Morphometry Analysis
T1‐weighted structural MRI scans were preprocessed using diffeomorphic anatomical registration through exponentiated lie algebra‐based [Ashburner, 2007] voxel‐based morphometry (VBM) [Ashburner and Friston, 2000] with VBM8 toolbox (http://dbm.neuro.uni-jena.de) and Statistical Parametric Mapping software (SPM8, Wellcome Institute of Neurology, University College London, UK, http://www.fil.ion.ucl.ac.uk/spm/) running on MATLAB R2010a (Mathworks, Natick, MA).
The DARTEL‐based VBM analysis was performed as follows: all native space T1‐weighted MR images were corrected for bias‐field inhomogeneity, segmented into GM, WM, and cerebrospinal fluid (CSF) using the segmentation model available in the VBM8 toolbox and affine registered to the Montreal Neurological Institute (MNI) standard space tissue probability maps, thus removing global brain volume differences across subjects while retaining large‐scale, interindividual morphometric variation. The segmentation approach of the VBM8 toolbox is based on an adaptive Maximum A Posterior algorithm which does not rely on a priori information regarding tissue probabilities [Rajapakse et al., 1997] and is extended by a partial volume estimation approach to account for mixed voxels with two tissue types [Tohka et al., 2004]. Together with the application of a hidden Markov random field model [Cuadra et al., 2005], this procedure accounts for intensity inhomogeneities and other local variation of image intensity without needing the tissue priors during tissue segmentation. This segmentation approach overcomes the segmentation bias that occurs due to the application of inappropriate tissue priors in subjects with neurological disease. These resulting affine‐aligned GM and WM tissue segments were then iteratively warped to the evolving estimate of their group‐based tissue templates using the DARTEL toolbox in SPM8. To conserve the total amount of GM before and after spatial warping, these resulting GM tissue segments were modulated by nonlinear components derived from the DARTEL deformation procedure and converted voxel sizes to 1.5 mm3 [Bezzola et al., 2011; Muhlau et al., 2012; Ziegler et al., 2012]. Using the modulated tissue segments for subsequent group comparison and SC analysis allows us to make inferences on regional volume measurements rather than tissue density (concentration). To further ensure that statistical comparisons are made on relative (controlling for overall brain size) rather than absolute volumes, we modulated only the nonlinear but not the affine effects of the image registration procedure for tissue segments. Finally, the MNI space modulated GM segments were smoothed with a full‐width Gaussian kernel at half‐maximum (FWHM) equal to 6 mm. The smaller smoothing kernel was chosen based on the minimum Euclidian distance between each seed region of interest (ROI) in the striatal subdivisions, and individual tissue maps were overlapped more precisely using the high‐dimensional DARTEL normalization procedure [Klein et al., 2009]. Global tissue volumes and total intracranial volume (TIV) were estimated in cubic millimeters by counting the voxels representing GM, WM, and CSF in the native space.
SC Analysis: ROI Selection
To investigate the SC pattern of each specific striatal subdivision in healthy controls and patients with PD, we extracted GM volumes using 12 predefined 3.5‐mm‐radius spherical seed ROIs in MNI space using MarsBar v0.43 toolbox (http://marsbar.sourceforge.net). Seed ROIs included the bilateral DC (x = ±13, y = 15, z = 9), VSs (x = ±10, y = 15, z = 0), VSi (x = ±9, y = 9, z = −8), DCP (x = ±28, y = 1, z = 3), DRP (x = ±25, y = 8, z = 6), and VRP (x = ±20, y = 12, z = −3). These regions were selected because they have segregated connectivity patterns with distributed cortical regions as determined by previous SC and functional connectivity studies [Di Martino et al., 2008; Soriano‐Mas et al., 2013]. These seeds were spatially separated by at least 8 mm to minimize the partial volume effect during regional volume extraction.
The detailed definitions of each striatal subdivision were mentioned in a previous study [Di Martino et al., 2008] and are listed as follows: first, the DC and ventral striatum were identified using z coordinates [MNI space] (z > 7 mm as marker for DC and z < 7 mm as marker for ventral striatum) [Postuma and Dagher, 2006]. Second, the ventral straitum was further divided into inferior and superior regions (Vsi and VSs) corresponding to the nucleus accumbens and ventral caudate, respectively [Drevets et al., 1999]. Third, we further divided the putamen into dorsal and ventral regions using z = 2 mm as the boundary [Postuma and Dagher, 2006]. Finally, we identified dorsal caudal, dorsal rostral, and ventral rostral putamen subregions to obtain a finer parcelation. The globus pallidus, substantia nigra, and subthalamic nucleus were excluded in the present study due to limitations of tissue segmentation performances and image contrast issues for these deep brain regions. The seed coordinates were identified as above and were visually checked to be centered within GM areas.
Statistical Analysis
Analysis of demographic data and global tissue volumes
All statistical analysis of demographic data and global tissue volumes were performed by SPSS software, version 17 for Windows (SPSS, Chicago, IL). The demographic data, including age, sex, and handedness, were compared among the study groups by the two‐sample Student's t‐test and Pearson's chi‐square test, where appropriate, and are reported as the mean ± the standard deviation (SD). Differences in global tissue volumes, including the GM, WM, CSF, and TIV, were analyzed by analysis of covariance (ANCOVA) with the participant's age and sex as covariates. The threshold for all statistical significance was set at P < 0.05.
Analysis of image‐based investigations
Voxel‐wise statistical analysis of GM tissue segments were conducted using the general linear model in SPM8. For each of the following voxel‐wise statistical analyses (including group‐wise VBM analysis, structure covariance analysis, and correlation analysis between clinical evaluations and regional GM volume), age and gender were severed as covariates of noninterest to remove possible influences from these covariates. To avoid possible partial volume effects around the boundary between GM and WM, all voxels with a GM probability value lower than 0.2 were eliminated. Statistical inference of all voxel‐wise analyses were considered significant under the criteria of family‐wise error (FWE) corrected P alpha < 0.05, with a cluster size of at least 108 voxels, based on the results of the Monte Carlo simulation (3dClusterSim with the following parameters: single voxel P value of 0.001, 10,000 simulations, FWHM = 8 mm with GM mask). The anatomical structures of the coordinates representing significant clusters were identified using the Peak_nii toolbox (http://www.nmr.mgh.harvard.edu/uphp/mclaren/mclaren_web/resource_files/peak_nii.html). The detailed image‐based statistical models are listed as follows:
Identify disease‐specific atrophy patterns: We assessed voxel‐wise GM volume changes between patients with PD and healthy controls using a one‐factor two‐level (PD patients vs. healthy controls) ANCOVA design.
SC pattern of each striatal subdivision and differences between the two groups: In each group, we used 12 separate multiple regression models (6 × 2, left and right side) to investigate the strength of SC of the mean GM volume of the predefined seed ROIs with all voxels of the preprocessed GM tissue segments in the whole brain manner. A significant positive correlation was deemed as striatal structure covariance [Bernhardt et al., 2008; Mechelli et al., 2005]. To further characterize potential disease‐specific effects on striatal covariance patterns, a group main effect term, a mean seed ROI volume main effect term, and a group X mean seed ROI volume interaction term were contained in a separate general linear model for each striatal subdivisions. This design enabled us to investigate regional differences in SC patterns of the striatal subdivisions between groups by testing the significance of the interaction term at each voxel [Bernhardt et al., 2008, 2009; Mechelli et al., 2005]. As SC maps are by definition group‐level results and as their derivation relies heavily on within‐group covariance structure, which in turn directly impacts between‐group statistical analyses, different group numbers between PD and normal controls might raise the possibility of increased variability within groups at a given voxel. Therefore, additional SC analysis with matched group numbers (30 patients with PD and 30 normal controls) was also performed to verify the sample size effect.
Relationship between disease severity and the GM volume with significant group difference in SC pattern: To further investigate the relationship between SC interactions and disease severity, we extracted the mean GM volume of clusters with significant statistical differences in SC pattern between PD and NC and further correlated with clinical variables.
Relationship between clinical evaluations and regional GM volume: We also investigated the association between regional GM volume and clinical evaluations (including UPDRS I, UPDRS II, UPDRS III, UPDRS, HY‐stage, and SE‐ADL) using six multiple regression models within the patient group.
Analysis by Brain Flipping Procedure According to Patients Motor Symptom Dominance Side
In the present study, 38 (79.17%) and 10 (20.83%) patients with PD, respectively, had left‐sided and right‐sided motor symptom dominance. To determine whether the SC results from the above image analysis procedure were affected by the different motor symptom dominance sides, the additional brain flipping analysis was conducted to solve the asymmetry problem. The brains of PD patients with right‐sided motor symptom dominance were flipped along the x‐axis with the fslswapdim tool of FSL v5.0.6 (Functional Magnetic Resonance Imaging of the Brain Software Library; http://www.fmrib.ox.au.uk/fsl). After flipping, these flipped native space T1 Images were analyzed in the same manner as described earlier.
RESULTS
Demographic Data and Clinical Characteristics of PD Patients and Healthy Controls
The demographic and clinical data of the participants are shown in Table 1. Sex and age did not differ between PD patients and healthy controls (sex: P = 0.410; age: P = 0.248). Compared to healthy controls, PD patients demonstrated lower total GM volume (P = 0.004) and higher CSF volume (P = 0.001). There were no significant difference in WM volume (P = 0.490) and TIV (P = 0.408) between the two groups. The mean UPDRS, HY‐stage, and SE‐ADL score were 42.9, 2.2, and 80.8 for patients with PD respectively. In 38 patients with left‐sided motor symptom dominance, the mean UPDRS values for the right and left sides are 6.2 ± 4.6 and 10.7 ± 4.8, respectively. In 10 patients with right‐sided of motor symptom dominance, the mean UPDRS values for the right and left sides are 10.4 ± 7.0 and 7.9 ± 6.5, respectively. The conventional T1 structural images of all participants showed no morphological abnormalities or image artifacts.
Table 1.
Demographic and clinical characteristics of healthy controls and patients with Parkinson's disease groups
| Demographic variables | PD group | Control group | P value |
|---|---|---|---|
| (n = 48) | (n = 30) | ||
| Age (years) | 61.7 ± 11.3 | 59.1 ± 5.9 | 0.248 |
| Sex (male/female) | 21/27 | 16/14 | 0.410 |
| Education (years) | 9.20 ± 3.11 | 7.71 ± 4.81 | 0.135 |
| GMV (l) | 0.511 ± 0.060 | 0.553 ± 0.061 | 0.004a |
| WMV (l) | 0.540 ± 0.054 | 0.552 ± 0.060 | 0.490 |
| CSFV (l) | 0.248 ± 0.044 | 0.229 ±0.033 | 0.001a |
| TIV (l) | 1.300 ± 0.109 | 1.334 ± 0.130 | 0.408 |
| Dopaminergic medication | 365.5 ± 359.9 | – | – |
| UPDRS I | 3.8 ± 2.8 | – | – |
| UPDRS II | 12.2 ± 8.6 | – | – |
| UPDRS III | 28.8 ± 17.0 | – | – |
| UPDRS total score | 42.9 ± 26.4 | – | – |
| Modified HY‐stageb | 2.2 ± 1.2 | – | – |
| SE‐ADLc | 80.8 ± 19.1 | – | – |
| Motor symptom dominance side | 38 L't/10 R't |
Data are demonstrated as means ± standard deviation. Abbreviations: CSFV, cerebrospinal fluid volume; GMV, gray matter volume; Modified H&Y stage, L't, left side; Modified Hoehn and Yahr stages; PD, Parkinson's disease; R't, right side; S&E ADL, Schwab and England activities of daily living scale; TIV, total intracranial volume; UPDRS, Unified Parkinson's Disease Rating Scale; WMV, white matter volume.
Indicates significant differences (P < 0.05) in appropriate statistical tests.
For Modified HY‐stage, maximum stage is 5.
For SE‐ADL, minimum points is 0, suggesting vegetative functions; maximum point is 100, suggest completely independent.
indicates the clinical evaluations which were specific for patient group.
Regional GM Volume Reduction in Patients with PD
The location and spatial extent of anatomical regions with significant differences in GM volume between two study groups are presented in Table 2 and Figure 1. Compared to healthy controls, PD patients showed a significant GM volume reduction in the following brain regions: (1) bilateral cerebellar tonsil, (2) bilateral caudate nucleus, (3) bilateral limbic system (cingulate, amygdale, and parahippocampus), (4) right prefrontal cortex, (5) temporal lobe (bilateral transverse, right middle, and left inferior), (6) bilateral inferior parietal lobes, (7) bilateral occipital, and (8) left thalamus. The significant atrophied striatum indicated that it is the hallmark region in patients with PD.
Table 2.
Anatomical regions with significant gray matter volume reductions in patients with Parkinson's disease compared with the healthy control group
| MNI coordinates | Cluster size | Side | Anatomical region | Brodmann area | Z‐score | ||
|---|---|---|---|---|---|---|---|
| x | y | z | |||||
| −12 | −45 | −53 | 8657 | Lt. | Cerebellar tonsil | a | 5.42 |
| 33 | −70 | −33 | Rt. | Cerebellar tonsil | a | 5.11 | |
| 8 | 18 | −3 | 3331 | Rt. | Caudate | a | 5.15 |
| −2 | 8 | −11 | Lt. | Anterior cingulate | BA 25 | 4.70 | |
| −6 | 17 | −2 | Lt. | Caudate | a | 4.67 | |
| −35 | −12 | −39 | 3303 | Lt. | Parahippocampal gyrus | a | 4.54 |
| 51 | −9 | 4 | 2777 | Rt. | Precentral gyrus | BA 6 | 5.07 |
| 56 | −15 | 9 | Rt. | Transverse temporal gyrus | BA 41 | 4.94 | |
| −3 | −34 | 33 | 792 | Lt. | Cingulate gyrus | BA 31 | 4.89 |
| −48 | −24 | 12 | 691 | Lt. | Transverse temporal gyrus | BA 41 | 4.77 |
| 59 | −40 | 4 | 552 | Rt. | Middle temporal gyrus | BA 22 | 4.33 |
| −18 | −70 | 12 | 519 | Lt. | Posterior cingulate | BA 30 | 5.13 |
| 29 | −3 | −21 | 456 | Rt. | Parahippocampal gyrus | a | 4.23 |
| 41 | 45 | 24 | 423 | Rt. | Middle frontal gyrus | BA 10 | 4.32 |
| 15 | −72 | 7 | 339 | Rt. | Lingual gyrus | BA 18 | 4.25 |
| 33 | −27 | −26 | 328 | Rt. | Parahippocampal gyrus | BA 35 | 4.11 |
| 56 | −3 | −26 | 264 | Rt. | Middle temporal gyrus | BA 21 | 3.83 |
| −8 | −18 | 18 | 192 | Lt. | Thalamus | a | 3.76 |
| 24 | 62 | 1 | 166 | Rt. | Superior frontal gyrus | BA 10 | 4.11 |
| 47 | −33 | 62 | 164 | Rt. | Inferior parietal lobule | BA 40 | 3.73 |
| −45 | −34 | 40 | 125 | Lt. | Inferior parietal lobule | BA 40 | 4.28 |
| −51 | −13 | −41 | 122 | Lt. | Inferior temporal gyrus | BA 20 | 3.71 |
| 41 | −76 | 13 | 121 | Rt. | Middle occipital gyrus | BA 19 | 3.64 |
Gray matter volume reduction in patients with Parkinson disease is described in terms of MNI coordinates, brain regions/side, and corresponding Brodmann area. The statistical criteria for voxel‐based morphometry analysis were set as FWE corrected P alpha < 0.05 (corrected for multiple comparisons by means of a Monte Carlo simulation). Cluster extent and Z‐score of the voxel with the strongest group effect in a given cluster are also listed. Abbreviations: BA, Broadmann area; FWE, family wised error; Lt, left side; MNI, Montreal Neurological Institute; Rt, right side.
Indicates that there is no Brodmann area around the center of a 5‐mm radius search range.
Figure 1.
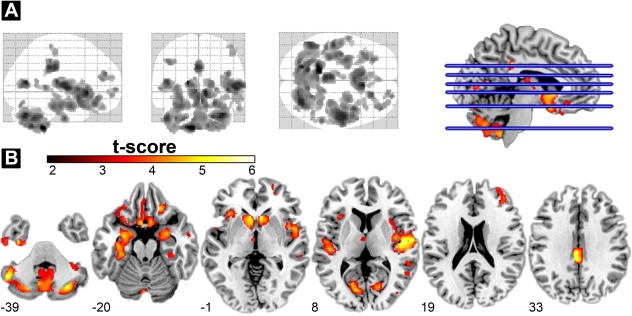
GM volume reduction in patients with PD. (A) Glass‐brain showing the spatial distribution of GMV reduction in patients with PD (FWE‐corrected P alpha < 0.05 by means of a Monte Carlo simulation). (B) Regions showing GMV differences between PD patients and the healthy control group as shown by VBM at defined MNI coordinates (z direction). The statistical parametric map was overlaid on a MNI standard space T1 template. The cold color map showed a significantly smaller regional GMV in the cerebellum, caudate, limbic system, (including the insula, parahippocampus, and cingulate cortex) and part of the prefrontal cortex in PD. No area of GMV increase was found in the patient group. Abbreviations: FWE, family‐wise error; GMV, gray matter volume; MNI, Montreal Neurological Institute; PD, Parkinson's disease; VBM, voxel‐based morphometry.
The Distinct Patterns of SC Networks of Striatal Subdivisions in Two Study Groups
SC pattern of caudate seeds in healthy control group
Our results show a segregation of the patterns of SC for the DC, VSs, and VSi (Fig. 2). First, three caudate seeds showed a strong autocorrelation with the caudate nucleus itself. The DC seeds further correlated with the bilateral cerebellum. The left DC region demonstrated a specific association with the right paracentral lobe. The VSs regions demonstrated a pattern of SC with the putamen and the anterior, medial frontal, and temporal/insular lobes. A significant correlation was detected in the VSi regions at the medial orbitofrontal cortex, subcallosal region, medial frontal lobe, middle frontal lobes, and the insula.
Figure 2.
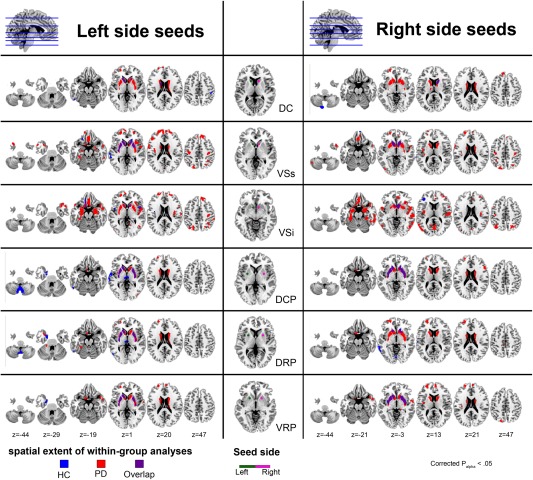
Statistical maps of the SC network for each striatal subdivisions in healthy controls group and in patients with PD group. The middle column illustrates the seed ROIs used in this study. The seed ROIs include three subdivisions for the caudate (DC, VSs, and VSi) and putamen (DCP, DRP, and VRP). Results from within group analyses for each striatal subdivision are illustrated on the left and right columns. The left column shows the result from the left‐side seed and the right column shows the result from the right‐side seed respectively. The statistical criteria for within group SC analyses were set at FWE corrected P alpha< 0.05 (corrected for multiple comparisons by means of a Monte Carlo simulation). Results were overlaid on a MNI standard space T1 template. Abbreviations: DC, dorsal caudate; DCP, dorsal caudal putamen; DRP, dorsal rostral putamen; FWE, family‐wise error; HC, healthy control; MNI, Montreal Neurological Institute; PD, Parkinson's disease; ROIs, region of interests; SC, structural covariance; VSi, inferior ventral striatum; VSs, superior ventral striatum; VRP, ventral rostral putamen.
SC pattern of putamen seeds in healthy control group
Patterns of SC for the DCP, DRP, and VRP were less spatially extensive than those of the caudate subdivisions (Fig. 2). Bilateral DCP seeds correlated with the bilateral caudate and putamen. The left seed of the DCP correlated also with the medial thalamus, cerebellum, left uncus lobe, and left temporal lobe. For DRP, both seeds correlated with the caudate and left temporal lobe. The left seed of the DRP demonstrated correlations also with the bilateral putamen, bilateral medial thalamus, bilateral cerebellum, and left uncus, whereas the right seed of the DRP correlated specifically with the left occipital lobe. For VRP, both seeds showed autocorrelations with the putamen and left caudate. The left seed of the VRP correlated with the left uncus.
SC pattern of caudate seeds in patients with PD
The SC patterns of the caudate region in patients with PD also demonstrated similar segregation networks as those found in healthy controls (Fig. 2). More widespread SC was found in the caudate, putamen, and superior frontal lobe for the DC in PD patients, compared to healthy controls. For VSs, significant SC was shown in the caudate, putamen, and temporal lobe. In addition, widespread SC was found in the parahippocampus, orbitofrontal, dorsolateral prefrontal cortex, precuneus, and parietal lobes in PD patients, compared to the healthy controls. In contrast to VSs seed, the VSi regions demonstrated a more widespread correlation with the orbitofrontal, inferior frontal, and subcallosal gyri, amygdalae, parahippocampus, insula, occipital lobe, and temporal lobe but less widespread at the putamen and dorsolateral prefrontal cortex.
SC pattern of putamen seeds in patients with PD
For the DCP, PD patients demonstrated a significant SC in the caudate, putamen, and superior frontal lobe. For DRP, both seeds were demonstrated more widespread correlation with the caudate and putamen. In addition, more widespread correlation was found in the medial and middle frontal lobes. For VRP, widespread correlation was demonstrated with the caudate, putamen, and anterior cingulated, medial, and superior frontal lobes. Right VRP further correlated with the left parietal lobe (Fig. 2). Further SC analysis was also performed with matched sample sizes for PD and HC groups (30 vs. 30) and resulted in similar findings also indicating that patients with PD have wider SC patterns than HCs. These results are displayed in Supporting Information Figure S2.
Difference in SC Network of Striatal Subdivisions Between Patients with PD and Healthy Controls
Decrease in SC in patients with PD
Table 3 and Figure 3 demonstrate differences in striatal‐cortical SC patterns between patients with PD and healthy controls in voxel‐wise manner. For most striatal seeds, including bilateral DC, left VSs, left VSi, bilateral DCP, and bilateral DRP, a decrease in SC in patients with PD compared to healthy controls was found to be located mainly in the bilateral posterior cerebellum. Furthermore, decreased SC in patients with PD was also observed between the left DC and right parietal lobe (BA 40). Right DRP also decreased in SC with the right inferior frontal gyrus and left thalamus.
Table 3.
Anatomical regions with significant decreased and increased structural covariance of striatum subdivisions in patients with Parkinson's disease compared with the healthy control group
| MNI coordinates | Cluster size | Anatomical region | Z‐score | Structural covariance | |||
|---|---|---|---|---|---|---|---|
| x | y | z | HC | PD | |||
| Decreased SC in PD groups | |||||||
| Caudate | |||||||
| Lt. DC | |||||||
| 12 | −60 | −50 | 1182 | Rt. Cerebellar tonsil | 4.49 | 0.525† | 0.075 |
| −11 | −51 | −51 | Lt. Cerebellar tonsil | 4.49 | |||
| 44 | −34 | 51 | 331 | Rt. Inferior parietal lobule | 4.3 | 0.606‡ | 0.099 |
| 48 | −25 | 46 | Rt. Postcentral gyrus | 3.8 | |||
| Rt. DC | |||||||
| −17 | −81 | −47 | 458 | Lt. Inferior semilunar lobule | 3.96 | 0.709‡ | 0.140 |
| 21 | −76 | −48 | 202 | Rt. Inferior semilunar lobule | 3.73 | 0.680‡ | 0.376† |
| Lt. VSs | |||||||
| 12 | −60 | −50 | 440 | Rt. Cerebellar tonsil | 3.78 | 0.494† | 0.162 |
| Lt. VSi | |||||||
| −41 | −72 | −47 | 213 | Lt. Inferior semilunar lobule | 3.81 | 0.446† | −0.013 |
| Putamen | |||||||
| Lt. DCP | |||||||
| −12 | −64 | −48 | 1268 | Lt. Cerebellar tonsil | 5.06 | 0.672‡ | 0.212 |
| 41 | −58 | −38 | 226 | Rt. Cerebellar tonsil | 4.03 | 0.646‡ | 0.022 |
| Rt. DCP | |||||||
| −14 | −64 | −48 | 444 | Lt. Cerebellar tonsil | 4.67 | 0.526† | 0.170 |
| Lt. DRP | |||||||
| −12 | −64 | −48 | 771 | Lt. Cerebellar tonsil | 4.62 | 0.613‡ | 0.099 |
| 51 | −62 | −38 | 141 | Rt. Cerebellar tonsil | 3.73 | 0.583‡ | −0.105 |
| Rt. DRP | |||||||
| −47 | −63 | −47 | 204 | Lt. Cerebellar tonsil | 3.77 | 0.523† | 0.101 |
| 50 | 27 | 3 | 137 | Rt. Inferior frontal gyrus | 3.53 | 0.601‡ | −0.085 |
| −8 | −31 | 4 | 119 | Lt. Thalamus | 3.74 | 0.639‡ | 0.182 |
| Increased SC in PD groups | |||||||
| Caudate | |||||||
| Rt. VSs | |||||||
| 54 | −63 | −12 | 305 | Rt. Fusiform gyrus | 3.72 | −0.275 | 0.573‡ |
| Lt. VSi | |||||||
| 41 | −81 | −9 | 216 | Rt. Fusiform gyrus | 3.53 | −0.340 | 0.461‡ |
| Rt. VSi | |||||||
| 59 | −60 | −11 | 1643 | Rt. Middle temporal gyrus | 5.13 | −0.560† | 0.607‡ |
| −27 | −30 | −18 | 912 | Lt. Parahippocampal gyrus | 4.42 | −0.457† | 0.614‡ |
| 65 | −16 | 15 | 185 | Rt. Postcentral gyrus | 4.21 | −0.270 | 0.508‡ |
| −48 | −63 | 3 | 122 | Lt. Middle temporal gyrus | 3.64 | −0.443† | 0.537‡ |
| Putamen | |||||||
| Lt. DRP | |||||||
| −30 | 50 | 19 | 138 | Lt. Middle frontal gyrus | 3.96 | −0.578‡ | 0.438† |
| Lt. VRP | |||||||
| 15 | 6 | 13 | 308 | Rt. Caudate | 4.34 | −0.007 | 0.752‡ |
| −15 | 11 | 12 | 295 | Lt. Caudate | 4.27 | 0.127 | 0.786‡ |
| Rt. VRP | |||||||
| −17 | 11 | 10 | 249 | Lt. Caudate | 3.77 | −0.109 | 0.679‡ |
| 15 | 3 | 15 | 181 | Rt. Caudate | 3.68 | −0.166 | 0.639‡ |
Significant between‐group differences in SC for each striatal subdivisions. Results are described in terms of MNI coordinates and brain regions and sides. The statistical criteria for SC interaction analysis were set as FWE corrected P alpha < 0.05 (corrected for multiple comparisons by means of a Monte Carlo simulation). Cluster extent and Z‐score of the voxel with the strongest group effect in a given cluster are listed. Gray matter volume correlation between each striatal subdivisions and other areas of the cortex are accounted for age and sex in the PD and NC groups, respectively (†P < 0.05; ‡P < 0.001). Abbreviation: DC, dorsal caudate; DCP, dorsal caudal putamen; DRP, dorsal rostral putamen; FWE, family wised error; HC, healthy control; Lt, left side; MNI, Montreal Neurological Institute; PD, Parkinson's disease; Rt, right side; SC, structure covariance; VRP, ventral rostral putamen; VSi, inferior ventral striatum; VSs, superior ventral striatum.
Figure 3.
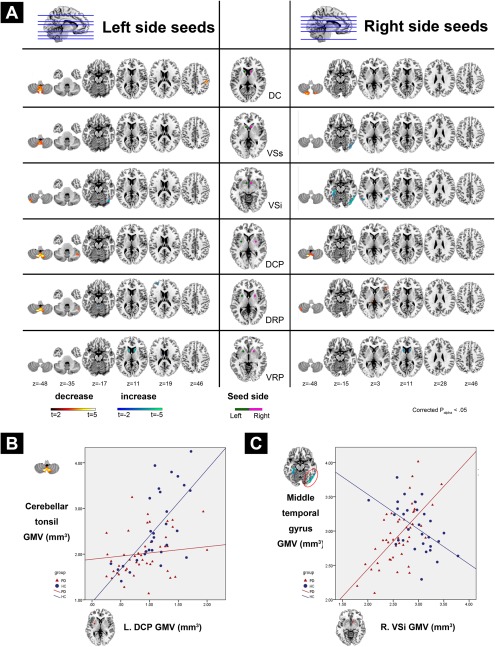
Group differences in SC pattern for each striatal subdivisions between healthy controls and patients with PD. (A) The middle column shows the seed ROIs used in this study. Statistical parametric maps show brain regions in which GM volume covaried with the corresponding bilateral seed ROIs differently between groups. (B) Areas showing decreased SC in patients with PD compared to HC were presented in “hot” color (i.e., steeper positive correlation slope between regional GM volume and corresponding striatal subdivisions in HC compared to PD patients). (C) Areas showing increased SC in patients with PD compared to HC were presented in “cold” color (i.e., steeper positive correlation slope between regional GM volume and corresponding striatal subdivisions in PD patients compared to HC). The detailed slope value for each group is listed in Table 3. The statistical criteria for between group SC analyses were set at FWE corrected P alpha < 0.05 (corrected for multiple comparisons by means of a Monte Carlo simulation). Results were overlaid on a MNI standard space T1 template. Abbreviations: DC, dorsal caudate; DCP, dorsal caudal putamen; DRP, dorsal rostral putamen; FWE, family‐wise error; HC, healthy control; MNI, Montreal Neurological Institute; PD, Parkinson's disease; ROIs, region of interests; SC, structural covariance; VSi, inferior ventral striatum; VSs, superior ventral striatum; VRP, ventral rostral putamen.
Increase in SC in patients with PD
Our result also show patterns of structural associations in selective seeds wherein PD demonstrated a higher SC compared to the healthy controls (negative interaction). The right VSs and bilateral VSi expressed increased SC with the left posterior temporal lobe in patients with PD, compared to the healthy controls. The right VSi also showed an increased SC with the left parahippocampal gyrus in patients with PD. For the putamen, an increased SC was also found between the bilateral VRP and bilateral caudate in patients with PD.
Brain flipping analysis for different motor symptom dominance sides in patients with PD
The major results for the group differences (PD patients vs. healthy controls) in the SC networks of striatal subdivisions were similar after brain flipping in the 10 PD patients with right‐sided motor symptom dominance (Supporting Information Table S1 and Fig. S3).
Correlations Between Disease Severity and Regions with SC Group Differences
In region with decrease SC in PD (Supporting Information Fig. S4), GM volume in right inferior semilunar lobule (from right DC SC analysis) were negative associated with UPDRS II (r = −0.42, P = 0.004, Supporting Information Fig. S4a), III (r = −0.293, P = 0.048, Supporting Information Fig. S4b), and HY‐stage (r = −0.296, P = 0.046, Supporting Information Fig. S4c), and positive associated with SE‐ADL (r = 0.43, P = 0.003, Supporting Information Fig. S4f). We also found SE‐ADL was positive associated with GM volume in cerebellar tonsil (from left DC SC analysis; r = 0.292, P = 0.049, Supporting Information Fig. S4d), left inferior semilunar lobule (from right DC SC analysis; r = 0.314, P = 0.034, Supporting Information Fig. S4e), right cerebellar tonsil (from left DCP SC analysis; r = 0.297, P = 0.045, Supporting Information Fig. S4h), and left cerebellar tonsil (from right DRP SC analysis; r = 0.331, P = 0.024, Supporting Information Fig. S4i). In region with increase SC in PD, only GM volume in left middle temporal gyrus (from right VSi SC analysis) was positive associated with SE‐ADL (r = 0.299, P = 0.044, Supporting Information Fig. S4g). There was no association found between disease duration and region with SC pattern differences between the two groups.
Correlations Between Disease Severity and Brain Volume Loss
Multiple regression analysis showed a significant positive correlation between SE‐ADL and GM volume in the cerebellum, the left middle temporal, and the left medial frontal gyri. A higher modified HY‐stage was negatively associated with a smaller GM volume in the cerebellum, and in the left middle temporal, left medial frontal, and right middle frontal gyri. For subtests of the UPDRS evaluation, a higher UPDRS I score was negatively associated with a smaller GM volume in the right superior temporal gyrus. A higher UPDRS II score was negatively associated with a smaller GM volume in the right cerebellar tonsil, cingulate, middle frontal, and left middle temporal gyri. A higher UPDRS III score was negatively associated with a smaller GM volume in the left temporal gyrus and right insula (Table 4 and Fig. 4). No association was found between the total UPDRS score and regional brain volume. Results are shown in Table 4 and Figure 4.
Table 4.
Correlation between the regional gray matter volume and clinical evaluations in patients with Parkinson's disease
| MNI coordinates | Cluster size | Side | Anatomical region | Brodmann area | Z‐score | Partial CC | ||
|---|---|---|---|---|---|---|---|---|
| x | y | z | ||||||
| Modified HY‐stage | ||||||||
| 37 | −46 | −52 | 304 | Rt. | Cerebellar tonsil | a | −3.90 | −0.54 |
| 1 | 0 | 54 | 196 | Lt. | Medial frontal gyrus | BA 6 | −3.88 | −0.54 |
| −60 | −46 | −4 | 180 | Lt. | Middle temporal gyrus | BA 37 | −3.56 | −0.50 |
| −63 | −33 | −6 | 174 | Lt. | Middle temporal gyrus | BA 21 | −3.65 | −0.51 |
| SE‐ADL | ||||||||
| 37 | −46 | −54 | 562 | Rt. | Cerebellar tonsil | a | 4.93 | 0.65 |
| −66 | −22 | −7 | 193 | Lt. | Middle temporal gyrus | BA 21 | 4.13 | 0.57 |
| −45 | −51 | −28 | 180 | Lt. | Culmen | a | 4.08 | 0.56 |
| 1 | −1 | 54 | 126 | Lt. | Medial frontal gyrus | BA 6 | 4.09 | 0.57 |
| 39 | 12 | 49 | 124 | Rt. | Middle frontal gyrus | BA 6 | 3.92 | 0.55 |
| 34 | 12 | 61 | 114 | Rt. | Middle frontal gyrus | BA 6 | 3.99 | 0.55 |
| −40 | −57 | −45 | 110 | Lt. | Cerebellar tonsil | a | 3.60 | 0.51 |
| UPDRS I | ||||||||
| 50 | −50 | 21 | 111 | Rt. | Superior temporal gyrus | a | 3.63 | −0.49 |
| UPDRS II | ||||||||
| 11 | 0 | 48 | 617 | Rt. | Cingulate gyrus | BA 24 | 4.06 | −0.61 |
| 35 | −48 | −53 | 369 | Rt. | Cerebellar tonsil | a | 4.27 | −0.61 |
| 35 | 11 | 63 | 179 | Rt. | Middle frontal gyrus | a | 4.31 | −0.55 |
| −68 | −20 | −6 | 175 | Lt. | Middle temporal gyrus | BA 21 | 4.15 | −0.58 |
| UPDRS III | ||||||||
| −62 | −40 | −19 | 617 | Lt. | Inferior temporal gyrus | BA 20 | 4.20 | −0.49 |
| 8 | 0 | 50 | 394 | Rt. | Cingulate gyrus | BA 24 | 4.19 | −0.59 |
| −65 | −50 | 3 | 382 | Lt. | Middle temporal gyrus | BA 22 | 3.87 | −0.45 |
| 43 | −51 | −50 | 231 | Rt. | Cerebellar tonsil | a | 4.04 | −0.58 |
| 32 | 12 | 62 | 229 | Rt. | Middle frontal gyrus | a | 4.44 | −0.55 |
| 45 | −24 | 14 | 129 | Rt. | Insula | a | 4.26 | −0.46 |
Multiple regression analysis showing different clinical evaluations are associated with gray matter volume in distinct brain regions. Results are described in terms of MNI coordinates, brain regions/side, and corresponding Brodmann area. The statistical criteria for correlation analysis were set as FWE corrected P alpha < 0.05 (corrected for multiple comparisons by means of a Monte Carlo simulation). Cluster extent, Z‐score, and partial correlation coefficient of the voxel with the strongest effect in a given cluster are listed. Abbreviations: BA, Broadmann area; CC, correlation coefficient; FWE, family‐wised error; HY‐stage, Hoehn and Yahr stage; Lt, left side; MNI, Montreal Neurological Institute; Rt, right side; SE‐ADL, Schwab and England activities of daily living scale; UPDRS, Unified Parkinson's Disease Rating Scale.
Indicates that there is no Brodmann area around the center of a 5‐mm‐radius search range.
Figure 4.
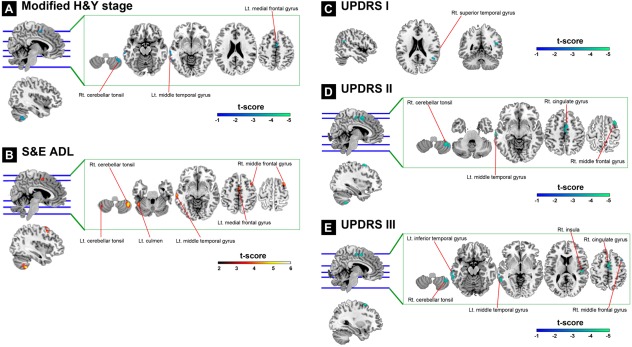
Association between clinical evaluations and GM volume in patients with PD shown by multiple regression models. (A) Shows significant negative correlation between GM volume and the modified H&Y stage in the right cerebellar tonsil, left middle temporal gyrus, and left medial frontal gyrus. (B) Shows significant positive correlations between GM volume and S&E ADL in the bilateral cerebellar tonsil, left culmen, left middle temporal gyrus, left medial frontal gyrus, and right middle frontal gyrus. (C) Shows significant negative correlations between GM volume and UPDRS I in the right superior temporal gyrus. (D) Shows significant negative correlations between GM volume and UPDRS II in the right cerebellar tonsil, left middle temporal gyrus, right cingulate gyrus, and right middle frontal gyrus. (E) Shows significant negative correlations between GM volume and UPDRS III in the right cerebellar tonsil, left inferior temporal gyrus, left middle temporal gyrus, right insula, right cingulate gyrus, and right middle frontal gyrus. The statistical criteria for each multiple regression model are set as FWE‐corrected P alpha < 0.05 (by means of a Monte Carlo simulation). Results were overlaid on a MNI standard space T1 template. The colored bar indicates the level of t score. Abbreviations: FWE, family‐wise error; L't, left side; Modified H&Y stage, Modified Hoehn and Yahr stages; MNI, Montreal Neurological Institute; R't, right side; S&E ADL, Schwab and England activities of daily living scale; UPDRS, Unified Parkinson's Disease Rating Scale.
DISCUSSION
This study used voxel‐based analysis approach to demonstrate alterations in the regional GM volume and SC patterns of striatal subdivisions in PD patients. First, our VBM findings confirmed the results of previous studies in which both the striatum and extra‐striatal cortex were found to be affected in patients with PD. We further confirmed the significance of the striatum by studying its related SC patterns. Our results replicated and extended previous findings wherein SC patterns of striatal subdivisions in healthy controls, though generated from isolated subcortical seed ROIs, were shown to exhibit similar anatomical and spatial segregations found in the functional networks of healthy subjects. We further found increased as well as decreased SC between a priori selected striatal subregions and several other brain areas in PD patients, compared to healthy controls. Finally, the areas with significant differences in SC between the two study groups were further associated with disease severity. These findings support the hypothesis that PD relates to striatal structural network alterations.
Our group analysis localized marked atrophy in the cerebellum, caudate, limbic system, including the insula, parahippocampus, cingulate cortex, and part of the prefrontal cortex. The findings replicate previous VBM‐based meta‐analysis results in patients with PD [Pan et al., 2012]. Besides the cerebellum, we found the caudate nucleus to be actually the second most affected GM region in the PD group. Our volumetric analysis supports the fundamental theory that the striatum is a vulnerable region in PD patients primarily resulting from the degeneration of nigrostriatal dopaminergic neurons. Volume atrophy in the caudate reflects striatal dopamine deafferentation and leads to classic extrapyramidal motor impairment [Gale et al., 2008]. In addition, our VBM results support the possible involvement of cortico‐basal ganglia‐thalamo‐cortical loops [Baev et al., 2002; Gale et al., 2008] in contributing to nonmotor symptoms in PD. Extra‐striatal cortical atrophy, which includes the frontal and limbic systems, was reported to be connected with different subdivisions of the striatum [Di Martino et al., 2008; Draganski et al., 2008]. It also raises the possibility that extra‐striatal cortical alterations might correspond to specific striatal subdivision changes in patients with PD.
A clear‐cut answer for biological meaning of SC may not be possible, because the functional correlations among different regions of the human cortex are yet to be fully understood. It is likely that these coordinations reflect the contribution of heredity [Alexander‐Bloch et al., 2013; Suddath et al., 1990; Tramo et al., 1998] or environmental influences [Draganski et al., 2004; Mechelli et al., 2004] which further decide the positive and negative associations we report. The allocation and the amount of underlying neural circuitry in a brain had been demonstrated to influence external behaviors in animal [Purves et al., 1996] and also in human [Mechelli et al., 2004]. In present study, brain areas that are highly correlated in size are often part of systems that are known to subserve particular behavioral or cognitive functions, highlighting the importance of known functional relationships between anatomical regions [Alexander‐Bloch et al., 2013].
Using SC analysis, first, we demonstrated a ventromedial‐to‐dorsolateral gradient in the striatum with a roughly parallel gradient outside the striatum in healthy participants [Soriano‐Mas et al., 2013]. Nevertheless, the patterns of resting‐state MRI functional connectivity and tractography‐based assessments of the same striatal subdivisions in the healthy population were more extended than those mentioned in the SC explored in this study [Di Martino et al., 2008; Draganski et al., 2008; Postuma and Dagher, 2006]. The discrepancy between these results may be explained by the consistent maintenance of neuronal homeostasis by increased functional plasticity, which tends to lessen the need for structural plasticity between neurons [Butz et al., 2009]. Actually, the functional network was modulated by interneuronal synaptic plasticity strength without significant inspiriting structural plasticity alterations in most conditions. In the present study, SC between the DC and the dorsolateral prefrontal cortex and between the DCP and the motor‐premotor cortices was absent in healthy subjects. Within the striato‐cortical circuit models, most information should be indirectly conveyed through specific thalamic nuclei as a function of the striato‐cortical loop involved [Middleton and Strick, 2000], which might minimize the necessity of structural similarity between the striatum and cortex. In a previous study, the thalamo‐cortical anatomical network was mapped by diffusion tensor imaging [Behrens et al., 2003], but failed to repeat the result of SC using cortical thickness as the interest feature [Bernhardt et al., 2009]. We suggest that under normal conditions, most information processing is guarded by functional plasticity unless their capacity deteriorates in disease with a subsequent increase in structural remodeling to compensate for functional shortening. In the present study, an increased SC in DC and the dorsolateral prefrontal cortex, and in the DCP and the motor–premotor cortical connections in PD patient support this idea.
Striatal SC has not been previously studied for PD. The network degeneration hypothesis suggests that syndromic atrophy patterns and SC could recapitulate healthy functional network architectures. Remarkably, these distributed network maps, though generated from isolated striatal seed ROIs in PD patients, closely mirrored the SC patterns seen in the healthy controls (Fig. 2). This suggests that in the pathological processes of PD occurring in the striatum affect the same striato‐cortical networks that covary with the striatum in the healthy brain. This finding supports the hypothesis that human neural networks can be defined by synchronous neural activity, a common cortico‐trophic destiny, and selective vulnerability to neurodegenerative illness [Seeley et al., 2009].
Our SC results support the concept that structural remodeling might be the end result of accommodation for long‐term functional plasticity. Compared to the caudate, the putamen is affected less in PD patients (not found in VBM atrophy map under FWE corrected P alpha < 0.05, but became involved under a lenient criterion with uncorrected P < 0.001). Compared to putamen, a relatively widespread strito‐cortical interconnection was observed in the caudate, which exhibited higher connections to the limbic system, including the cingulated gyrus, parahippocampus, insula, temporal lobe, and also to the prefrontal cortex and the medial thalamus in patients with PD. The topographic distribution of caudate SC in PD patient in our study was more similar to the topological patterns of functional connectivity pattern in healthy populations [Di Martino et al., 2008]. Although, this result may arise from correlated tissue damage due to shared vulnerability to approximate diffuse insults [Martin et al., 1998], altered associated neuronal circuit may also play a role in the structural plasticity. The results of our study demonstrate limitations in SC in healthy controls or less affected putamen to display the complete picture of functional circuits in the striatum. However, highly consistent network patterns between SC in PD patients and functional connectivity in healthy subjects indicate that anatomical plasticity may be modulated by normal functional connections. Interregional SC is the result to adapt functional alterations in PD.
In the analysis of interaction for SC, we found increases in the strength of correlation in PD patients mainly between the caudate seed and dopaminergic associated cortex. Significant positive correlations in patients that were weaker in control may yield several interpretations. They may stem from correlated tissue loss in both adjacent and distant areas due to shared vulnerability to an altered neurotransmitter‐related neuronal circuitry. Optimal dopamine levels are important especially for structural plasticity in the limbic system and prefrontal cortices [Neufeld et al., 2009]. A sustained decrease in dopamine activity is likely to lessen the protective effect of dopamine against glutamate‐induced excitotoxicity [Vaarmann et al., 2013] with subsequent neuron loss and structural plasticity. Meantime, the abnormal activation of some of those glutamatergic pathways receptors (mGluR1 and mGluR5) within the basal ganglia circuitry has been proposed to account for cognitive and motor alterations in patients with PD [Marino et al., 2003]. Its abundant expression in the frontal cortex, limbic system, and striatal brain regions might also explain our findings, wherein structural plasticity might propagate and spread along those vulnerable areas [Romano et al., 1995].
Another possibility that neurotransmitters modulate SC strength in PD patients is based on embryonic observation. Results from previous studies suggest that, during brain development and maturation, dopamine may help modulate neuronal growth and model neuronal and synaptic architecture [Costa et al., 2004; Lankford et al., 1988]. In addition, dopamine receptor activation has been proved to mobilize the striatal neuronal cytoskeleton and modulate GABA neuron migration in the basal forebrain, supporting the result of an increased mesotelencephalic intranetwork connection [Crandall et al., 2007]. Finally, concomitant higher ability to display synaptic rewiring and changes in the dendritic arborization in the limbic system than in neocortex, eventually increasing interregional morphometric correlations in caudate‐limbic network [Butz et al., 2009; Neufeld et al., 2009]. We believe dopamine depletion in PD may, therefore, force neuron remodeling and structural plasticity in both its modulated region and their downstream areas [Braak et al., 2000].
Conversely, increased SC in the controls that became weaker or absent in PD were localized mainly in the cerebellum, which is consistent with the findings of a previous functional study [Wu et al., 2011]. Anatomical studies identified reciprocal connections between the basal ganglia and cerebellum [Bostan et al., 2010]. In addition, WM abnormalities in the cerebellum have been reported in PD [Wu and Hallett, 2013]. Therefore, WM disconnection disrupts the trophic interregional relationships in patients and induces further structural changes [Gilley and Coleman, 2010].
Furthermore, our VBM results showed significant atrophy in the cerebellum. Increasing evidence suggests that the cerebellum may play roles in the pathophysiology of PD [Wu and Hallett, 2013]. Pathological changes in the cerebellum might result from dopaminergic degeneration, abnormal drives from the basal ganglia, and dopaminergic treatment, and may account for some clinical symptoms of PD. Furthermore, balance between different neurotransmitters might also play the role in SC modulation. In the patients with PD, the cerebellar cortical norepinephrine levels were significantly below normal and cerebellar dysfunction related to norepinephrine may contribute to some abnormalities of motor performance in this disorder [Kish et al., 1984]. Therefore, atrophy in the cerebellar regions, which decreases their structural connection with the striatum, may reflect processes secondary to the spread of degeneration through other routes than the striatal pathways in PD. In fact, the major role of the cerebellum in PD is likely to include both pathological and compensatory effects. In functional MRI studies, strengthened connections between cortico‐cerebellar motor regions were observed to balance weakened striatal‐cortical and striatal‐cerebellar connections for basal ganglia dysfunction [Wu et al., 2011]. The compensatory effect may help maintain better motor and nonmotor functions. The striato‐cerebelluar functional disconnection can result in the loss of SC between the striatum and cerebellum. A consistent finding in previous functional studies that compensatory increase of cortico‐cerebellar connections or hyperactive cerebello‐thalamo‐cortical loop in PD, together with weakened striato‐cerebellar network might contribute to this structural plasticity [Palmer et al., 2010]. Yet, this concept needs more studies to support it.
Both whole‐brain regression analysis and GM volume extracted from SC pattern differences between the two groups were used to explore the relationship between regional GM volume and disease severity. Through the whole‐brain regression analysis, we found that several anatomical structures, such as the cerebellum, temporal lobes, and the cingulate and frontal gyri, were closely associated with disease severity (Fig. 4). Those extra‐striatal cortices belong to distinct functional neural circuits from different striatal subdivisions majorly responsible for cognition and emotional functions. Our findings contribute to the clinical phenotype of PD by being partially in line with the network degeneration hypothesis, which suggests that regions other than the striatum alone are also sick. As multiple anatomical areas are, according to whole‐brain regression analysis, involved in PD progression, examining SC difference between groups and their relationship to disease severity certainly provides valuable information, such as information on neural circuit impairment. In the present study, the finding that several regions with SC group differences correlated well with disease severity further strengthens the results of our SC analysis. Furthermore, compared to regions showing increased SC in PD, we also noted that regions showing decreased SC in PD were highly associated with disease severity (Supporting Information Fig. S4). The GM deficits in the cerebellum, which showed decreased SC with DCP in PD, were correlated well with worse HY stage, SD‐ADL, UPDRS II, and UPDRS III scores. This observation further supports the notion that disruption of the striato‐cerebellar connection, affecting responses for multiple different motor, and nonmotor functions in PD, is a hallmark for PD progression [Wu and Hallett, 2013]. Although synchronized dopamine depletion might contribute to the increased SC between the striatum and the limbic and frontal lobes, the disrupted striato‐cerebellar connection, which impaired several different motor and nonmotor functional coordination simultaneously, might be primarily responsible for the subsequent comorbidities in PD. In contrast to results reported for other striatocortical networks, our results further supported that decreased SC between the striatum and cerebellum might play both pathological and compensatory roles in PD development.
However, special caution should be taken in the interpretation of the results presented here. Because the HY stage or SE‐ADL test was designed to evaluate general disease severity rather than specific functional domains in PD, our correlation results might reflect an evaluation bias for the cerebellum and other regions with SC differences between the groups and it might be difficult to clarify individual volumetric impacts on corresponding deficits. In addition, medical treatments for movement disorders in PD might alter and improve motor function assessment results, such as those in UPDRS, and might underestimate the contribution of motor‐associated regions to disease severity in the present study.
Some factors related to the quality of the images may have partially affected the covariance analysis. In patients with PD, substantia nigra and thalamic subnuclei are also in charge of clinical disease presentations and were reasonable to include into this SC evaluation. However, the image contrast of the T1 sequence [Menke et al., 2014] used in this study displayed worse performance in those regions than the striatal area and might hinder the appropriate interpretation of results. Future studies employing advanced image sequencing that enhances the tissue contrast of subcortical deep nuclei [Helms et al., 2009; Sudhyadhom et al., 2009] might help to overcome these methodological limitations. In addition, assessment of striatal SC helps to explore the relationship between the striatum and neocortices in PD; however, the striatum is also involved in other motor‐related diseases (Huntington's disease, dyskinesias, etc.), conditions which have symptomatic overlap with PD. Further study for the motor‐related disease spectrum is thus warranted. We cannot exclude the potential impact of medications on our SC findings, as several medications were used by patients in this study for symptom control. In addition, relative longer disease durations in the patients enrolled (mean 6.0 ± 0.6 years) with extensive extra‐striatal GM affected could have misled our results with the conjunction effect from the neocortical network, rather than striato‐cortical network only. Our study must partially reveal the natural course of PD patients under medical control and may be reinforced by further investigations using detailed neuropsychological examinations.
CONCLUSION
The present study illustrated that pathological processes occurring in PD in the striatum affect the same striato‐cortical networks that covary with the striatum in healthy brains. The PD patients further demonstrated atypical striatal SC patterns, suggesting that structural changes in the striatum may result in a cascade of alterations in multiple neocortices. Furthermore, we demonstrated that changes in SC may reflect the clinical phenotype of PD, which supports the idea that PD is a striatal network dysfunction disease. A further combined approach using different imaging modalities is therefore warranted and may provide additional insight into the pathological processes related to PD and other neurodegenerative conditions.
Supporting information
Supplementary Information
Supplementary Information
Supplementary Information
Supplementary Information
Supplementary Information
ACKNOWLEDGMENT
The authors declare no competing financial interests.
REFERENCES
- Alexander‐Bloch A, Giedd JN, Bullmore E (2013): Imaging structural co‐variance between human brain regions. Nat Rev Neurosci 14:322–336. [DOI] [PMC free article] [PubMed] [Google Scholar]
- Ashburner J (2007): A fast diffeomorphic image registration algorithm. Neuroimage 38:95–113. [DOI] [PubMed] [Google Scholar]
- Ashburner J, Friston KJ (2000): Voxel‐based morphometry‐The methods. Neuroimage 11:805–821. [DOI] [PubMed] [Google Scholar]
- Baev KV, Greene KA, Marciano FF, Samanta JE, Shetter AG, Smith KA, Stacy MA, Spetzler RF (2002): Physiology and pathophysiology of cortico‐basal ganglia‐thalamocortical loops: Theoretical and practical aspects. Prog Neuropsychopharmacol Biol Psychiatry 26:771–804. [DOI] [PubMed] [Google Scholar]
- Behrens TE, Johansen‐Berg H, Woolrich MW, Smith SM, Wheeler‐Kingshott CA, Boulby PA, Barker GJ, Sillery EL, Sheehan K, Ciccarelli O, Thompson AJ, Brady JM, Matthews PM (2003): Non‐invasive mapping of connections between human thalamus and cortex using diffusion imaging. Nat Neurosci 6:750–757. [DOI] [PubMed] [Google Scholar]
- Bernhardt BC, Worsley KJ, Besson P, Concha L, Lerch JP, Evans AC, Bernasconi N (2008): Mapping limbic network organization in temporal lobe epilepsy using morphometric correlations: Insights on the relation between mesiotemporal connectivity and cortical atrophy. Neuroimage 42:515–524. [DOI] [PubMed] [Google Scholar]
- Bernhardt BC, Rozen DA, Worsley KJ, Evans AC, Bernasconi N, Bernasconi A (2009): Thalamo‐cortical network pathology in idiopathic generalized epilepsy: Insights from MRI‐based morphometric correlation analysis. Neuroimage 46:373–381. [DOI] [PubMed] [Google Scholar]
- Bezzola L, Merillat S, Gaser C, Jancke L (2011): Training‐induced neural plasticity in golf novices. J Neurosci 31:12444–12448. [DOI] [PMC free article] [PubMed] [Google Scholar]
- Bostan AC, Dum RP, Strick PL (2010): The basal ganglia communicate with the cerebellum. Proc Natl Acad Sci USA 107:8452–8456. [DOI] [PMC free article] [PubMed] [Google Scholar]
- Braak H, Rub U, Braak E (2000): Neuroanatomy of Parkinson disease. Changes in the neuronal cytoskeleton of a few disease‐susceptible types of neurons lead to progressive destruction of circumscribed areas in the limbic and motor systems. Nervenarzt 71:459–469. [DOI] [PubMed] [Google Scholar]
- Butz M, Worgotter F, van Ooyen A (2009): Activity‐dependent structural plasticity. Brain Res Rev 60:287–305. [DOI] [PubMed] [Google Scholar]
- Costa LG, Steardo L, Cuomo V (2004): Structural effects and neurofunctional sequelae of developmental exposure to psychotherapeutic drugs: Experimental and clinical aspects. Pharmacol Rev 56:103–147. [DOI] [PubMed] [Google Scholar]
- Crandall JE, McCarthy DM, Araki KY, Sims JR, Ren JQ, Bhide PG (2007): Dopamine receptor activation modulates GABA neuron migration from the basal forebrain to the cerebral cortex. J Neurosci 27:3813–3822. [DOI] [PMC free article] [PubMed] [Google Scholar]
- Cuadra MB, Cammoun L, Butz T, Cuisenaire O, Thiran JP (2005): Comparison and validation of tissue modelization and statistical classification methods in T1‐weighted MR brain images. IEEE Trans Med Imaging 24:1548–1565. [DOI] [PubMed] [Google Scholar]
- Di Martino A, Scheres A, Margulies DS, Kelly AM, Uddin LQ, Shehzad Z, Biswal B, Walters JR, Castellanos FX, Milham MP (2008): Functional connectivity of human striatum: A resting state FMRI study. Cereb Cortex 18:2735–2747. [DOI] [PubMed] [Google Scholar]
- Draganski B, Gaser C, Busch V, Schuierer G, Bogdahn U, May A (2004): Neuroplasticity: Changes in grey matter induced by training. Nature 427:311–312. [DOI] [PubMed] [Google Scholar]
- Draganski B, Kherif F, Kloppel S, Cook PA, Alexander DC, Parker GJ, Deichmann R, Ashburner J, Frackowiak RS (2008): Evidence for segregated and integrative connectivity patterns in the human Basal Ganglia. J Neurosci 28:7143–7152. [DOI] [PMC free article] [PubMed] [Google Scholar]
- Drevets WC, Price JC, Kupfer DJ, Kinahan PE, Lopresti B, Holt D, Mathis C (1999): PET measures of amphetamine‐induced dopamine release in ventral versus dorsal striatum. Neuropsychopharmacology 21:694–709. [DOI] [PubMed] [Google Scholar]
- Ferrer I, Blanco R, Carulla M, Condom M, Alcantara S, Olive M, Planas A (1995): Transforming growth factor‐alpha immunoreactivity in the developing and adult brain. Neuroscience 66:189–199. [DOI] [PubMed] [Google Scholar]
- Gale JT, Amirnovin R, Williams ZM, Flaherty AW, Eskandar EN (2008): From symphony to cacophony: Pathophysiology of the human basal ganglia in Parkinson disease. Neurosci Biobehav Rev 32:378–387. [DOI] [PubMed] [Google Scholar]
- Gasser T, Bressman S, Durr A, Higgins J, Klockgether T, Myers RH (2003): State of the art review: Molecular diagnosis of inherited movement disorders. Movement Disorders Society task force on molecular diagnosis. Mov Disord 18:3–18. [DOI] [PubMed] [Google Scholar]
- Gilley J, Coleman MP (2010): Endogenous Nmnat2 is an essential survival factor for maintenance of healthy axons. PLoS Biol 8:e1000300. [DOI] [PMC free article] [PubMed] [Google Scholar]
- Goetz CG, Poewe W, Rascol O, Sampaio C, Stebbins GT, Counsell C, Giladi N, Holloway RG, Moore CG, Wenning GK, Yahr MD, Seidl L (2004): Movement Disorder Society task force report on the Hoehn and Yahr staging scale: Status and recommendations. Mov Disord 19:1020–1028. [DOI] [PubMed] [Google Scholar]
- Helmich RC, Derikx LC, Bakker M, Scheeringa R, Bloem BR, Toni I (2010): Spatial remapping of cortico‐striatal connectivity in Parkinson's disease. Cerebral Cortex 20:1175–1186. [DOI] [PubMed] [Google Scholar]
- Helms G, Draganski B, Frackowiak R, Ashburner J, Weiskopf N (2009): Improved segmentation of deep brain grey matter structures using magnetization transfer (MT) parameter maps. Neuroimage 47:194–198. [DOI] [PMC free article] [PubMed] [Google Scholar]
- Hughes AJ, Daniel SE, Kilford L, Lees AJ (1992): Accuracy of clinical diagnosis of idiopathic Parkinson's disease: A clinico‐pathological study of 100 cases. J Neurol Neurosurg Psychiatry 55:181–184. [DOI] [PMC free article] [PubMed] [Google Scholar]
- Jankovic J (2008): Parkinson's disease: Clinical features and diagnosis. J Neurol Neurosurg Psychiatry 79:368–376. [DOI] [PubMed] [Google Scholar]
- Kish SJ, Shannak KS, Rajput AH, Gilbert JJ, Hornykiewicz O (1984): Cerebellar norepinephrine in patients with Parkinson's disease and control subjects. Arch Neurol 41:612–614. [DOI] [PubMed] [Google Scholar]
- Klein A, Andersson J, Ardekani BA, Ashburner J, Avants B, Chiang MC, Christensen GE, Collins DL, Gee J, Hellier P, Song JH, Jenkinson M, Lepage C, Rueckert D, Thompson P, Vercauteren T, Woods RP, Mann JJ, Parsey RV (2009): Evaluation of 14 nonlinear deformation algorithms applied to human brain MRI registration. Neuroimage 46:786–802. [DOI] [PMC free article] [PubMed] [Google Scholar]
- Lankford KL, DeMello FG, Klein WL (1988): D1‐type dopamine receptors inhibit growth cone motility in cultured retina neurons: Evidence that neurotransmitters act as morphogenic growth regulators in the developing central nervous system. Proc Natl Acad Sci USA 85:4567–4571. [DOI] [PMC free article] [PubMed] [Google Scholar]
- Litvak V, Jha A, Eusebio A, Oostenveld R, Foltynie T, Limousin P, Zrinzo L, Hariz MI, Friston K, Brown P (2011): Resting oscillatory cortico‐subthalamic connectivity in patients with Parkinson's disease. Brain 134:359–374. [DOI] [PubMed] [Google Scholar]
- Marino MJ, Valenti O, Conn PJ (2003): Glutamate receptors and Parkinson's disease: Opportunities for intervention. Drugs Aging 20:377–397. [DOI] [PubMed] [Google Scholar]
- Martin LJ, Al‐Abdulla NA, Brambrink AM, Kirsch JR, Sieber FE, Portera‐Cailliau C (1998): Neurodegeneration in excitotoxicity, global cerebral ischemia, and target deprivation: A perspective on the contributions of apoptosis and necrosis. Brain Res Bull 46:281–309. [DOI] [PubMed] [Google Scholar]
- Mechelli A, Crinion JT, Noppeney U, O'Doherty J, Ashburner J, Frackowiak RS, Price CJ (2004): Neurolinguistics: Structural plasticity in the bilingual brain. Nature 431:757. [DOI] [PubMed] [Google Scholar]
- Mechelli A, Friston KJ, Frackowiak RS, Price CJ (2005): Structural covariance in the human cortex. J Neurosci 25:8303–8310. [DOI] [PMC free article] [PubMed] [Google Scholar]
- Menke RA, Szewczyk‐Krolikowski K, Jbabdi S, Jenkinson M, Talbot K, Mackay CE, Hu M (2014): Comprehensive morphometry of subcortical grey matter structures in early‐stage Parkinson's disease. Hum Brain Mapp 35:1681–1690. [DOI] [PMC free article] [PubMed] [Google Scholar]
- Middleton FA, Strick PL (2000): Basal ganglia output and cognition: Evidence from anatomical, behavioral, and clinical studies. Brain Cogn 42:183–200. [DOI] [PubMed] [Google Scholar]
- Modinos G, Vercammen A, Mechelli A, Knegtering H, McGuire PK, Aleman A (2009): Structural covariance in the hallucinating brain: A voxel‐based morphometry study. J Psychiatry Neurosci 34:465–469. [PMC free article] [PubMed] [Google Scholar]
- Muhlau M, Winkelmann J, Rujescu D, Giegling I, Koutsouleris N, Gaser C, Arsic M, Weindl A, Reiser M, Meisenzahl EM (2012): Variation within the Huntington's disease gene influences normal brain structure. PLoS One 7:e29809. [DOI] [PMC free article] [PubMed] [Google Scholar]
- Neufeld J, Teuchert‐Noodt G, Grafen K, Winter Y, Witte AV (2009): Synapse plasticity in motor, sensory, and limbo‐prefrontal cortex areas as measured by degrading axon terminals in an environment model of gerbils (Meriones unguiculatus). Neural Plast 2009:281561. [DOI] [PMC free article] [PubMed] [Google Scholar]
- Palmer SJ, Li J, Wang ZJ, McKeown MJ (2010): Joint amplitude and connectivity compensatory mechanisms in Parkinson's disease. Neuroscience 166:1110–1118. [DOI] [PubMed] [Google Scholar]
- Pan PL, Song W, Shang HF (2012): Voxel‐wise meta‐analysis of gray matter abnormalities in idiopathic Parkinson's disease. Eur J Neurol 19:199–206. [DOI] [PubMed] [Google Scholar]
- Park SQ, Kahnt T, Talmi D, Rieskamp J, Dolan RJ, Heekeren HR (2012): Adaptive coding of reward prediction errors is gated by striatal coupling. Proc Natl Acad Sci USA 109:4285–4289. [DOI] [PMC free article] [PubMed] [Google Scholar]
- Pickrell AM, Pinto M, Hida A, Moraes CT (2011): Striatal dysfunctions associated with mitochondrial DNA damage in dopaminergic neurons in a mouse model of Parkinson's disease. J Neurosci 31:17649–17658. [DOI] [PMC free article] [PubMed] [Google Scholar]
- Poston KL, Eidelberg D (2012): Functional brain networks and abnormal connectivity in the movement disorders. Neuroimage 62:2261–2270. [DOI] [PMC free article] [PubMed] [Google Scholar]
- Postuma RB, Dagher A (2006): Basal ganglia functional connectivity based on a meta‐analysis of 126 positron emission tomography and functional magnetic resonance imaging publications. Cereb Cortex 16:1508–1521. [DOI] [PubMed] [Google Scholar]
- Purves D, White LE, Zheng D, Andrews TJ, Riddle DR (1996): Brain size, behavior and the allocation of neural space. In: Magnusson D, editor. Individual Development Over the Lifespan: Biological and Psychosocial Perspectives. Cambridge, UK: Cambridge UP; pp 162–178. [Google Scholar]
- Rajapakse JC, Giedd JN, Rapoport JL (1997): Statistical approach to segmentation of single‐channel cerebral MR images. IEEE Trans Med Imaging 16:176–186. [DOI] [PubMed] [Google Scholar]
- Romano C, Sesma MA, McDonald CT, O'Malley K, Van den Pol AN, Olney JW (1995): Distribution of metabotropic glutamate receptor mGluR5 immunoreactivity in rat brain. J Comp Neurol 355:455–469. [DOI] [PubMed] [Google Scholar]
- Schwab RS, Engeland A (1969): Projection Technique for Evaluating Surgery in Parkinson's Disease. Edinburgh: E and S Livingstone. [Google Scholar]
- Seeley WW, Crawford R, Rascovsky K, Kramer JH, Weiner M, Miller BL, Gorno‐Tempini ML (2008): Frontal paralimbic network atrophy in very mild behavioral variant frontotemporal dementia. Arch Neurol 65:249–255. [DOI] [PMC free article] [PubMed] [Google Scholar]
- Seeley WW, Crawford RK, Zhou J, Miller BL, Greicius MD (2009): Neurodegenerative diseases target large‐scale human brain networks. Neuron 62:42–52. [DOI] [PMC free article] [PubMed] [Google Scholar]
- Soriano‐Mas C, Harrison BJ, Pujol J, Lopez‐Sola M, Hernandez‐Ribas R, Alonso P, Contreras‐Rodriguez O, Gimenez M, Blanco‐Hinojo L, Ortiz H, Deus J, Menchon JM, Cardoner N (2013): Structural covariance of the neostriatum with regional gray matter volumes. Brain Struct Funct 218:697–709. [DOI] [PubMed] [Google Scholar]
- Suddath RL, Christison GW, Torrey EF, Casanova MF, Weinberger DR (1990): Anatomical abnormalities in the brains of monozygotic twins discordant for schizophrenia. N Engl J Med 322:789–794. [DOI] [PubMed] [Google Scholar]
- Sudhyadhom A, Haq IU, Foote KD, Okun MS, Bova FJ (2009): A high resolution and high contrast MRI for differentiation of subcortical structures for DBS targeting: The fast gray matter acquisition T1 inversion recovery (FGATIR). Neuroimage 47(Suppl 2):T44–T52. [DOI] [PubMed] [Google Scholar]
- Tohka J, Zijdenbos A, Evans A (2004): Fast and robust parameter estimation for statistical partial volume models in brain MRI. Neuroimage 23:84–97. [DOI] [PubMed] [Google Scholar]
- Tramo MJ, Loftus WC, Stukel TA, Green RL, Weaver JB, Gazzaniga MS (1998): Brain size, head size, and intelligence quotient in monozygotic twins. Neurology 50:1246–1252. [DOI] [PubMed] [Google Scholar]
- Tritsch NX, Sabatini BL (2012): Dopaminergic modulation of synaptic transmission in cortex and striatum. Neuron 76:33–50. [DOI] [PMC free article] [PubMed] [Google Scholar]
- Vaarmann A, Kovac S, Holmstrom KM, Gandhi S, Abramov AY (2013): Dopamine protects neurons against glutamate‐induced excitotoxicity. Cell Death Dis 4:e455. [DOI] [PMC free article] [PubMed] [Google Scholar]
- Wu T, Hallett M (2013): The cerebellum in Parkinson's disease. Brain 136:696–709. [DOI] [PMC free article] [PubMed] [Google Scholar]
- Wu T, Wang L, Hallett M, Chen Y, Li K, Chan P (2011): Effective connectivity of brain networks during self‐initiated movement in Parkinson's disease. Neuroimage 55:204–215. [DOI] [PubMed] [Google Scholar]
- Ziegler G, Dahnke R, Jancke L, Yotter RA, May A, Gaser C (2012): Brain structural trajectories over the adult lifespan. Human Brain Mapp 33:2377–2389. [DOI] [PMC free article] [PubMed] [Google Scholar]
- Zielinski BA, Gennatas ED, Zhou J, Seeley WW (2010): Network‐level structural covariance in the developing brain. Proc Natl Acad Sci USA 107:18191–18196. [DOI] [PMC free article] [PubMed] [Google Scholar]
Associated Data
This section collects any data citations, data availability statements, or supplementary materials included in this article.
Supplementary Materials
Supplementary Information
Supplementary Information
Supplementary Information
Supplementary Information
Supplementary Information