

Abstract
Maintaining alertness is critical for safe and successful performance of most human activities. Consequently, microsleeps during continuous visuomotor tasks, such as driving, can be very serious, not only disrupting performance but sometimes leading to injury or death due to accidents. We have investigated the neural activity underlying behavioral microsleeps – brief (0.5–15 s) episodes of complete failure to respond accompanied by slow eye‐closures – and EEG theta activity during drowsiness in a continuous task. Twenty healthy normally‐rested participants performed a 50‐min continuous tracking task while fMRI, EEG, eye‐video, and responses were simultaneously recorded. Visual rating of performance and eye‐video revealed that 70% of the participants had frequent microsleeps. fMRI analysis revealed a transient decrease in thalamic, posterior cingulate, and occipital cortex activity and an increase in frontal, posterior parietal, and parahippocampal activity during microsleeps. The transient activity was modulated by the duration of the microsleep. In subjects with frequent microsleeps, power in the post‐central EEG theta was positively correlated with the BOLD signal in the thalamus, basal forebrain, and visual, posterior parietal, and prefrontal cortices. These results provide evidence for distinct neural changes associated with microsleeps and with EEG theta activity during drowsiness in a continuous task. They also suggest that the occurrence of microsleeps during an active task is not a global deactivation process but involves localized activation of fronto‐parietal cortex, which, despite a transient loss of arousal, may constitute a mechanism by which these regions try to restore responsiveness. Hum Brain Mapp 35:257–269, 2014. © 2012 Wiley Periodicals, Inc.
Keywords: drowsiness, EEG, fMRI, microsleeps, visuomotor tracking
INTRODUCTION
We often become drowsy when watching a boring television program or attending a seminar after lunch. More importantly, some of us do so while driving. While a moderate level of drowsiness slows down responsiveness and increases attention lapses [Dinges and Powell, 1989; Doran et al., 2001; Lim and Dinges, 2010], extreme drowsiness can result in momentary sleep‐like events known as behavioral microsleeps (“microsleeps”). During an active task, these manifest as a complete failure to respond accompanied by droopy eyes, slow eyelid‐closure, and head nodding [Horne et al., 2003; Peiris et al., 2006; Torsvall and Åkerstedt, 1988; Wierwille and Ellsworth, 1994]. Microsleeps are particularly concerning in occupations in which public safety depends on extended unimpaired performance, such as truck drivers, locomotive drivers, pilots, air traffic controllers, and process control workers [Horne and Reyner, 1995; Wright and McGown, 2001].
Drowsiness is also associated with changes in EEG. During a continuous task, performance when drowsy is negatively correlated with activity in theta (4–7 Hz) band of postcentral EEG [Huang et al., 2008; Jones et al., 2010; Lin et al., 2005; Makeig et al., 2000]. Eyes‐closed resting EEG shifts from alpha to theta activity during transition to sleep [Hori et al., 1994; Rechtschaffen and Kales, 1968]. Therefore, short EEG segments (5–15 s) dominated by theta activity are often considered to be due to microsleeps [Boyle et al., 2008; Harrison and Horne, 1996]. Although EEG‐defined microsleeps have been associated with poorer performance in a continuous task [Boyle et al., 2008], they can occur without noticeable changes in other behavioral features such as eye‐closure and nodding‐off [Boyle et al., 2008; Torsvall and Åkerstedt, 1988].
Neuroimaging studies provide evidence for localized changes in neuronal activity during slowed response in short‐term attentional tasks during a rested or sleep‐deprived state. For instance, slowed responses during a selective attention task in the rested state are associated with reduced stimulus‐evoked sensory activity and increased frontoparietal executive control activity [Chee et al., 2008; Weissman et al., 2006]. In contrast, after sleep deprivation, disruption in thalamic and visual processing areas occurs during slowed responses [Chee and Tan, 2010; Chee et al., 2008]. The slowest responses during a vigilance task in the rested state result in greater activity in the midline default‐mode regions, and this activity increases further with sleep‐deprivation [Drummond et al., 2005]. While these studies have provided evidence for neuronal changes during slowed performance, they relied solely on reaction time to measure attention and arousal‐related changes in behavior. Other behavioral and neurophysiological features, such as eye closure and EEG, were not recorded. Furthermore, all these studies required reactive button presses to discretely‐presented stimuli. In real life, however, many tasks require continuous visuomotor response. Although continuous tasks have been used in neuroimaging studies previously [Calhoun et al., 2002; Spiers and Maguire, 2007], no neuroimaging study has investigated the neuronal correlates of behavioral microsleeps during a continuous task.
Another approach used to investigate the neuronal underpinnings of alertness is to identify the fMRI correlates of EEG signatures of alertness. Simultaneous fMRI/EEG studies of transition from wakefulness to sleep provide evidence for deactivation of both cortical and subcortical activity during NREM sleep compared with wakefulness [reviewed by Dang‐Vu et al., 2010]. Matsuda et al. 2002 marked periods of low and high arousal using alpha and beta activity in EEG and showed increased BOLD activity in the frontal eye fields and primary visual cortex during lowered arousal. Horovitz et al. 2008 identified frontoparietal cortical areas with stronger fluctuations in resting BOLD signal during light sleep defined using EEG. Olbrich et al. 2009 reported that they were able to identify different levels of vigilance based on short EEG segments and showed an increased BOLD signal in the occipital, anterior cingulate, frontal, and parietal cortices and a decreased BOLD signal in the bilateral thalamus during lowered vigilance compared with higher vigilance. Several other studies have also investigated the neuronal correlates of changes in alpha activity during relaxed wakefulness [Goldman et al., 2002; Laufs et al., 2006; Matsuda et al., 2002; Moosmann et al., 2003; Wu et al., 2010]. However, except for Matsuda et al. 2002, all the above studies investigated changes in EEG‐based alertness while resting with eyes closed.
In the current study, we used simultaneous recording of eye‐video, response behavior, EEG, and fMRI to investigate neural changes underlying two aspects of drowsiness during a continuous task: microsleeps and changes in postcentral theta activity.
MATERIALS AND METHODS
Participants
Twenty right‐handed volunteers (10 males and 10 female, aged 21–45 years, mean age 29.3 years) with no history of neurological, psychiatric, or sleep disorder participated in the study. Participants were asked not to consume any stimulants or depressants, such as alcohol, caffeine, and nicotine, during the 4 h before the session. Experimental sessions commenced at 1:30 p.m. or 2:30 p.m. Participants had to report a usual time to bed between 10 and 12 p.m. and a usual time in bed from 7.0 to 8.5 h. Their sleep habits were monitored during the 6 days and 5 nights before the experimental session by way of a sleep diary and actigraphy (Actiwatch, Mini Mitter Inc., Bend OR). Ethical approval for the study was obtained from the New Zealand Upper South B Regional Ethics Committee.
Experimental Task
Each participant undertook a 50‐min visuomotor tracking task in which they had to maneuver an MR‐compatible finger‐based joystick (Current Designs, Philadelphia, PA) to pursue a two‐dimensional random target moving continuously on a computer screen (Fig. 1a.). The horizontal and vertical components of the target were produced by a sum‐of‐sines (n = 7) with frequencies evenly spaced from 0.033 to 0.231 Hz. The target amplitude was scaled to fit 80% of the 1,024 × 768 pixels resolution screen. This produced a two‐dimensional periodic target (T = 30 s) with a velocity range of 63 to 285 pixels/s. The target (yellow disc, d = 23 pixels) and the joystick response (red disc, d = 20 pixels), generated by a custom‐designed software, were presented via MRI‐compatible goggles (Avotec, Stuart, FL) with a resolution of 1,024 × 768 pixels, and a field of view of 30° × 23°. The background pattern was grey. Participants were familiarized with the tracking task and instructed to control the joystick position so that the response disc was as close as possible to the center of the moving target at all times. Foam support was placed below the right elbow for subject comfort and to minimize hand movement during tracking.
Figure 1.
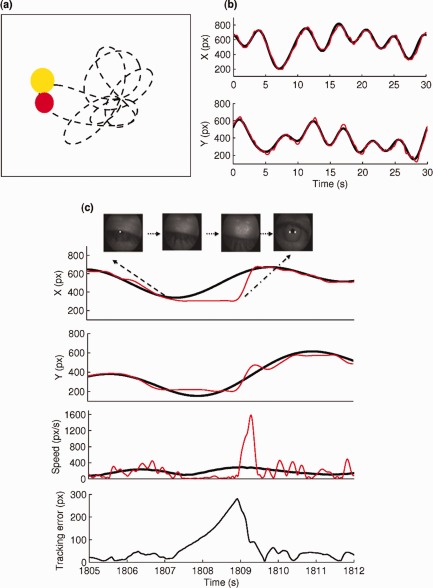
Tracking task and eyelid and response behaviour associated with a typical microsleep during the tracking task. (a) Participants used a finger‐based joystick to track the displayed yellow target disc moving in a quasi‐random trajectory (dotted line) with a red cursor disc. (b) Accurate tracking led to the movement of the response disc along the same trajectory as the target disc as displayed in the target (smooth black line) and response (jerky red line) position for one cycle (30‐s) of tracking. (c) Tracking response (jerky red line) is flat in both directions (leading to an increase in tracking error and zero speed) and eyes slowly close during a typical microsleep. The units are in pixels (px). [Color figure can be viewed in the online issue, which is available at http://wileyonlinelibrary.com.]
Behavioral and EEG Recording
Participants performed the tracking task inside an MRI scanner, while joystick response, eye‐video, EEG, and fMRI data were recorded synchronously. Video of the right eye was captured using a Visible Eye™ system (Avotec Inc., Stuart, FL) mounted on the head‐coil of the MRI scanner. The video was recorded on a PC at 25 fps (350 × 280 px) using a video‐capture card and custom‐built video recording software.
Continuous EEG was acquired using an MRI‐compatible Maglink EEG cap, SynAmps2 amplifiers, and Scan 4.4 software (Compumedics Neuroscan, Charlotte, NC). The Maglink cap has 60 EEG electrodes placed according to the 10 to 20 international system, a reference electrode close to Cz and a ground electrode close to Fz. Quick‐Cell inserts were placed in electrode cavities and soaked with electrolyte solution (0.3 ml) to create a conductive column from the scalp to the electrode. Continuous vertical electro‐oculogram (VEOG) was acquired by placing electrodes above and below the left eye. Bipolar chest ECG electrodes were used to record ECG. Oximetry was continuously measured using a pulse oximeter attached to the left index finger. Data were acquired at 10 kHz, with a low‐pass filter at 2 kHz.
Imaging Procedure
Structural and functional data were acquired on a Signa HDx 3.0T MRI Scanner (GE Medical Systems). High‐resolution anatomical images of the whole brain were acquired using T1‐weighted anatomical scans (repetition time: 6.5 ms; echo time: 2.8 ms; inversion time: 400 ms; field of view: 250 × 250 mm; matrix: 256 × 256; slice thickness: 1 mm). Functional images were acquired using echo‐planar imaging (repetition time: 2.5 s; echo time: 35 ms; field of view: 220 × 220 mm; slice thickness: 4.5 mm; number of slices: 33, matrix: 64 × 64). The first five images of each session were discarded to allow for T1 equilibration. Functional images were acquired in two blocks of 25 min. A magnetic field‐map was acquired for each subject to reduce the functional image distortions (echo spacing: 700 ms; repletion time: 580 ms; echo time: 6.0 ms and 8.2 ms). Participants were provided with ear plugs to lessen the high‐volume acoustic noise from the scanner. Additional pads were placed on both sides of the head to minimize head motion and reduce acoustic noise.
Data Analysis
To identify individual episodes of microsleep, a custom‐built SyncPlayer™ program was used to replay synchronized eye‐video, VEOG, and tracking target (x and y), response (x and y), speed, and tracking error. The tracking error was defined as the Euclidean distance between the centers of the target and response discs. Any episodes of flat tracking (zero response speed) of 0.5 to 15 s duration accompanied by behavioral signs of drowsiness and full or partial (>80%) slow‐eye‐closures were marked as microsleeps (synchronized replay of eye‐video and visuomotor response during typical microsleeps is shown in the Supporting Information video). The response position, speed, and error signals were used to mark the onset and end of flat tracking responses (Fig. 1c). Eye‐video was used as a cue to mark the onset and end of eye closure.
Percentage of time spent with more than 80% eye‐closure in a minute (PERCLOS) was used as a behavioral estimate of drowsiness. PERCLOS [Dinges and Grace, 1998; Wierwille and Ellsworth, 1994] was estimated by measuring distance between the upper and lower eye‐lids via a vertical integral projection method [Malla et al., 2010].
To obtain clean EEG from the artifact‐laden EEG collected from within the scanner, the echo‐planar gradient and cardio‐ballistic artifacts were first removed from the continuous EEG data using template subtraction [Allen et al., 2000] and independent‐component‐analysis (ICA) [Briselli et al., 2006]. EEG data were then analyzed using a spectral analysis method [Lin et al., 2005]. Data from each channel were divided into 2‐s epochs (500 samples) using a Hanning window of 500 points. Each 2‐s epoch was further subdivided using a Hanning window into several 125‐point subwindows with 25‐point overlap. Each subepoch of 125 points was then Fourier‐transformed using a 256‐point Fast Fourier‐Transform (FFT) and zero‐padding. The FFT magnitude from each subwindow was then averaged to obtain an average amplitude spectrum for each 2‐s epoch. Relative power in the theta band (4−7 Hz) (i.e., relative to total power in 1–30 Hz) at a posterior electrode Pz [Lin et al., 2010, 2005; Makeig and Jung, 1996] was estimated and used as an EEG estimate of drowsiness. Pearson's correlation analysis was carried out between average tracking error, PERCLOS, and average theta activity for each 60‐s window.
The fMRI data were analyzed using FSL (FMRIB's Software Library; available at: http://www.fmrib.ox.ac.uk/fsl). fMRI preprocessing included motion correction [Jenkinson et al., 2002], field map‐based unwarping [Jenkinson, 2003], slice‐time correction, and spatial smoothing with a 7 mm Gaussian kernel (full width at half maximum), and high‐pass filtering using σ = 75 s. All fMRI scans were normalized to the MNI152 standard space using the structural scan [Jenkinson et al., 2002].
General linear model (GLM) based analysis was used to identify the pattern of BOLD activity during microsleeps. In the GLM, BOLD activity during microsleeps was modeled using a variable epoch regressor convolved with a double‐gamma hemodynamic response function. The variable‐epoch function was generated by setting each microsleep trial as a boxcar epoch with the duration of the epoch equal to the duration of the microsleep. Any episodes of flat tracking longer than 15 s (considered to be due to sleep) or of transient episodes of partial/full eye‐closures without clear indication of flat tracking were modeled as regressors of no interest. Regressors for postcentral theta and occipital alpha activity were obtained using a moving window spectral analysis method with a window of 3.5 s and a 1.0‐s overlap, i.e., stepping at 2.5 s The regressors were derived for the total duration of tracking task in each block (i.e., 25 min each). For the theta regressor, average relative power from three electrodes P1, P2, Pz was used. For the alpha regressor, average relative power from three occipital electrodes O1, Oz, O2 was used. Only subjects with electrode impedances <15 kΩ were used in the group analysis of the correlation between EEG and fMRI activity. In the subjects with no reliable EEG, dummy regressors (i.e., zero at all time points) were used in place of EEG alpha and theta regressors to ensure that the GLM had the same degree of freedom across all subjects. The EEG regressors were convolved with a double‐gamma hemodynamic response function (available in FEAT, part of FSL; available at: http://www.fmrib.ox.ac.uk/fsl). The tracking‐target‐related variability in BOLD signal was taken into account using a regressor of average target speed during each TR (2.5 s) normalized to a unit height and convolved with a double‐gamma hemodynamic response function. Cardiac‐related noise was modeled using the volume‐specific RETRICOR confound regressor derived from pulse‐wave recording [Glover et al., 2000]. Any motion‐related variability in the fMRI data was modeled out by inclusion of rotation and translation motion parameters obtained from the motion correction step.
The GLM described above was linearly fitted on a voxel‐by‐voxel basis for each participant. Statistical contrasts were chosen to identify increased or decreased activity during microsleeps compared with baseline tracking. The time period between microsleeps was implicitly defined as a baseline. Therefore, BOLD activity during microsleeps is relative to nonmicrosleep related activity over the whole recording. Group‐level t‐tests were carried out for each contrast of interest using a mixed‐effect model implemented in FSL. Brain regions with significantly increased or decreased activity were determined by thresholding the statistical maps at P < 0.01 (cluster‐based family‐wise‐error correction). Statistical maps obtained from EEG‐BOLD correlations were thresholded at P < 0.05 (cluster‐based family‐wise‐error correction). Brain regions corresponding to the significant activity were identified using known neuroanatomical landmarks [Mai et al., 2004] and guided by the Harvard‐Oxford Cortical and Subcortical Structural Atlas (included in the FSL software).
To determine if the BOLD response mirrored the duration of microsleeps, the microsleeps were separated into three different duration bins (0−5 s, 5−10 s, and 10−15 s). The BOLD signal change (baseline corrected with average signal from the two preceding points) time‐locked to the microsleeps was estimated from each region of interest for each of the three duration bins in each participant. Not all participants had microsleeps in three bins, with N = 14 for 0.5 to 5 s, N = 12 for 5 to 10 s, and N = 8 for 10 to 15 s time bins. For N = 8 (participants who had microsleeps in all three durations), a one‐way ANOVA was used to test for differences in the peak amplitude of the average BOLD response across microsleeps in the three duration bins. Tukey post hoc comparisons were conducted for pairwise comparison of peak‐amplitudes between the three duration bins.
RESULTS
Overall Behavior
Of the 20 participants, 14 had at least 36 microsleeps during the 50‐min tracking task (Fig. 2a). Two participants had fewer microsleeps (1 and 2 respectively), while four participants had none. The overall mean rate of microsleeps was 79/h. The duration of the microsleeps varied considerably across participants but, by operational definition, was always longer than 500 ms and shorter than 15 s (Fig. 2). Across the 16 participants, the mean duration of flat tracking during microsleeps ranged 1.1 to 6.3 s, with an overall average of 3.3 s (median = 2.5 s). In the 14 participants with frequent microsleeps, minute‐to‐minute changes in performance correlated moderately with PERCLOS (r = 0.68 ± 0.29 (mean ± SD), P < 0.05) (Fig 3b). Ten participants who had EEG electrode impedance <15 kΩ showed a moderate correlation between minute‐to‐minute changes in performance and theta power at Pz (r = 0.62 ± 0.22 (mean ± SD)) (Fig. 3c).
Figure 2.
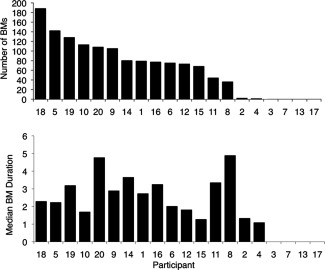
Number and median duration of microsleeps (BMs) in the 20 participants during 50 min of tracking.
Figure 3.
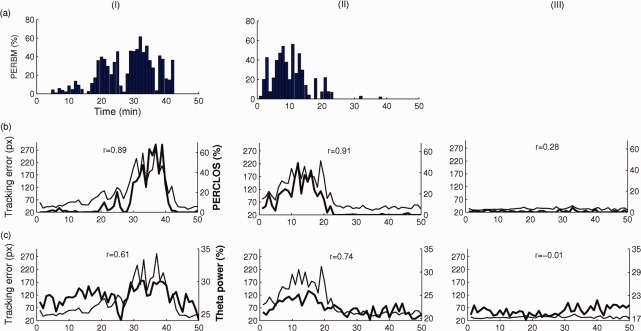
Per minute estimates of percentage time spent in microsleeps (PERBM), percentage time with greater than 80% eye closure (PERCLOS), relative theta power at Pz, and tracking error in three representative participants. The top panel depicts PERBM in the participant with highest number (190) of microsleeps (I) and a participant with a moderate number (77) of microsleeps (II). The middle panel depicts tracking error (thin line) and PERCLOS (thick line) in the same two participants plus a participant with no microsleeps (III). The bottom panel depicts tracking error (thin line) and relative theta power (thick line) in the same participants. Pearson correlations (r) between time‐courses are displayed within each panel. [Color figure can be viewed in the online issue, which is available at http://wileyonlinelibrary.com.]
Neural Activity During Microsleeps
To identify the pattern of neural activity underlying microsleeps, we included the 14 participants with frequent microsleeps in an event‐related GLM analysis of fMRI data. This allowed us to identify the brain regions associated with increased or decreased BOLD signal during microsleeps during an active task.
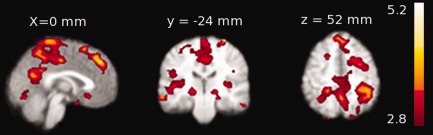
A group‐level mixed‐effects analysis revealed that microsleeps were associated with decreased BOLD activity (P < 0.01, family‐wise‐error corrected) in several brain regions bilaterally, including the midbrain, thalamus, posterior cingulate cortex, and occipital cortex, and small clusters in the right prefrontal cortex and cerebellum (Table 1, Fig. 4).
Table 1.
Anatomical location, MNI coordinates (mm), and Z‐scores corresponding to peak values of significant BOLD activity (P < 0.01, cluster‐based correction with cluster defining threshold of Z > 4.5) during microsleeps
| Region | Z‐score | x | y | z |
|---|---|---|---|---|
| Activations | ||||
| R. Postcentral gyrus | 8.3 | 36 | −32 | 56 |
| R. Supramarginal gyrus | 7.9 | 46 | −42 | 44 |
| R. Precentral gyrus | 7.7 | 14 | −28 | 70 |
| M. Precuneus cortex | 7.2 | 0 | −38 | 56 |
| R. Superior parietal lobule | 6.8 | 22 | −44 | 58 |
| L. Heschl's gyrus | 6.8 | −54 | −12 | 0 |
| L. Middle temporal gyrus | 6.8 | −64 | −46 | 4 |
| L. Supramarginal gyrus | 6.7 | −66 | −44 | 10 |
| L. Inferior frontal gyrus | 6.4 | −50 | 18 | 18 |
| L. Postcentral gyrus | 6.4 | −10 | −42 | 66 |
| L. Superior parietal lobule | 5.5 | −12 | −50 | 64 |
| R. Middle temporal gyrus | 5.4 | 54 | −46 | 4 |
| L. Insular cortex | 5.3 | −40 | −2 | 0 |
| L. Parahippocampal gyrus | 5.2 | −30 | −28 | −26 |
| L. Precentral gyrus | 5.1 | −18 | −14 | 60 |
| R. Parahippocampal gyrus | 5.0 | 24 | 0 | −26 |
| R. Heschl's gyrus | 4.9 | 54 | −12 | 0 |
| R. Inferior frontal gyrus | 4.6 | 56 | 12 | 24 |
| R. Insular cortex | 4.6 | 42 | −10 | 6 |
| R. Temporal fusiform cortex | 4.6 | 36 | −34 | −28 |
| Deactivations | ||||
| R. Occipital pole | 7.8 | 16 | −80 | −2 |
| R. Posterior cingulate cortex | 7.5 | 2 | −30 | 30 |
| L. Occipital pole | 7.3 | −1 | −92 | −16 |
| L. Thalamus | 7.1 | −14 | −14 | 4 |
| M. Cerebellum | 7.1 | 0 | −58 | −42 |
| R. Thalamus | 6.4 | 14 | −10 | 4 |
| R. Midbrain | 6.1 | −2 | −32 | −12 |
| R. Frontal pole | 5.7 | 38 | 52 | 0 |
Figure 4.
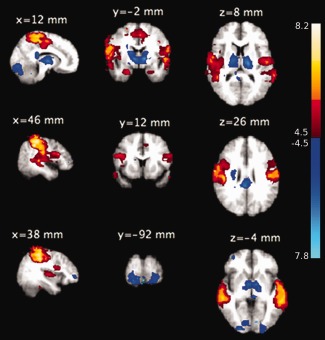
Group‐level significant (Z > 4.5, P < 0.01, family‐wise‐error corrected) pattern of activation (Red‐yellow) and deactivation (blue‐light blue) during microsleeps are shown overlaid on average structural slices. The group‐level pattern was obtained from the 14 participants with frequent microsleeps. The slices are presented in radiological convention and labeled with MNI coordinates. [Color figure can be viewed in the online issue, which is available at http://wileyonlinelibrary.com.]
Conversely, widespread increased activity was observed in cortical areas, with activity strongest in parietal regions encompassing the bilateral postcentral, superior parietal, and supramarginal cortices. Other brain regions with increased activity included the bilateral inferior frontal, precentral, parahippocampal, insular, and temporal occipital fusiform cortices.
Time‐Course of Neural Activity During Microsleeps
In the eight participants who had microsleeps in all three of the duration bins (0.5–5 s, 5–10 s, 10–15 s), we examined the time‐courses of the BOLD signal in the thalamus which showed strongest deactivation and the superior parietal cortex which showed strongest activation during microsleeps. This allowed us to test whether the activity patterns in the cortex and thalamus mirrored the duration of microsleeps.
The BOLD signal in the thalamus starts to decrease at or near the onset of the microsleeps (Fig. 5). There was a significant difference in the amplitude of the decrease across the three duration bins in both the right and left thalamus (right: F (2,21) = 4.67, P = 0.02; left: F (2,21) = 6.5, P = 0.006). From the Tukey post hoc test, the shortest microsleeps (0.5–5 s) were found to have a smaller decrease in activity than longer microsleeps (5–10 s and 10–15 s) (P < 0.05). However, the size of the decrease was not significantly different between the 5 to 10 s and 10 to 15 s durations.
Figure 5.
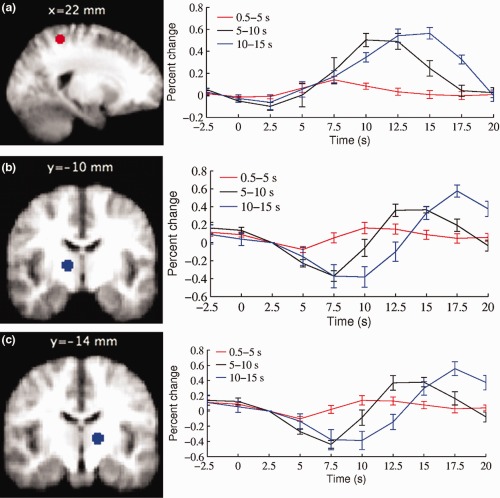
The BOLD signal modulated by duration in the (a) right superior parietal cortex (MNI coordinates (mm): 22, −44, 58), (b) right thalamus (MNI coordinates (mm): 14, −10, 4), and (c) left thalamus (−14, −14, 4). Average BOLD signal time‐course for three different duration microsleeps bins (0.5–5 s, 5–10 s, and 10–15 s) are shown. The time‐courses were obtained from the eight participants who had microsleeps in all three duration bins. The vertical bars represent the standard error of the mean across subjects (N = 8). The onset of microsleeps is at time zero. Note that both activation and deactivation signals mirror the duration of microsleeps. [Color figure can be viewed in the online issue, which is available at http://wileyonlinelibrary.com.]
The size of the BOLD signal from the right superior parietal cortex also mirrored the duration of microsleeps (Fig. 5), with an overall increase in amplitude across the three durations bins (F (2,21) = 10.92, P = 0.001) (Fig. 5). From the Tukey post hoc test, the shortest microsleeps (0.5–5 s) were found to have a smaller increase in activity than longer microsleeps (5–10 s and 10–15 s) (P < 0.05). However, as in the thalamus, the amplitude of the increase was not significantly different between the 5 to 10 s and 10 to 15 s durations.
BOLD Correlates of Spontaneous Theta and Alpha Activity During Drowsiness
Ten participants with frequent microsleeps were used to identify group‐level statistical maps of correlations between BOLD activity and EEG. Positive correlations with EEG theta activity (P < 0.05, cluster‐based family‐wise‐correction) were observed bilaterally in the lateral geniculate area of thalamus, basal forebrain, superior frontal, posterior cingulate, posterior parietal, and visual cortices (Fig. 6, Table 2). There were no significant negative correlations between EEG theta and BOLD activity.
Figure 6.
Group‐level statistical maps showing positive correlation (P < 0.05, family‐wise‐error corrected) between BOLD and theta activity (average of P1, P2, and Pz) in individuals with frequent microsleeps. The group‐level pattern was obtained from the 10 participants with frequent microsleeps and electrode impedance <15 kΩ. The axial slices are presented in radiological convention and labeled with MNI coordinates. [Color figure can be viewed in the online issue, which is available at http://wileyonlinelibrary.com.]
Table 2.
Anatomical location, MNI coordinates (mm), and Z‐scores corresponding to peak values of positive correlation (P < 0.05, cluster‐based family‐wise error correction with cluster‐defining threshold of Z > 2.8) between BOLD and theta activity
| Region | Z‐score | x | y | z |
|---|---|---|---|---|
| R. occipital cortex | 5.0 | 16 | −72 | 68 |
| R. Frontal pole | 4.9 | 44 | 38 | −20 |
| L. Frontal orbital cortex | 4.2 | −34 | 22 | −18 |
| R. Heschl's gyrus | 3.5 | −32 | −30 | 8 |
| L. Lateral occipital cortex | 4.2 | −42 | −78 | 20 |
| L. Inferior temporal gyrus | 4.0 | −64 | −28 | −26 |
| L. Subcallosal cortex | 3.6 | −2 | 26 | −16 |
| L. Thalamus | 3.4 | −18 | −26 | −6 |
| R. Superior frontal gyrus | 3.7 | 24 | 12 | 54 |
| L. Lingual gyrus | 3.3 | −2 | −76 | −14 |
| L. Inferior frontal gyrus | 3.7 | −54 | 30 | 8 |
| R. Thalamus | 3.5 | 20 | −24 | −4 |
| L. Parietal operculum cortex | 3.2 | −46 | −28 | 26 |
Occipital EEG alpha activity did not show any correlation with BOLD signal after family‐wise error correction. However, at a liberal threshold of P < 0.01, cluster‐extend of 50 voxels, a negative correlation was seen in the bilateral occipital cortices, supramarginal gyrus, and precuneus (Fig. 7). There were no positive correlations between alpha activity and BOLD signal.
Figure 7.
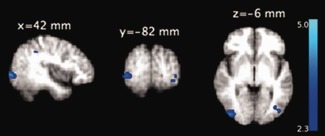
Group‐level statistical maps showing negative correlation (P < 0.01, cluster‐extent of 50 voxels) between BOLD and spontaneous alpha activity (average of O1, O2, Oz) in individuals with frequent microsleeps. The group‐level pattern was obtained from the 10 participants with frequent microsleeps and electrode impedance <15 kΩ. The axial slices are presented in radiological convention and labeled with MNI coordinates. [Color figure can be viewed in the online issue, which is available at http://wileyonlinelibrary.com.]
DISCUSSION
This is the first study to have used simultaneous recording of fMRI, eye‐video, and EEG to investigate the brain mechanisms underlying behavioral microsleeps and EEG activity in a continuous visuomotor task. Despite being normally rested, most participants had frequent microsleeps during the 50‐min monotonous task. These microsleeps were found to be associated with decreased neural activity in the arousal‐related brain regions including the thalamus, midbrain, and posterior cingulate cortex, but associated with increased activity in the frontoparietal, insular, parahippocampal, and temporo‐occipital cortices increases. Over the 50‐min task, theta activity in the postcentral EEG correlated positively with BOLD signal in the bilateral thalamus, basal forebrain, prefrontal, posterior cingulate, posterior parietal, and visual cortices.
Frequent Microsleeps During an Extended Visuomotor Task
The majority of participants had frequent complete lapses of responsiveness accompanied by behavioral signs of drowsiness and sleep—i.e., microsleeps. Frequent microsleeps were not only seen phasically in the visuomotor response and eye‐video, but also in the more tonic indicators of extreme drowsiness such as PERCLOS and postcentral theta activity [Lin et al., 2010, 2005; Makeig et al., 2000]. Although frequent drowsy periods and slowed responses are common during extended vigilance and visuomotor tasks, even in individuals not subjected to a sleep‐deprivation protocol [Lin et al., 2010; Makeig and Inlow, 1993; Peiris et al., 2006], the occurrence of microsleeps at such a high rate (mean 79/h) and in such a noisy MRI environment across rested participants was surprising. Review of actigraphy data collected in the study showed no unusual sleep pattern in the participants for the week prior the scan session. We believe several factors, including the monotonous nature of the task, time‐of‐day (all sessions during postlunch hours), lunch before sessions, and supine position of the participants contributed to drowsiness and the substantial number of microsleeps. This notwithstanding, we emphasize that the current study was not designed to directly investigate the influence of any of these factors on the frequency of microsleeps. Rather, some of the factors, including task monotony, time‐of‐day, and lunch before sessions, were deliberately chosen so as to maximize the likelihood of microsleeps inside the MRI scanner.
Transient Deactivation of Thalamus During Microsleeps
A transient decrease in activity was observed in arousal‐related brain areas, particularly the midbrain, thalamus, and posterior cingulate cortex, during microsleeps. Previous studies have shown that when arousal is low, such as due to sleep deprivation, task‐related thalamic activity is increased during unimpaired performance [Portas et al., 1998; Tomasi et al., 2008] but decreases substantially when lapsing [Chee and Tan, 2010; Chee et al., 2008]. Thalamic activity also decreases with time‐on‐task deteriorating performance [Coull, 1998; Paus, 1997], decreasing vigilance [Olbrich et al., 2009], and transition to sleep during eyes‐closed rest [Kajimura et al., 1999; Kaufmann et al., 2006]. In our study, we observed a rapid bilateral decrease in thalamic activity at the onset of microsleeps with the amplitude of the decrease modulated by the duration of the microsleep. This finding is consistent with the literature, but such a phasic and duration‐dependent decrease in thalamic activity during an unintentional transition from active task performance to a sleep‐like behavioral state has not been previously reported. No such decrease in thalamic activity was found to be associated with intentional eye‐closure and stopping during the same task [Poudel et al., 2010], suggesting that the decrease is not due to eye‐closure and stopping behavior during microsleeps. A similar decrease in activity in the midbrain, with its arousal‐promoting nuclei and major node in the reticular ascending arousal network [Buchsbaum et al., 2006; Kajimura et al., 1999; Saper et al., 2005], suggests that midbrain‐thalamic deactivation is central to the loss of arousal and responsiveness during microsleeps.
Other important areas showing a decrease in activity during microsleeps are the posterior cingulate cortex and primary visual cortex—all of which have strong afferent connections from the thalamus. The posterior cingulate cortex, with afferent projections from the midline and intralaminar thalamic nuclei [Vogt et al., 1987], is a key region in the neuronal network that sustains awareness and consciousness, with decreased activity being associated with both the vegetative state and sleep [Vogt and Laureys, 2005]. Similarly, thalamus sends connections through the optic radiations directly to the primary visual cortex [Behrens et al., 2003]. Therefore, thalamic deactivation may have modulated activity in some of these lower‐level cortical areas during microsleeps. Somewhat surprisingly, the anterior cingulate cortex, which is a major node of ascending arousal system, showed no decrease in activity during microsleeps. A number of previous studies have shown a heterogeneous response in the anterior cingulate cortex during the wake‐sleep continuum, with increased activation observed during early drowsiness [Olbrich et al., 2009] and decreased activation during sleep [Kaufmann et al., 2006]. Similarly, a recent study by Poudel et al. 2012 also showed that the direction of change in cerebral perfusion in the anterior cingulate is dependent on level of drowsiness, as manifested in ocular and facial behaviors. The behavioral microsleeps studied here may have variable neurocognitive underpinning with some microsleeps being more similar to drowsiness whereas others similar to NREM sleep. Thus, it is possible that the lack of change in BOLD activity in the anterior cingulate is due to a highly variable local BOLD response during microsleeps.
Transient Activation of Frontoparietal Cortex During Microsleeps
Increased activity during microsleeps was widespread and bilateral in the frontal and parietal cortex, with activations strongest in the inferior frontal, precentral, postcentral, and superior parietal cortex. This widespread increase in cortical activity during momentary sleep‐like behavior was surprising. Previous neuroimaging studies of sleep, which compared activity during epochs of NREM sleep to relaxed wakefulness, reported decreased activity in both cortical and subcortical brain regions [reviewed by Dang‐Vu et al., 2010]. However, these studies only investigated relative changes in brain activity during the transition from relaxed wakefulness to sleep during an eyes‐closed state. Microsleeps investigated in the current study are brief intrusions of sleep‐like behaviors during a continuous task when the person is struggling to stay awake. There is some evidence that during the struggle to stay awake poor performance accompanies increased frontoparietal cortical activity, possibly as a mechanism to compensate for less efficient perceptual processing [Chee et al., 2008]. Increased cortical activity has also been shown during reduced arousal in the wake‐sleep transitional state [Fukunaga et al., 2006; Horovitz et al., 2008] and vigilance decrement [Olbrich et al., 2009]. Taken together, our findings suggest that dozing‐off during an active task is not a deactivation process, such as transition from relaxed wakefulness to sleep, but involves localized activation of the cortex which may constitute a mechanism for ending microsleeps and restoring responsiveness.
Could some of these cortical activities be due to the eye‐closure and stopping behaviors concomitant with microsleeps? In a previous study of intentional eye‐closure and stopping during the same visuomotor task, eye‐closure and stopping were associated with increased activity in multiple sensory and motor regions including lingual, lateral occipital, angular, supplementary motor, insular, and occipital fusiform areas of the cortex [Poudel et al., 2010], some of which are also active during microsleeps. However, the extensive superior parietal activation observed in the current study was not observed during cued eye‐closure and stopping and appears specific to the lapses of responsiveness in microsleeps. Could some of the increased neural activities be related to the visuomotor and attentional response at the end of microsleeps? A study of lapses when participants were sleep‐deprived suggested that the recovery effect may underlie such increased cortical activity [Drummond et al., 2005]. However, we found that the increased activity commenced at or near the beginning of microsleeps, with the level of activation increasing with duration, indicating that the increased cortical activity is related to the onset and duration of microsleeps.
EEG Theta Activity During Drowsiness Correlates With BOLD Activity
Postcentral theta activity has been found to be a useful neurophysiological marker of drowsiness during an active task [Huang et al., 2008; Lin et al., 2005; Makeig et al., 2000]. We found a positive correlation between spontaneous fluctuation in this theta activity and BOLD signal subcortically in the lateral geniculate area of thalamus and cortically in the basal forebrain, prefrontal, posterior cingulate, posterior parietal, and occipital cortices. Conversely, there was no significant positive or negative correlation between changes in posterior alpha activity and BOLD signal, although there was a trend toward a negative correlation in lateral occipital and posterior parietal areas.
There was some overlap in the BOLD statistical maps associated with EEG theta activity and microsleeps, which presumably reflects the relationship between increased theta activity and frequent occurrence of microsleeps. However, BOLD activity in the lateral geniculate nuclei of thalamus, basal forebrain, prefrontal, and posterior cingulate cortex appears specific to postcentral theta power and were not observed during microsleeps. Several studies have recorded low‐frequency oscillatory activity from the thalamus during the transition to sleep [Llinas and Steriade, 2006; Steriade and Timofeev, 2003]. Animal studies have also observed theta activity in the lateral geniculate nucleus of the thalamus during wake sleep transitions [Hughes et al., 2004]. Frontal midline theta has been observed during focused attention and memory tasks but is considered different from postcentral theta activity which is modulated by thalamic neurons and observed during lowered arousal [Schacter, 1977].
One previous simultaneous fMRI/EEG study reported an increase in task‐related thalamic and cortical BOLD activity during increased theta power [Foucher et al., 2004]. However, the study used a discrete visual attention task and did not investigate theta activity during drowsiness. Resting‐state studies with eyes‐closed which correlated theta‐power with BOLD have reported no correlation [Laufs et al., 2006, 2003] or a negative correlation [Tyvaert et al., 2008]. Inconsistent results in resting‐state studies are believed to be due to differences in choice of electrode position for calculating theta activity and the uncontrolled nature of cognitive and arousal state during resting [Laufs et al., 2006].
A limitation of our study is that we had to use different sample sizes to make inferences on the neuronal underlying of microsleeps, duration‐dependent BOLD modulations, and EEG‐BOLD correlations. The numbers of subjects used to answer each of our questions were limited by behavior observed during the task performance, which is an inherent limitation in all behaviorally‐driven experiments dependent upon the occurrence of intermittent nontarget‐driven events. However, BOLD changes underlying microsleep events were robust across subjects allowing us to compare BOLD activations in different durations even with smaller subset of subjects. Another limitation of the current study is that the EEG‐fMRI correlation analysis was limited to drowsiness‐related EEG changes observed in the parieto‐occipital area. A previous resting EEG/fMRI study used sLORETA to localize vigilance‐related resting EEG activity and compared it with local changes in BOLD fMRI activity [Olbrich et al., 2009]. Further work is necessary to investigate EEG‐fMRI correlation in source space so that the relationship between local changes in BOLD and EEG activity during microsleeps can be investigated.
Maintaining wakefulness and alertness is necessary for safe and successful performance of most human activities. Consequently, drowsiness—more specifically microsleeps during drowsiness—can be very serious, not only disrupting performance but sometimes leading to injury or death due to accidents. In this article, we have revealed patterns of BOLD activity during microsleeps and EEG theta activity, which are important hallmarks of drowsiness during a continuous task.
Supporting information
Supporting Information Video: Replay of eye‐video and visuomotor response data recorded inside an MRI scanner during occurrence of behavioral microsleeps in one of the participants. The video shows that the subject was very drowsy and had four behavioral microsleeps: a 4‐s microsleep at 9s, a 2‐s microsleep at 23 s, a 5‐s microsleep at 26 s, and a 9‐s microsleep at 46 s. The right panel displays response behaviors (from top to bottom): target (red) and response (blue) position in horizontal direction, target (yellow) and response (light blue) position in vertical direction, tracking error (black), resultant target (light blue) and response (green) position, and target (black) and response speed (pink). As seen in the video, during microsleeps, eye‐closure is accompanied by flat tracking in both vertical and irection.
REFERENCES
- Allen PJ, Josephs O, Turner R (2000): A method for removing imaging artifact from continuous EEG recorded during functional MRI. Neuroimage 12:230–239. [DOI] [PubMed] [Google Scholar]
- Behrens TEJ, Johansen‐Berg H, Woolrich MW, Smith SM, Wheeler‐Kingshott CAM, Boulby PA, Barker GJ, Sillery EL, Sheehan K, Ciccarelli O (2003): Non‐invasive mapping of connections between human thalamus and cortex using diffusion imaging. Nat Neurosci 6:750–757. [DOI] [PubMed] [Google Scholar]
- Boyle LN, Tippin J, Paul A, Rizzo M (2008): Driver performance in the moments surrounding a microsleep. Transp Res Part F Traffic Psychol Behav 11:126–136. [DOI] [PMC free article] [PubMed] [Google Scholar]
- Briselli E, Garreffa G, Bianchi L, Bianciardi M, Macaluso E, Abbafati M, Grazia Marciani M, Maraviglia B (2006): An independent component analysis‐based approach on ballistocardiogram artifact removing. Magn Reson Imaging 24:393–400. [DOI] [PubMed] [Google Scholar]
- Buchsbaum MS, Buchsbaum BR, Chokron S, Tang C, Wei TC, Byne W (2006): Thalamocortical circuits: fMRI assessment of the pulvinar and medial dorsal nucleus in normal volunteers. Neurosci Lett 404:282–287. [DOI] [PubMed] [Google Scholar]
- Calhoun V, Pekar J, McGinty V, Adali T, Watson T, Pearlson G (2002): Different activation dynamics in multiple neural systems during simulated driving. Hum Brain Mapp 16:158–167. [DOI] [PMC free article] [PubMed] [Google Scholar]
- Chee M, Tan J, Zheng H, Parimal S, Weissman D, Zagorodnov V, Dinges D (2008): Lapsing during sleep deprivation is associated with distributed changes in brain activation. J Neurosci 28:5519–5528. [DOI] [PMC free article] [PubMed] [Google Scholar]
- Chee MW, Tan JC (2010): Lapsing when sleep deprived: Neural activation characteristics of resistant and vulnerable individuals. Neuroimage 51:835–843. [DOI] [PubMed] [Google Scholar]
- Coull JT (1998): Neural correlates of attention and arousal: Insights from electrophysiology, functional neuroimaging and psychopharmacology. Prog Neurobiol 55:343–361. [DOI] [PubMed] [Google Scholar]
- Dang‐Vu TT, Schabus M, Desseilles M, Sterpenich V, Bonjean M, Maquet P (2010): Functional neuroimaging insights into the physiology of human sleep. Sleep 33:1589–1603. [DOI] [PMC free article] [PubMed] [Google Scholar]
- Dinges D, Powell J (1989): Sleepiness impairs optimum response capability—It's time to move beyond the lapse hypothesis. Sleep Res 18:366. [Google Scholar]
- Dinges DF, Grace R (1998): PERCLOS: A valid Psychophysiological Measure of Alertness as Assessed by Psychomotor Vigilance. Washington, DC: US Department of Transportation, Federal Highway Administration. Technical Report Publication No. FHWA‐MCRT‐98–006.
- Doran S, Van Dongen H, Dinges D (2001): Sustained attention performance during sleep deprivation: Evidence of state instability. Arch Ital Biol 139:253–267. [PubMed] [Google Scholar]
- Drummond SPA, Grethe AB, Dinges D, Ayalon L, Mednick SC, Meloy MJ (2005): The neural basis of the psychomotor vigilance task. Sleep 28:1059–1068. [PubMed] [Google Scholar]
- Foucher JR, Otzenberger H, Gounot D (2004): Where arousal meets attention: A simultaneous fMRI and EEG recording study. Neuroimage 22:688–697. [DOI] [PubMed] [Google Scholar]
- Fukunaga M, Horovitz S, van Gelderen P, de Zwart J, Jansma J, Ikonomidou V, Chu R, Deckers R, Leopold D, Duyn J (2006): Large‐amplitude, spatially correlated fluctuations in BOLD fMRI signals during extended rest and early sleep stages. Magn Reson Imaging 24:979–992. [DOI] [PubMed] [Google Scholar]
- Glover GH, Li TQ, Ress D (2000): Image‐based method for retrospective correction of physiological motion effects in fMRI: RETROICOR. Magn Reson Med 44:162–167. [DOI] [PubMed] [Google Scholar]
- Goldman R, Stern J, Engel J Jr, Cohen M (2002): Simultaneous EEG and fMRI of the alpha rhythm. Neuroreport 13:2487–2492. [DOI] [PMC free article] [PubMed] [Google Scholar]
- Harrison Y, Horne JA (1996): Occurrence of microsleeps during daytime sleep onset in normal subjects. Electroencephalogr Clin Neurophysiol 98:411–416. [DOI] [PubMed] [Google Scholar]
- Hori T, Hayashi M, Morikawa T (1994): Topographical EEG changes and the hypnagogic experience In: Ogilvie RD, Harsh JR, editors. Sleep Onset: Normal and Abnormal Processes.Washington, DC:American Psychological Association; pp237–253. [Google Scholar]
- Horne JA, Reyner LA (1995): Sleep related vehicle accidents. Br Med J 310:565–567. [DOI] [PMC free article] [PubMed] [Google Scholar]
- Horne JA, Reyner LA, Barrett PR (2003): Driving impairment due to sleepiness is exacerbated by low alcohol intake. Occup Environ Med 60:689–692. [DOI] [PMC free article] [PubMed] [Google Scholar]
- Horovitz SG, Fukunaga M, de Zwart JA, van Gelderen P, Fulton SC, Balkin TJ, Duyn JH (2008): Low frequency BOLD fluctuations during resting wakefulness and light sleep: A simultaneous EEG‐fMRI study. Hum Brain Mapp 29:671–682. [DOI] [PMC free article] [PubMed] [Google Scholar]
- Huang R, Jung T, Delorme A, Makeig S (2008): Tonic and phasic electroencephalographic dynamics during continuous compensatory tracking. Neuroimage 39:1896–1909. [DOI] [PubMed] [Google Scholar]
- Hughes SW, Lorincz M, Cope DW, Blethyn KL, Kekesi KA, Parri HR, Juhasz G, Crunelli V (2004): Synchronized oscillations at alpha and theta frequencies in the lateral geniculate nucleus. Neuron 42:253–268. [DOI] [PubMed] [Google Scholar]
- Jenkinson M (2003): A fast, automated, n‐dimensional phase unwrapping algorithm. Magn Reson Med 49:193–197. [DOI] [PubMed] [Google Scholar]
- Jenkinson M, Bannister P, Brady M, Smith S (2002): Improved optimization for the robust and accurate linear registration and motion correction of brain images. Neuroimage 17:825–841. [DOI] [PubMed] [Google Scholar]
- Jones RD, Poudel GR, Innes CR, Davidson PR, Peiris MT, Malla AM, Signal T, Carroll GJ, Watts R, Bones PJ (2010): Lapses of responsiveness: Characteristics, detection, and underlying mechanisms. Proc Int Conf IEEE Eng Med Biol Soc 32:1788–1791. [DOI] [PubMed] [Google Scholar]
- Kajimura N, Uchiyama M, Takayama Y, Uchida S, Uema T, Kato M, Sekimoto M, Watanabe T, Nakajima T, Horikoshi S, Ogawa K, Nishikawa M, Hiroki M, Kudo Y, Matsuda H, Okawa M, Takahashi K. (1999): Activity of midbrain reticular formation and neocortex during the progression of human non‐rapid eye movement sleep. J Neurosci 19:10065–10073. [DOI] [PMC free article] [PubMed] [Google Scholar]
- Kaufmann C, Wehrle R, Wetter TC, Holsboer F, Auer DP, Pollmacher T, Czisch M (2006): Brain activation and hypothalamic functional connectivity during human non‐rapid eye movement sleep: An EEG/fMRI study. Brain 129:655–667. [DOI] [PubMed] [Google Scholar]
- Laufs H, Holt J, Elfont R, Krams M, Paul J, Krakow K, Kleinschmidt A (2006): Where the BOLD signal goes when alpha EEG leaves. Neuroimage 31:1408–1418. [DOI] [PubMed] [Google Scholar]
- Laufs H, Leinschmidt A, Beyerle A, Eger E, Salek‐Haddadi A, Preibisch A, Krakowa CK (2003): EEG‐correlated fMRI of human alpha activity. Neuroimage 19:1463–1476. [DOI] [PubMed] [Google Scholar]
- Lim J, Dinges DF (2010): A meta‐analysis of the impact of short‐term sleep deprivation on cognitive variables. Psychol Bull 136:375–389. [DOI] [PMC free article] [PubMed] [Google Scholar]
- Lin CT, Huang KC, Chao CF, Chen JA, Chiu TW, Ko LW, Jung TP (2010): Tonic and phasic EEG and behavioral changes induced by arousing feedback. Neuroimage 52:633–642. [DOI] [PubMed] [Google Scholar]
- Lin CT, Wu RC, Liang SF, Chao WH, Chen YJ, Jung TP (2005): EEG‐based drowsiness estimation for safety driving using independent component analysis. IEEE Trans Circuits Syst 52:2726–2738. [Google Scholar]
- Llinas R, Steriade M (2006): Bursting of thalamic neurons and states of vigilance. J Neurophysiol 95:3297–3308. [DOI] [PubMed] [Google Scholar]
- Mai JK, Assheuer J, Paxinos G (2004): Atlas of the Human Brain.San Diego, CA:Elsevier Academic Press. [Google Scholar]
- Makeig S, Inlow M (1993): Lapse in alertness: Coherence of fluctuations in performance and EEG spectrum. Electroencephalogr Clin Neurophysiol 86:23–35. [DOI] [PubMed] [Google Scholar]
- Makeig S, Jung TP (1996): Tonic, phasic, and transient EEG correlates of auditory awareness in drowsiness. Cognitive Brain Res 4:15–25. [DOI] [PubMed] [Google Scholar]
- Makeig S, Jung TP, Sejnowski TJ (2000): Awareness during drowsiness: dynamics and electrophysiological correlates. Can J Exp Psychol 54:266–273. [DOI] [PubMed] [Google Scholar]
- Malla AM, Davidson PR, Bones PJ, Green R, Jones RD (2010): Automated video‐based measurement of eye closure for detecting behavioral microsleep. Proc Int Conf IEEE Eng Med Biol Soc 32:6741–6744. [DOI] [PubMed] [Google Scholar]
- Matsuda T, Matsuura M, Ohkubo T, Ohkubo H, Atsumi Y, Tamaki M, Takahashi K, Matsushima E, Kojima T (2002): Influence of arousal level for functional magnetic resonance imaging (fMRI) study: Simultaneous recording of fMRI and electroencephalogram. Psychiatry Clin Neurosci 56:289–290. [DOI] [PubMed] [Google Scholar]
- Moosmann M, Ritter P, Krastel I, Brink A, Thees S, Blankenburg F, Taskin F, Crig H, Vilringer A (2003): Correlates of alpha rhythm in functional magnetic resonance imaging and near infrared spectroscopy. Neuroimage 20:145–158. [DOI] [PubMed] [Google Scholar]
- Olbrich S, Mulert C, Karch S, Trenner M, Leicht G, Pogarell O, Hegerl U (2009): EEG‐vigilance and BOLD effect during simultaneous EEG/fMRI measurement. Neuroimage 45:319–332. [DOI] [PubMed] [Google Scholar]
- Paus ST (1997): Time‐related changes in neural systems underlying attention and arousal during the performance of an auditory vigilance task. J Cognit Neurosci 9:392–408. [DOI] [PubMed] [Google Scholar]
- Peiris MTR, Jones RD, Davidson PR, Carroll GJ, Bones PJ (2006): Frequent lapses of responsiveness during an extended visuomotor tracking task in non‐sleep‐deprived subjects. J Sleep Res 15:291–300. [DOI] [PubMed] [Google Scholar]
- Portas C, Rees G, Howseman A, Josephs O, Turner R, Frith C (1998): A specific role for the thalamus in mediating the interaction of attention and arousal in humans. J Neurosci 18:8979–8989. [DOI] [PMC free article] [PubMed] [Google Scholar]
- Poudel GR, Innes CRH, Jones RD (2012): Cerebral perfusion differences between drowsy and nondrowsy individuals after acute sleep restriction. Sleep 35:1085–1096. [DOI] [PMC free article] [PubMed] [Google Scholar]
- Poudel GR, Jones RD, Innes CRH, Bones PJ, Watts R, Davidson PR (2010): Measurement of BOLD changes due to cued eye‐closure and stopping during a continuous visuomotor task via model‐based and model‐free approaches. IEEE Trans Neural Syst Rehabil Eng 18:479–488. [DOI] [PubMed] [Google Scholar]
- Rechtschaffen A, Kales A (1968): A Manual of Standardized Terminology, Techniques, and Scoring System for Sleep Stages of Human Subjects.Los Angeles:Brain Research Institute, University of California. [Google Scholar]
- Saper CB, Scammell TE, Lu J (2005): Hypothalamic regulation of sleep and circadian rhythms. Nature 437:1257–1263. [DOI] [PubMed] [Google Scholar]
- Schacter DL (1977): EEG theta waves and psychological phenomena: A review and analysis. Biol Psychol 5:47–82. [DOI] [PubMed] [Google Scholar]
- Spiers HJ, Maguire EA (2007): Neural substrates of driving behaviour. Neuroimage 36:245–255. [DOI] [PMC free article] [PubMed] [Google Scholar]
- Steriade M, Timofeev I (2003): Neuronal plasticity in thalamocortical networks during sleep and waking oscillations. Neuron 37:563–576. [DOI] [PubMed] [Google Scholar]
- Tomasi D, Wang RL, Telang F, Boronikolas V, Jayne MC, Wang G‐J, Fowler JS, Volkow ND (2008): Impairment of attentional networks after 1 night of sleep deprivation. Cereb Cortex 19:223–240. [DOI] [PMC free article] [PubMed] [Google Scholar]
- Torsvall L, Åkerstedt T (1988): Extreme sleepiness: Quantification of EOG and spectral EEG parameters. Int J Neurosci 38:435–441. [DOI] [PubMed] [Google Scholar]
- Tyvaert L, Levan P, Grova C, Dubeau F, Gotman J (2008): Effects of fluctuating physiological rhythms during prolonged EEG‐fMRI studies. Clin Neurophysiol 119:2762–2774. [DOI] [PMC free article] [PubMed] [Google Scholar]
- Vogt BA, Laureys S (2005): Posterior cingulate, precuneal and retrosplenial cortices: Cytology and components of the neural network correlates of consciousness. Prog Brain Res 150:205–217. [DOI] [PMC free article] [PubMed] [Google Scholar]
- Vogt BA, Pandya DN, Rosene DL (1987): Cingulate cortex of the rhesus monkey: I. Cytoarchitecture and thalamic afferents. J Comp Neurol 262:256–270. [DOI] [PubMed] [Google Scholar]
- Weissman D, Roberts K, Visscher K, Woldorff M (2006): The neural bases of momentary lapses in attention. Nat Neurosci 9:971–978. [DOI] [PubMed] [Google Scholar]
- Wierwille WW, Ellsworth LA (1994): Evaluation of driver drowsiness by trained raters. Accid Anal Prev 26:571–581. [DOI] [PubMed] [Google Scholar]
- Wright N, McGown A (2001): Vigilance on the civil flight deck: Incidence of sleepiness and sleep during long‐haul flights and associated changes in physiological parameters. Ergonomics 44:82–106. [DOI] [PubMed] [Google Scholar]
- Wu L, Eichele T, Calhoun VD (2010): Reactivity of hemodynamic responses and functional connectivity to different states of alpha synchrony: A concurrent EEG‐fMRI study. Neuroimage 52:1252–1260. [DOI] [PMC free article] [PubMed] [Google Scholar]
Associated Data
This section collects any data citations, data availability statements, or supplementary materials included in this article.
Supplementary Materials
Supporting Information Video: Replay of eye‐video and visuomotor response data recorded inside an MRI scanner during occurrence of behavioral microsleeps in one of the participants. The video shows that the subject was very drowsy and had four behavioral microsleeps: a 4‐s microsleep at 9s, a 2‐s microsleep at 23 s, a 5‐s microsleep at 26 s, and a 9‐s microsleep at 46 s. The right panel displays response behaviors (from top to bottom): target (red) and response (blue) position in horizontal direction, target (yellow) and response (light blue) position in vertical direction, tracking error (black), resultant target (light blue) and response (green) position, and target (black) and response speed (pink). As seen in the video, during microsleeps, eye‐closure is accompanied by flat tracking in both vertical and irection.