

Abstract
Recently, there has been an increased interest in the use of automatically segmented subfields of the human hippocampal formation derived from magnetic resonance imaging (MRI). However, little is known about the test‐retest reproducibility of such measures, particularly in the context of multisite studies. Here, we report the reproducibility of automated Freesurfer hippocampal subfields segmentations in 65 healthy elderly enrolled in a consortium of 13 3T MRI sites (five subjects per site). Participants were scanned in two sessions (test and retest) at least one week apart. Each session included two anatomical 3D T1 MRI acquisitions harmonized in the consortium. We evaluated the test‐retest reproducibility of subfields segmentation (i) to assess the effects of averaging two within‐session T1 images and (ii) to compare subfields with whole hippocampus volume and spatial reliability. We found that within‐session averaging of two T1 images significantly improved the reproducibility of all hippocampal subfields but not that of the whole hippocampus. Volumetric and spatial reproducibility across MRI sites were very good for the whole hippocampus, CA2‐3, CA4‐dentate gyrus (DG), subiculum (reproducibility error∼2% and DICE > 0.90), good for CA1 and presubiculum (reproducibility error ∼ 5% and DICE ∼ 0.90), and poorer for fimbria and hippocampal fissure (reproducibility error ∼ 15% and DICE < 0.80). Spearman's correlations confirmed that test‐retest reproducibility improved with volume size. Despite considerable differences of MRI scanner configurations, we found consistent hippocampal subfields volumes estimation. CA2‐3, CA4‐DG, and sub‐CA1 (subiculum, presubiculum, and CA1 pooled together) gave test‐retest reproducibility similar to the whole hippocampus. Our findings suggest that the larger hippocampal subfields volume may be reliable longitudinal markers in multisite studies. Hum Brain Mapp 36:3516–3527, 2015. © 2015 Wiley Periodicals, Inc.
Keywords: hippocampus, Freesurfer, within session T1 averaging, test‐retest reproducibility
INTRODUCTION
The hippocampal formation, crucial for different cognitive processes such as memory [Rolls, 1996; Squire et al., 1992] and spatial orientation [Burgess et al., 2002; Kaplan et al., 2014], has been examined over the adult life [Mueller et al., 2007] and during normal development [Gogtay et al., 2006]. Hippocampal damage is involved in several psychiatric [Levitt et al., 2010; Selvaraj et al., 2012] and neurological disorders [Callen et al., 2001; Kostić and Filippi, 2011], and importantly, hippocampal atrophy detected using MRI is one of the most noninvasive and validated surrogate outcomes for Alzheimer's disease (AD) clinical trials [Frisoni et al., 2010].
Similarly to whole hippocampus, the hippocampal subfields are differentially affected in a variety of pathological conditions including AD [Apostolova et al., 2010b; Hanseeuw et al., 2011; Khan et al., 2014; Pluta et al., 2012], stress exposure [Teicher et al., 2012; Wang et al., 2010], schizophrenia [Kühn et al., 2012], bipolar disorders [Haukvik et al., 2015], but also during development [Krogsrud et al., 2014], and aging [La Joie et al., 2010].
Recently, there has been an increased interest in the consideration of hippocampus subfields morphometry studies using MRI data. This interest derives from at least two major factors: (i) evidence is accumulating to show that hippocampal subfields are more sensitive than whole hippocampus in predicting pathological alterations [Apostolova et al., 2010b; Maruszak and Thuret, 2014] and (ii) there are freely available fully automated methods for hippocampus subfields segmentations, such as Freesurfer [Van Leemput et al., 2009]. Altogether, these findings support the addition of hippocampal subfields volumes to the battery of brain morphometry measures that can be derived automatically from structural MRI. To date, however, there is limited data available regarding the test‐retest reliability of hippocampal subfields segmentations. This lack of information is relevant for sample size estimations and, in multisite studies, also for the evaluation of reliability biases across its sites. Other studies have evaluated these effects on the volumetric segmentation of the whole hippocampus [Jovicich et al., 2013], showing high volume and spatial reproducibility and consistency across eight clinical 3T MRI sites. It remains unknown how this reproducibility results compared to the hippocampal subfields, which being smaller may be prone to higher segmentation variability.
This study focuses on the test‐retest reproducibility of automatic segmentations of hippocampal subfields derived from 3T T1‐weighted MRI structural data in 65 healthy stable elderly subjects. The data was acquired using a standardized protocol [Jovicich et al., 2013] implemented in a consortium of 13 MRI clinical sites (http://www.alzheimer-europe.org/Research/PharmaCog). We evaluate how reproducibility is affected by averaging or not two structural T1 scans acquired within session. We also evaluate the test‐retest reproducibility of the hippocampal subfields in terms of MRI site effects as well as relative to the reproducibility of the whole hippocampus.
MATERIALS AND METHODS
This study shares various aspects already described in a recent full brain morphometry study [Jovicich et al., 2013]. For completeness, some of these issues (subjects, study design, MRI acquisition, and longitudinal Freesurfer segmentation) are repeated with the corresponding modifications where appropriate. The main differences are two: here, we use the data from a total of 13 clinical sites (instead of eight) and the focus is on the segmentation and reproducibility of the hippocampus subfields automatically segmented by Freesurfer from structural T1 MRI data.
Participants
Thirteen 3T MRI sites participated across Italy (Verona, Chieti, Genoa, Naples, Perugia), Germany (Leipzig, Essen), France (Marseille, Lille, Toulouse), Greece (Thessaloniki), Spain (Barcelona), and Netherland (Amsterdam). The clinical center of Brescia was responsible for the coordination and analysis of the whole study and did not acquire MRI data. Relative to our previous study [Jovicich et al., 2013], the new MRI sites are: Chieti, Naples, Perugia, Thessaloniki, and Amsterdam. Each site recruited five subjects that were scanned twice at least a week apart. The age range of the subjects (Table 1) was similar to those of the clinical population that will be studied with the protocol tested here. Other selection and exclusion criteria have been previously described [Jovicich et al., 2014]. Each subject reported no history of neurological, psychiatric, and cognitive impairment disorder and provided written informed consent as approved by their respective local Ethic Committee. Subjects were considered to be in stable physiological conditions between the two MRI acquisitions.
Table 1.
Summary of demographic, MRI system, and 3D T1 acquisition differences across MRI sites
| Site 1 | Site 2 | Site 3 | Site 4 | Site 5 | Site 6 | Site 7 | Site 8 | Site 9 | Site 10 | Site 11 | Site 12 | Site 13 | |
|---|---|---|---|---|---|---|---|---|---|---|---|---|---|
| MRI site location | Verona | Barcelona | Leipzig | Marseille | Essen | Naples | Genoa | Thessaloniki | Amsterdam | Lille | Toulouse | Chieti | Perugia |
| Subjects' age (range):mean ± SD, years | 67.8 ± 9.9 (26) | 74.6 ± 2.7 (6) | 62.8 ± 2.6 (6) | 66.0 ± 8.3 (20) | 52.4 ± 1.5 (3) | 59.0 ± 3.5 (9) | 58.2 ± 2.2 (5) | 56.6 ± 5.5 (5) | 62.8 ± 8.2 (21) | 64.2 ± 5.3 (13) | 59.2 ± 4.5 (12) | 68.8 ± 4.3 (11) | 60.8 ± 10.3 (24) |
| Test‐retest days interval | 28 ± 23 | 10 ± 3 | 13 ± 3 | 23 ± 22 | 11 ± 5 | 19 ± 15 | 24 ± 17 | 32 ± 8 | 11 ± 6 | 15 ± 11 | 14 ± 10 | 11 ± 5 | 10 ± 4 |
| Gender, (females/N) | 2/5 | 5/5 | 3/5 | 4/5 | 2/5 | 2/5 | 2/5 | 3/5 | 3/5 | 3/5 | 3/5 | 5/5 | 3/5 |
| 3T MRI scanner | Siemens Allegra | Siemens TrioTim | Siemens TrioTim | Siemens Verio | Siemens Skyra | Siemens Biograph mMR | GE HDxt | GE HDxt | GE Discovery MR750 | Philips Achieva | Philips Achieva | Philips Achieva | Philips Achieva |
| MR system software version | VA25A | B17 | B17 | B17 | D11 | B18P | 15 M4A | 15 M4A | DV2 2.0a DV23.1 | 3.2.2 | 3.2.2 | 3.2.2 | 3.2.2 |
| TX/ RX coil | Birdcage | Body/8‐chan. | Body/8‐chan. | Body/12‐chan. | Body/20‐chan. | Body/12‐chan. | Body/8‐chan. | Body/8‐chan. | Body/8‐chan | Body/8‐chan. | Body/8‐chan. | Body/8‐chan. | Body/8‐chan. |
| Parallel imaging:method, acceleration | None | GRAPPA 2 | GRAPPA 2 | GRAPPA 2 | GRAPPA 2 | GRAPPA 2 | ASSET 2 | ASSET 2 | ASSET 2 | SENSE 1.5 | SENSE 1.5 | SENSE 2 | SENSE 2 |
| TE (ms, shortest) | 2.83 | 2.98 | 2.98 | 2.98 | 2.03 | 2.96 | 2.86 | 2.98 | 2.92 | 3.16 | 3.16 | 3.10 | 3.10 |
| Acquisition time (min:sec) | 9:50 | 5:12 | 5:12 | 5:12 | 5:12 | 5:03 | 4:43 | 4:40 | 4:14 | 6:50 | 6:50 | 6:08 | 6:08 |
An operating system upgrade happened during the study in site 13. DV22 was used for the first volunteer and DV23.1 for the rest.
MRI Scanners and Sequences
The general acquisition protocol corresponds to the one previously described for eight sites [Jovicich et al., 2013]. Briefly, the participating 3T MRI sites used different MRI system (Siemens, GE, Philips) and applied only vendor‐provided sequences. The MRI acquisition protocol in each session included two structural T1 volumes [3D magnetization‐prepared rapid acquisition gradient echo (MPRAGE) on Siemens and Philips and 3D inversion recovery prepared spoiled gradient echo (IR‐SPGR) on General Electric (GE)] with the following parameters: 3D sagittal acquisition, square field of view (FOV) = 256 mm, 1 × 1 × 1 mm3, TI = 900 ms for Siemens and Philips, 400 ms for GE, flip angle = 9°, no fat suppression, full k space, and no averages. An acceleration factor in the range of 1.5–2 was used where possible (Table 1).
T1 Images Processing
Data preparation was performed as previously reported [Jovicich et al., 2013]. Each subject had a total of four T1 anatomical scans, two from the test session, and two from the retest session. All structural T1 images were processed using the longitudinal pipeline of FreeSurfer v5.1.0 [Dale et al., 1999; Fischl et al., 2002, 2004; Reuter et al., 2012] adding the hipposubfields flag to the recon‐all command. All analysis was performed on the neuGRID platform. A within‐session T1 averaging was also performed. Automatic hippocampal subfields segmentation was computed using both a Bayesian modeling approach and a computational model that defines the areas around the hippocampus [Van Leemput et al., 2009]. In particular, the segmented subfields volumes were given back as posterior probability maps (PPMs), and their volume ( ) was estimated with their expected value, that is, by summing up all the probability values P for each voxel in the PPM and by multiplying them for the voxel's volume, according to the formula:
Volume segmentations included the CA1, CA2‐3, CA4‐dentate gyrus (DG), subiculum, presubiculum, fimbria, and hippocampal fissure. The subiculum, presubiculum, and CA1 volumes were pooled together in a ROI called sub‐CA1 [de Flores et al., 2014]. The whole hippocampal volume was extracted from the “aseg.stat” file of Freesurfer, and it was not computed adding the single subfields volumes. For each volume, the right and left hemisphere were estimated separately. No manual edits were done.
Reliability Analysis
To assess the reproducibility of the whole hippocampus and its subfields volumes, we calculated the percent absolute reproducibility error (ε) and the spatial reproducibility coefficient (DICE) across the test‐retest sessions at each site. For every MRI site, hippocampal subfield and reproducibility measure the averaged value across subjects and hemispheres was reported.
The dimensionless metric ε was calculated as test‐retest absolute volume differences relative to the mean on ROI labels:
The DICE coefficient was calculated with the classic formula:
where and represents the binary masks coming from the two different MRI sessions. The subfields' binary masks M were computed by thresholding the corresponding PPM. To avoid the generation of topological errors, when generating masks for each hippocampus subfield volume, the threshold value for each mask was set automatically for each subject such that the total volume of the thresholded mask would remain equal to , as calculated with the aforementioned formula. This approach ensured that there were no subthreshold empty spaces left within the subfields volumes.
Statistical Analysis
Data were analyzed using SPSS version 13.0. One‐way Kruskal–Wallis test (nonparametric version of ANOVA) was used to test for MRI site effect on the subject's distribution of age, gender, volumes, and reproducibility measures estimates (significant threshold of P < 0.05). Mann–Whitney test (nonparametric version of t‐test) was performed when only two sites were compared (significant threshold of P < 0.05). The Wilcoxon test (nonparametric version of paired t‐test) and the Levene test were applied to, respectively, compare mean reproducibility and its variance between averaged and single T1 images and between sub‐CA1 and whole hippocampus (significant threshold of P < 0.05). Spearman's rank correlation was used to assess the strength of association between volume size and reproducibility.
RESULTS
The age distribution analysis revealed a similar distributions except for site 2 (older group, mean age 74.6 ± 2.7 years, significantly different from site 5, 6, 7, 8, 11, Mann–Whitney, P < 0.05) and 5 (younger group, 52.4 ± 1.5 years, different from site 1, 2, 12, Mann–Whitney, P < 0.05; Table 1). There were no gender distribution differences among sites. The time interval between test and retest scans ranged from 7 to a maximum of 56 days, with a mean and standard deviation of 17 ± 12 days (Table 1). Four of 260 were missing volumes: two subjects from site 8 and one from site 10 had missing T1 images repetitions in the test session, and one T1 image from site 1 was discarded because it required manual edits. Visual inspection of the hippocampal subfields segmentation showed good segmentation quality (Fig. 1) across magnetic resonance (MR) vendors.
Figure 1.
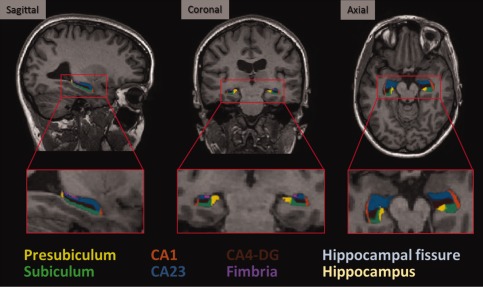
Automatic hippocampal subfields segmentations overlaid on sample subject 3T MRI scan. [Color figure can be viewed in the online issue, which is available at http://wileyonlinelibrary.com.]
Effects of Within Session MPRAGE Averaging
Relative to the use of single MPRAGE, within session coregistration and averaging of two T1 images gave a significant improvement in the mean across‐session test‐retest volume reproducibility error of all hippocampal subfields (Wilcoxon test, P < 0.050) except for subiculum (Wilcoxon test, P = 0.051) and whole hippocampus (Fig. 2A), where there were no significant differences. Analysis of reproducibility error variance showed a clear advantage for presubiculum and CA1 of averaged T1 compared to single T1 acquisitions (Levene test, P < 0.050). Spatial reproducibility was also significantly improved (higher DICE coefficient) when using the averaged T1 images (Wilcoxon test, P < 0.001) while its variance was similar between the two approaches (Levene test, P > 0.050; Fig. 2B).
Figure 2.
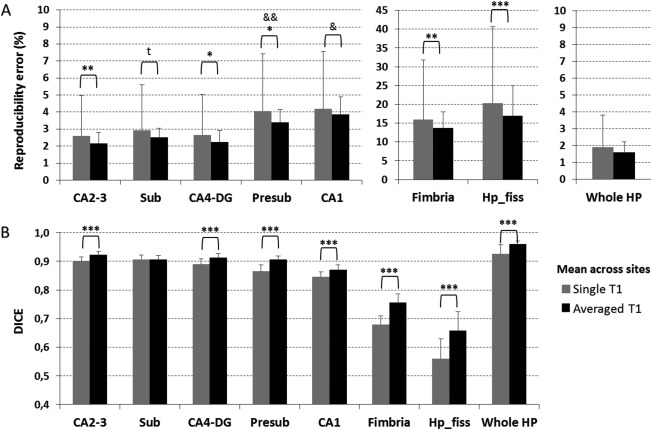
Across session (A) absolute volume reproducibility error and (B) spatial reproducibility (DICE coefficient) of whole and subfield hippocampus segmentations derived from a single T1 (gray) versus two within‐session coregistered and averaged T1 volumes (black). Results are averaged across sites. Error bars indicate the standard deviation on the mean. Abbreviations: CA2‐3, cornu ammonis 2‐3; Sub, subiculum; CA4‐DG, cornu ammonis 4‐ dentate gyrus; Presub, presubiculum; CA1, cornu ammonis 1; Hp_fiss, hippocampal fissure; Whole HP, whole hippocampus. t, trend forward significance; *P < 0.05, **P < 0.01, ***P < 0.001 at Wilcoxon test between single and averaged T1 mean; & P < 0.05, && P < 0.01 at Levene test between single and averaged T1 variance.
All the results reported below refer to the segmentations derived from the within session averaged T1 images.
Reproducibility of Whole and Subfield Hippocampus Segmentations
The mean reproducibility error at each MRI site was computed averaging the test‐retest reproducibility errors across subjects and hemispheres (Fig. 3A). Mean volume reproducibility error across MRI sites for CA2‐3, CA4‐DG, subiculum, and whole hippocampus was about 2%, less than 5% for CA1 and presubiculum, and around 15% for fimbria and hippocampal fissure (Fig. 3A, black columns). A significant MRI site effect for the reproducibility error was detected only for the hippocampal fissure [Kruskal‐Wallis (KW) test, P = 0.014].
Figure 3.
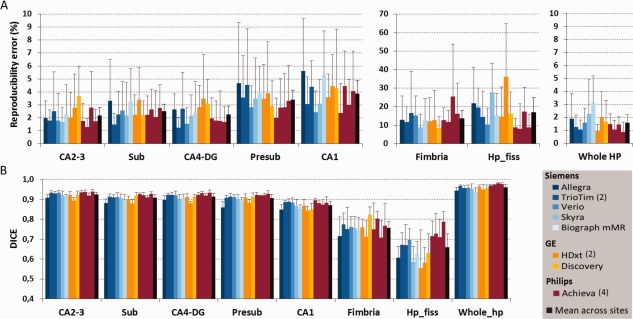
Across session (A) volume reproducibility error and (B) spatial reproducibility (DICE coefficient) of whole and subfield hippocampus segmentations. The last black column shows for each region the averaged reproducibility metrics across sites. An MRI site effect was detected only for the reproducibility error of hippocampal fissure (KW test, P = 0.014) and for the DICE of all structures (KW test, P = 0.017) except for fimbria. Error bars indicate the standard deviation on the mean. Abbreviations are the same of Figure 1. See Table 1 for MRI sites' description. [Color figure can be viewed in the online issue, which is available at http://wileyonlinelibrary.com.]
The DICE site mean was computed averaging the spatial coefficient across subjects and hemispheres at each site (Fig. 3B). Mean DICE coefficient across MRI sites for CA2‐3, CA4‐DG, subiculum, and presubiculum was higher than 0.90, equal to 0.87 for CA1 and about 0.70 for fimbria and hippocampal fissure (0.76 and 0.66, respectively; Fig. 3B, black columns). The mean DICE for the whole hippocampus was 0.96. A significant MRI site effect of spatial reproducibility was detected for all structures (KW test, P = 0.017) except for fimbria.
Spearman's rank order correlation revealed a strong significant inverse relationship between volume and reproducibility error (R s = −0.68, P < 0.001, n = 455) and a very strong direct relation between volumes and DICE (R s = 0.82, P < 0.001, n = 455; Fig. 4A, B, respectively).
Figure 4.
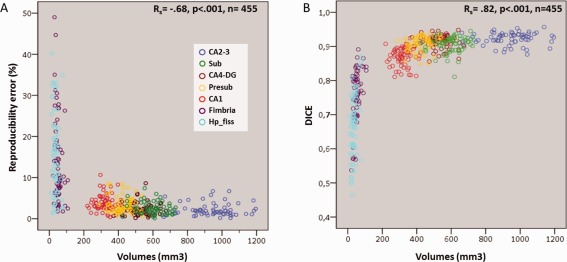
Scatter plots for subfields hippocampus segmentations showing the relationship between volumes and (A) reproducibility errors or (B) DICE coefficient. Circles indicate the subject volumes averaged across hemispheres and sessions. Abbreviations are the same of Figure 1. [Color figure can be viewed in the online issue, which is available at http://wileyonlinelibrary.com.]
Effects of Subfields Averaging
A previous study has reported that pooling together the subiculum, presubiculum, and CA1 volumes increased the concordance between Freesurfer segmentation and manual tracing (de Flores, et al., 2014). To evaluate the reproducibility of this more accurate structure, we computed, for each subject and session, the volume sum of these three areas (sub‐CA1). A general mean and variance reduction of the reproducibility error was detected for sub‐CA1 relative to subiculum, presubiculum, and CA1 alone at each site (Fig. 5A, gray columns). Spatial reproducibility advantages were also found at each site for sub‐CA1, giving significantly higher DICE values relative to the DICE from single ROIs (Fig. 5B, grey columns). Sub‐CA1 reproducibility error and DICE averaged across sites showed higher mean (Wilcoxon test, P < 0.05) and comparable variance relative to whole hippocampus (Levene test, P > 0.05; Fig. 5, red column). Concerning MRI site effects of sub‐CA1, reproducibility error did not give significant site's effects but DICE did (KW test, P < 0.001).
Figure 5.
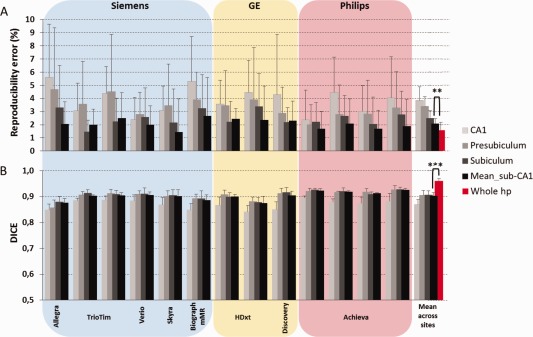
Effects on (A) volume reproducibility error and (B) spatial reproducibility (DICE) when subiculum, presubiculum and CA1 (new ROI called sub‐CA1) were added together. The last group of columns shows the averaged across sites. An MRI site effects was detected for DICE but not for the reproducibility error of the sub‐CA1. No differences between sub‐CA1 and whole hippocampus variance were found. Error bars indicate the standard deviation on the mean. **P < 0.01, ***P < 0.001 at Wilcoxon test between sub‐CA1 and whole hippocampus mean. [Color figure can be viewed in the online issue, which is available at http://wileyonlinelibrary.com.]
DISCUSSION
In this 3T MRI study, we evaluated for the first time the multisite test‐retest reproducibility of automated hippocampal subfield segmentations in a population of 65 healthy elderly subjects scanned twice in a consortium of 13 clinical scanners (Table 1). Our main findings are the following: (i) the test‐retest reproducibility of hippocampal subfields volume segmentations is significantly improved if two within‐session T1 anatomical scans are averaged relative to using a single T1 acquisition; (ii) volume reproducibility of the hippocampal subfields measured by the percent error variability does not show significant MRI site effects; (iii) grouping CA1, presubiculum, and subiculum gives a structure with a test‐retest reproducibility error comparable to that of the whole hippocampus (2%) and no reproducibility site effects.
Despite the large hardware/software differences of the 13 MRI scanner configurations, our results revealed a consistent test‐retest reproducibility of hippocampal subfields volumes as well as whole hippocampus volume across sites. Previous reproducibility studies of cortical thickness, ventricular, intracranial, and subcortical structures, including whole hippocampus, have shown that averaging two within‐session T1 anatomical acquisitions did not improve test‐retest reliability [Han et al., 2006; Jovicich et al., 2009, 2013]. Here, we show that for the automatic segmentation of hippocampus subfields at 3T, the averaging of two within‐session T1 anatomical scans does in fact significantly improve both volume and spatial reproducibility, consistently across sites and in most of the hippocampal subfields (Fig. 2). Only subiculum and CA1 had similar reproducibility regardless of averaging or not the T1 data. However, the former displayed a trend forward significance and the latter, with the presubiculum, reported a variance decrease. Consistently with previous studies, the reproducibility of the whole hippocampus Freesurfer segmentation volume remained unaffected by the use of one or two structural T1 volumes. Our results, therefore, support the use of two T1 acquisitions per session if the hippocampus subfields segmentation is of interest.
Whole hippocampus, CA2‐3, subiculum, and CA4‐DG had the lowest reproducibility error, around 2% (Fig. 3A). The reproducibility error was consistent across MRI sites suggesting the high potential of these subfields for quantifying atrophy changes in a multisite longitudinal study that pools the data. A good reproducibility error (approximately 5%), consistent across sites, was reported for presubiculum and CA1 while the poorest reproducibility was detected for fimbria and hippocampal fissure (about 15%; Fig. 3A).
The spatial reproducibility analysis revealed an excellent reproducibility for whole hippocampus, CA2‐3, CA4‐DG, subiculum, and presubiculum (mean higher than 0.90) and a slightly lower reproducibility for CA1 (mean DICE 0.87; Fig. 3B). Again, the smaller structures like fimbria and hippocampal fissure had the worse spatial reproducibility (mean DICE lower than 0.8).
As expected and in agreement with previous studies [Van Leemput et al., 2009], reproducibility was higher in the bigger segmented volumes (Fig. 4).
Even though this study focuses on segmentation reproducibility of hippocampal subfields, the evaluation of segmentation accuracy is of outmost importance, both for manual or automatic labelling protocols [Yushkevich et al., 2015]. The greatest disagreement between manual labeling protocols for hippocampal subfields has been observed in the anterior portion of the hippocampal formation, at the CA1/subiculum boundary [Yushkevich et al., 2015]. In agreement with this, a recent study comparing manual with Freesurfer's segmentations found that Freesurfer's CA1 segmentation was partially included in the subiculum, resulting in volume underestimation and subiculum overestimation, with overall reduced agreement between automated and manual volumes [de Flores et al., 2014]. Such differences could explain why CA1 was reported to be insensitive to AD pathology in some studies using Freesurfer [Hanseeuw et al., 2011; Khan et al., 2014] while other neuroimaging [Apostolova et al., 2010a; Chételat et al., 2008; Frisoni et al., 2008] as well as neuropathological studies [Schönheit et al., 2004] showed CA1 volumes effects in AD populations.
Subfield segmentation accuracy and reproducibility, however, can be improved by combining subfields. In their study, de Flores et al. shows that adding together subiculum, presubiculum, and CA1 volumes gives a structure (sub‐CA1) that not only has good agreement between manual and automated Freesurfer volumes estimates but also shows the same MCI and AD age effects in both segmentations [de Flores et al., 2014]. Our study shows a clear test‐retest reproducibility advantage for sub‐CA1 relative to its separate subfields components, probably due to its bigger size (Fig. 5). We found that relative to its subcomponents, sub‐CA1 gave both a lower reproducibility error mean and within site variance. Of particular importance is the comparison of the reproducibility of sub‐CA1 with that of the whole hippocampus, which is one of the most noninvasive validated AD surrogate outcomes [Frisoni et al., 2010] and already used as biomarker to enrich the population selection in AD clinical trials (EMA/CHMP/SAWP/809208/2011). In our healthy population, both sub‐CA1 reproducibility error and DICE coefficient showed a slightly lower but still comparably good reliability (reproducibility error ∼2%, DICE = 0.90) relative to that of the whole hippocampus. Further studies elucidating sub‐CA1 accuracy to categorize patients and to predict disease progression are crucially necessary to confirm or contradict sub‐CA1 area as the most reasonable automated estimates in the anterior portion of the hippocampus within the Freesurfer subfields measures.
This study has several limitations, some of which were previously discussed [Jovicich et al., 2013, 2014] but are here highlighted for completeness. The set of subjects scanned at each MRI site was different, the number of volunteers per site was only five, and the test‐retest repetitions were only two. This study was focused on estimating the across session reliability, and as in longitudinal studies where subject baseline acquisition acts like its own control, we expected that this inhomogeneity did not affect the final reliability results. A higher number of across session repetitions and subjects will probably introduce a higher variance (i.e., subject positioning or hydration, scanner stability), more realistically reflecting the longitudinal scenario. Finally, the resolution of our images (1 × 1 × 1 mm3) is different from that reported for the hippocampal subfields package development (0.38 × 0.38 × 0.8 mm3) [Van Leemput et al., 2009], but the purpose here was to evaluate the test‐retest reliability on vendor‐provided 3T T1 sequences available on clinical scanners. Manual edits were not used, they may reduce reproducibility errors and increase the anatomical contours accuracy although T1 MRI contrast, and subfields size will make edits challenging. Lastly, our analysis was limited to the evaluation of reproducibility, not accuracy, and used the longitudinal analysis of Freesurfer v5.1.0. To allow the evaluation of different tools or newer versions, we will make the raw data available (https://neugrid4you.eu/datasets).
CONCLUSIONS
Despite notable differences in 3T MRI scanner configurations, our results revealed an overall consistent test‐retest reproducibility of the automatic Freesurfer hippocampal subfields segmentations in a consortium of 13 sites using a standardized acquisition protocol. Segmentations obtained from the average of two within‐session T1 anatomical scans were more reliable than those derived from single T1 acquisitions. The volume reproducibility of CA2‐3, CA4‐DG, and sub‐CA1 was comparable to that of the whole hippocampus. These results support the use of automated hippocampal subfields segmentations in multicentric longitudinal studies evaluating new biomarkers of disease prediction/progression and treatment response. The development/improvement of more accurate automated subfield segmentation protocols will require precise accuracy assessments and further reproducibility evaluations.
ACKNOWLEDGMENTS
All members of the Pharmacog project deserve sincere acknowledgement for their significant efforts, but unfortunately, they are too numerous to mention. The authors would like to thank especially to people who contributed to the early phases of this study, including Luca Venturi, Genoveffa Borsci, Thomas Günther, Valérie Chanoine and Aurélien Monnet.
Conflict of interest: The authors have no conflicts of interests to declare.
REFERENCES
- Apostolova LG, Mosconi L, Thompson PM, Green AE, Hwang KS, Ramirez A, Mistur R, Tsui WH, de Leon MJ (2010a): Subregional hippocampal atrophy predicts alzheimer's dementia in the cognitively normal. Neurobiol Aging 31:1077–1088. [DOI] [PMC free article] [PubMed] [Google Scholar]
- Apostolova LG, Thompson PM, Green AE, Hwang KS, Zoumalan C, Jack CR, Harvey DJ, Petersen RC, Thal LJ, Aisen PS, Toga AW, Cummings JL, Decarli CS (2010b): 3D comparison of low, intermediate, and advanced hippocampal atrophy in MCI. Hum Brain Mapp 31:786–797. [DOI] [PMC free article] [PubMed] [Google Scholar]
- Burgess N, Maguire EA, O'Keefe J (2002): The human hippocampus and spatial and episodic memory. Neuron 35:625–641. [DOI] [PubMed] [Google Scholar]
- Callen DJ, Black SE, Gao F, Caldwell CB, Szalai JP (2001): Beyond the hippocampus: MRI volumetry confirms widespread limbic atrophy in AD. Neurology 57:1669–1674. [DOI] [PubMed] [Google Scholar]
- Chételat G, Fouquet M, Kalpouzos G, Denghien I, De la Sayette V, Viader F, Mézenge F, Landeau B, Baron JC, Eustache F, Desgranges B (2008): Three‐dimensional surface mapping of hippocampal atrophy progression from MCI to AD and over normal aging as assessed using voxel‐based morphometry. Neuropsychologia 46:1721–1731. [DOI] [PubMed] [Google Scholar]
- Dale AM, Fischl B, Sereno MI (1999): Cortical surface‐based analysis. I. Segmentation and surface reconstruction. Neuroimage 9:179–194. [DOI] [PubMed] [Google Scholar]
- de Flores R, La Joie R, Landeau B, Perrotin A, Mézenge F, de La Sayette V, Eustache F, Desgranges B, Chételat G (2014): Effects of age and alzheimer's disease on hippocampal subfields: Comparison between manual and freesurfer volumetry. Hum Brain Mapp 36:463–474. [DOI] [PMC free article] [PubMed] [Google Scholar]
- Fischl B, Salat DH, Busa E, Albert M, Dieterich M, Haselgrove C, van der Kouwe A, Killiany R, Kennedy D, Klaveness S, Montillo A, Makris N, Rosen B, Dale AM (2002): Whole brain segmentation: Automated labeling of neuroanatomical structures in the human brain. Neuron 33:341–355. [DOI] [PubMed] [Google Scholar]
- Fischl B, van der Kouwe A, Destrieux C, Halgren E, Ségonne F, Salat DH, Busa E, Seidman LJ, Goldstein J, Kennedy D, Caviness V, Makris N, Rosen B, Dale AM (2004): Automatically parcellating the human cerebral cortex. Cereb Cortex 14:11–22. [DOI] [PubMed] [Google Scholar]
- Frisoni GB, Fox NC, Jack CR, Scheltens P, Thompson PM (2010): The clinical use of structural MRI in alzheimer disease. Nat Rev Neurol 6:67–77. [DOI] [PMC free article] [PubMed] [Google Scholar]
- Frisoni GB, Ganzola R, Canu E, Rüb U, Pizzini FB, Alessandrini F, Zoccatelli G, Beltramello A, Caltagirone C, Thompson PM (2008): Mapping local hippocampal changes in alzheimer's disease and normal ageing with MRI at 3 tesla. Brain 131:3266–3276. [DOI] [PubMed] [Google Scholar]
- Gogtay N, Nugent TF, Herman DH, Ordonez A, Greenstein D, Hayashi KM, Clasen L, Toga AW, Giedd JN, Rapoport JL, Thompson PM (2006): Dynamic mapping of normal human hippocampal development. Hippocampus 16:664–672. [DOI] [PubMed] [Google Scholar]
- Han X, Jovicich J, Salat D, van der Kouwe A, Quinn B, Czanner S, Busa E, Pacheco J, Albert M, Killiany R, Maguire P, Rosas D, Makris N, Dale A, Dickerson B, Fischl B (2006): Reliability of MRI‐derived measurements of human cerebral cortical thickness: The effects of field strength, scanner upgrade and manufacturer. Neuroimage 32:180–194. [DOI] [PubMed] [Google Scholar]
- Hanseeuw BJ, Van Leemput K, Kavec M, Grandin C, Seron X, Ivanoiu A (2011): Mild cognitive impairment: Differential atrophy in the hippocampal subfields. Am J Neuroradiol 32:1658–1661. [DOI] [PMC free article] [PubMed] [Google Scholar]
- Haukvik UK, Westlye LT, Mørch‐Johnsen L, Jørgensen KN, Lange EH, Dale AM, Melle I, Andreassen OA, Agartz I (2015): In vivo hippocampal subfield volumes in schizophrenia and bipolar disorder. Biol Psychiatry 77:581–588. [DOI] [PubMed] [Google Scholar]
- Jovicich J, Czanner S, Han X, Salat D, van der Kouwe A, Quinn B, Pacheco J, Albert M, Killiany R, Blacker D, Maguire P, Rosas D, Makris N, Gollub R, Dale A, Dickerson BC, Fischl B (2009): MRI‐derived measurements of human subcortical, ventricular and intracranial brain volumes: Reliability effects of scan sessions, acquisition sequences, data analyses, scanner upgrade, scanner vendors and field strengths. Neuroimage 46:177–192. [DOI] [PMC free article] [PubMed] [Google Scholar]
- Jovicich J, Marizzoni M, Bosch B, Bartrés‐Faz D, Arnold J, Benninghoff J, Wiltfang J, Roccatagliata L, Picco A, Nobili F, Blin O, Bombois S, Lopes R, Bordet R, Chanoine V, Ranjeva JP, Didic M, Gros‐Dagnac H, Payoux P, Zoccatelli G, Alessandrini F, Beltramello A, Bargalló N, Ferretti A, Caulo M, Aiello M, Ragucci M, Soricelli A, Salvadori N, Tarducci R, Floridi P, Tsolaki M, Constantinidis M, Drevelegas A, Rossini PM, Marra C, Otto J, Reiss‐Zimmermann M, Hoffmann KT, Galluzzi S, Frisoni GB, Consortium TP (2014): Multisite longitudinal reliability of tract‐based spatial statistics in diffusion tensor imaging of healthy elderly subjects. Neuroimage 101C:390–403. [DOI] [PubMed] [Google Scholar]
- Jovicich J, Marizzoni M, Sala‐Llonch R, Bosch B, Bartrés‐Faz D, Arnold J, Benninghoff J, Wiltfang J, Roccatagliata L, Nobili F, Hensch T, Tränkner A, Schönknecht P, Leroy M, Lopes R, Bordet R, Chanoine V, Ranjeva JP, Didic M, Gros‐Dagnac H, Payoux P, Zoccatelli G, Alessandrini F, Beltramello A, Bargalló N, Blin O, Frisoni GB, Consortium P (2013): Brain morphometry reproducibility in multi‐center 3T MRI studies: A comparison of cross‐sectional and longitudinal segmentations. Neuroimage 83:472–484. [DOI] [PubMed] [Google Scholar]
- Kaplan R, Horner AJ, Bandettini PA, Doeller CF, Burgess N (2014): Human hippocampal processing of environmental novelty during spatial navigation. Hippocampus 24:740–750. [DOI] [PMC free article] [PubMed] [Google Scholar]
- Khan W, Westman E, Jones N, Wahlund LO, Mecocci P, Vellas B, Tsolaki M, Kłoszewska I, Soininen H, Spenger C, Lovestone S, Muehlboeck JS, Simmons A; For the AddNeuroMed Consortium and for the Alzheimer's Disease Neuroimaging Initiative (2014): Automated hippocampal subfield measures as predictors of conversion from mild cognitive impairment to alzheimer's disease in two independent cohorts (in press). [DOI] [PMC free article] [PubMed]
- Kostić VS, Filippi M (2011): Neuroanatomical correlates of depression and apathy in parkinson's disease: Magnetic resonance imaging studies. J Neurol Sci 310:61–63. [DOI] [PubMed] [Google Scholar]
- Krogsrud SK, Tamnes CK, Fjell AM, Amlien I, Grydeland H, Sulutvedt U, Due‐Tønnessen P, Bjørnerud A, Sølsnes AE, Håberg AK, Skrane J, Walhovd KB (2014): Development of hippocampal subfield volumes from 4 to 22 years. Hum Brain Mapp 35:5646–5657. [DOI] [PMC free article] [PubMed] [Google Scholar]
- Kühn S, Musso F, Mobascher A, Warbrick T, Winterer G, Gallinat J (2012): Hippocampal subfields predict positive symptoms in schizophrenia: First evidence from brain morphometry. Transl Psychiatry 2:e127 [DOI] [PMC free article] [PubMed] [Google Scholar]
- La Joie R, Fouquet M, Mézenge F, Landeau B, Villain N, Mevel K, Pélerin A, Eustache F, Desgranges B, Chételat G (2010): Differential effect of age on hippocampal subfields assessed using a new high‐resolution 3T MR sequence. Neuroimage 53:506–514. [DOI] [PubMed] [Google Scholar]
- Levitt JJ, Bobrow L, Lucia D, Srinivasan P (2010): A selective review of volumetric and morphometric imaging in schizophrenia. Curr Top Behav Neurosci 4:243–281. [DOI] [PubMed] [Google Scholar]
- Maruszak A, Thuret S (2014): Why looking at the whole hippocampus is not enough‐a critical role for anteroposterior axis, subfield and activation analyses to enhance predictive value of hippocampal changes for alzheimer's disease diagnosis. Front Cell Neurosci 8:95. [DOI] [PMC free article] [PubMed] [Google Scholar]
- Mueller SG, Stables L, Du AT, Schuff N, Truran D, Cashdollar N, Weiner MW (2007): Measurement of hippocampal subfields and age‐related changes with high resolution MRI at 4T. Neurobiol Aging 28:719–726. [DOI] [PMC free article] [PubMed] [Google Scholar]
- Pluta J, Yushkevich P, Das S, Wolk D (2012): In vivo analysis of hippocampal subfield atrophy in mild cognitive impairment via semi‐automatic segmentation of T2‐weighted MRI. J Alzheimers Dis 31:85–99. [DOI] [PMC free article] [PubMed] [Google Scholar]
- Reuter M, Schmansky NJ, Rosas HD, Fischl B (2012): Within‐subject template estimation for unbiased longitudinal image analysis. Neuroimage 61:1402–1418. [DOI] [PMC free article] [PubMed] [Google Scholar]
- Rolls ET (1996): A theory of hippocampal function in memory. Hippocampus 6:601–620. [DOI] [PubMed] [Google Scholar]
- Schönheit B, Zarski R, Ohm TG (2004): Spatial and temporal relationships between plaques and tangles in Alzheimer‐pathology. Neurobiol Aging 25:697–711. [DOI] [PubMed] [Google Scholar]
- Selvaraj S, Arnone D, Job D, Stanfield A, Farrow TF, Nugent AC, Scherk H, Gruber O, Chen X, Sachdev PS, Dickstein DP, Malhi GS, Ha TH, Ha K, Phillips ML, McIntosh AM (2012): Grey matter differences in bipolar disorder: A meta‐analysis of voxel‐based morphometry studies. Bipolar Disord 14:135–145. [DOI] [PubMed] [Google Scholar]
- Squire LR, Ojemann JG, Miezin FM, Petersen SE, Videen TO, Raichle ME (1992): Activation of the hippocampus in normal humans: A functional anatomical study of memory. Proc Natl Acad Sci USA 89:1837–1841. [DOI] [PMC free article] [PubMed] [Google Scholar]
- Teicher MH, Anderson CM, Polcari A (2012): Childhood maltreatment is associated with reduced volume in the hippocampal subfields ca3, dentate gyrus, and subiculum. Proc Natl Acad Sci USA, 109:E563–E572. [DOI] [PMC free article] [PubMed] [Google Scholar]
- Van Leemput K, Bakkour A, Benner T, Wiggins G, Wald LL, Augustinack J, Dickerson BC, Golland P, Fischl B (2009): Automated segmentation of hippocampal subfields from ultra‐high resolution in vivo MRI. Hippocampus 19:549–557. [DOI] [PMC free article] [PubMed] [Google Scholar]
- Wang Z, Neylan TC, Mueller SG, Lenoci M, Truran D, Marmar CR, Weiner MW, Schuff N (2010): Magnetic resonance imaging of hippocampal subfields in posttraumatic stress disorder. Arch Gen Psychiatry 67:296–303. [DOI] [PMC free article] [PubMed] [Google Scholar]
- Yushkevich PA, Amaral RS, Augustinack JC, Bender AR, Bernstein JD, Boccardi M, Bocchetta M, Burggren AC, Carr VA, Mallar Chakravarty M, Chetelat G, Daugherty AM, Davachi L, Ding SL, Ekstrom A, Geerlings MI, Hassan A, Huang Y, Eugenio Iglesias J, La Joie R, Kerchner GA, LaRocque KF, Libby LA, Malykhin N, Mueller SG, Olsen RK, Palombo DJ, Parekh MB, Pluta JB, Preston AR, Pruessner JC, Ranganath C, Raz N, Schlichting ML, Schoemaker D, Singh S, Stark CE, Suthana N, Tompary A, Turowski MM, Van Leemput K, Wagner AD, Wang L, Winterburn JL, Wisse LE, Yassa MA, Zeineh MM; Hippocampal Subfields Group (2015): Quantitative comparison of 21 protocols for labeling hippocampal subfields and parahippocampal subregions in in vivo MRI: Towards a harmonized segmentation protocol. Neuroimage 111:526–541. [DOI] [PMC free article] [PubMed] [Google Scholar]