

Abstract
Diffusion tensor imaging (DTI) studies have shown that left temporoparietal white matter is related to phonological aspects of reading. However, DTI lacks the sensitivity to disentangle whether phonological processing is sustained by intrahemispheric connections, interhemispheric connections, or projection tracts. Spherical deconvolution (SD) is a nontensor model which enables a more accurate estimation of multiple fiber directions in crossing fiber regions. Hence, this study is the first to investigate whether the observed relation with reading aspects in left temporoparietal white matter is sustained by a particular pathway by applying a nontensor model. Second, measures of degree of diffusion anisotropy, which indirectly informs about white matter organization, were compared between DTI and SD tractography. In this study, 71 children (5–6 years old) participated. Intrahemispheric, interhemispheric, and projection pathways were delineated using DTI and SD tractography. Anisotropy indices were extracted, that is, fractional anisotropy (FA) in DTI and quantitative hindrance modulated orientational anisotropy (HMOA) in SD. DTI results show that diffusion anisotropy in both the intrahemispheric and projection tracts was positively correlated to phonological awareness; however, the effect was confounded by subjects’ motion. In SD, the relation was restricted to the left intrahemispheric connections. A model comparison suggested that FA was, relatively to HMOA, more confounded by fiber crossings; however, anisotropy indices were highly related. In sum, this study shows the potential of SD to quantify white matter microstructure in regions containing crossing fibers. More specifically, SD analyses show that phonological awareness is sustained by left intrahemispheric connections and not interhemispheric or projection tracts. Hum Brain Mapp 36:3273–3287, 2015. © 2015 Wiley Periodicals, Inc.
Keywords: diffusion tensor imaging, spherical deconvolution, tractography, anisotropy, phonological awareness, reading
INTRODUCTION
Reading activates a widespread network of distinct regions in the left hemisphere of the brain [Farris et al., 2013; Hoeft et al., 2006; Raschle et al., 2012] consisting of inferior frontal regions, dorsal temporoparietal regions, and ventral occipitotemporal regions. Those regions are connected to each other through white matter pathways. In studying neural correlates of reading, it is evidently of great benefit to investigate the white matter connections involved in reading [Wandell and Yeatman, 2013]. White matter connections can be studied in the in vivo brain by applying diffusion‐weighted magnetic resonance imaging (DW‐MRI). To quantify the study of these connections, fractional anisotropy (FA) has frequently been applied. FA is an indirect measure of white matter organization, driven by microstructural properties such as myelination, axon density, and macrostructural properties such as fiber crossings [Beaulieu, 2009].
Comparing studies that investigate the relation between reading and white matter organization always requires some degree of caution. Some studies only include normal readers [Beaulieu et al., 2005; Dougherty et al., 2007; Nagy et al., 2004; Yeatman et al., 2011] while other studies also include individuals with dyslexia [Frye et al., 2008; Niogi and McCandliss, 2006; Odegard et al., 2009; Rimrodt et al., 2010; Rollins et al., 2009; Steinbrink et al., 2008], yet other studies compare good and poor readers [Keller and Just, 2009; Klingberg et al., 2000]. Also, there can be a considerable difference between studying groups of adults and children as reading is a skill that is learned throughout childhood and for which neural reorganization is required. Finally, behavioral measures of reading and reading‐related skills can be assessed by a wide range of tasks including single word reading, pseudoword reading, letter identification, and phonological awareness tasks [Boets et al., 2010].
Nonetheless, despite the differences across studies, the association between white matter organization and reading and phonological skills in the left temporoparietal region, as first reported by Klingberg et al. [2000], has consistently been observed [Vandermosten et al., 2012b; Vigneau et al., 2006]. White matter in the ventral occipitotemporal region is, conversely, suggested to sustain orthographical processing [Epelbaum et al., 2008; Jobard et al., 2003; Yeatman et al., 2013]. The left temporoparietal region is densely connected as it hosts intrahemispheric tracts, interhemispheric tracts, and projection tracts. In a recent meta‐analysis on studies that applied a voxel‐based approach, an overlapping reading‐related cluster was found in the left temporoparietal region [Vandermosten et al., 2012b]. By tracking fibers through this cluster, it was shown that the region hosted the left intrahemispheric arcuate fasciculus and the left projection tracts in all participants and in some participants also the posterior corpus callosum. In addition to correlations of reading and phonological awareness with white matter organization in the left temporoparietal region itself [Deutsch et al., 2005; Klingberg et al., 2000; Steinbrink et al., 2008], previous studies have also reported a correlation with (some of) these tracts (for a review see [Vandermosten et al., 2012b; Wandell and Yeatman, 2013]).
The intrahemispheric arcuate fasciculus is one of the major association pathways of the human brain [Catani and Thiebaut de Schotten, 2012]. The pathway runs in an anterior‐posterior direction, sustaining a cortico‐cortical connection between the frontal and temporal lobe [Kaplan et al., 2010; Martino et al., 2013] and is here referred to as AFFT (i.e., AF in a strict sense). The AFFT is one of the two subcomponents of the pathway connecting inferior frontal to broader temporoparietal regions, sometimes referred to as the superior longitudinal fasciculus [Deutsch et al., 2005; Powell et al., 2006; Steinbrink et al., 2008; Wakana et al., 2007]. The other subcomponent connects inferior frontal to parietal regions (AFFP) [Catani and Thiebaut de Schotten, 2012].
FA in the left AFFT has been positively correlated to phonological awareness in prereading children [Saygin et al., 2013] and in adults [Vandermosten et al., 2012a]. Yeatman et al. [2012] reported a positive correlation with individual differences in reading skills and FA development rate of the left arcuate fasciculus in children between 7 and 12 years of age. Children with good reading skills showed a positive developmental slope whereas children with poor reading skills showed a negative developmental slope. In addition, other reading processes such as multimodal grapheme‐phoneme integration are also suggested to be sustained by the arcuate fasciculus [Gullick and Booth, 2014]. Finally, a lesion of this pathways resulted in a phonological skill deficit [Rolheiser et al., 2011].
While structural differences in the intrahemispheric left arcuate fasciculus are thought to distinguish between good and poor readers [Klingberg et al., 2000; Thiebaut de Schotten et al., 2012; Vandermosten et al., 2012a], other studies suggest that differences are within the projection tracts [Beaulieu et al., 2005; Niogi and McCandliss, 2006]. The projection pathway runs in a superior‐inferior direction connecting the thalamus to the cerebral cortex. In children, reading and decoding skills have been positively associated with FA of the projection tracts [Beaulieu et al., 2005; Niogi and McCandliss, 2006; Odegard et al., 2009].
In addition to intrahemispheric and projection pathways, interhemispheric tracts have also been related to reading skills. The corpus callosum (CC) pathway is the largest white matter connection in the human brain [Catani and Thiebaut de Schotten, 2008]. This pathway runs in a left‐right direction connecting regions of the left and right hemisphere. The posterior CC tracts pass through the splenium of the CC and connect the left and the right angular gyrus, as already suggested in 1892 by Dejerine, and bilateral posterior superior temporal gyrus [Westerhausen et al., 2009]. Phonological awareness and decoding skills in children [Dougherty et al., 2007; Odegard et al., 2009] and reading in adults [Frye et al., 2008] have been negatively related to FA in posterior callosal tracts. Yet, in contrast to a consistent negative correlation in other studies, one study found a positive FA‐relation with phonological awareness in adults [Frye et al., 2008].
Although the studies described in this section suggest the involvement of intrahemispheric, interhemispheric, and projection white matter connections in reading‐related processes, this observation might be confounded. All three white matter pathways in the left temporoparietal region run in perpendicular directions, causing multiple fiber crossings. The analyses used in previous studies are based on the diffusion tensor model. However, this model is unable to deal with crossing fibers, showing limitations to analyzing pathways running in perpendicular directions. Also, the reading‐related cluster in the left temporoparietal region is based on multiple studies, lacking the ability to investigate all three white matter pathways in one group of participants.
It is essential for reading research to understand the role and organization of white matter pathways of the reading network to (1) improve how we teach children to read and (2) map the deviant patterns of organization in individual's with developmental dyslexia; a learning disability that affects 5–10% of the population and is characterized by severe and persistent reading and/or spelling impairments in the absence of intellectual and sensory deficits [Shaywitz, 1998; Vellutino et al., 2004]. Several studies investigating reading‐related skills in children have shown that poor ability of naming letters and phonological skills in kindergarten is predictive of poor reading ability later on [Boets et al., 2010; Torgesen et al., 2004]. To define neural markers of dyslexia, it is important to determine how these cognitive skills relate to neural substrates. Therefore, we need to disentangle whether in the left temporoparietal region intrahemispheric, interhemispheric, and/or projection pathways drive the association with reading‐related processes. This study is the first to apply a more sophisticated diffusion imaging model and to investigate all three white matter pathways in the same participants. By applying a method that can give information on white matter organization specific to the delineated pathway, we aim to disentangle which white matter connection is truly driving the relation with phonological awareness previously observed in the left temporoparietal region of crossing fibers. Over the last decade, higher order diffusion models have been tested in simulation studies, yet we aim to evaluate its potential in addressing clinically relevant questions.
DIFFUSION IMAGING MODELS
More than two decades ago, neurological reading research consisted of postmortem studies. Already in the 19th century, Reil [1812] and Burdach [1822] described a group of perisylvian fibers and defined the pathway as the arcuate fasciculus. Monakow [1885] and Dejerine [1895] suggested that the frontal and temporal regions, that were revealed to sustain language processes [Broca, 1861; Wernicke, 1874], are connected to each other through the arcuate fasciculus. Although there has been an undeniable added value of postmortem research, the method is confined. First, anatomical details of the white matter pathways remains unclear by postmortem investigations, especially concerning the cortical endpoint of the pathways and distinguishing different pathways [Catani et al., 2008]. Second, investigations can only be performed after the patient has died. As a consequence, the cognitive profile of the patient had to be well established in advance, to understand post mortem findings. Also, research was mostly done on elderly individuals, rather than in young children, and the number of participants in studies was limited. Finally, developmental trajectories could not be mapped by postmortem research. Two decades ago, in vivo DW‐MRI scans were introduced. Diffusion imaging is a structural MRI technique that is based on the knowledge that diffusion of water molecules within white matter is anisotropic whereas diffusion in gray matter and cerebrospinal fluid is isotropic (for further explanation see [Jones and Leemans, 2011; Le Bihan and van Zijl, 2002]). By applying large magnetic field gradients in distinct directions, it is possible to make the MR signal sensitive to diffusion of water molecules along these directions. By modeling this signal, it is then possible to reconstruct white matter trajectories using tractography methods. Different models can be applied on this signal. The first DW‐MRI model was diffusion tensor imaging (DTI), introduced by Basser et al., in 1994. Nowadays, a number of more advanced methods are available. In this section, the classic DTI model and the more advanced spherical deconvolution (SD) model will be described.
Diffusion Tensor Model
Over the past two decades, DTI has been extensively applied in neurological research [Dubois et al., 2008; Lebel and Beaulieu, 2009; Lebel et al., 2008; Mohades et al., 2012; Powell et al., 2006; Steinbrink et al., 2008; Vandermosten et al., 2012a; Vernooij et al., 2007]. At present, DTI is the most frequently applied model for relating the DW‐MRI signal to the underlying neuroanatomy [Tournier et al., 2007]. DTI is based on the classic diffusion tensor model. In each voxel, a tensor is defined by estimating three eigenvectors (v1, v2, v3) and three eigenvalues (λ1, λ2, λ3). The eigenvalues represent the magnitude of the diffusion along the direction of the corresponding eigenvectors [Le Bihan and van Zijl, 2002]. Independently of the number of fibers, one major fiber direction per voxel is estimated, called the major eigenvector [Tournier et al., 2007].
For quantitative analyses, indirect information on white matter organization can be derived by multiple indices, defined based on the estimated eigenvalues of the tensor (e.g., mean diffusivity, radial diffusivity, axial diffusivity, and fractional anisotropy). However, FA, measuring the degree to which the diffusion of water molecules is anisotropic, is the most commonly used index [Jones and Leemans, 2011], with values ranging between 0 (completely isotropic, λ1 = λ2 = λ3) and 1 (completely anisotropic, λ1 > λ2 =/> λ3) [Basser and Pierpaoli, 1996].
One of the major advantages of DTI is that it enables us to study white matter connections in the living human brain. However, as DTI is an indirect reconstruction of the true anatomy, it comes with some limitations. First, in areas with multiple white matter fibers, only one direction per voxel can be estimated. In the majority of white matter voxels (≈ 70–90%), not all the fibers are oriented along the same vector [Jeurissen et al., 2010, Dell'Acqua et al., 2013]. Hence, in some of these voxels, the tensor model is unable to resolve the orientation of multiple crossing fibers. In general, the major eigenvector in voxels with multiple crossing fibers also does not even correspond to the orientation of any of the fibers [Assaf et al., 2004; Tournier et al., 2007]. As a consequence, the diffusion tensor model oversimplifies the underlying neuroanatomy, resulting in a considerable reduction in information. As shown in Figure 1C and as indicated when explaining the limitations of the DTI model, in regions with fiber crossings, DTI cannot make a precise estimation of the underlying anatomy. Second, despite the widespread use of FA and its added value to quantitatively study white matter pathways, the interpretation of the FA index is not always straightforward. FA is calculated at voxel level and is determined by a variety of microstructural properties, for example, the myelination of white matter fibers, the permeability of cell walls and membranes, and the size and packing density of cells [Alexander et al., 2010], as well as macrostructural properties such as the number of crossing fibers. As a lot of anatomical information is reduced to one index, this implies that an increase in FA can, for example, be due to increasing myelination of white matter fibers but may also be the consequence of white matter degeneration [Wheeler‐Kingshott and Cercignani, 2009]. As FA of white matter pathways is influenced by a lot of features and is dependent on its neuroanatomical location in the brain, that is, running through regions with multiple fiber crossings, it is clear that changes in FA following development or pathology are not easy to interpret.
Figure 1.

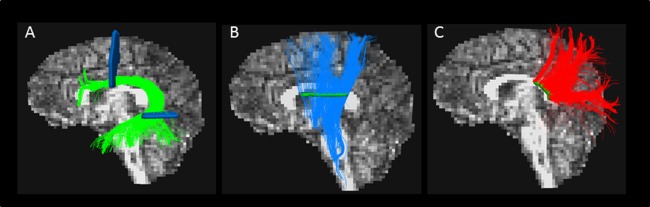
Left temporoparietal white matter, DTI and SD. The three white matter connections running through the left temporoparietal region in a left sagittal view (A) and posterior coronal view (B). Green = AF, red = posterior CC, blue = projection tracts, temporoparietal ROI = orange. Zooming in on the cluster where all white matter tracts cross shows a significant difference between the Diffusion Tensor model (C) and SD model (D), whereby in panel D a lot more callosal (red) fibers are visible.
SD
Nontensor models are more complex models that can characterize the orientations of more than one fiber per voxel. Examples of nontensor models are q‐Ball imaging [Tuch, 2004], diffusion spectrum imaging (DSI) [Wedeen et al., 2005], CHARMED [Assaf et al., 2004], and SD [Dell'Acqua et al., 2010; Tournier et al., 2004]. For many nontensor model analyses (q‐ball, DSI, CHARMED), images with higher or multiple b‐values must be acquired, resulting in longer acquisition times. An advantage of SD is that the acquisition time is close to that of DTI. Therefore, SD methods are increasingly applied [Dell'Acqua et al., 2010].
SD is a nontensor method according to which a continuous 3D distribution of the possible fiber orientations is estimated within each voxel [Dell'Acqua et al. 2007, Tournier et al., 2004]. SD methods can provide information on white matter complexity in each voxel by estimation of the number of distinct fiber orientations. In Figure 1D, the white matter fiber estimation by the SD model is presented, showing a more complex organization of the underlying neuroanatomy. The number of fiber orientation (NuFO) maps allows distinct regions to have a different degree of fiber complexity. NuFO maps have the advantage of providing additional anatomical information per voxel, but it is important to note that NuFO maps do not yet fully describe the microstructural organization of white matter tracts [Dell'Acqua et al., 2013].
For quantitative SD analyses, the hindrance modulated orientational anisotropy (HMOA) index can be derived. It is defined as the absolute amplitude of each lobe of the fiber orientation distribution (for further explanation see [Dell'Acqua et al., 2013]). While FA provides a quantitative measure per voxel, HMOA provides information about the diffusion properties along each fiber orientation, in regions with multiple fiber crossings. Therefore, the HMOA index might have an increased sensitivity to detecting microstructural changes in specific white matter tracts, even in regions of crossing fibers. By applying this tract‐specific index, we might be able to detect fiber diffusivity changes, such as for example developmental myelination processes. The HMOA index seems to provide an advantage for the quantitative study of white matter changes over FA, as confirmed by simulation studies [Dell'Acqua et al., 2013]. Nevertheless, the index has not been implemented in the study of clinical populations. To define the added value of this measure, further research of the developing and degenerating brain will be needed.
In this study, a direct comparison between the anisotropy indices of DTI and SD models is made. FA of the DTI model and HMOA of the SD model are compared in both a region with few and with multiple fiber crossings to verify that SD provides unique and additive information especially in regions of crossing fibers.
METHODS
Participants
Forty‐one male and 30 female prereading children aged 5–6 years are included in this study (73.9 ± 3.3 months old). The data presented here are the first measurement of a longitudinal study on reading development and its neural correlates. In the longitudinal study, a total of 87 Dutch‐speaking children are included, half of whom have a family risk of dyslexia, defined by having at least one first degree relative with dyslexia. In a subsample of 75 children, MRI scans were administered at the end of the last year of kindergarten. Due to unsuccessful DTI‐acquisition, four children were excluded.
Phonological awareness, that is, the awareness of the sound structure of language [Wagner and Torgesen, 1987], was assessed at the beginning of the last year of kindergarten, consisting of an end phoneme and end rhyme identification task [Boets et al., 2010; de Jong et al., 2000, adapted by van Otterloo and Regtvoort]. For the end phoneme identification task, subjects were asked to choose from four alternatives the word that had the same end sound. The task consisted of two practice items and 10 test items. The maximum score was 10. For the end rhyme identification task, the children had to choose, again from four alternatives, which item had the same end rhyme as the given word. Two practice items were presented followed by 12 test items. Each item of both tasks consisted of five visually presented pictures. The first picture represented the given word, and the other four pictures were the answer alternatives. The given word was separated from the other pictures by a vertical line. All pictures were named for the child and represented high frequency monosyllabic Dutch words. To prevent guessing, the distracter alternatives were systematically constructed. The phonological awareness composite score was defined as the mean score of the standardized z‐scores of both tasks.
In the 71 children included in this study, 36 had a family risk of dyslexia, and 35 had no family risk. The matching procedure and criteria for exclusion have been described in Vandermosten et al. [2015]. For the purpose of this study, both children with and without a family risk of dyslexia are included in one group as (1) both groups do not significantly differ on phonological awareness tasks assessed at the start of third grade of kindergarten (see Table 1) and (2) recent evidence suggests that the family risk of dyslexia is continuous rather than discrete [Boets et al., 2010]. In the group with a family risk of dyslexia, preschool children have a 30–50% chance of developing dyslexia [Gilger et al., 1991], whereas in the group with no family risk, representing the normal population, there is a 3–10% chance of developing dyslexia [Snowling, 2000]. Taking into account the variation that can be expected due to the family risk in half of the sample, this group is expected to show a wide range of reading skills as they grow up.
Table 1.
Description of participants’ gender and phonological awareness assessment and the investigated white matter pathways
| FRD+ (n = 36) | FRD− (n = 35) | Test statistics | |
|---|---|---|---|
| Participant characteristics | |||
| Gender (boy/girl) | 23/13 | 18/17 | P = 0.34 |
| Phonological awareness | |||
| End phoneme (items correct) | 4.39 (2.18) | 3.74 (2.34) | t (69) = 1.20; P = 0.23 |
| End rhyme (items correct) | 8.31 (2.73) | 9.17 (2.12) | t (69) = −1.49; P = 0.14 |
| Composite scorea | −0.06 (1.28) | 0 (1) | t (69) = −0.17; P = 0.86 |
| White matter pathways | |||
| DTI (FA) | |||
| AFFT | 0.48 (0.03) | 0.49 (0.03) | t (69) = −0.66; P = 0.51 |
| Projection tracts | 0.49 (0.02) | 0.50 (0.02) | t (69) = −1.39; P = 0.17 |
| CC splenium | 0.55 (0.02) | 0.56 (0.02) | t (69) = −0.97; P = 0.34 |
| SD (HMOA) | |||
| AFFT | 0.10 (0.01) | 0.10 (0.01) | t (69) = −0.41; P = 0.69 |
| Projection tracts | 0.10 (0.01) | 0.11 (0.01) | t (69) = −1.29; P = 0.20 |
| CC splenium | 0.17 (0.02) | 0.17 (0.02) | t (69) = −1.08; P = 0.29 |
Group means are compared using independent samples t‐test, except for the variable gender, which was analyzed by Fisher's exact test
FRD+ = children with a family risk of dyslexia; FRD− = children with no family risk of dyslexia; WM = white matter; FA = fractional anisotropy; HMOA = hindrance modulated orientational anisotropy; AFFT = fronto‐temporal arcuate fasciculus; CC = corpus callosum.
To assist in the interpretation of the results, the composite score of phonological awareness was transferred to effect sizes relative to the mean and standard deviation of the FRD− group.
This study was approved by the ethics committee at the University Hospital of Leuven. The parents of all participants gave their written consent for the children to participate in the study.
DW‐MRI Acquisition
MRI data were acquired on a 3.0 T scanner (Philips, Best, The Netherlands) with a 32‐channel head coil using a single‐shot EPI with SENSE (parallel) acquisition. DTI sagittal slices were obtained using the following parameters: repetition time 7600 ms, echo time 65 ms, flip angle 90°, voxel size 2.5 × 2.5 × 2.5 mm3, 60 noncollinear directions, b‐value 1300 s/mm2, and 6 nondiffusion‐weighted images. The scan acquisition time was 10 min 32 s.
DW‐MRI Processing
The software ExploreDTI (version 4.8.3) [Leemans and Jones, 2009] was used to preprocess the data. Images were corrected for subject motion and eddy current‐induced distortions. Next, for the DTI‐analyses, whole‐brain tractography was conducted using the following parameters: minimum FA (FA‐threshold) = 0.20, maximum turning angle between voxels = 40°, and step length between calculations = 1 mm. For SD analysis, an extra processing step was carried out by the software StarTrack [Dell'Acqua et al., 2013] applying the following SD algorithm parameters: iterations = 350, n = 0.06, and r = 8. Afterward, whole‐brain tractography was conducted using a modified Euler‐like tractography algorithm [Dell'Acqua et al., 2013] using the following parameters: absolute HMOA threshold = 0.02, relative HMOA threshold = 5%, maximum turning angle between voxels = 40°, and step length between calculations = 1 mm.
The software TrackVis [Wang et al., 2007; Wedeen et al., 2008] was applied to perform deterministic tractography of the white matter pathways for both DTI and SD models. In each individual brain, tracts were manually delineated using a region of interest (ROI) approach. ROIs are defined based on anatomical landmarks in color‐coded maps. In these color‐coded maps, the color defines the direction of the streamline. Red streamlines run in a left‐right direction connecting both hemispheres, whereas green streamlines run in an anterior‐posterior intrahemispheric direction and blue streamlines run in a superior‐inferior direction [Pajevic and Pierpaoli, 1999].
As a lot of variation in children's brains can be expected due to growth and development or maturation, data were analyzed in native space, which does not require a conversion of the individual brain to a standard atlas.
Delineation of the ROIs
The selection of ROIs is critical, as even relatively small changes in the anatomical position of the ROI can lead to very different results [Ciccarelli et al., 2005; Tournier et al., 2011]. For manual delineation of white matter pathways, ROIs are drawn on areas that represent “obligatory passages” along the course of the pathway. These obligatory passages represent regions in the brain through which all fibers of one specific tract must pass [Catani et al., 2002; Catani and Thiebaut de Schotten, 2008]. To be able to distinguish between the pathways of interest and other white matter pathways, the ROIs must be defined so that no other white matter pathway shares all obligatory passages. Pathways can be delineated by defining only one ROI. This can be applied when all fibers passing through one specific ROI are considered to belong to a single‐white matter pathway. This one‐ROI approach [Catani and Thiebaut de Schotten, 2008] is used in this study to delineate the projection tracts and CC splenium pathway. For manual delineation of fibers with few and multiple crossings, one ROI is defined as obligatory passage, and all fibers running through this ROI are included. When the tract of interest shares its obligatory passages with at least one other pathway, a two‐ROI approach can be used. In this case, a second ROI is necessary to specify the obligatory passages of the pathway so that the tract of interest can be distinguished from the other tract(s) [Catani and Thiebaut de Schotten, 2008]. In this study, a two‐ROI approach is used to delineate the arcuate fasciculus. Both approaches can be supplemented by ROIs to exclude undesired streamlines (NOT‐ROIs). Fibers passing through these NOT‐ROIs [Wakana et al., 2007] are not considered to be a part of the pathway and are excluded.
The ROIs used for DTI and SD tractography are identical and include the exact same voxels. ROIs were labeled on the color‐coded maps and implemented both for DTI and SD tractography. However, based on the anatomy, fibers that were no part of the pathway of interest were excluded by adding a NOT‐ROI.
All white matter tracts were manually delineated by one operator. To test inter‐rater reliability, a second operator virtually dissected the arcuate fasciculus from 71 DTI‐datasets. Inter‐rater reliability was calculated by an intraclass correlation test. A high intraclass correlation coefficient was found for the number of streamlines for the AFFT (= 0.97), as well as for FA measurements of the AFFT (= 0.99). Additionally, intrarater reliability was calculated in the 71 SD‐datasets, showing a high intraclass correlation coefficient for the HMOA index for the AFFT (= 0.98), projection tracts (= 0.98), and CC splenium (= 0.99).
Reading‐Related White Matter Pathways
With regard to the delineation of the intrahemispheric tracts of the left temporoparietal region, that is, the left arcuate fasciculus, the protocol of Wakana et al. [2007] was applied. The inferior frontal to temporal segment of the arcuate fasciculus (AFFT) was delineated by the combination of two ROIs. The first ROI is defined in a coronal slice and the second ROI in an axial slice (Fig. 2A).
Figure 2.
The three main white matter tracts of the left temporoparietal region. Sagittal view of the left hemisphere showing the three main tracts and their corresponding ROIs for manual delineation: the left frontotemporal arcuate fasciculus (A), left projection tracts (B), and left CC splenium (C).
The projection tracts consist of the corona radiata fibers, which inferiorly enter in the internal capsule. The corona radiata contains ascending thalamic fibers radiating out to various cortical destination and descending motor fibers. The internal capsule can be subdivided into an anterior limb, middle genu, and posterior limb. The projection tracts delineated for this pathway include the genu of the internal capsule [Catani and Thiebaut de Schotten, 2012] and include ascending and descending fibers. The projection tracts are delineated according to the protocol of Catani and Thiebaut de Schotten [2008]. To delineate this pathway, one ROI is defined at an axial slice (Fig. 2B).
For the delineation of interhemispheric tracts running through the posterior CC (Fig. 2C), one ROI is defined in the midsagittal slice. The ROI is placed around the posterior third of the CC containing the splenium [Aukland et al., 2011].
White Matter Fibers with Multiple and Few Crossings
To enable a direct comparison between anisotropic indices, two ROIs containing fibers with multiple and few crossings were delineated, and anisotropic indices were extracted by applying both models. The first ROI was the anterior part of the CC and was selected because it has only few fiber crossings. This anterior part, also called the genu, has been delineated at the midsagittal plane, around the anterior third of the corpus callosum. All fibers running through this ROI were included.
The second ROI was the left temporoparietal region hosting the arcuate fasciculus, projection tracts, and CC and was selected for having multiple fiber crossings. A 3D‐ROI of the same size (see Fig. 1A, B) was in each individual defined in the area where all three white matter pathways were crossing.
RESULTS
A Shapiro‐Wilk test of normality showed that all diffusion indices and behavioral measures were normally distributed. In the first part of this section, the relation between the left temporoparietal white matter pathways and phonological awareness is described. To enable comparison with the literature, analyses are first presented with Pearson correlations. For all white matter connections in DTI as well as SD tractography, there were no group differences between children with and without a family risk of dyslexia (see Table 1), so correlations were not driven by group differences but represented individual variations. In a next step, multiple regression analyses were run with phonological awareness as a dependent variable. All three white matter pathways (intrahemispheric tracts, interhemispheric tracts, and projections tracts) were included as independent variables. In addition, gender was included as an influence on reading‐related neural substrates has been proposed [Altarelli et al., 2013; Sandu et al., 2008] and different developmental trajectories might be expected [Lenroot et al., 2007]. Eight subjects with extreme head motion, defined by more than three SD relative or total head motion in one of the planes [Theys et al., 2014], were excluded. This exclusion procedure was based on the study of Ling et al. [2012] and is described for the subjects of this study in Theys et al. [2014]. Controlling for displacement relative to the preceding volume without excluding subjects did not change the results.
In the second part, a quantitative comparison between DTI and SD models is given, exploring the relation between FA and HMOA indices. To enable a direct comparison between the models, in addition to FA from DTI and HMOA from SD tractography, FA values were also derived from the same SD pathways.
Left Temporoparietal White Matter and Phonological Awareness
DTI
With regard to the correlation with phonological awareness, correlational analyses were first performed using traditional DTI‐outcomes, represented by FA. More specifically, the three main white matter pathways that run through the left temporoparietal region (i.e., AFFT, projection tracts and posterior CC) were delineated based on the diffusion tensor model, and an average FA for each of the pathways was extracted. To enable comparison with the literature, results are first presented with Pearson correlations. Results showed a positive correlation with phonological awareness for FA in the left AFFT (r = .27, P = 0.02) and the left projection tracts (r = 0.26, P = 0.03). There was no relation with the CC splenium tracts (r = 0.16, P = 0.19). These results show that this study replicates previous research outcomes, that is, a positive relation with reading‐related skills within the left arcuate fasciculus [Saygin et al., 2013; Vandermosten et al., 2012a] and left projection tracts [Niogi and McCandliss, 2006; Odegard et al., 2009].
In a next step, a multiple regression analysis was run. Eight subjects with extreme head motion were excluded (n = 63). Controlling for displacement relative to the preceding volume did not change the results. Both the arcuate fasciculus and the projection tracts no longer significantly relate to phonological awareness (AF: t (4,58) = 1.62, P = 0.11; projection tracts: t (4,58) = 1.41, P = 0.16). The relation with the CC splenium pathway remained insignificant (t (4,58) = −.62, P = 0.54). There was no effect of gender (t (4,58) = 0.12, P = 0.90). Applying a multiple regression model seems to attenuate the relation between DTI anisotropy measures and phonological awareness.
SD
In a second step, we applied a new approach by correlating phonological awareness skills with tract‐based SD‐outcome, as represented by HMOA. Again, the arcuate fasciculus, projection tracts, and posterior CC were delineated through SD tractography, which allowed for multiple directions in regions of crossing fibers. The relation with phonological awareness is again first presented with Pearson correlations. The arcuate fasciculus was positively correlated to PA (r = 0.28, P = 0.02) while there was no significant relation between PA and projections tracts (r = 0.14, P = 0.25) and the posterior CC tracts (r = 0.10, P = 0.41). A multiple regression analysis after exclusion of the subjects with extreme head motion (n = 63) confirmed these results. HMOA in the left AFFT significantly predicts PA (t (4,58) = 2.43, P = 0.02) while there was no effect of the projection tracts (t (4,58) = 1.07, P = 0.29) and the posterior CC tracts (t (4,58) = −0.25, 0.81). No effect of gender on PA was found (t (4,58) = 0.65, P = 0.52). As in the case of the DTI analyses, controlling for displacement relative to the preceding volume did not change the results.
Quantitative Model Comparison
Anisotropy indices
In a second part of this study, the relation between the DTI and SD model was examined by investigating the relationship between the FA and HMOA indices. Anisotropy indices were derived from fibers originating from multiple and few fiber crossings. Fibers with multiple crossings were all running through the left temporoparietal region whereas fibers with few crossings were defined by running through the CC genu. For DTI tractography, an FA value was obtained for each pathway. For the pathways analyzed with SD tractography, both HMOA and FA values were derived from the same pathway. This enables a direct comparison between both models.
In Table 2 correlational analyses are presented. Subjects with extreme head motion were excluded. Again, controlling for displacement relative to the preceding volume without excluding subjects did not change the results. The results showed that in a region with few fiber crossings, FA of DTI tractography correlated strongly with FA (r = 0.88, P < 0.01) and HMOA (r = 0.80, P < 0.01) of the SD model. Within SD tractography, FA and HMOA values were also highly correlated (r = 0.76, P < 0.01).
Table 2.
Pearson correlation between FA (DTI and SD) and HMOA (SD) indices derived from a region hosting few and a region hosting multiple fiber crossings
| ROI with few crossings | ROI with multiple crossings | Fisher z test | |
|---|---|---|---|
| DTI (FA)a SD (FA) | 0.88b | 0.67b | z = 3.09; P < 0.01 |
| DTI (FA)a SD (HMOA) | 0.80b | 0.57b | z = 2.44; P = 0.01 |
| SD (FA)a SD (HMOA) | 0.76b | 0.83b | z = 0.99; P = 0.32 |
P < 0.05.
P ≤ 0.01.
In a region with multiple fiber crossings, DTI (FA) was significantly lower correlated to SD (FA), tested with a Fisher z test (z = 3.09, P < 0.01). However, this correlation remained relatively high (r = 0.67, P < 0.01). Similarly, the correlation between DTI (FA) and SD (HMOA) (r = 0.57, P < 0.01) was significantly lower in a region with multiple fiber crossings compared to a region with few fiber crossings (z = 2.44, P = 0.01). In contrast to this decrease in correlation between DTI and SD indices, the relation within SD tractography between FA and HMOA indices remained strong in a region with multiple fiber crossings (r = 0.83, P < 0.01) and did not differ significantly from the correlation in a region with few fiber crossing (z = 0.99, P = 0.32).
These results confirmed that DTI and SD tractography are different in regions with multiple fiber crossings. In particular, a decreased relation was present between DTI and SD anisotropy indices when multiple fiber crossings are present. On the contrary, comparison of FA and HMOA within the exact same voxels of the same tractography model showed that the anisotropy indices are highly related to each other, regardless of the amount of fiber crossings.
Number of voxels
The number of included voxels was obtained for each pathway and for each model. A paired samples test showed that SD includes significantly more voxels than DTI in pathways with both few (DTI: M = 2483, SD = 313; SD: M = 3241, SD = 501, P < 0.01) and multiple fiber crossings (DTI: M = 3361, SD = 602; SD: M = 4782, SD = 697, P < 0.01). These results confirm that the SD model can track better through voxels containing fiber crossings.
DISCUSSION
This is the first study that evaluates the added value of SD – over classic DTI—for finding potential relations with behavioral performance. In particular, we reconstructed and quantified, based on both DTI and SD models, the three main pathways that cross the left temporoparietal region, that is, left intrahemispheric arcuate fasciculus (AFFT), left projection tracts, and interhemispheric posterior CC, in 71 prereading children. Our results show a correlation between phonological awareness and the typical anisotropy diffusion measure, that is, FA based on the tensor model, in both the intrahemispheric and projection tracts. This is consistent with previous findings (for a review see [Vandermosten et al., 2012b]). However, controlling for subject motion, whole‐brain anisotropy and gender attenuates both relations. The novel finding of our study is that this correlational pattern is less diffuse and restricted to left intrahemispheric connections when phonological awareness is linked to HMOA, that is, anisotropy diffusion measures based on nontensor SD models.
Left Temporoparietal White Matter and Phonological Awareness
The left temporoparietal region constitutes an important role in the neural reading network. The region is involved in phonological aspects of reading and in cross‐modal integration [Schlaggar and McCandliss, 2007; Vigneau et al., 2006]. Therefore, this region is also thought to be the neural basis of the phonological deficit in dyslexia [Hoeft et al., 2006]. While a lot of research has been performed on the functional activation of the left temporoparietal region, the role and organization of white matter in this region is not clear.
White matter organization within the temporoparietal region is found to correlate with reading and reading‐related processes [Vandermosten et al., 2012b]. Although DTI is typically used in these studies, it is currently known that there are many regions, in particular the temporoparietal region, where the tensor model of DTI is not valid [Behrens et al., 2003; Dell'Acqua and Catani, 2012; Dell'Acqua et al., 2010]. This could possibly explain the heterogeneity across previous DTI‐studies on the contribution of specific white matter pathways that cross in the left temporoparietal region as regards reading aspects. For example, some studies are not able to precisely allocate the observed reading‐related correlation within the temporoparietal region to a specific pathway [Deutsch et al., 2005; Klingberg et al., 2000; Steinbrink et al., 2008] whereas others vary between allocating the correlation to the intrahemispheric connections [Saygin et al., 2013; Vandermosten et al., 2012a; Yeatman et al., 2012], projection tracts [Niogi and McCandliss, 2006; Odegard et al., 2009], or interhemispheric connections [Dougherty et al., 2007; Frye et al., 2008; Odegard et al., 2009]. This is also in line with a recent meta‐analysis which showed that the left temporoparietal cluster that was consistently found across previous DTI‐studies hosted both the AFFT and projection tracts. This cluster seemed also to host some posterior fibers of the CC, though this was not consistently found across subjects [Vandermosten et al., 2012b].
When we applied the classic DTI model to our data, we observed that reading‐related processes are positively correlated to diffusion anisotropy in the left intrahemispheric connections as well as in the left projection tracts. The correlation between the posterior interhemispheric connections and phonological awareness was not significant. These results are in line with the literature. However, studies that previously reported a relation with the projection tracts did not control for subject motion [Beaulieu et al., 2005; Niogi and McCandliss, 2006] or analyzed data in standard space [Beaulieu et al., 2005; Odegard et al., 2009]. Also, these studies investigate a region by performing voxel‐wise analyses and allocate this region to the projection tracts based on visualization tools. By controlling for potential confounding variables such subject motion, whole‐brain anisotropy and gender in our study, the previously observed relations are attenuated, resulting in a nonsignificant relation with all white matter pathways.
The left temporoparietal region hosts multiple fiber crossings, and as DTI is only capable of estimating one fiber direction in each voxel of the imaged brain, the application of this tensor model results in an oversimplification of the underlying neuroanatomy, which might therefore lead to faulty interpretations. Given that the FA index is only specific at the level of the voxel, and the three perpendicular pathways share a lot of temporoparietal voxels, the FA values within the different crossing pathways are not independent. This implies that a confounding effect of motion in one of the pathways might also influence the observed relation in the crossing pathways.
To obtain a more accurate estimation of white matter structure, we applied SD. This might alleviate the inconsistencies found in previous studies and might disentangle which white matter connections are driving the correlation with phonological awareness. SD analyses were performed on the same three white matter connections. Phonological awareness significantly correlated to HMOA in the left intrahemispheric tracts but not to HMOA in the projection tracts and interhemispheric tracts. Strong evidence was found for this relation in a regression analysis including the influence of motion, gender, and whole‐brain anisotropy. The observation of no significant correlation in the projection or interhemispheric tracts by SD‐analyses, together with verification that SD provides unique information in regions with multiple fiber crossings, suggests that the left intrahemispheric tracts are driving the correlation with phonological awareness. Hence, investigating white matter in the left temporoparietal region by applying a model that is able to estimate multiple fiber directions seems to narrow the correlations down to the left arcuate fasciculus. This observation provides support for the importance of the arcuate fasciculus in the reading circuitry, as has frequently been proposed in skilled readers and even in young children (for a review see [Vandermosten et al., 2012b; Wandell and Yeatman, 2013]). Because of its anatomical connections, a crucial role of the arcuate fasciculus is not surprising. The inferior frontal endpoint of the arcuate fasciculus has been proposed to be involved in higher level processes such as phonological processing [for a meta‐analysis see Vigneau et al., 2006], the construction of new multimodal representations [Hagoort et al., 2009] and has been related to reading performance [Rimrodt et al., 2010]. The temporal endpoint region of the AF has also been shown to be involved in phonological aspects of reading [Booth et al., 2002; for a meta‐analysis see Vigneau et al., 2006] and in multimodal integration [Blau et al., 2009, 2010; Booth et al., 2002; Schlaggar and McCandliss, 2007; van Atteveldt et al., 2007] and is also related to reading performance [Rimrodt et al., 2010].
Based on the function of the endpoints of the arcuate fasciculus and the suggested involvement of the pathway in reading, a relation between the intrahemispheric arcuate fasciculus and phonological awareness seems not surprising. Nevertheless, the arcuate fasciculus is a pathway that matures later during development [Dubois et al., 2008; Lebel et al., 2008; Zhang et al., 2007]. Interestingly, our results suggest that already prior to reading onset, the arcuate fasciculus relates to phonological awareness. This means that although a large reorganization due to reading development still needs to take place, the relation between phonological awareness and the left AF, as reported in adults, is already present at the age of 5–6 years. These results also indicate that lower phonological awareness skills are related to lower anisotropy in the arcuate fasciculus. How this will further influence the development of reading and of the reading network, however, remains to be investigated. Besides the importance of these findings for reading and dyslexia research, poor phonological awareness skills have also been shown in children with specific language impairment (SLI) [Vandewalle et al., 2012], and white matter anomalies in the arcuate fasciculus have been reported in children with SLI [Verhoeven et al., 2011]. Hence, the results of our study, narrowing the correlation between phonological awareness and white matter pathways down to the intrahemispheric arcuate fasciculus, are presumably also relevant for the study of SLI.
Previous classic DTI‐studies have indicated the involvement of the projection tracts in reading‐related processes, despite their assumed role in motoric and perceptual rather than cognitive processes [Catani and Thiebaut de Schotten, 2008]. By applying DTI tractography, we were able to replicate this correlation; however, this correlation seems to be driven by a confounding effect as the DTI‐correlation disappears when whole‐brain anisotropy and/or subject motion is controlled for as well as when SD is applied which controls for crossing fibers. The projection tracts connect the thalamus with the sensorimotor cortex [Catani and Thiebaut de Schotten, 2008], and a role in perceptual and motor functions [Schmahmann and Pandya, 2008] is, therefore, more straightforward than one in reading. The projection tracts also run too medially to connect to the temporoparietal, occipitotemporal, and inferior frontal cortical areas for which fMRI studies clearly demonstrate their involvement in reading.
The posterior CC tracts interhemispherically connect left and right angular gyrus and superior temporal gyrus, which are involved in cross‐modal integration and the processing of phonological word forms [Blau et al., 2010; Booth et al., 2002]. Therefore, a role of these pathway in reading, as has been proposed in children [Dougherty et al., 2007; Odegard et al., 2009] and adults [Frye et al., 2008], is not unexpected. In the prereading brain, however, we did not find such a relation with phonological awareness skills. Interhemispheric connections might play a role during more advanced stages of reading or be involved in other reading‐related mechanisms. Vandermosten and Poelmans et al. [2013] suggested a compensatory role of CC splenium in adults with reading problems. Higher engagement of right posterior areas in individuals with dyslexia has also been suggested [Shaywitz et al., 2002], although it should be noted that this finding has not consistently been replicated [Richlan et al., 2009].
Quantitative Model Comparison
The diffusion anisotropy index of the SD model, HMOA, was shown to vary within one voxel, depending on the white matter tract passing through the voxel [Dell'Acqua et al., 2013], therefore increasing specificity to the level of the tract rather than the voxel, as is the case for FA. A simulation study suggests that HMOA is sensitive to fiber diffusivity changes (e.g., myelination processes or axonal loss) and differences in structural organization of white matter (e.g., axonal diameter and fiber dispersion) [Dell'Acqua et al., 2013]. Also, HMOA would be able to detect degeneration in one white matter tract while another crossing tract remains intact. As part of our study, we verified that SD provides unique and additive information over DTI, especially in regions with multiple fiber crossing. Anisotropy indices of DTI and SD were compared. The FA index is defined by different micro (myelination, axon density) and macro (fiber crossings) structural properties. As the SD model is better able to solve fiber crossings, the question arises whether the HMOA index is, therefore, less influenced by these crossings. The results within SD tractography, showing no influence of the amount of fiber crossings on the relation between FA and HMOA indices, together with the results on the relation between FA of the DTI model and HMOA of SD model, showing a lower correlation in a region with multiple fiber crossings, indicates an influence of fiber crossings at the level of the model. This is, however, not unexpected, as the SD model is better able to solve fiber crossings. To summarize, there seems not to be a direct influence of crossing fibers on the indices, but there is a confounding effect of crossing fibers on DTI tractography.
HMOA is already a valuable attempt to disentangle white matter organization in one voxel, as it provides a different anisotropy value for different crossing fibers in a single voxel. However, additional neuroimaging measurements might provide more information about the microstructural properties of the independent crossing fibers. Tractometry is a recent approach [Bells et al., 2011; Dell'Acqua and Catani, 2012] combining tractography with microscopic quantitative measurements of the individual tracts based on, for example, myelinated water fraction [Deoni et al., 2008] and might lead to a better insight into microscopic white matter structure. Applying the SD model as well, apparent fiber density uses similar methods to present a quantitative measure of fiber orientation distributions [Raffelt et al., 2012]. In addition to SD, there are a number of other nontensor models providing a better estimation of white matter organization than tensor models. DSI and the generalized fractional anisotropy measure have been applied to study patients with obsessive‐compulsive disorder [Chiu et al., 2011]. A recent study used high angular resolution diffusion imaging to investigate neurodegeneration in patients with amyotrophic lateral sclerosis [Trojsi et al., 2013]. The added value of diffusion kurtosis imaging in comparison to classic DTI has been investigated by Gooijers et al. [2013] and Kamagata et al. [2013] in patients with Parkinson's disease. Although these studies seem to suggest an added value of applying higher order imaging models to study clinical populations, the potential added value of these nontensor models for quantitatively studying white matter largely still needs to be explored. Also, the potential added value of SD in other clinical populations remains to be explored.
In summary, the main results of this study suggest that the relation between left temporoparietal white matter and phonological awareness is sustained by left intrahemispheric connections and not by interhemispheric connections or projection tracts. In addition, SD tractography seems to have an increased sensitivity for finding a phonological correlation within left temporoparietal white matter, as results are less confounded by fiber crossings. These results have significant implications for reading research, suggesting the use of more advanced diffusion imaging models to study complex white matter regions. However, as this is to the best of our knowledge, the first study to investigate the relation between a quantitative SD index and a behavioral measure which has been previously related to fractional anisotropy, further research is indicated. This research should include the relation between this index and behavioral measures that have been linked to white matter organization in the brain as well as the developmental and pathological trajectory of the brain. Further advances in the development of higher order diffusion models as well as of techniques that can target specific microscopic properties could help to further increase the specificity and sensitivity of white matter relations with behavior.
ACKNOWLEDGMENTS
Maaike Vandermosten is postdoctoral fellow of the Research Foundation Flanders. Catherine Theys, Astrid De Vos and Sophie Vanvooren are gratefully acknowledged for participant selection and data collection. We would also like to thank Professor Stefan Sunaert and Ron Peeters for technical support. We are grateful to all the children, parents, teachers and schools that participated in this study.
REFERENCES
- Alexander DC, Hubbard PL, Hall MG, Moore EA, Ptito M, Parker GJM, Dyrby TB (2010): Orientationally invariant indices of axon diameter and density from diffusion MRI. Neuroimage 52:1374–1389. [DOI] [PubMed] [Google Scholar]
- Altarelli I, Monzalvo K, Iannuzzi S, Fluss J, Billard C, Ramus F, Dehaene‐Lambertz G (2013): A functionally guided approach to the morphometry of occipitotemporal regions in developmental dyslexia: Evidence for differential effects in boys and girls. J Neurosci 33:11296–11301. [DOI] [PMC free article] [PubMed] [Google Scholar]
- Assaf Y, Freidlin RZ, Rohde GK, Basser PJ (2004): New modeling and experimental framework to characterize hindered and restricted water diffusion in brain white matter. Magn Reson Med 52:965–978. [DOI] [PubMed] [Google Scholar]
- Aukland SM, Westerhausen R, Plessen KJ, Odberg MD, Elgen IB, Peterson BS, Ersland L, Eide GE, Rosendahl K (2011): Selectively reduced posterior corpus callosum size in a Population‐based sample of young adults born with low birth weight. Am J Neuroradiol 32:970–975. [DOI] [PMC free article] [PubMed] [Google Scholar]
- Basser PJ, Pierpaoli C (1996): Microstructural and physiological features of tissues elucidated by quantitative‐diffusion‐tensor MRI. J Magn Reson Ser B 111:209–219. [DOI] [PubMed] [Google Scholar]
- Basser PJ, Mattiello J, LeBihan D (1994): Mr diffusion tensor spectroscopy and imaging. Biophys J 66:259–267. [DOI] [PMC free article] [PubMed] [Google Scholar]
- Beaulieu C (2009): The biological basis of diffusion anisotropy In: Johansen‐ Berg H, Behrens TEJ, editors. Diffusion MRI: From Quantitative Measurement to In Vivo Neuroanatomy. London: Academic Press Elvesier; pp 105–127. [Google Scholar]
- Beaulieu C, Plewes C, Paulson LA, Roy D, Snook L, Concha L, Phillips L (2005): Imaging brain connectivity in children with diverse reading ability. Neuroimage 25:1266–1271. [DOI] [PubMed] [Google Scholar]
- Behrens TEJ, Woolrich MW, Jenkinson M, Johansen‐Berg H, Nunes RG, Clare S, Matthews PM, Brady JM, Smith SM (2003): Characterization and propagation of uncertainty in diffusion‐weighted MR imaging. Magn Reson Med 50:1077–1088. [DOI] [PubMed] [Google Scholar]
- Bells S, Cercignani M, Deoni S, Assaf Y, Pasternak O, Evans CJ, Leemans A, Jones DK (2011): 'Tractometry': Comprehensive multimodal quantitative assessment of white matter along specific tracts. In: Proceedings of 19th Scientific Meeting, International Society for Magnetic Resonance in Medicine, Montréal, Canada.
- Blau V, van Atteveldt N, Ekkebus M, Goebel R, Blomert L (2009): Reduced neural integration of letters and speech sounds links phonological and reading deficits in adults dyslexia. Curr Biol 19:503–508. [DOI] [PubMed] [Google Scholar]
- Blau V, Reithler J, van Atteveldt N, Seitz J, Gerretsen P, Goebel R, Blomert L (2010): Deviant processing of letters and speech sounds as proximate cause of reading failure: A functional magnetic resonance imaging study of dyslexic children. Brain 133:868–879. [DOI] [PubMed] [Google Scholar]
- Boets B, De Smedt B, Cleuren L, Vandewalle E, Wouters J, Ghesquière P (2010): Towards a further characterization of phonological and literacy problems in Dutch‐speaking children with dyslexia. Brit J Dev Psychol 28:5–31. [DOI] [PubMed] [Google Scholar]
- Booth JR, Burman DD, Meyer JR, Gitelman DR, Parrish TD, Mesulam MM (2002): Functional anatomy of intra‐ and cross‐modal lexical tasks. Neuroimage 16:7–22. [DOI] [PubMed] [Google Scholar]
- Broca P (1861): Sur le volume et la forme du cerveau suivant les individus et suivant les races. Bull Soc Anthropol 2:139–207. [Google Scholar]
- Burdach K (1822): Vom Bau und Leben des Gehirns und Rückenmarks. Leipzig: In der Dyk'schen Buchhandlung. [Google Scholar]
- Catani M, Thiebaut de Schotten M (2008): A diffusion tensor imaging tractography atlas for virtual in vivo dissections. Cortex 44:1105–1132. [DOI] [PubMed] [Google Scholar]
- Catani M, Thiebaut de Schotten M (2012): Atlas of Human Brain Connections. New York: Oxford University Press. [Google Scholar]
- Catani M, Howard RJ, Pajevic S, Jones DK (2002): Virtual in vivo interactive dissection of white matter fasciculi in the human brain. Neuroimage 17:77–94. [DOI] [PubMed] [Google Scholar]
- Chiu CH, Lo YC, Tang HS, Liu IC, Chiang WY, Yeh FC, Jaw FS, Tseng WYI (2011): White matter abnormalities of fronto‐striato‐thalamic circuitry in obsessive‐compulsive disorder: A study using diffusion spectrum imaging tractography. Psychiat Res‐Neuroim 192:176–182. [DOI] [PubMed] [Google Scholar]
- Ciccarelli O, Toosy AT, Hickman SJ, Parker GJ, Wheeler‐Kingshott CA, Miller DH, Thompson AJ (2005): Optic radiation changes after optic neuritis detected by tractography‐based group mapping. Hum Brain Mapp 25:308–316. [DOI] [PMC free article] [PubMed] [Google Scholar]
- Dejerine J (1892): Contribution à l'étude anatomo‐pathologique et clinique des differentes variétés de cécité verbal. Mém Soc Biol 4: 61–90. [Google Scholar]
- Dejerine J ( 1895): Anatomie des Centres Nerveux. Paris: Rueff et Cie. [Google Scholar]
- de Jong PF, Seveke MJ, van Veen M (2000): Phonological sensitivity and the acquisition of new words in children. J Exp Child Psychol 76:275–301. [DOI] [PubMed] [Google Scholar]
- Dell'Acqua F, Catani M (2012): Structural human brain networks: Hot topics in diffusion tractography. Curr Opin Neurol 25:375–383. [DOI] [PubMed] [Google Scholar]
- Dell'Acqua F, Rizzo G, Scifo P, Clarke RA, Scotti G, Fazio F (2007): A model‐based deconvolution approach to solve fiber crossing in diffusion‐weighted MR imaging. IEEE Trans Biomed Eng 54:462–472. [DOI] [PubMed] [Google Scholar]
- Dell'Acqua F, Scifo P, Rizzo G, Catani M, Simmons A, Scotti G, Fazio F (2010): A modified damped Richardson‐lucy algorithm to reduce isotropic background effects in spherical deconvolution. Neuroimage 49:1446–1458. [DOI] [PubMed] [Google Scholar]
- Dell'Acqua F, Simmons A, Williams SC, Catani M (2013): Can spherical deconvolution provide more information than fiber orientations? Hindrance modulated orientational anisotropy, a true‐tract specific index to characterize white matter diffusion. Hum Brain Mapp 34:2464–2483. [DOI] [PMC free article] [PubMed] [Google Scholar]
- Deoni SC, Rutt BK, Arun T, Pierpaoli C, Jones DK (2008): Gleaning multicomponent T(1) and T(2) information from steady‐state imaging data. Magn Reson Med 60:1372–1387. [DOI] [PubMed] [Google Scholar]
- Deutsch GK, Dougherty RF, Bammer R, Siok WT, Gabrieli JDE, Wandell B (2005): Children's reading performance is correlated with white matter structure measured by diffusion tensor imaging. Cortex 41:354–363. [DOI] [PubMed] [Google Scholar]
- Dougherty RF, Ben Shachar M, Deutsch GK, Hernandez A, Fox GR, Wandell BA (2007): Temporal‐callosal pathway diffusivity predicts phonological skills in children. Proc Natl Acad Sci USA 104:8556–8561. [DOI] [PMC free article] [PubMed] [Google Scholar]
- Dubois J, Dehaene‐Lambertz G, Perrin M, Mangin JF, Cointepas Y, Duchesnay E, Le Bihan D, Hertz‐Pannier L (2008): Asynchrony of the early maturation of white matter bundles in healthy infants: Quantitative landmarks revealed noninvasively by diffusion tensor imaging. Hum Brain Mapp 29:14–27. [DOI] [PMC free article] [PubMed] [Google Scholar]
- Epelbaum S, Pinel P, Gaillard R, Delmaire C, Perrin M, Dupont S, Dehaene S, Cohen L (2008): Pure alexia as a disconnection syndrome: New diffusion imaging evidence for an old concept. Cortex 44:962–974. [DOI] [PubMed] [Google Scholar]
- Farris E, Odegard T, Ring J, Black J, Lyon R (2013): Growth in reading skills measured with brain activation during phonological fmri tasks in children with developmental dyslexia. J Cogn Neurosci 222–223. [Google Scholar]
- Frye RE, Hasan K, Papanicolaou A (2008): Splenium microstructure is related to two dimensions of reading skill. Neuroreport 19:1627–1631. [DOI] [PMC free article] [PubMed] [Google Scholar]
- Gilger JW, Pennington BF, Defries JC (1991): Risk for Reading‐disability as a function of parental history in 3 family studies. Read Writ 3:205–217. [Google Scholar]
- Gooijers J, Leemans A, Van Cauter S, Sunaert S, Swinnen P, Caeyenberghs K (2013): White matter organization in relation to upper limb motor control in healthy subjects: Exploring the added value of diffusion kurtosis imaging. Brain Struct Funct 219:1627–1638. [DOI] [PubMed] [Google Scholar]
- Gullick MM, Booth JR (2014): Individual differences in crossmodal brain activity predict arcuate fasciculus connectivity in developing readers. J Cogn Neurosci 26:1331–1346. [DOI] [PMC free article] [PubMed] [Google Scholar]
- Hagoort P, Baggio G, Willem RM (2009): Semantic unification In MS Gazzaniga,editor. The Cognitive Neurosciences 4th ed Cambridge, MA: MIT press; pp 819–836. [Google Scholar]
- Hoeft F, Hernandez A, McMillon G, Taylor‐Hill H, Martindale JL, Meyler A, Keller TA, Siok WT, Deutsch GK, Just MA, Whitfield‐Gabrieli S, Gabrieli JDE (2006): Neural basis of dyslexia: A comparison between dyslexic and nondyslexic children equated for reading ability. J Neurosci 26:10700–10708. [DOI] [PMC free article] [PubMed] [Google Scholar]
- Jeurissen B, Leemans A, Tournier J‐D, Jones DK, Sijbers J (2010): Estimating the number of fiber orientations in diffusion MRI voxels: A constrained spherical deconvolution study. In: Proceedings of the International Society for Magnetic Resonance in Medicine, Stockholm, Sweden.
- Jobard G, Crivello F, Tzourio‐Mazoyer N (2003): Evaluation of the dual route theory of reading: A metanalysis of 35 neuroimaging studies. Neuroimage 20:693–712. [DOI] [PubMed] [Google Scholar]
- Jones DK, Leemans A (2011): Diffusion tensor imaging. Method Mol Biol 711:127–144. [DOI] [PubMed] [Google Scholar]
- Kamagata K, Tomiyama H, Motoi Y, Kano M, Abe O, Ito K, Shimoji K, Suzuki M, Hori M, Nakanishi A, Kuwatsuru R, Sasai K, Aoki S, Hattori N (2013): Diffusional kurtosis imaging of cingulate fibers in parkinson disease: Comparison with conventional diffusion tensor imaging. Magn Reson Imaging 31:1501–1506. [DOI] [PubMed] [Google Scholar]
- Kaplan E, Naeser MA, Martin PI, Ho M, Wang Y, Baker E, Pascual‐Leone A (2010): Horizontal portion of arcuate fasciculus fibers track to pars opercularis, not pars triangularis, in right and left hemispheres: a DTI study. Neuroimage 52:436–444. [DOI] [PMC free article] [PubMed] [Google Scholar]
- Keller TA, Just MA (2009): Altering cortical connectivity: Remediation‐induced changes in the white matter of poor readers. Neuron 64:624–31. [DOI] [PMC free article] [PubMed] [Google Scholar]
- Klingberg T, Hedehus M, Temple E, Salz T, Gabrieli JDE, Moseley ME, Poldrack RA (2000): Microstructure of temporo‐parietal white matter as a basis for reading ability: Evidence from diffusion tensor magnetic resonance imaging. Neuron 25:493–500. [DOI] [PubMed] [Google Scholar]
- Le Bihan D, van Zijl P (2002): From the diffusion coefficient to the diffusion tensor. NMR Biomed 15:431–434. [DOI] [PubMed] [Google Scholar]
- Lebel C, Beaulieu C (2009): Lateralization of the arcuate fasciculus from childhood to adulthood and its relation to cognitive abilities in children. Hum Brain Mapp 30:3563–3573. [DOI] [PMC free article] [PubMed] [Google Scholar]
- Lebel C, Walker L, Leemans A, Phillips L, Beaulieu C (2008): Microstructural maturation of the human brain from childhood to adulthood. Neuroimage 40:1044–1055. [DOI] [PubMed] [Google Scholar]
- Leemans A, Jones DK (2009): The B‐matrix must be rotated when correcting for subject motion in DTI data. Magn Reson Med 61:1336–1349. [DOI] [PubMed] [Google Scholar]
- Lenroot RK, Gogtay N, Greenstein DK, M, Wells EM, Wallace GL, Clasen LS, Blumenthal JD, Lerch J, Zijdenbos AP, Evans AC Thompson PM, Giedd JN, (2007): Sexual dimorphism on brain developmental trajectories during childhood and adolescence. Neuroimage 36:1065–1073. [DOI] [PMC free article] [PubMed] [Google Scholar]
- Ling J, Merideth F, Caprihan A, Pena A, Teshiba T, Mayer AR (2012): Head injury of head motion? Assessment and quantification of motion artifacts in diffusion tensor imaging studies. Hum Brain Map 33:50–62. [DOI] [PMC free article] [PubMed] [Google Scholar]
- Martino J, Hamer PC, Berger MS, Lawton MT, Arnold CM, de Lucas EM, Duffau H (2013): Analysis of the subcomponents and cortical terminations of the perisylvian superior longitudinal fasciculus: A fiber dissection and DTI tractography study. Brain Struct Funct 218:105–121. [DOI] [PubMed] [Google Scholar]
- Mohades SG, Struys E, Van Schuerbeek P, Mondt K, Van De Craen P, Luypaert R (2012): DTI reveals structural differences in white matter tracts between bilingual and monolingual children. Brain Res 1435:72–80. [DOI] [PubMed] [Google Scholar]
- Monakow C (1885): Neue experimentelle beiträge zur anatomie der schleife: Vorläufige metteilung. Neurologisches Centralblatt 12:265–268. [Google Scholar]
- Nagy Z, Westerberg H, Klingberg T (2004): Maturation of white matter is associated with the development of cognitive functions during childhood. J Cogn Neurosci 16:1227–1233. [DOI] [PubMed] [Google Scholar]
- Niogi SN, McCandliss BD (2006): Left lateralized white matter microstructure accounts for individual differences in reading ability and disability. Neuropsychologia 44:2178–2188. [DOI] [PubMed] [Google Scholar]
- Odegard TN, Farris EA, Ring J, McColl R, Black J (2009): Brain connectivity in non‐reading impaired children and children diagnosed with developmental dyslexia. Neuropsychologia 47:1972–1977. [DOI] [PubMed] [Google Scholar]
- Pajevic S, Pierpaoli C (1999): Color schemes to represent the orientation of anisotropic tissues from diffusion tensor data: Application to white matter fiber tract mapping in the human brain. Magn Reson Med 42:526–540. [PubMed] [Google Scholar]
- Powell HWR, Parker GJM, Alexander DC, Symms MR, Boulby PA, Wheeler‐Kingshott CAM, Barker GJ, Noppeney U, Koepp MJ, Duncan JS (2006): Hemispheric asymmetries in language‐related pathways: A combined functional MRI and tractography study. Neuroimage 32:388–399. [DOI] [PubMed] [Google Scholar]
- Raffelt D, Tournier JD, Rose S, Ridgway GR, Henderson R, Crozier S, Salvado O, Connelly A (2012): Apparent fibre density: A novel measure for the analysis of diffusion‐weighted magnetic resonance images. Neuroimage 59:3976–3994. [DOI] [PubMed] [Google Scholar]
- Raschle NM, Zuk J, Gaab N (2012): Functional characteristics of developmental dyslexia in left‐hemispheric posterior brain regions predate reading onset. Proc Natl Acad Sci USA 109:2156–2161. [DOI] [PMC free article] [PubMed] [Google Scholar]
- Reil J (1812): Die vördere commisur im groben gehirn. Arch Physiol 11: 89–100. [Google Scholar]
- Richlan F, Kronbichler M, Wimmer H (2009): Functional abnormalities in the dyslexic brain: A quantitative Meta‐analysis of neuroimaging studies. Hum Brain Mapp 30:3299–3308. [DOI] [PMC free article] [PubMed] [Google Scholar]
- Rimrodt SL, Peterson DJ, Denckla MB, Kaufmann WE, Cutting LE (2010): White matter microstructural differences linked to left perisylvian language network in children with dyslexia. Cortex 46:739–749. [DOI] [PMC free article] [PubMed] [Google Scholar]
- Rolheiser T, Stamatakis EA, Tyler LK (2011): Dynamic processing in the human language system: Synergy between the arcuate fascicle and extreme capsule. J Neurosci 31:16949–16957. [DOI] [PMC free article] [PubMed] [Google Scholar]
- Rollins NK, Vachha B, Srinivasan P, Chia J, Pickering J, Hughes CW, Gimi B (2009): Simple developmental dyslexia in children: Alterations in diffusion‐tensor metrics of white matter tracts at 3 T. Radiology 251:882–891. [DOI] [PubMed] [Google Scholar]
- Sandu AL, Specht K, Beneventi H, Lundervold A, Hugdahl K (2008): Sex‐differences in grey‐white matter structure in normal‐reading and dyslexic adolescents. Neurosci Lett 438:80–84. [DOI] [PubMed] [Google Scholar]
- Saygin ZM, Norton ES, Osher DE, Beach SD, Cyr AB, Ozernov‐Palchik O, Yendiki A, Fischl B, Gaab N, Gabrieli JDE (2013): Tracking the roots of reading ability: White matter volume and integrity correlate with phonological awareness in prereading and Early‐reading kindergarten children. J Neurosci 33:13251–13258. [DOI] [PMC free article] [PubMed] [Google Scholar]
- Schlaggar BL, McCandliss BD (2007): Development of neural systems for reading. Annu Rev Neurosci 30:475–503. [DOI] [PubMed] [Google Scholar]
- Schmahmann JD, Pandya DN (2008): Disconnection syndromes of basal ganglia, thalamus, and cerebrocerebellar systems. Cortex 44:1037–1066. [DOI] [PMC free article] [PubMed] [Google Scholar]
- Shaywitz BA (1998): Functional organization of the brain of reading and dyslexia. Biol Psychiat 43:210. 9494703 [Google Scholar]
- Shaywitz BA, Shaywitz SE, Pugh KR, Mencl WE, Fulbright RK, Skudlarski P, Constable RT, Marchione KE, Fletcher JM, Lyon GR, Gore JC (2002): Disruption of posterior brain systems for reading in children with developmental dyslexia. Biol Psychiat 52:101–110. [DOI] [PubMed] [Google Scholar]
- Snowling M (2000): Dyslexia. Oxford, UK: Blackwell. [Google Scholar]
- Steinbrink C, Vogt K, Kastrup A, Müller HP, Juengling FD, Kassubek J, Riecker A (2008): The contribution of white and gray matter differences to developmental dyslexia: Insights from DTI and VBM at. Neuropsychologia 46:3170–3178. [DOI] [PubMed] [Google Scholar]
- Theys C, Wouters J, Ghesquière P (2014): Diffusion tensor imaging and Resting‐state functional MRI‐scanning in 5‐ and 6‐ Year‐old children: Training protocol and motion assessment. PlosOne 9:e94019 [DOI] [PMC free article] [PubMed] [Google Scholar]
- Thiebaut de Schotten M, Cohen L, Amemiya E, Brada LW, Dehaene S (2012): Learning to read improves the structure of the arcuate fasciculus. Cereb Cortex 24:989–995. [DOI] [PubMed] [Google Scholar]
- Torgesen JK (2004): Preventing early reading failure. Am Educ 28. [Google Scholar]
- Tournier JD, Calamante F, Gadian DG, Connelly A (2004): Direct estimation of the fiber orientation density function from diffusion‐weighted MRI data using spherical deconvolution. Neuroimage 23:1176–1185. [DOI] [PubMed] [Google Scholar]
- Tournier JD, Calamante F, Connelly A (2007): Robust determination of the fibre orientation distribution in diffusion MRI: Non‐negativity constrained super‐resolved spherical deconvolution. Neuroimage 35:1459–1472. [DOI] [PubMed] [Google Scholar]
- Tournier JD, Mori S, Leemans A (2011): Diffusion tensor imaging and beyond. Magn Reson Med 65:1532–1556. [DOI] [PMC free article] [PubMed] [Google Scholar]
- Trojsi F, Corbo D, Caiazzo G, Piccirillo G, Monsurrò MR, Cirillo S, Esposito F, Tedeschi G (2013): Motor and extramotor neurodegeneration in amyotrophic lateral sclerosis: A 3T high angular resolution diffusion imaging (HARDI) study. Amyotrophic Lateral Sclerosis and Frontotemporal Degeneration 14:553–561. [DOI] [PubMed] [Google Scholar]
- Tuch DS (2004): Q‐ball imaging. Magn Reson Med 52:1358–1372. [DOI] [PubMed] [Google Scholar]
- van Atteveldt NM, Formisano E, Goebel R, Blomert L (2007): Top‐down task effects overrule automatic multisensory responses to letter‐sound pairs in auditory association cortex. Neuroimage 36:1345–1360. [DOI] [PubMed] [Google Scholar]
- Vandermosten M, Boets B, Poelmans H, Sunaert S, Wouters J, Ghesquiere P (2012a): A tractography study in dyslexia: Neuroanatomic correlates of orthographic, phonological and speech processing. Brain 135:935–948. [DOI] [PubMed] [Google Scholar]
- Vandermosten M, Boets B, Wouters J, Ghesquiere P (2012b): A qualitative and quantitative review of diffusion tensor imaging studies in reading and dyslexia. Neurosci Biobehav R 36:1532–1552. [DOI] [PubMed] [Google Scholar]
- Vandermosten M, Poelmans H, Sunaert S, Ghesquière P, Wouters J (2013): White matter lateralization and interhemispheric coherence to auditory modulations in normal reading and dyslexic adults. Neuropyschologia 51:2087–2099. [DOI] [PubMed] [Google Scholar]
- Vandermosten M, Vanderauwera J, Theys C, De Vos A, Vanvooren S, Sunaert S, Wouters J, Ghesquiére P (2015): A DTI tractography study in pre-readers at risk for dyslexia. Dev Cogn Neurosci (In Press), DOI: 10.1016/j.dcn.2015.05.006 [DOI] [PMC free article] [PubMed] [Google Scholar]
- Vandewalle E, Boets BGP, Zink I (2012): Development of phonological processing skilss in children with specific language impairment with and without literacy delay: a 3‐year longitudinal study. J Speech Lang Hear Res 55:1053–1067. [DOI] [PubMed] [Google Scholar]
- Vellutino FR, Fletcher JM, Snowling MJ, Scanlon DM (2004): Specific reading disability (dyslexia): What have we learned in the past four decades? J Child Psychol Psyc 45:2–40. [DOI] [PubMed] [Google Scholar]
- Verhoeven JS, Rommel N, Prodi E, Leemans A, Zink I, Vandewalle E, Noens I, Wagemans J, Steyaert J, Boets B, Van de Winckel A, De Cock P, Lagae L, Sunaert S (2011): Is there a common neuroanatomical substrate of language deficit between autism spectrum disorder and specific language impairment? Cereb Cortex 22:2263–2271. [DOI] [PubMed] [Google Scholar]
- Vernooij MW, Smits M, Wielopolski PA, Houston GC, Krestin GP, van der Lugt A (2007): Fiber density asymmetry of the arcuate fasciculus in relation to functional hemispheric language lateralization in both right‐ and left‐handed healthy subjects: A combined fMRI and DTI study. Neuroimage 35:1064–1076. [DOI] [PubMed] [Google Scholar]
- Vigneau M, Beaucousin V, Herve PY, Duffau H, Crivello F, Houdé O, Mazoyer B, Tzourio‐Mazoyer N (2006): Meta‐analyzing left hemisphere language areas: Phonology, semantics, and sentence processing. Neuroimage 30:1414–1432. [DOI] [PubMed] [Google Scholar]
- Wagner RK, Torgesen JK (1987): The nature of phonological processing and its causal role in the acquisition of reading skills. Psychol Bull 101:192–212. [Google Scholar]
- Wakana S, Caprihan A, Panzenboeck MM, Fallon JH, Perry M, Gollub RL, Hua K, Zhang J, Jiang H, Dubey P, Blitz A, van Zijl P, Mori S (2007): Reproducibility of quantitative tractography methods applied to cerebral white matter. Neuroimage 36:630–644. [DOI] [PMC free article] [PubMed] [Google Scholar]
- Wandell BA, Yeatman JD (2013): Biological development of reading circuits. Curr Opin Neurobiol 23:261–268. [DOI] [PMC free article] [PubMed] [Google Scholar]
- Wang R, Benner T, Sorensen AG, Wedeen VJ (2007): Diffusion toolkit: A software package for diffusion imaging data processing and tractography. In: 15th Annual Meeting, International Society for Magnetic Resonance in Medicine, Berlin, Germany.
- Wedeen VJ, Hagmann P, Tseng WYI, Reese TG, Weisskoff RM (2005): Mapping complex tissue architecture with diffusion spectrum magnetic resonance imaging. Magn Reson Med 54:1377–1386. [DOI] [PubMed] [Google Scholar]
- Wedeen VJ, Wang RP, Schmahmann JD, Benner T, Tseng WYI, Dai G, Pandya DN, Hagmann P, Arceuil HD, de Crespigny AJ (2008): Diffusion spectrum magnetic resonance imaging (DSI) tractography of crossing fibers. Neuroimage 41:1267–1277. [DOI] [PubMed] [Google Scholar]
- Wernicke C (1874): Der Aphasische Symptomencomplex. Ein psychologische Studie auf anatomischer Basis. Breslau: Cohn and Weigert. [Google Scholar]
- Westerhausen R, Grüner R, Specht K, Hugdahl K (2009): Functional relevance of interindividual differences in temporal lobe callosal pathways: A DTI tractography study. Cereb Cortex 19:1322–1329. [DOI] [PubMed] [Google Scholar]
- Wheeler‐Kingshott CA, Cercignani M (2009): About "axial" and "radial" diffusivities. Magn Reson Med 61:1255–1260. [DOI] [PubMed] [Google Scholar]
- Yeatman JD, Dougherty RF, Rykhlevskaia E, Sherbondy AJ, Deutsch GK, Wandell BA, Ben‐Shachar M (2011): Anatomical properties of the arcuate fasciculus predict phonological and reading skills in children. J Cogn Neurosci 23:3304–3317. [DOI] [PMC free article] [PubMed] [Google Scholar]
- Yeatman JD, Dougherty RF, Ben‐Shachar M, Wandell BA (2012): Development of white matter and reading skills. Proc Natl Acad Sci USA 109:E3045–E3053. [DOI] [PMC free article] [PubMed] [Google Scholar]
- Yeatman JD, Rauschecker AM, Wandell BA (2013): Anatomy of the visual word form area: Adjacent cortical circuits and long‐range white matter connections. Brain Lang 125:146–155. [DOI] [PMC free article] [PubMed] [Google Scholar]
- Zhang J, Evans A, Hermoye L, Lee SK, Wakana S, Zhang W, Donohue P, Miller MI, Huang H, Wang X, van Zijl PC, Mori S (2007): Evidence of slow maturation of the superior longitudinal fasciculus in early childhood by diffusion tensor imaging. Neuroimage 38:239–247. [DOI] [PMC free article] [PubMed] [Google Scholar]