

Abstract
Focusing attention on a target creates a center‐surround inhibition such that distractors located close to the target do not capture attention. Recent research showed that a distractor can break through this surround inhibition when associated with reward. However, the brain basis for this reward‐based attention is unclear. In this fMRI study, we presented a distractor associated with high or low reward at different distances from the target. Behaviorally the low‐reward distractor did not capture attention and thus did not cause interference, whereas the high‐reward distractor captured attention only when located near the target. Neural activity in extrastriate cortex mirrored the behavioral pattern. A comparison between the high‐reward and the low‐reward distractors presented near the target (i.e., reward‐based attention) and a comparison between the high‐reward distractors located near and far from the target (i.e., spatial attention) revealed a common frontoparietal network, including inferior frontal gyrus and inferior parietal sulcus as well as the visual cortex. Reward‐based attention specifically activated the anterior insula (AI). Dynamic causal modelling showed that reward modulated the connectivity from AI to the frontoparietal network but not the connectivity from the frontoparietal network to the visual cortex. Across participants, the reward‐based attentional effect could be predicted both by the activity in AI and by the changes of spontaneous functional connectivity between AI and ventral striatum before and after reward association. These results suggest that AI encodes reward‐based salience and projects it to the stimulus‐driven attentional network, which enables the reward‐associated distractor to break through the surround inhibition in the visual cortex. Hum Brain Mapp 36:5233–5251, 2015. © 2015 Wiley Periodicals, Inc.
Keywords: reward, stimulus‐driven attention, reward‐based attention, anterior insula, fMRI, resting‐state fMRI, dynamic causal modeling
INTRODUCTION
It is commonly assumed that selective attention can be controlled in two different ways: a top‐down way when it is guided by inner goals or expectations and a bottom‐up way when salient stimuli determine selection [Corbetta and Shulman, 2002]. It is thought that two partially segregated neural networks are involved in these two modes of selection: a dorsal network, which consists of frontal eye field and intraparietal sulcus (IPS), controls goal‐directed attention and a ventral network, which consists of inferior frontal cortex and right temporoparietal junction (TPJ), controls stimulus‐driven attention [Corbetta and Shulman, 2002; Corbetta et al., 2000; Downar et al., 2000].
A specific form of stimulus‐driven attention is attentional capture, where a task‐irrelevant distractor involuntarily attracts attention and interferes with target processing [Yantis and Jonides, 1984]. A distractor can capture attention when it bears high perceptual salience [Theeuwes, 1991, 1992] or shares features with the target [Folk et al, 1992]. Recently, it is shown that a physically nonsalient stimulus can also capture attention after it has been associated with reward, demonstrating reward‐based attentional capture [Anderson et al., 2011; Hickey et al, 2010; Wang et al., 2013]. Moreover, this attentional capture induced by reward‐associated stimulus is persistent even when the stimulus no longer predicts any actual reward, i.e., in a no‐reward context [Anderson and Yantis, 2013]. Although behaviorally, reward‐associated stimulus in the no‐reward context captures attention in a similar way as the stimulus‐driven attention, it is unclear whether they rely on the same neural substrates. One possibility is that reward‐based attention is controlled by reward‐related brain structures even when actual reward is no longer paired with the stimulus [Anderson et al., 2014]. The reward‐related brain structures, such as the ventral striatum (VS) and the ventromedial prefrontal cortex [Haber and Knutson, 2010], do not belong to either the goal‐directed or the stimulus‐driven attention system. Alternatively, reward may increase the salience of the stimulus [Berridge and Robinson, 1998; Hickey et al., 2010], which activates the stimulus‐driven attention system when the stimulus is encountered. In this fMRI study, we aimed to address this issue by investigating at the neural level how reward‐associated distractor breaks through a region of inhibition that typically surrounds the target when attention is focused on the target [Cutzu and Tsotsos, 2003; Mounts, 2000a].
When focal attention is directed to a target, an inhibitory region around the target is built up, preventing the distraction from the surround. In a recent study, we demonstrated that a distractor associated with reward can break through this surround inhibition [Wang et al., 2014]. Specifically, we adopted a reward‐learning paradigm in which high or low reward was associated with a specific target color during a learning phase. In a subsequent test phase, the reward‐associated color was presented as one of the task‐irrelevant distractors [cf. Anderson et al., 2011]. More importantly, in the test phase, the high‐ or low‐reward distractor was located at different distances from the target [0.9/2.1/3.3/4.5° in visual angle, Experiment 1 in Wang et al., 2014]. The low‐reward distractor interfered with the discrimination of the target when located adjacent to the target (0.9°) but not when located relatively far from the target (2.1 – 4.5°), whereas the high‐reward distractor caused interference in both near and relatively far locations (0.9° and 2.1°) [Wang et al., 2014]. According to Mounts [2000b], the power of surround inhibition is determined by stimulus intensity, and the strongest inhibition appears at 1.54° from the attended stimulus. In our previous study [Wang et al., 2014], the most adjacent distractor (0.9°) may fall outside the inhibitory region, causing interference in both reward conditions. In this study, we increased the distance (1.6/2.8/4.0°) between the target and the reward‐associated distractor. We predicted that the low‐reward distractor in none of the three distances could cause interference whereas the high‐reward distractor caused interference only when it was presented near the target (1.6°), not when it was far from the target (2.8/4.0°).
The prefrontal cortex and the lateral intraparietal area, the primate homolog of human IPS, have been consistently implicated in reward processing [Leon and Shadlen, 1999; Platt and Glimcher, 1999]. However, it is possible that the activity in these areas reflects attention orienting to, rather than the neural coding of, reward information [Maunsell, 2004]. The current paradigm allowed us to dissociate these two processes. We reasoned that the comparison between high‐ and low‐reward distractors in the near distance reveals the neural basis of reward‐based attention and the comparison between the near and far distances for the high‐reward distractor mainly reveals the neural basis of stimulus‐driven attentional orienting to the reward‐associated distractor. While the stimulus‐driven network would be commonly involved in the two comparisons, the areas reflecting the source of reward‐based salience would only be involved in the former comparison.
The anterior insula (AI) is proposed to be a key node for representing subjective salience, responding to various salient signals irrespective of the modality and the valence of the input signal [Uddin, 2015]. We thus hypothesized that, relative to the low‐reward distractor, the high‐reward distractor will acquire higher salience after the learning phase, and in turn induce stronger activity in AI in the test phase. Moreover, by using dynamic causal modeling (DCM), we were able to investigate the interplay between the reward‐based salience network (AI) and the attentional orienting network.
MATERIALS AND METHODS
Participants
Fourteen right‐handed university students participated in the behavioral experiment (3 females, mean age 23.4 years) and another 19 in the fMRI experiment. Two participants of the fMRI experiment were excluded from data analysis due to excessive head movement (>3 mm), leaving 17 participants (4 females, mean age 21.5 years). They all had normal or corrected‐to‐normal visual acuity. All the participants gave informed written consent in accordance with the Declaration of Helsinki. This study was approved by the Ethics Committee of the Department of Psychology, Peking University.
Design and Procedures
The two experiments had the same design. Each experiment included a learning phase and a test phase in two successive days. In both phases, 16 items (each measured 1.2° × 1.2° in visual angle) were presented at the center of a light gray (gray scale: 204) screen. These items were located on an imaginary circle (7° radius) around the central fixation (a black cross, 0.5° × 0.5°), with equal intervals (1.6°) between each two adjacent items.
In the learning phase, the target was a red or blue circle among the other 15 black circles (Fig. 1A). The target circle appeared randomly at the seven locations in the lower visual field. A black line segment was presented in each of the circles, which was horizontal or vertical in the target circle and titled 45° to the left or the right in the distractor circles. Participants were asked to discriminate the orientation of the line segment in the target circle on each trial by pressing a response button with their index or middle finger. One target color was associated with high reward while the other with low reward, with the assignment counterbalanced over participants. The association of target color with monetary reward was established by presenting a feedback frame indicating the points a participant earned in that trial and the total points accumulated thus far. For a high‐reward target, a correct response was followed by “+10” in the subsequent feedback frame on 80% of the trials, denoting the receipt of 10 points, and was followed by “+1” on the remaining 20% of the trials, denoting the receipt of 1 point. For a low‐reward target, the percentages were reversed. Incorrect responses resulted in “0” and omissions were followed by a word “miss” in the feedback frame. Participants were informed of the conversion rate of the points (one point equaled to ¥0.02, ¥100 ≈ US $16) and were told that the points accumulated during the learning phase would be proportionally exchanged to the final monetary reward and added to their basic payment (¥20 for the behavioral experiment, ¥100 for the fMRI experiment) for taking part in the experiment.
Figure 1.
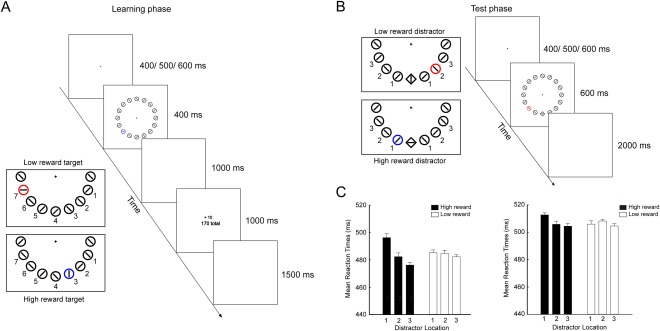
The paradigm and behavioral results of the two experiments. A: In the learning phase, 16 circles were located on an imaginary circle. The target circle was a unique color (red or blue), which was presented at one of the seven locations in the lower visual field (left panel). One of the two target colors was associated with high reward (+ 10) while the other color with low reward (+1). After the button press for judging the orientation of the line segment in the target circle, a feedback frame was presented, indicating the points the participant earned in the current trial and the total points accumulated from the first trial (right panel). B: In the test phase, the participant judged the orientation of the line segment in a diamond among the other 15 circles. The target diamond was always presented at the bottom of the search array (right panel). The color previously associated with high or low reward appeared as the color singleton distractor at one of the three locations around the target, with 0, 1, or 2 intervening distractors between the reward‐associated distractor and the target (left panel). C: Results from the test phase of the behavioral (left panel) and the fMRI (right panel) experiments. Mean Reaction Times (ms) are shown as a function of distractor location for the high‐reward and low‐reward distractors. Error bars denote within‐subject standard errors [Cousineau, 2005].
In the test phase, the target was a black diamond among the other 15 distractor circles. The target diamond was always located at the bottom location of the imaginary circle to facilitate the formation of the inhibition region [Wang et al., 2014]. Each trial had a critical distractor whose color was either associated with high reward or low reward in the learning phase. This critical distractor was located at one of the three possible locations left or right to the target location, with 0, 1, or 2 intervening distractors (1.6/2.8/4.0°) between it (the critical distractor) and the target (Fig. 1B). Therefore, the test phase was a 2 × 3 factorial design: distractor type (high‐ vs. low‐reward) and colored distractor location (1 vs. 2 vs. 3). We did not include a no‐distractor condition in the current design. This was to ensure that the initial attention was on the target, which is necessary for surround inhibition [Cutzu and Tsotsos, 2003; Wang et al., 2014]. Specifically, if a no‐distractor condition is included, whether a particular trial has a singleton distractor will be uncertain. It is thus highly possible that the “abrupt onset” of the distractor, rather than the target, will attract attention first [Yantis and Jonides, 1984, 1990], preventing the buildup of the inhibitory region around the target. For this reason, we followed the “high vs. low reward” design of our previous behavioral study [Wang et al., 2014].
In the behavioral experiment, participants were tested individually in a soundproof and dimly lighted room. They were seated in front of a CRT monitor screen with their head positioned on a chin rest and were required to fixate the central cross throughout each trial. The eye‐to‐monitor distance was fixed at 65 cm. In the fMRI experiment, stimuli were presented through an LCD projector onto a rear screen located behind the participant's head, and the participant viewed the screen via an angled mirror mounted on the head‐coil of the MRI setup.
In both phases, each trial began with the presentation of the central fixation for a varying duration of 400/500/600 ms. In the learning phase, the task frame was then presented and remained on the screen for 400 ms. After a 1000 ms interval of blank screen, the feedback frame was presented and remained on the screen for 1000 ms. The duration of the inter‐trial interval (ITI) was fixed at 1500 ms for the behavioral experiment and was jittered from 1500 to 2500 ms (1500, 2000, and 2500 ms) for the fMRI experiment even though this jittering procedure had no use for our main fMRI data analysis. In the test phase, the task frame was presented for 600 ms after the fixation. There was no feedback following participants' response. The ITI was fixed 2000 ms for the behavioral experiment and was jittered from 3000 to 4000 ms (3000, 3250, 3500, 3750, and 4000 ms) for the fMRI experiment. We did not control the eye movements here because in our previous study we observed similar results, that is, the “breakthrough” effect in the high‐reward vs. low‐reward condition, irrespective of whether eye fixation was controlled [Wang et al., 2014]. These results suggested that eye movements could not be the main cause of the observed “breakthrough” effect.
There were 360 trials for each of the two targets in the learning phase and 60 trials for each condition in the test phase. For the behavioral experiment, trials were divided into 12 blocks of equal length in the learning phase and 6 blocks in the test phase. For the fMRI experiment, trials were divided into three separate scanning runs of equal length in the learning phase and 6 runs in the test phase. Trials of different conditions were equally distributed in each block (run) and were presented in a pseudo‐randomized order, with the restriction that no more than three consecutive trials required the same responses. Participants were instructed to respond as quickly and accurately as possible to maximize their income. Trials with response latency longer than 800 ms in both phases were identified as omissions to encourage performance. Twenty practice trials in which the monetary feedback was replaced by response feedback (correct vs. incorrect) were provided prior to each of the two phases.
For the fMRI experiment, we included a localizer task in a separate scanning session after the test phase to identify each participant's task‐relevant visual areas. Seven circles with line segment inside were presented below the fixation cross (Fig. 2A). The circles had the same size and were located at the exact positions as the target and critical distractor in the test phase. The circles concurrently flickered with a frequency of 1 Hz in a 10‐s block (stimulus‐on block) and lasted for 500 ms each time (500‐ms on and 500‐ms off).
Figure 2.
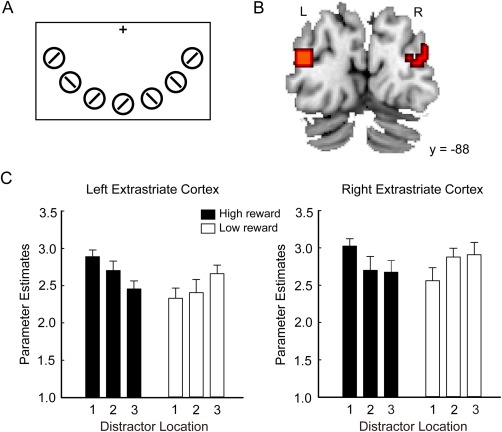
Stimuli and neural results from the localizer task. A: Seven circles flickered in the lower visual field. They were located at the same locations as the target and distractors in the test phase. The task was to detect a color change of the vertical bar of the central fixation. B: Clusters activated in the localizer task (stimulus‐on block vs. stimulus‐off block). Statistical parametric map is shown at the threshold of P < 0.05, FWE‐corrected at voxel level. C: Parameters estimates extracted from a peak voxel in the left and the right extrastriate cortex are shown as the function of the six experimental conditions of the test phase. [Color figure can be viewed in the online issue, which is available at http://wileyonlinelibrary.com.]
The whole scanning session included 6 stimulus‐on blocks alternating with 6 stimulus‐off blocks during which only the fixation cross was presented. In each block, the color of the vertical bar of the fixation cross changed from black to red or green at a randomly selected time point and changed back to black after 500 ms. Participants were asked to discriminate the color of the vertical bar once the color change was detected.
Data Acquisition and Preprocessing
For each participant, imaging data were obtained in two successive days. T2*‐weighted echo‐planar images (EPI) with blood oxygenation level‐dependent (BOLD) contrast was obtained with a research‐dedicated GE MR750 3T scanner (General Electric, Fairfield, Connecticut). Forty transversal slices of 3.1 mm thickness that covered the whole brain were acquired in an interleaved order (repetition time: 2000 ms, echo time: 30 ms, field of view: 200 × 200 mm2, in‐plane resolution: 3.1 × 3.1 mm2, flip angle: 90°).
In the first day, the scanning consisted of two resting‐state sessions and a task session of the learning phase. The two separate runs of resting‐state data, which contained 200 EPI volumes each, were acquired 3 min before (prelearning resting‐state data) and 3 min after (post‐learning resting‐state data) the learning phase, respectively. Spontaneous brain activity recorded in resting‐state fMRI has been demonstrated to be an effective predicator of attentional performances [Carter et al., 2010; Shulman et al., 2009]. In this study, the resting‐state sessions were used to explore whether the learning‐induced changes of spontaneous brain activity could predict the attentional effect in the later test phase. During the resting‐state scanning, participants were asked to close their eyes and keep still, and not to think about anything systematically or fall asleep for 7 min. In the second day, the scanning consisted of a session of the test phase with the main task and a session of the localizer task.
Task fMRI data
Data for the main task in the test phase were preprocessed with Statistical Parametric Mapping software SPM8 (Wellcome Trust Department of Cognitive Neurology, London, UK). For each run, the first five volumes were discarded to allow for T1 equilibration effects. Preprocessing was done with SPM8 default settings. Images from each run were slice time corrected and motion corrected. Different brain tissues (gray matter, white matter, and cerebrospinal signals) were segmented following the standard procedures implemented in SPM8 and were transformed into standard MNI space and resampled to 3 × 3 × 3 mm3 isotropic voxel. The data were then smoothed with a Gaussian kernel of 6 mm full‐width half‐maximum (FWHM) to accommodate inter‐subject anatomical variability.
Resting‐state fMRI data
Similar preprocessing procedures were carried out for the resting‐state data in the learning phase using SPM8 and Data Processing Assistant for Resting‐State fMRI (DPARSF) [Yan and Zang, 2010]. For each of the two sessions, the first five volumes were discarded to allow for T1 equilibration effects. The remaining images were then slice time corrected, motion corrected, and spatially normalized into standard MNI space and resampled to 3 × 3 × 3 mm3 isotropic voxel. After a linear trend of the time courses was removed, the band‐pass filter (0.01–0.1 Hz) was applied to remove low‐frequency drifts and high‐frequency noise. White matter and cerebrospinal signal were extracted using SPM's priori masks implemented in DPARSF. The head motion parameters, mean global signal, white matter signal, and cerebrospinal fluid signal were regressed out.
Statistical Analysis of Behavioral Data
For each experimental condition in the test phrase, omissions, incorrect responses, and trials with RTs ± 3 SDs beyond the mean RT for all the correct trials were first excluded. Mean RT of the remaining trials (95.1% of all the trials in the behavioral experiment and 90.0% in the fMRI experiment) in each condition was then computed. The error rate in each condition was calculated as the proportion of the number of omissions (including the trials in which RT was higher than 800 ms) and incorrect trials against the total number of trials in the condition (Table 1).
Table 1.
Mean reaction times (RTs) and error rates (ER) and within‐participant standard errors (in parenthesis) for each condition in the two experiments
| Reward | Distractor location | Behavioral experiment | fMRI Experiment | ||
|---|---|---|---|---|---|
| RT (ms) | ER (%) | RT (ms) | ER (%) | ||
| High reward | 1 | 494 (3.5) | 5.5 (0.9) | 513 (1.5) | 9.9 (1.2) |
| 2 | 478 (2.7) | 3.8 (0.8) | 506 (2.4) | 9.2 (0.9) | |
| 3 | 474 (2.2) | 3.8 (0.8) | 504 (2.3) | 10.1 (1.2) | |
| Low reward | 1 | 484 (2.3) | 2.9 (0.6) | 506 (1.3) | 10.7 (0.8) |
| 2 | 483 (2.7) | 4.8 (1.1) | 508 (1.9) | 7.7 (0.9) | |
| 3 | 480 (1.8) | 5.2 (0.8) | 505 (1.8) | 10.2 (0.8) | |
We used α = 0.05 as the threshold for statistical significance. However, we observed a few effects that fell between 0.05 < P < 0.1. We chose to report these effects anyway because we believed that they may goad future studies to offer more convincing evidence. To be sure, we limited our reliance on these “marginally significant” effects when making inferences.
Statistical Analysis of Imaging Data
Whole‐brain analysis
The whole brain analysis focused on the main task in the test phase. Data were high pass‐filtered with a cutoff period of 128 s and corrected for serial correlation. We specified a general linear model (GLM) to construct a multiple regression design matrix, with each of the six experimental conditions being modeled as separate regressors: high‐reward distractor at location 1 (H1), high‐reward distractor at location 2 (H2), high‐reward distractor at location 3 (H3), low‐reward distractor at location 1 (L1), low‐reward distractor at location 2 (L2), and low‐reward distractor at location 3 (L3). The six event types were time‐locked to the onset of the task frame, and modeled by a pulse function convolved with a canonical synthetic hemodynamic response function and its time derivatives. To control for any potential confounding effect caused by button press, a parametric modulation regressor of the mean‐corrected RT (mean RT in a specific trial minus mean RT averaged across all trials in an experimental condition) was included for each experimental condition. The six head movement parameters derived from the realignment procedure were also included. The 6 first‐level individual contrast images corresponding to the six conditions were fed to a 2 × 3 within‐subject ANOVA at the second group level by employing a random‐effects model (i.e., the flexible factorial design in SPM8 including an additional factor modeling the subject means). In the modeling of variance components, we allowed for violations of sphericity by modelling nonindependence across parameter estimates from the same participant and allowed for unequal variances between conditions and between participants using the standard implementation in SPM8. We defined two contrasts: “H1 > L1” and “H1 > Mean (H2 + H3).” The former contrast reflected the neural correlates of reward‐based attentional capture and the latter contrast revealed the neural correlates of stimulus‐driven attentional capture. To further investigate the brain‐behavior correlation, a planned t contrast “H1 > L1” was computed with the behavioral interference effect (i.e., RTs at H1 minus RTs at L1) as covariate.
The AFNI program AlphaSim was used to determine our significance criterion. The smoothness was estimated using 6 mm 3dFWHM. Areas of activation were identified as significant only if they passed the threshold of P < 0.005 family wise (FWE)‐corrected at the cluster level, which required 35 contiguous voxels, each voxel significant at P < 0.005 uncorrected (unless otherwise stated) [cf., Lieberman and Cunningham, 2009].
Region of interest (ROI) analysis
Although reward effects have recently been observed over the entire visual cortex [Arsenault et al., 2013], models of visual attention indicates that surround inhibition is formed to suppress the competing neural representations of the distracting objects mainly in the extrastriate cortex [Desimone and Duncan, 1995; Luck et al., 1997]. Evidence from magnetoencephalography studies also showed that the surround inhibition emerges in early to intermediate areas of visual cortex [Boehler et al., 2009; Hopf et al., 2006]. We thus expected that the surround inhibition in the extrastriate cortex should be alleviated for high‐reward distractors as compared with low‐reward distractors. We first identified early visual areas by analyzing the localizer data. Specifically, we defined the contrast corresponding to the effect of “stimulus‐on” block relative to baseline (i.e., “stimulus‐off” block). Given that the localizer contrast revealed the whole visual cortex at the abovementioned threshold, we used instead a more stringent statistical criterion of P < 0.05 FWE‐corrected at voxel level. Areas survived this criterion were mostly located in the extrastriatal cortex (BA19, Fig. 2B). Then we specified another GLM for the test phase, which is similar to the GLM for the whole‐brain analysis except that each of the six conditions was divided into two regressors, depending on the visual field (left vs. right) in which the distractor was presented. Parameter estimates corresponding to the six conditions in the right visual field and the left visual field were respectively extracted from a peak voxel in the left and the right extrastriatal cortex across all participants (left: x = −36, y = −88, z = 16; right: x = 39, y = −76, z = −14). To test whether there was asymmetry of reward effects on the left and the right visual cortex, a 2 (Hemisphere: left vs. right) × 2 (Reward: high vs. low) × 3 (Location: 1, 2 vs. 3) ANOVA was carried out for these parameter estimates.
Dynamic causal modeling
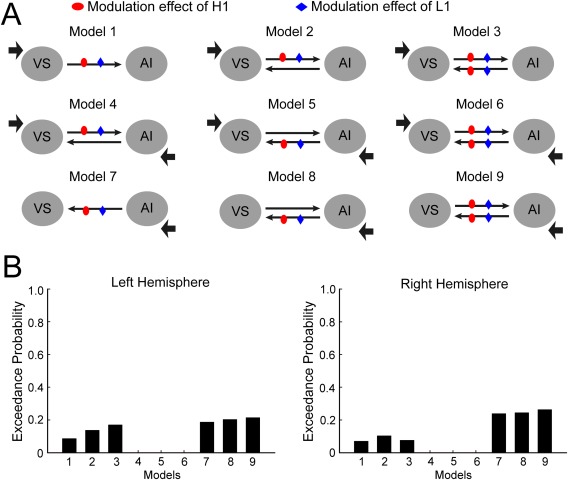
Different models of functional architecture and effective connectivity were compared using DCM10 implemented in SPM8. Here we used bilinear DCM, which consists of three different sets of parameters [Friston et al., 2003]: (1) the “intrinsic” connectivity represents the latent connectivity between brain regions irrespective of experimental conditions; (2) the “modulatory” connectivity represents the influence of experimental conditions on the intrinsic connectivity; and (3) “input” represents the driving influence on brain regions by the experimental conditions. We extracted activation time courses (eigenvariate) from the left AI, the left inferior frontal gyrus (IFG), the left IPS and the left lateral occipital cortex (LOC) in each participant from a 3 mm sphere centered on the group peak coordinates revealed by the contrast “H1 > L1” (see “Results”). The connectivity between IFG/IPS and the visual cortex (LOC in this study) was constructed based on previous models of the stimulus‐driven attentional network [Vossel et al., 2012]. The intrinsic connectivity between AI and IFG/IPS was also specified because of AI's involvement in reward‐based attention and its correlation with the behavioral interference effect (see “Results”). Given the important role of AI in representing stimulus salience [Uddin, 2015], we hypothesized that the reward‐based salience is represented in AI and then projected to the frontoparietal network (IFG and IPS), which in turn modulates the neural activity in LOC. Based on this hypothesis, we constructed 8 model families characterized by three independent factors: the presence or absence of the intrinsic connectivity from LOC to AI, the direction (i.e., bilateral or unilateral) of intrinsic connectivity between AI and the frontoparietal network, and the direction (i.e., bilateral or unilateral) of intrinsic connectivity between the frontoparietal network and LOC (Fig. 4A). AI received the salience input (the reward‐based salience, H1 vs. L1) in all the model families, whereas LOC received the visual input in the model families in which it had influence on other areas. Each model family contained nine single models that share the same driving input and intrinsic connectivities, but differed in the structure of the modulatory connectivity exerted by reward. Table 2 summarized the structure of the modulatory connectivity in the nine models. To test our hypothesis concerning reward‐based attention, only H1 and L1 were included in the modeling. It should be noted that for families containing bilateral intrinsic connectivity, the H1 and L1 conditions were specified to modulate on both directions.
Figure 4.
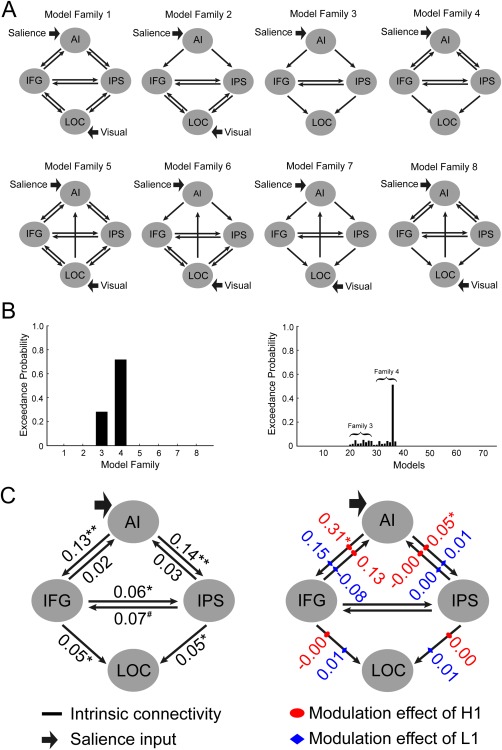
The dynamic causal modeling (DCM) analysis for AI and the fronto‐parietal network. A: The structure of 8 model families (left hemisphere). These model families differed in terms of the presence or absence of the intrinsic connectivity from LOC to AI, the direction of the intrinsic connectivity between AI and IFG/IPS, the direction of the intrinsic connectivity between IFG/IPS and LOC, and the input. Each model family contained nine models, which differed in the specific pathway(s) that modulated by reward (H1 vs. L1, see Table III). B: The exceedance probabilities of the eight model families (left panel) and the single models (right panel). The single models from the eight model families were ordered in consistence with Table III. C: The estimated DCM parameters of the average model of the winning family (* P < 0.05, ** P < 0.01, # P = 0.051). [Color figure can be viewed in the online issue, which is available at http://wileyonlinelibrary.com.]
Table 2.
The structures of the modulatory connectivity in DCM
| Models | 1 | 2 | 3 | 4 | 5 | 6 | 7 | 8 | 9 |
|---|---|---|---|---|---|---|---|---|---|
| AI – IFG | 1 | 1 | 0 | 0 | 0 | 0 | 1 | 1 | 0 |
| AI – IPS | 1 | 1 | 0 | 1 | 1 | 0 | 0 | 0 | 0 |
| IFG ‐ LOC | 1 | 0 | 1 | 0 | 0 | 0 | 1 | 0 | 1 |
| IPS ‐ LOC | 1 | 0 | 1 | 1 | 0 | 1 | 0 | 0 | 0 |
Notes: AI: anteriobr insula; IFG: inferior frontal gyrus; IPS: intraparietal sulcus; LOC: lateral occipital cortex; 1: presence, 0: absence.
These models and model families were then compared using the Bayesian Model Selection (BMS), which uses a Bayesian framework to compute the “model evidence” of each model, representing the trade‐off between model simplicity and model fitness [Penny et al., 2004]. Here, BMS was implemented using random‐effect analysis (i.e., assuming that the model structure may vary across participants) that is robust to the presence of outliers [Stephan et al., 2009]. Based on the estimated model evidence for each model, random effect BMS calculates the exceedance probability, that is, the probability of each model being more likely than any other model. When comparing model families, all models within a family were averaged using Bayesian Model Averaging, and the exceedance probabilities were calculated for each model family [Penny et al., 2010]. Model parameters were estimated based on the averaging of the winning family and were tested with one‐sample t tests.
Resting‐state analysis
According to our hypothesis, the salience of the reward‐associated stimulus was increased after learning. However, given the lack of behavioral differences between high‐ and low‐reward targets in the learning phase, it was not clear when the reward‐based salience was acquired. To overcome this deficit, we took advantage of the resting‐state data and examined whether the functional connectivity (FC) in the post‐learning session could predict participants' interference effect in the test phase. A recent study suggested that the VS, a subcortical area that represents reward value [Sescousse et al., 2010], interacted with the AI in directing attention to reward‐related stimulus [Rothkirch et al., 2014]. We hence expected that the behavioral interference effect could be predicted by FC between VS and AI. The FC analysis was carried out using the Resting‐State fMRI Data Analysis Toolkit (REST; http://www.restfmri.net/) [Song et al., 2011]. The coordinates of the bilateral AI were based on the results of whole‐brain analysis, and the coordinates of the bilateral VS (left: x = −12, y = 9, z = −9; right: x = 9, y = 6, z = −9) were based on a previous study of reward processing [Sescousse et al., 2010]. We created spherical seeds centered on the coordinates of the ROIs with a radius of 6 mm. To produce a participant‐level FC map, we computed the mean time series across all voxels in these areas and performed correlation analysis between the AI and the VS for each participant. These FC maps were then converted to z‐FC maps by conducting Fisher z score transformations. These analyses were performed for both the pre‐learning and the post‐learning data. Next, we performed correlation analysis between the Fisher z scores and participants' interference effect for both the pre‐learning and the post‐learning sessions. Partial correlation was also performed after the Fisher z scores in the pre‐learning session had been controlled. We further calculated the change of FC after learning by subtracting the Fisher z scores in the pre‐learning session from the scores in the post‐learning session and examined correlation between the change of FC and the behavioral interference effect.
RESULTS
Behavioral Data
Given that neither error rates nor RTs in the learning phase showed significant differences between experimental conditions, the following report focuses on RTs and error rates in the test phase (Table 1).
For the behavioral experiment, repeated‐measures analysis of variance (ANOVA) on RTs showed a main effect of location, F (2, 26) = 11.20, P < 0.001, = 0.463, and an interaction between distractor type and location, F (2, 26) = 4.63, P < 0.05, = 0.263, but no main effect of distractor type, F < 1. Separate ANOVAs on the location effect were carried out for the low‐reward and high‐reward distractors, respectively. For the low‐reward distractor, RTs at the three locations (L1: 484 ms, L2: 483 ms, L3: 480 ms) did not differ from each other, F < 1. For the high‐reward distractor, there was a significant location effect, F (2, 26) = 11.74, P < 0.001, = 0.474. Further pairwise comparisons with Bonferroni correction showed that RTs at H1 (494 ms) was longer than RTs at H2 (478 ms) and H3 (474 ms), with no difference between the latter two: H1 vs. H2, P < 0.05, 95% confidence interval (CI) [3.5, 28.8]; H1 vs. H3, P < 0.01, 95% CI [6.9, 33.5]; H2 vs. H3, P > 0.1, 95% CI [−6.1, 14.2]. The interaction between distractor type and location was also examined from the other direction. Paired t tests were carried out for the reward effects at each of the three locations. The results showed that RTs at H1 was longer than RTs at L1, t (13) = 2.14, P = 0.052, 95% CI [−0.1, 20.4], whereas RTs at H2 did not differed from RTs at L2, t (13) = 1.16, P > 0.1, 95% CI [−13.7, 4.2], and RTs at H3 was shorter than RTs at L3, t (13) = 2.52, P < 0.05, 95% CI [−11.6, 0.9] (Fig. 1C, left panel). When the H3 and L3 conditions were excluded, the 2 (Reward: high vs. low) × 2 (Location: 1 vs. 2) ANOVA still showed an interaction between reward type and location, F (1, 13) = 4.72, P < 0.05, = 0.266, indicating that the interaction between reward and location was driven at least partly by the delayed RTs at H1 relative to L1. The ANOVA on error rates showed only a trend of interaction between reward type and location, F (2, 26) = 2.73, P = 0.084, = 0.174. For the low‐reward distractor, there was a marginally significant effect of location, F (2, 26) = 2.61, P = 0.092, = 0.167. Further pairwise comparisons with Bonferroni correction showed that the differences between error rates for the low‐reward distractor at the three locations (L1: 2.9%, L2: 4.8%, L3: 5.2%) did not differ from each other, all P > 0.1, but there was a linear increasing trend from L1 to L2 and to L3, F (1, 13) = 4.76, P < 0.05, = 0.268. For the high‐reward distractor, there was no significant location effect (H1: 5.5%, H2: 3.8%, H3: 3.8%), F (2, 26) = 1.21, P > 0.1. For the reward effect, error rates at H1 was higher than error rates at L1, t (13) = 2.71, P < 0.05, 95% CI [0.6, 5.1], whereas there was no difference between the error rates at H2 and at L2 and between the error rates at H3 and at L3, both P > 0.1, 95% CI [−3.3, 2.6] and [−3.8, 0.7], respectively.
Similar results were obtained in the fMRI experiment. The ANOVA on RTs showed only an interaction between distractor type and location, F (2, 32) = 3.99, P < 0.05, = 0.200, but no main effect of distractor type, F < 1, or location, F (2, 32) = 2.45, P > 0.1. Separate ANOVAs on the location effect showed that there was no significant effect for the low‐reward distractor (L1: 506 ms, L2: 508 ms, L3: 505 ms), F (2, 32) = 1.28, P > 0.1, but an effect for the high‐reward distractor, F (2, 32) = 3.94, P < 0.05, = 0.198. Further pairwise comparison with Bonferroni correction showed that RTs at H1 (513 ms) was longer than RTs at H2 (506 ms), P = 0.069, 95% CI [−0.4, 14.1], and longer than RTs at H3 (504 ms), P = 0.068, 95% CI [0.5, 17.0], with no difference between H2 and H3, P > 0.1, 95% CI [−7.7, 10.5] (Fig. 1C, right panel). For the reward type, there was only a significant difference between H1 and L1, t (16) = 2.89, P < 0.05, 95% CI [1.8, 11.7], but not between H2 and L2 or between H3 and L3, both P > 0.1, 95% CI [−9.1, 4.4] and [−5.8, 5.4]. ANOVA on error rates did not show any significant effects, all P > 0.1.
We noticed that the effects (i.e., H1 > H2, H1 > H3) in terms of RTs, as well as in terms of neural activity in the visual cortex (shown in the imaging data below), were not as strong as in the behavioral experiment, although qualitatively the patterns in the two experiments were similar. This reduction in the effect size may be due to scanner noise, vibration and unfamiliar body gestures in the scanner [cf. Anderson et al., 2014]. We believe that the reduction in RT effect sizes have not significantly undermined our main arguments, for these arguments and most of our analyses of neural data were primarily based on the effects between H1 and L1, which were robust in both the behavioral and the fMRI experiments.
Imaging Data
Reward‐based attentional capture in the visual cortex
We first examined whether the effect of reward‐based attentional capture in the test phase was manifested in visual cortex. Parameters estimates of the six experimental conditions were extracted from the left and the right extrastriate cortex identified in our localizer task. The 2 (Hemisphere: left vs. right) × 2 (Reward: high vs. low) × 3 (Location: 1, 2 vs. 3) ANOVA on the parameter estimates revealed only a significant interaction between reward and location, F (2, 32) = 6.20, P < 0.01, = 0.279. For the low‐reward distractor, the ANOVA on the location effect showed that the neural activity (collapsed across the left and the right extrastriate cortex) at L1, L2, and L3 did not differ from each other, F (2, 32) = 1.99, p > 0.1, but there was a linear trend, F (1, 16) = 4.32, P = 0.054, = 0.213, with the neural activity increasing from L1 to L2 and to L3. For the high‐reward distractor, the location effect was significant, F (2, 32) = 4.05, P < 0.05, = 0.202. Bonferroni‐corrected comparisons showed that the neural activity was higher at H1 than at H3, P < 0.05, 95% CI [0.0, 0.8]. Although the neural activity at H2 did not differ from neural activity at either H1 or H3, P > 0.1, 95% CI [−0.6, 0.1] and [−0.2, 0.5], respectively, there was a linear trend for the three locations, F (1, 16) = 7.18, P < 0.05, = 0.310, with the neural activity decreasing from H1 to H2 and to H3. For the reward type, the neural activity was higher at H1 than at L1, t (16) = 3.84, P < 0.01, 95% CI [0.2, 0.8], whereas there was no difference between H2 and L2 or between H3 and L3, both ps > 0.1, 95% CI [−0.2, 0.3] and [−0.6, 0.1], respectively (Fig. 2C). Brain signals in early visual areas suggested that focusing attention on the target creates a center‐surround inhibition in the visual cortex and reward‐associated stimulus can break through this inhibition.
Identifying neural correlates of reward‐based salience
The contrast of “H1 > Mean (H2 + H3)” revealed the activation of the visual cortex including the left LOC, left middle occipital gyrus (MOG), and a frontoparietal network including the bilateral IFG, the right middle frontal gyrus (MFG) and the bilateral IPS (Table 3 and Fig. 3A). The reversed contrast, that is, “Mean (H2 + H3) > H1”, revealed activations in the posterior cingulate cortex and the right precuneous, and the contrast “L1 > Mean (L2 + L3)” did not show any significant activation. This was consistent with both the behavioral attentional effect and the activity in the visual cortex. The contrast of “H1 > L1” revealed a similar network: the bilateral LOC, the left MOG, the bilateral IFG, and the bilateral IPS. A statistical conjunction analysis [Friston et al., 2005] between the two contrasts confirmed this overlap by revealing the activation of LOC, MOG, IFG, and IPS in the left hemisphere. More importantly, the bilateral AI, the supplementary motor area (SMA) and the left posterior insula (PI) was activated only by the contrast of “H1 > L1”, not by the contrast of “H1 > Mean (H2 + H3)”. These regions could still be observed when the contrast “H1 > L1” was exclusively masked by the contrast “H1 > Mean (H2 + H3)”. The common region of the frontoparietal network thus reflected the neural basis of attentional capture induced by salient stimulus while the specific activation of AI and SMA reflected the neural basis of reward‐based salience. The reversed contrast (“L1 > H1”) revealed only the activation of the right precuneous (Table 3). Given that the SMA is responsible for planning and controlling movement [Nguyen et al., 2014; Picard and Strick, 2003], and the function of PI has been differentiated from AI for its involvement in sensory‐motor processing [Chang et al., 2013], these two areas may only reflect the motor output rather than the source of reward‐based salience. We thus focused on AI, an area has been demonstrated in representing subjective salience [Uddin, 2015], in our following analyses.
Table 3.
Brain areas revealed in the test phase
| MNI coordinates | Cluster | ||||||
|---|---|---|---|---|---|---|---|
| Region | Hemisphere | BA | x | y | z | t value | size |
| “H1 > Mean (H2 + H3)” | |||||||
| IPS | L | 7 | −27 | −67 | 46 | 6.01 | 514 |
| LOC | L | 37 | −45 | −64 | −11 | 4.86 | 92 |
| IFG (Tri.) | R | 45 | 48 | 29 | 19 | 4.34 | 57 |
| MOG | L | 19 | −36 | −85 | 16 | 4.11 | 48 |
| MFG | R | 6 | 30 | 8 | 49 | 4.00 | 91 |
| IFG | L | 44 | −51 | 11 | 31 | 3.94 | 213 |
| IPS | R | 19 | 30 | −61 | 34 | 3.69 | 177 |
| IFG (Oper.) | R | 44 | 48 | 11 | 22 | 3.65 | 48 |
| “H1 > L1” | |||||||
| LOC | L | 37 | −48 | −64 | −11 | 6.56 | 225 |
| IPS | L | 40 | −36 | −46 | 55 | 5.45 | 284 |
| MOG | L | 19 | −33 | −82 | 19 | 4.50 | 112 |
| LOC | R | 20 | 48 | −43 | −26 | 4.13 | 52 |
| SMA | L | 32 | −9 | 14 | 43 | 4.02 | 51 |
| PI | L | 48 | −36 | −22 | 10 | 4.01 | 161 |
| IFG | L | 44 | −51 | 11 | 34 | 3.98 | 283 |
| AI | R | 47 | 27 | 23 | −14 | 3.75 | 107 |
| AI | L | 48 | −27 | 20 | −5 | 3.64 | 41 |
| IPS | R | 7 | 27 | −46 | 43 | 3.58 | 58 |
| “H1 > Mean (H2 + H3)” ∩ “H1 > L1” | |||||||
| IPS | L | 40 | −39 | −43 | 55 | 4.93 | 290 |
| LOC | L | 37 | −45 | −64 | −11 | 4.86 | 78 |
| MOG | L | 19 | −33 | −88 | 16 | 3.90 | 39 |
| IFG | L | 44 | −51 | 11 | 34 | 3.56 | 98 |
| “H1 > H2” masked by “H1 > Mean (H2 + H3)” | |||||||
| LOC | L | 19 | −39 | −82 | −8 | 4.53 | 97 |
| LOC | R | 41 | 48 | −43 | 26 | 4.13 | 52 |
| SMA | L | 32 | −9 | 14 | 43 | 4.02 | 50 |
| PI | L | 48 | −36 | −22 | 10 | 4.01 | 160 |
| PCG | L | 6 | −54 | −4 | 43 | 3.98 | 174 |
| MOG | L | 18 | −27 | −88 | 19 | 3.90 | 50 |
| AI | R | 48 | 27 | 17 | −14 | 3.86 | 67 |
| AI | L | 48 | −27 | 20 | −5 | 3.64 | 41 |
| “Mean (H2 + H3) > H1” | |||||||
| PCC | L/R | 23 | 0 | −46 | 19 | 4.31 | 156 |
| Precuneous | R | 7 | 3 | −76 | 37 | 4.29 | 106 |
| “L1 > H1” | |||||||
| Precuneous | R | 23 | 3 | −40 | 28 | 3.49 | 52 |
Notes: AI: anterior insula; BA: Brodmann's area; IFG: inferior frontal gyrus, IPS: inferior parietal sulcus; LOC: lateral occipital cortex; MFG: middle frontal gyrus; MOG: middle occipital gyrus; Oper.: opercularis; PCC: posterior cingulate cortex; PCG: postcentral gyrus; PI: posterior insula; SMA: supplementary motor area; Tri.: triangularis.
Figure 3.
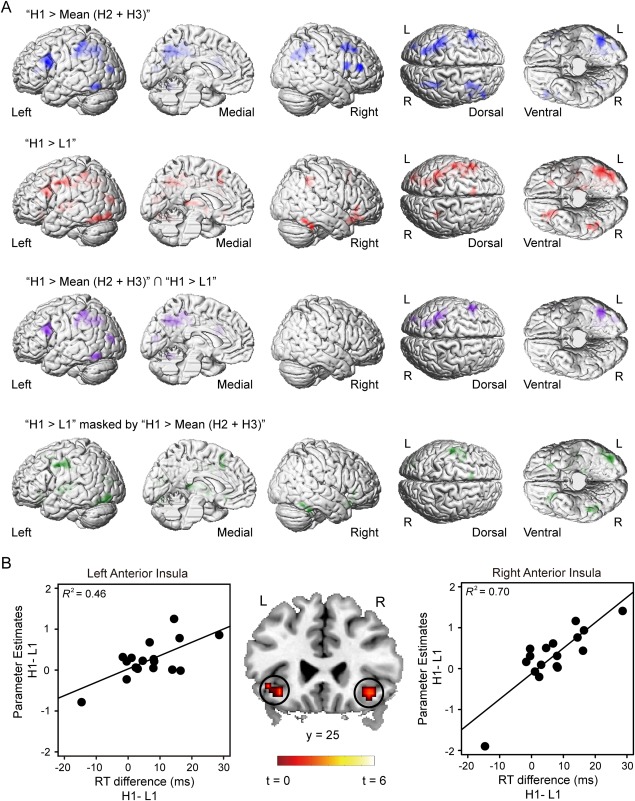
Results of the whole brain analysis for the test phase. A: Blue: the activations revealed by the contrast “H1 > Mean (H2 + H3)”. Red: the activations revealed by the contrast “H1 > L1.” Purple: the common activated regions of the two networks. Green: the brain activations revealed by the contrast “H1 > L1” exclusively masked by the contrast “H1 > Mean (H2 + H3)”. Statistical parametric map was shown at the threshold of P < 0.005 FWE‐corrected at cluster level, P < 0.005 uncorrected at voxel level (H1: high‐reward distractor, location 1; H2: high‐reward distractor, location 2; H3: high‐reward distractor, location 3; L1: low‐reward distractor, location 1). B: AI was activated by the contrast “H1 > L1” when the RT difference between H1 and L1 conditions were included as covariates (middle panel). Parameter estimates were extracted from the two clusters. Scatter plots (with best‐fitting regression lines) illustrates the difference of the parameter estimates between H1 and L1 conditions as a function of the RT difference (left and right panels). In the right panel, the correlation was still significant after the outlier (the bottom left dot) is excluded from the data (R 2 = 0.59). Thus, we keep all the data points in the plot. Note that the bottom left dot in the right panel was identified as the only outlier because the activity strength (the value of parameter estimates) of this dot in the right AI was beyond −3SD of the group mean. No outlier was found in the left panel.
Brain‐behavior correlation
The brain‐behavior correlation contrast did not reveal any significant cluster at the whole‐brain level. However, if we focused on the AI revealed by the above analysis, we did find significant activation foci whose effect size (“H1 > L1”) positively correlated with the RT difference. Specifically, we carried out a small‐volume‐correction (SVC) within a 10 mm‐radius sphere around the peak coordinates of the bilateral AI identified in the whole‐brain contrast (“H1 > L1”). This analysis revealed significant activation foci in both the left (x = −36, y = 23, z = −8, voxel‐level P = 0.072, FWE‐corrected, k = 9) and right AI (x = 36, y = 29, z = −11, voxel‐level P < 0.05, FWE‐corrected, k = 22; Fig. 3B, middle panel). To illustrate the correlation pattern, we extracted parameter estimates from the peak voxels of the bilateral AI identified by the SVC test and plotted it as a function of the behavioral interference effects (RT differences between H1 and L1; Fig. 3B, left and right panel). SVC tests on the other regions (i.e., IFG, IPS, LOC, and SMA) did not reveal any active voxel.
Dynamic casual modeling (DCM)
Figure 4B shows the exceedance probabilities derived from the Bayesian model comparison. The winning model family (Family 4) contained recurrent intrinsic connectivities from AI to IFG/IPS, unidirectional connectivities from IFG/IPS to the LOC, and recurrent connectivities between IFG and IPS. The model parameters estimated based on the average of the wining model family are depicted in Figure 4C. The H1, but not the L1, condition significantly enhanced the connectivities from AI to the frontoparietal network (i.e., IFG and IPS), but not the connectivity from the frontoparietal network to LOC. These results suggested that the reward‐based salience is first represented in AI and then projected to the frontoparietal network.
The same DCM analysis was carried out for the four brain regions (AI, IFG, IPS, and LOC) in the right hemisphere. The results showed that the winning model family for the right hemisphere was the same model family as the left hemisphere, although unfortunately the modulatory connectivity strength did not reach significance. The lack of statistically significance here might be due to the lack of power, as the activation revealed by the contrast “H1 > L1” in the right hemisphere was weaker than in the left hemisphere. Additionally, to examine whether reward system (e.g., the VS) has influences on the salience network (e.g., the AI) during the test phase, we also conducted DCM analyses on the connectivity between VS and AI. The VS was defined in the same way as in the resting state. Nine Models with different intrinsic connectivities and modulatory connectivities were constructed and compared, but no model won in the BMS (Fig. 5). This indicated that the reward system may not be extensively involved in reward‐based attentional capture in the test phase.
Figure 5.
The DCM analysis for AI and VS. A: The structure of 12 models with different intrinsic connectivities and modulatory connectivities. B: The exceedance probabilities of the 12 models in the left (left panel) and the right (right panel) hemisphere. [Color figure can be viewed in the online issue, which is available at http://wileyonlinelibrary.com.]
Learning‐induced changes in spontaneous brain connectivity
For the pre‐learning session, the FC between AI and VS did not correlate with the behavioral interference effect in the test phase, left hemisphere: Pearson r = −0.29, P > 0.1, right hemisphere: r = −0.00, P > 0.1 (Fig. 6A). In contrast, for the postlearning session, there were strong positive correlations between FC and the behavioral interference effect, left hemisphere: r = 0.63, P < 0.01, right hemisphere: r = 0.53, P < 0.05 (Fig. 6B). After FC in the pre‐learning session had been controlled, the partial correlation analysis still showed positive correlations between the behavioral interference effect and FC in the post‐learning session, left hemisphere: r = 0.62, P < 0.05, right hemisphere: r = 0.64, P < 0.01. Moreover, there were also significant positive correlations between the change of FC after learning and the behavioral interference effect, left hemisphere: r = 0.61, P < 0.01, right hemisphere: r = 0.57, P < 0.05 (Fig. 6C). These results suggested that the reward‐based attentional capture in the test phase could be predicted by the spontaneous FC between AI and VS after learning.
Figure 6.
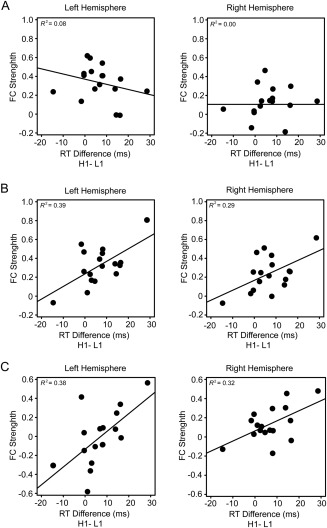
Results of the resting‐state fMRI. Scatter plots (with best‐fitting regression lines) illustrates the FC strength between the AI and the VS in the pre‐learning session (A), post‐learning session (B), and the difference in FC strength between the two sessions (C) as a function of the RT difference between H1 and L1 conditions. Note that for both the behavioral interference effect and the FC strength, all of the individual observations were within ± 3SD of the group mean.
DISCUSSION
In this fMRI study, we investigated the neural mechanism of reward‐based attention by distinguishing reward‐ and attention‐related signals. We found that IFG, IPS, and the visual cortex are commonly activated in reward‐based and stimulus‐driven attention, whereas AI was only activated in reward‐based attention. Reward enhanced the effective connectivity from the salience network (e.g., AI) to the attention network (e.g., IFG/IPS), but not the connectivity from IFG/IPS to the visual cortex. Moreover, the reward‐based attentional effect could be predicted both by the activity in AI and by the spontaneous FC between AI and VS after learning. These results demonstrate the crucial role of AI in instantiating reward‐based attention.
Reward Breaks Through Center‐Surround Inhibition in Visual Cortex
The deployment of attention is manifested as facilitated responses to a target or prolonged disengagement from a distractor, accompanied by increased neural activity in the visual cortex [Desimone and Duncan, 1995]. In this study, relative to the low‐reward distractor, the high‐reward distractor near the target delayed the behavioral response to the target and evoked enhanced neural activity in the visual cortex. These results add to a large body of work that highlights the role of reward in attention deployment [Anderson, 2013; Awh et al., 2012; Chelazzi et al, 2013; Wang et al., 2013] and its modulation in the visual cortex [Anderson et al., 2014; Hickey et al., 2010; Serences, 2008].
Previous studies showed that center‐surround inhibition prevents the object located in this region from capturing attention [Cutzu and Tsotsos, 2003; Mounts, 2000a] and suppresses the representation of such object in the early visual cortex [Boehler et al., 2009; Hopf et al., 2006). In a recent work [Wang et al., 2014], we showed that the low‐reward distractor interfered with the target processing when it was located adjacent to the target (0.9°) but did not cause interference when it was located further away from the target (2.1 – 4.5°). The low‐reward distractor in far distances failed to cause interference as a result of the surround inhibition, which emerged around 1.54° from the target [Mounts, 2000b]. In contrast, the high‐reward distractor caused interference in both near (0.9°) and far locations (2.1°). However, this interaction between reward and location occurred only when attention was initially focused on the target, for example, when the location of the target was highly predictable, but disappeared when there was no initial attention on the target, for example, when the location of the target was unpredictable [Wang et al., 2014]. Given that the initial attention on the target is indispensable for the formation of surround inhibition [Cutzu and Tsotsos, 2003], the interference effect induced by the high‐reward distractor at 2.1° from the target was attributed to a “breakthrough” of the surround inhibition rather than a simple extended interference effect [Wang et al., 2014].
In a similar vein, here we increased the distance (≥ 1.6°) between the target and the distractor to ensure that the reward‐associated distractor fell into this inhibitory region. Results in both the behavioral experiment and the fMRI experiment showed that low‐reward distractors induced comparable RTs when they were located in this inhibitory region, whereas high‐reward distractor induced increased RTs at H1 than at H2 and H3. Moreover, when data from the two experiments were collapsed, Bonferroni corrected comparisons showed that RTs at H1 was longer than RTs in the other conditions (H2, H3, L1, L2, L3), all P < 0.05, whereas RTs in the other conditions did not differ from each other, all P > 0.1 (except for a marginal significance, P = 0.08, when comparing RTs at H3 and L1). These results are consistent with our previous findings [Wang et al., 2014], indicating that only the high‐reward distractor near the target (H1) captured attention and interfered with target processing. At the neural level, the activity in the extrastriate cortex showed a similar pattern, providing new evidence for the argument that reward could break through the center‐surround inhibition [Wang et al., 2014]. In a broader sense, this finding is also in line with the idea that the modulatory effects on visual cortex of top‐down attention and the value of stimuli may engage an overlapping neuronal selection mechanism [Maunsell, 2004; Stanisor et al., 2013].
In this study, despite that the RTs at different locations were comparable for the low‐reward distractors, neural activity in the early visual cortex showed a linear increase with increasing distance from the target, indicating a recovery from surround inhibition. This recovery effect was also reported in previous studies on surround inhibition [Boehler et al., 2009; Hopf et al., 2006]. According to these studies, the surround inhibition manifests near the attentional focus and attenuates with the increasing distance from the attentional focus. For example, Hopf et al. [2006; 2009] showed that only the stimulus adjacent to the attended target (1.35° in visual angle) was suppressed in the early visual cortex and the processing of stimulus in the distant locations (≥2.15°) was recovered, even though RTs did not differ between locations. However, in contrast to a robust recovery in Hopf et al. [2006; 2009], the recovery of the surround inhibition for the low distractor in the current study was relatively weak (only a linear trend from 1.6° to 4°). This discrepancy could be attributed to the difference in stimulus arrays. Distractors were located in a single quadrant of the visual space in previous studies [Boehler et al., 2009; Hopf et al., 2006], but were located in both hemispheres in this study. Given that between‐hemisphere distraction is more easily to inhibit than within‐hemisphere distraction [Alvarez and Cavanagh, 2005; Wei et al., 2013], the inhibitory region across hemispheres might be larger than the region within a hemisphere.
It should be noted that the recovery from surround inhibition in the early visual cortex was observed only for the low‐reward but not for high‐reward distractor. While neural representation for the low‐reward distractor increased linearly from near to far locations, neural representation for the high‐reward distractor did not show this pattern and even decreased from H2 to H3. This asymmetry, together with the shorter RTs at H3 relative to L3 in the behavioral experiment, may indicate that another neural and psychological process was taking effect for the high‐reward distractor, that is, the active suppression of high versus low salient distractor [Geng, 2014]. The active suppression functions to prevent attentional allocation to task‐irrelevant stimulus, especially when this stimulus is characterized with high salience [Geng, 2014; Sawaki et al., 2012]. In this study, because the target location was fixed and a singleton distractor was present in every trial, the active suppression mechanism was triggered to suppress the distractor; this suppression could be more powerful for the distractor with high reward‐based salience compared with the distractor with low reward‐based salience. The electrophysiological index of this active suppression was observed when the reward‐associated distractor was rapidly rejected, demonstrating the active suppression of the reward‐associated distractor [Qi et al., 2013; Sawaki et al., 2015]. Given that the strength of this active suppression is determined by the representational distance between the target and the distractor [Geng, 2014], the distractor located far from the target (H3, H2) is more effectively suppressed than the distractor near the target (H1). In this way, although the distractor at H1 “broke through” the surround inhibition, the distractors at H2 and H3 suffered from active suppression and did not receive adequate representation in the extrastriate cortex.
AI As the Source of Reward‐based Salience in No‐Reward Context
Previous studies did not draw consistent conclusions regarding the neural basis of reward‐based attention. In an event‐related potential study, Hickey et al. [2010] showed that the effect of attentional orienting to reward‐associated stimulus correlated with the amplitude of medial frontal negativity (MFN) that could be localized at the anterior cingulate cortex (ACC). The activity in ACC also correlated with the attentional orienting effect, leading to the argument that reward increases salience by the mediation of ACC. However, given that MFN was locked on the reward feedback, it is not clear whether the activity in ACC reflected the sensitivity to reward feedback [Gehring and Willoughby, 2002; Yu et al., 2011] or the source of reward‐based salience. In this study, no reward was provided during the test phase and any observed activity cannot be attributed to the neural processing of reward feedback. Given that stimulus‐driven attention was dissociated from reward‐based attention, the activity in AI cannot be conceived as controlling attentional orienting, but should be interpreted as representing the salience of the reward‐associated distractor. This notion was confirmed by the DCM that salience (reward magnitude) of the distractor exerted a causal influence on the effective connectivity from AI to IFG/IPS.
AI has been identified to be a critical node of the “salience network”, which detects salient external and interoceptive events/states [Craig, 2009; Seeley et al., 2007; Uddin, 2015]. Consistent with this proposal, AI responds to both reward‐related events [Lee and Shomstein, 2013; Pessoa and Engelmann, 2010] and threatening information [Choi et al., 2012; Dalton et al., 2005]. The activation of AI was also observed in “contingent attentional capture,” where a distractor causes interference when it shares certain features with the target [Serences et al., 2005]. The common engagement of AI in such situations suggests that AI contributes to be a neural site for representing subjective salience acquired in the past selection history [Awh et al., 2012; Uddin, 2015].
In addition to the causal role of AI in projecting subjective salience to the attentional orienting network, the dynamic causal influence of AI on the frontoparietal network was also found in other attentional control tasks. For example, Chen et al. [2015] showed that right AI exerted causal influences on a frontal‐cingulate‐parietal network in integrating signals from visual and auditory modalities. Evidence across different tasks that involve cognitive control demonstrated similar causal interactions from AI to other nodes in the frontal‐cingulate‐parietal network, and the strength of this interaction was modulated by attention demand [Cai et al., 2015]. These results provide convergent evidence for the two‐stage model in which the AI acts as a hub in cognitive control, first detecting events requiring greater access to attentional resources and then triggering the execution of the cognitive control processes [Cai et al., 2015; Menon and Uddin, 2010].
We do not known much about the salience acquisition process and how insula and the dopaminergic reward system interact during this process. Nonetheless, our findings concerning the resting‐state connectivity may provide some hints along this line. We found that the reward‐based attentional effect could be predicted by the changes of spontaneous FC between AI and VS due to learning, suggesting that the reward‐based salience in AI was acquired with the help of VS during learning. Related evidence was observed in an fMRI‐DCM study [Rothkirch et al., 2014] in which reward anticipation in AI was modulated by enhanced effective connectivity from VS. According to the winning model in that study, VS projected reward signals to AI, and the strength of reward transmission from VS to AI was predictive of the degree of attention directed to the reward‐associated stimulus. Along with this finding, our results indicate that AI serves as an interface between the initial reward processing and the further attentional control.
Our results suggest an important role of the reward system, in particular the VS, in acquiring the reward‐based salience in the learning phase, but we did not find its involvement in the test phase. In previous studies on reward‐based attention, the involvement of the reward system was observed within a reward context in which the reward‐associated stimulus predicted actual reward [Hickey and Peelen, 2015; Krebs et al., 2011; Rothkirch et al., 2014]. However, little evidence shows that the reward system is involved in the situation in which the reward‐associated stimulus no longer predicts any reward [MacLean and Giebrecht, 2015; Qi et al., 2013; but see Anderson et al., 2014 for positive evidence]. The conditional interaction between the reward system and the attentional network in the reward context suggests that the reward system might only work to prioritize the reward‐predictive stimulus within a reward context, but not persist to signal the previously reward‐associated stimulus in a no‐reward context. This is in line with a large body of evidence from reinforcement learning studies showing that the VS is more sensitive to associative learning processes rather than reward per se [e.g., Schultz, 2015]. Nevertheless, it is also possible that the dopaminergic reward system does play a role in reward‐based attentional capture, but it is not completely revealed by our experimental design and the current data set. Future studies are needed to investigate whether and how the reward system contributes to the reward‐based attention in the no‐reward context.
Dorsal and Ventral Regions in Reward‐Based Attention
One might argue that the frontoparietal network reported in this study (IFG and IPS) is not the typical ventral network (IFG and TPJ) for stimulus‐driven attention. However, we believe that the IFG‐IPS network observed here was responsible for the stimulus‐driven attention. First, although IPS is part of the dorsal network, which controls goal‐directed attention [Corbetta and Shulman, 2002], its activation is frequently observed in tasks that require stimulus‐driven attention [Serences and Yantis, 2007; Vossel et al., 2009] and contingent attention [Serences et al., 2005]. DCM also documented connectivity between IFG and IPS in stimulus‐driven attention, suggesting that this attention is controlled by the interaction between the dorsal and ventral networks [Vossel et al., 2012]. Second, although TPJ is part of the ventral network, it is not always activated in studies investigating stimulus‐driven attention. For example, Kincade et al. [2005] found that TPJ did not exhibit greater response to salient task‐irrelevant color singleton than to other stimuli. The authors thus claimed that TPJ is involved only in involuntary shift to behaviorally relevant stimuli. A related argument was that a filter determines the input to TPJ and whether a distractor in visual search could pass through this filter depends on whether it meets the definition of the target [Shulman et al., 2003]. It is possible that the task‐irrelevant distractor in this study could not pass through this filter and thus could not activate TPJ.
One might also argue that the attentional network revealed through the distance effect [H1 vs. Mean (H2 + H3)] was not exclusively responsible for stimulus‐driven attention since the stimuli at the three locations were all reward‐related and reward may have differential impacts upon the processing of the stimuli at different locations. Although we could not completely rule out this possibility, we believe that the frontoparietal network revealed in the contrast subserved at least the attentional orienting to the reward‐associated distractor. First, this network accords well with the stimulus‐driven network revealed in previous studies with stimuli presented in a no‐reward context [Vossel et al., 2012]. Second, according to our DCM, the effective connectivity from this network to the visual cortex was not mediated by reward, excluding a role of this network in representing reward information. Last, the involvement of AI in the reward‐based effect but not in the distance effect additionally confirmed the functional dissociation between the frontoparietal network and AI.
CONCLUSION
Our results revealed distinct roles of AI and the stimulus‐driven network in reward‐based attention. Associating rewarding information to a stimulus increases the salience of that stimulus and this reward‐based salience is represented in AI, which projects this information onto the stimulus‐driven attentional network and enables the reward‐associated distractor to break through the center‐surround inhibition in the visual cortex.
ACKNOWLEDGMENTS
The authors thank Dr. Xilin Zhang and Dr. Sheng Li for suggestions concerning the design of the fMRI experiment, and Miss Yunyan Duan and Miss Yiyuan Wang for help with the test of participants. This study was supported by the National Basic Research Program (973 Program: 2015CB856400) from the Ministry of Science and Technology of China. The authors declare no conflict of interest.
REFERENCES
- Alvarez GA, Cavanagh P (2005): Independent resources for attentional tracking in the left and right visual hemifields. Psychol Sci 16:637–643. [DOI] [PubMed] [Google Scholar]
- Anderson BA (2013): A value‐driven mechanism of attentional selection. J Vis 13:7–7. [DOI] [PMC free article] [PubMed] [Google Scholar]
- Anderson BA, Yantis S (2013): Persistence of value‐driven attentional capture. J Exp Psychol Hum Percept Perform 39:6–9. [DOI] [PMC free article] [PubMed] [Google Scholar]
- Anderson BA, Laurent PA, Yantis S (2011): Value‐driven attentional capture. Proc Natl Acad Sci U S A 108:10367–10371. [DOI] [PMC free article] [PubMed] [Google Scholar]
- Anderson BA, Laurent PA, Yantis S (2014): Value‐driven attentional priority signals in human basal ganglia and visual cortex. Brain Res 1587:88–96. [DOI] [PMC free article] [PubMed] [Google Scholar]
- Arsenault JT, Nelissen K, Jarraya B, Vanduffel W (2013): Dopaminergic reward signals selectively decrease fMRI activity in primate visual cortex. Neuron 77:1174–1186. [DOI] [PMC free article] [PubMed] [Google Scholar]
- Awh E, Belopolsky AV, Theeuwes J (2012): Top‐down versus bottom‐up attentional control: A failed theoretical dichotomy. Trends Cogn Sci 16:437–443. [DOI] [PMC free article] [PubMed] [Google Scholar]
- Berridge KC, Robinson TE (1998): What is the role of dopamine in reward: Hedonic impact, reward learning, or incentive salience? Brain Res Rev 28:309–369. [DOI] [PubMed] [Google Scholar]
- Boehler CN, Tsotsos JK, Schoenfeld MA, Heinze HJ, Hopf JM (2009): The center‐surround profile of the focus of attention arises from recurrent processing in visual cortex. Cereb Cortex 19:982–991. [DOI] [PubMed] [Google Scholar]
- Cai W, Chen T, Srikanth R, Kochalka J, Li CR, Menon V (2015): Causal interaction within a frontal‐cingulate‐parietal network during cognitive control: Convergent evidence from a multisite‐multitask investigation. Cereb Cortex, bhv046. [DOI] [PMC free article] [PubMed] [Google Scholar]
- Carter AR, Astafiev SV, Lang CE, Connor LT, Rengachary J, Strube MJ, Pope DL, Shulman GL, Corbetta M (2010): Resting interhemispheric functional magnetic resonance imaging connectivity predicts performance after stroke. Ann Neurol 67:365–375. [DOI] [PMC free article] [PubMed] [Google Scholar]
- Chang LJ, Yarkoni T, Knaw MW, Sanfey AG (2013): Decoding the role of the insula in human cognition: Functuional parcellation and large‐scale reverse inference. Cereb Cortex 23:739–749. [DOI] [PMC free article] [PubMed] [Google Scholar]
- Chelazzi L, Perlato A, Santandrea E, Della Libera C (2013): Rewards teach visual selective attention. Vis Res 85:58–72. [DOI] [PubMed] [Google Scholar]
- Chen T, Michels L, Supekar K, Kochalka J, Ryali S, Menon V (2015): Role of the anterior insular cortex in integrative causal signaling during multisensory auditory‐visual attention. Eur J Neurosci 41:164–274. [DOI] [PMC free article] [PubMed] [Google Scholar]
- Choi JM, Padmala S, Pessoa L (2012): Impact of state anxiety on the interaction between threat monitoring and cognition. Neuroimage 59:1912–1923. [DOI] [PMC free article] [PubMed] [Google Scholar]
- Corbetta M, Shulman GL (2002): Control of goal‐directed and stimulus‐driven attention in the brain. Nat Rev Neurosci 3:201–215. [DOI] [PubMed] [Google Scholar]
- Corbetta M, Kincade JM, Ollinger JM, McAvoy MP, Shulman GL (2000): Voluntary orienting is dissociated from target detection in human posterior parietal cortex. Nat Neurosci 3:292–297. [DOI] [PubMed] [Google Scholar]
- Cousineau D (2005): Confidence intervals in within‐subject designs A simpler solution to Loftus and Masson's method. Tut Quant Meth Psychol 1:42–45. [Google Scholar]
- Craig AD (2009): How do you feel—now? The anterior insula and human awareness. Nat Rev Neurosci 10:59–70. [DOI] [PubMed] [Google Scholar]
- Cutzu F, Tsotsos JK (2003): The selective tuning model of attention: Psychophysical evidence for a suppressive annulus around an attended item. Vis Res 43:205–219. [DOI] [PubMed] [Google Scholar]
- Dalton KM, Kalin NH, Grist TM, Davidson RJ (2005): Neural‐cardiac coupling in threat‐evoked anxiety. J Cogn Neurosci 17:969–980. [DOI] [PubMed] [Google Scholar]
- Desimone R, Duncan J (1995): Neural mechanisms of selective visual attention. Ann Rev Neurosci 18:193–222. [DOI] [PubMed] [Google Scholar]
- Downar J, Crawley AP, Mikulis DJ, Davis KD (2000): A multimodal cortical network for the detection of changes in the sensory environment. Nat Neurosci 3:277–283. [DOI] [PubMed] [Google Scholar]
- Folk CL, Remington RW, Johnston JC (1992): Involuntary covert orienting is contingent on attentional control settings. J Exp Psychol: Hum Percept Perform 18:103047. [PubMed] [Google Scholar]
- Friston KJ, Harrison L, Penny W (2003): Dynamic causal modelling. Neuroimage 19:1273–1302. [DOI] [PubMed] [Google Scholar]
- Friston KJ, Penny WD, Glaser DE (2005): Conjunction revisited. Neuroimage 25:661–667. [DOI] [PubMed] [Google Scholar]
- Gehring WJ, Willoughby AR (2002): The medial frontal cortex and the rapid processing of monetary gains and losses. Science 295:2279–2282. [DOI] [PubMed] [Google Scholar]
- Geng JJ (2014): Attentional mechanisms of distractor suppression. Curr Dir Psychol Sci 23:147–153. [Google Scholar]
- Haber SN, Knutson B (2010): The reward circuit: Linking primate anatomy and human imaging. Neuropsychopharmacology 35:4–26. [DOI] [PMC free article] [PubMed] [Google Scholar]
- Hickey C, Peelen MV (2015): Neural mechanisms of incentive salience in naturalistic human vision. Neuron 85:512–518. [DOI] [PubMed] [Google Scholar]
- Hickey C, Chelazzi L, Theeuwes J (2010): Reward changes salience in human vision via the anterior cingulate. J Neurosci 30:11096–11103. [DOI] [PMC free article] [PubMed] [Google Scholar]
- Hopf JM, Boehler CN, Luck SJ, Tsotsos JK, Heinze HJ, Schoenfeld MA (2006): Direct neurophysiological evidence for spatial suppression surrounding the focus of attention in vision. Proc Natl Acad Sci U S A 103:1053–1058. [DOI] [PMC free article] [PubMed] [Google Scholar]
- Kincade JM, Abrams RA, Astafiev SV, Shulman GL, Corbetta M (2005): An event‐related functional magnetic resonance imaging study of voluntary and stimulus‐driven orienting of attention. J Neurosci 25:4593–4604. [DOI] [PMC free article] [PubMed] [Google Scholar]
- Krebs RM, Boehler CN Egner T, Woldorff (2011): The neural underpinnings of how reward associations can both guide and misguide attention. J Neurosci 31:9752–9759. [DOI] [PMC free article] [PubMed] [Google Scholar]
- Lee J, Shomstein S (2013): The differential effects of reward on space‐ and object‐based attentional allocation. J Neurosci 33:10625–10633. [DOI] [PMC free article] [PubMed] [Google Scholar]
- Leon MI, Shadlen MN (1999): Effect of expected reward magnitude on the response of neurons in the dorsolateral prefrontal cortex of the macaque. Neuron 24:415–425. [DOI] [PubMed] [Google Scholar]
- Lieberman MD, Cunningham WA (2009): Type I and Type II error concerns in fMRI research: re‐balancing the scale. Soc Cogn Affect Neurosci 4:423–428. [DOI] [PMC free article] [PubMed] [Google Scholar]
- Luck SJ, Girelli M, McDermott MT, Ford MA (1997): Bridging the gap between monkey neurophysiology and human perception: an ambiguity resolution theory of visual selective attention. Cogn Psychol 33:64–78. [DOI] [PubMed] [Google Scholar]
- MacLean MH, Giesbrecht B (2015): Neural evidence reveals the rapid effects of reward history on selective attention. Brain Rev 1606:86–94. [DOI] [PubMed] [Google Scholar]
- Maunsell JH (2004): Neuronal representations of cognitive state: Reward or attention? Trends Cogn Sci 8:261–265. [DOI] [PubMed] [Google Scholar]
- Menon V, Uddin LQ (2010): Saliency, switching, attention and control: A network model of insula function. Brain Struct Funct 214:655–667. [DOI] [PMC free article] [PubMed] [Google Scholar]
- Mounts JR (2000a): Attentional capture by abrupt onsets and feature singletons produces inhibitory surrounds. Percept Psychophy 62:1485–1493. [DOI] [PubMed] [Google Scholar]
- Mounts JR (2000b): Evidence for suppressive mechanisms in attentional selection: feature singletons produce inhibitory surrounds. Percept Psychophy 62:969–983. [DOI] [PubMed] [Google Scholar]
- Nguyen VT, Breakspear M, Cunnington R (2014): Reciprocal interactions of the SMA and cingulate cortex sustain premovement activity for voluntary actions. J Neurosci 34:16397–16407. [DOI] [PMC free article] [PubMed] [Google Scholar]
- Penny WD, Stephan KE, Mechelli A, Friston KJ (2004): Comparing dynamic causal models. Neuroimage 22:1157–1172. [DOI] [PubMed] [Google Scholar]
- Penny WD, Stephan KE, Daunizeau J, Rosa MJ, Friston KJ, Schofield TM, Leff AP (2010): Comparing families of dynamic causal models. PLoS Comput Biol 6:e1000709. [DOI] [PMC free article] [PubMed] [Google Scholar]
- Pessoa L, Engelmann JB (2010): Embedding reward signals into perception and cognition. Front Neurosci 4. [DOI] [PMC free article] [PubMed] [Google Scholar]
- Picard N, Strick PL (2003): Activation of the supplementary motor area (SMA) during performance of visually guided movements. Cereb Cortex 13:977–986. [DOI] [PubMed] [Google Scholar]
- Platt ML, Glimcher PW (1999): Neural correlates of decision variables in parietal cortex. Nature 400:233–238. [DOI] [PubMed] [Google Scholar]
- Qi S, Zeng Q, Ding C, Li H (2013): Neural correlates of reward‐driven attentional capture in visual search. Brain Res 1532:32–43. [DOI] [PubMed] [Google Scholar]
- Rothkirch M, Schmack K, Deserno L, Darmohray D, Sterzer P (2014): Attentional modulation of reward processing in the human brain. Hum Brain Mapp 35:3036–3051. [DOI] [PMC free article] [PubMed] [Google Scholar]
- Sawaki R, Geng JJ, Luck SJ (2012): A common neural mechanism for preventing and terminating the allocation of attention. J Neurosci 32:10725–10736. [DOI] [PMC free article] [PubMed] [Google Scholar]
- Sawaki R, Luck SJ, Raymond JE (2015): How attention changes in response to incentives. J Cogn Neurosci 7:1–11. [DOI] [PMC free article] [PubMed] [Google Scholar]
- Schultz W (2015): Neuronal reward and decision signals: from theories to data. Physiol Rev 95:853–951. [DOI] [PMC free article] [PubMed] [Google Scholar]
- Seeley WW, Menon V, Schatzberg AF, Keller J, Glover GH, Kenna H, Reiss AL, Greicius MD (2007): Dissociable intrinsic connectivity networks for salience processing and executive control. J Neurosci 27:2349–2356. [DOI] [PMC free article] [PubMed] [Google Scholar]
- Serences JT (2008): Value‐based modulations in human visual cortex. Neuron 60:1169–1181. [DOI] [PMC free article] [PubMed] [Google Scholar]
- Serences JT, Yantis S (2007): Spatially selective representations of voluntary and stimulus‐driven attentional priority in human occipital, parietal, and frontal cortex. Cereb Cortex 17:284–293. [DOI] [PubMed] [Google Scholar]
- Serences JT, Shomstein S, Leber AB, Golay X, Egeth HE, Yantis S (2005): Coordination of voluntary and stimulus‐driven attentional control in human cortex. Psychol Sci 16:114–122. [DOI] [PubMed] [Google Scholar]
- Sescousse G, Redoute J, Dreher JC (2010): The architecture of reward value coding in the human orbitofrontal cortex. J Neurosci 30:13095–13104. [DOI] [PMC free article] [PubMed] [Google Scholar]
- Shulman GL, McAvoy MP, Cowan MC, Astafiev SV, Tansy AP, d'Avossa G, Corbetta M (2003): Quantitative analysis of attention and detection signals during visual search. J Neurophysiol 90:3384–3397. [DOI] [PubMed] [Google Scholar]
- Shulman GL, Astafiev SV, Franke D, Pope DL, Snyder AZ, McAvoy MP, Corbetta M (2009): Interaction of stimulus‐driven reorienting and expectation in ventral and dorsal frontoparietal and basal ganglia‐cortical networks. J Neurosci 29:4392–4407. [DOI] [PMC free article] [PubMed] [Google Scholar]
- Song X, Dong Z, Long X, Li S, Zuo X, Zhu C, He Y, Yan C, Zang Y (2011): REST: a toolkit for resting‐state functional magnetic resonance imaging data processing. PLoS One 6:e25031. [DOI] [PMC free article] [PubMed] [Google Scholar]
- Stanisor L, van der Togt C, Pennartz CM, Roelfsema PR (2013): A unified selection signal for attenion and reward in primary visual cortex. Proc Natl Acad Sci U S A 110:9136–9141. [DOI] [PMC free article] [PubMed] [Google Scholar]
- Stephan KE, Penny WD, Daunizeau J, Moran RJ, Friston KJ (2009): Bayesian model selection for group studies. Neuroimage 46:1004–1017. [DOI] [PMC free article] [PubMed] [Google Scholar]
- Theeuwes J (1991): Cross‐dimensional perceptual selectivity. Percept Psychophy 50:184–193. [DOI] [PubMed] [Google Scholar]
- Theeuwes J (1992): Perceptual selectivity for color and form. Percept. Psychophy 51:599–606. [DOI] [PubMed] [Google Scholar]
- Uddin LQ (2015): Salience processing and insular function and dysfunction. Nature Rev Neurosci 16:55–61. [DOI] [PubMed] [Google Scholar]
- Vossel S, Weidner R, Thiel CM, Fink GR (2009): What is “odd” in Posner's location‐cueing paradigm? Neural responses to unexpected location and feature changes compared. J Cogn Neurosci 21:30–41. [DOI] [PubMed] [Google Scholar]
- Vossel S, Weidner R, Driver J, Friston KJ, Fink GR (2012): Deconstructing the architecture of dorsal and ventral attention systems with dynamic causal modeling. J Neurosci 32:10637–10648. [DOI] [PMC free article] [PubMed] [Google Scholar]
- Wang L, Yu H, Zhou X (2013): Interaction between value and perceptual salience in value‐driven attentional capture. J Vis 13:5. [DOI] [PubMed] [Google Scholar]
- Wang L, Duan Y, Theeuwes J, Zhou X (2014): Reward breaks through the inhibitory region around attentional focus. J Vis 14:2. [DOI] [PubMed] [Google Scholar]
- Wei P, Kang G, Zhou X (2013): Attentional selection within and across hemispheres: Implications for the perceptual load theory. Exp Brain Res 225:37–45. [DOI] [PubMed] [Google Scholar]
- Yan C, Zang Y (2010): DPARSF: A MATLAB Toolbox for “Pipeline” Data Analysis of Resting‐State fMRI. Front Syst Neurosci 4:13. [DOI] [PMC free article] [PubMed] [Google Scholar]
- Yantis S, Jonides J (1984): Abrupt visual onsets and selective attention: Evidence from visual search. J Exp Psychol Hum Percept Perform 10:601–621. [DOI] [PubMed] [Google Scholar]
- Yantis S, Jonides J (1990): Abrupt visual onset and selective attention: Voluntary versus automatic allocation. J Exp Psychol Hum Percept Perform 16:121–134. [DOI] [PubMed] [Google Scholar]
- Yu R, Zhou W, Zhou X (2011): Rapid processing of both reward probability and reward uncertainty in the human anterior cingulate cortex. PLoS One 6:e29633. [DOI] [PMC free article] [PubMed] [Google Scholar]