

Abstract
Background: Genome‐wide association studies have identified the rs1006737 single nucleotide polymorphism (SNP) in the CACNA1C gene as a susceptibility locus for schizophrenia and bipolar disorder. On the neural systems level this association is explained by altered functioning of the dorsolateral prefrontal cortex (DLPFC) and the hippocampal formation (HF), brain regions also affected by mental illness. In the present study we investigated the association of rs1006737 genotype with prefrontal activation and fronto‐hippocampal connectivity. Methods: We used functional magnetic resonance imaging to measure neural activation during an n‐back working memory task in 94 healthy subjects. All subjects were genotyped for the SNP rs1006737. We tested associations of the rs1006737 genotype with changes in working‐memory‐related DLPFC activation and functional integration using a seed region functional connectivity approach. Results: Rs1006737 genotype was associated with altered right‐hemispheric DLPFC activation. The homozygous A (risk) group showed decreased activation compared to G‐allele carriers. Further, the functional connectivity analysis revealed a positive association of fronto‐hippocampal connectivity with rs1006737 A alleles. Conclusions: We did not replicate the previous findings of increased right DLPFC activation in CACNA1C rs1006737 A homozygotes. In fact, we found the opposite effect, thus questioning prefrontal inefficiency as rs1006737 genotype‐related intermediate phenotype. On the other hand, our results indicate that alterations in the functional coupling between the prefrontal cortex and the medial temporal lobe could represent a neural system phenotype that is mediated by CACNA1C rs1006737 and other genetic susceptibility loci for schizophrenia and bipolar disorder. Hum Brain Mapp 35:1190–1200, 2014. © 2013 Wiley Periodicals, Inc.
Keywords: CACNA1C, rs1006737, working memory, schizophrenia, prefrontal connectivity
INTRODUCTION
The major psychotic disorders, schizophrenia (SCZ) and bipolar disorder (BPD), are among the most heritable common disorders in which the genetic influence may explain up to 85% of the risk [Smoller et al., 2003]. Their aetiology is complex, involving multiple genetic and environmental influences [Craddock and Sklar, 2009]. Several genome‐wide association (GWASs) and case control studies have identified the single nucleotide polymorphism (SNP) rs1006737 (minor allele in the European Caucasian population: Adenine) of the CACNA1C (alpha 1C subunit of the L‐type voltage‐gated calcium channel) gene as a susceptibility locus for both BPD and SCZ [Bigos et al., 2010; Ferreira et al., 2008; Green et al. 2010; Nyegaard et al., 2010; Sklar et al., 2008; WTCCC, 2007]. Whereas the association of the rs1006737 with BPD has been well established in GWASs [odds ratio (OR) = 1.18, Ferreira et al., 2008], only recently several case control studies have indicated an association with SCZ as well [OR = 1.77, P < 0.03, Bigos et al., 2010, OR = 1.15, P < 0.034, Green et al., 2010; OR = 1.16, P < 0.015, Nyegaard et al., 2010]. A similar genetic overlap across traditional diagnostic boundaries had also been reported for other risk genes [e.g., ZNF804A, NRGN, c.f. Lee et al., 2012], supporting the hypothesis that both disorders share some of their etiological background. While it is yet unclear whether the intronic SNP rs1006737 is itself functional, there is evidence for a risk (A) allele associated increase in CACNA1C mRNA expression that might affect calcium channel activity [Bigos et al., 2010].
The clinical phenotypes BPD and SCZ have been repeatedly associated with impairments in cognitive functions. Particularly deficits in working memory play a central role in SCZ [Daban et al., 2005; Glahn et al., 2003; Silver et al., 2003], but have also been reported on in patients with BPD [Ferrier et al., 1999; McGrath et al., 2001; Sweeney et al., 2000]. Comparable deficits were also found in unaffected first‐degree relatives of patients with SCZ [Barrantes‐Vidal et al., 2007; Ma et al., 2007] and BPD [Antila et al., 2009; Arts et al., 2008], indicating heritable components of the impairments in the working memory domain. A recent study could relate these working memory deficits to genetic variation in CACNA1C [Zhang et al., 2012]. The authors showed that the rs1006737 A allele was associated with reduced working memory performance both in patients with SCZ and healthy controls. Within the BPD group, however, these effects were non‐significant or inverse which suggests potentially different effects of rs1006737 genotype in both disorders.
A recent imaging genetics study investigated the influence of rs1006737 genotype on the neural correlates of working memory [Bigos et al., 2010]. Using an n‐back task, Bigos et al. found that A homozygotes had stronger brain activity in the right dorsolateral prefrontal cortex (DLPFC), a brain region that is thought to maintain the active representation of stimuli over short periods of time during working memory execution [Courtney et al., 1998]. Comparable patterns of “inefficient” prefrontal engagement were also found in siblings of patients with SCZ [Callicott et al., 2003; Rasetti et al., 2012] and in association with other putative SCZ risk genes [e.g. Mier et al., 2010], thus characterizing a potential neural system phenotype which links genetic risk to the clinical diagnoses. Up to now, the specific rs1006737 genotype related alterations in prefrontal circuitries, however, have not yet been confirmed in an independent sample. Though effect sizes found in single studies might suggest strong effects of rs1006737 on brain function [Bigos et al., 2010; p. 944], one major step toward validating this intermediate phenotype is its reproduction across independent samples. In the long run, such efforts would also provide appropriate estimates of population effects of the rs1006737 genotype on the level of neural systems [Munafo and Flint, 2004; Munafo et al., 2008]. The first aim of the present study was therefore to confirm the recent findings of increased activity within the right DLPFC during working memory task execution in the homozygote A group.
The dysconnectivity hypothesis of SCZ suggests that the disorder is not caused by focal brain abnormalities, but that its core symptoms rather result from pathological interactions between brain systems [Stephan et al., 2009; Wernicke 2008]. In accordance, several functional imaging studies revealed disturbed connectivity patterns in complex prefrontal, hippocampal, and cerebellar‐thalamic‐prefrontal networks [Schmitt et al., 2011]. Aberrant connectivity, however, is not a unique feature of SCZ but has also been related to BPD [Pettersson‐Yeo et al., 2011]. These alterations in the neural system's functional organization may provide further clues to elucidate the effects of rs1006737 genotype in the working memory domain. The connectivity of the DLPFC represents a particular promising target for these efforts, since it has been found to be affected both in patients with SCZ and in subjects at high genetic risk [Meyer‐Lindenberg et al., 2005; Rasetti et al., 2011; Schlösser et al., 2003a, 2011]. In the context of working memory execution the DLPFC showed abnormal functional interactions with prefrontal circuitries [Schlösser et al., 2003a, 2011] and especially with the hippocampal formation [HF, Meyer‐Lindenberg et al., 2005; Rasetti et al., 2011]. Notably, these alterations in fronto‐hippocampal connectivity have also been documented for two genetic susceptibility loci that are associated with BPD and/or SCZ, the rs1344760 in ZNF804A [Esslinger et al., 2009; Paulus et al., in press] and COMT val158met [Bertolino et al., 2006]. Even though the hippocampus has predominantly been discussed in context of long‐term memory formation, its common signal oscillations with prefrontal areas have been associated with working memory maintenance as demonstrated in a combined analysis of electroencephalography and diffusion tensor imaging data [Cohen, 2011]. Changes in the prefrontal‐hippocampal coupling thus have the potential to describe neural system mechanisms that link genetic variation to working memory performance and the development of psychosis [Meyer‐Lindenberg, 2010]. In case of the rs1006737 in CACNA1C, a recent imaging study already provided first indications for healthy carriers of the A allele to have aberrant connectivity in the HFs [Erk et al., 2010]. Together with the increased attention for neural system connectivity features in imaging genetics [Meyer‐Lindenberg, 2009; Tost et al., 2012], this study supports the notion that disturbances in fronto‐hippocampal connectivity might represent a more generalizable neural system phenotype that is also related to genetic variation in CACNA1C. The second aim of this study was therefore to investigate the rs1006737 genotype‐dependent alterations in the neural systems functional integration of the DLPFC with a focus on the fronto‐hippocampal connectivity.
In summary, the present study served two purposes. The first was to analyze the effects of rs1006737 genotype on neural activation in the right DLPFC to replicate previous indications for inefficient working memory‐related prefrontal engagement [Bigos et al., 2010]. The second purpose was to examine the functional connectivity of the right DLPFC and characterize rs1006737 genotype‐dependent alterations in prefrontal coupling, both, within the DLPFCs and with the HFs. To do so, we measured neural activity—as assessed by fMRI—in a large sample of healthy subjects using an established n‐back paradigm [Jansen et al., 2009; Markov et al., 2010].
MATERIAL AND METHODS
Subjects
As part of a study on the genetic basis of SCZ and BPD, 94 healthy subjects were included in the present study. They were recruited through advertisements in local newspapers and postings at the campus of the University of Aachen. Inclusion criteria were age (18–55 years), right‐handedness (as assessed by the Edinburgh Inventory, [Oldfield, 1971]), no psychiatric disorders according to ICD‐10, no family history of SCZ or BPD, and Western‐ or Middle European descent. Psychiatric disorders and ancestry were assessed up to the grandparent generation with a semistructured interview which was designed for the purpose of this study. The interview included open and closed questions about the known presence of psychiatric conditions in family history and the Western‐ or Middle European descent of the ancestors. Participants also underwent neuropsychological assessment prior to scanning and completed the Schizotypal Personality Questionnaire Brief [SPQB, Raine and Benishay, 1995, see Supporting Information Table SII for results]. Sample characteristics are presented in Table 1. Participants gave written informed consent and the study protocol was approved by the local ethics committee according to the declaration of Helsinki.
Table 1.
Sample characteristics
| rs1006737 genotype | P | |||
|---|---|---|---|---|
| GG (n = 43) | GA (n = 39) | AA (n = 12) | ||
| Sex ratio (m/f) | 35/8 | 25/14 | 6/6 | 0.059a |
| Age (years) | 23.4 ± 3.3 | 23.0 ± 2.8 | 23 ± 1.0 | 0.785b |
| Education (years) | 15.9 ± 2.8 | 15.3 ± 2.5 | 15.8 ± 1.6 | 0.624b |
Pearson chi‐square for differences in frequencies.
One‐way ANOVA for mean differences. Subjects were divided into three groups according to their rs1006737 genotype. A = risk allele.
Genetic Analysis
Genomic DNA was extracted from ethylenediaminetetraacetic acid (EDTA) anticoagulated venous blood according to standard procedures. The SNP rs1006737 was genotyped on an Applied Biosystems 7900HT Fast Real‐Time PCR System, using a TaqMan 5′ nuclease assay (TaqMan® SNP Genotyping Assay ID C_2584015_10; Applied Biosystems). Genotyping accuracy was assessed by running 15% of the sample in duplicates. Reproducibility was 100%. Forty‐three subjects were rs1006737 homozygote G, 39 heterozygote GA, and 12 homozygote A. The distribution of the different allelic variants did not significantly deviate from the Hardy–Weinberg equilibrium in the present sample, P = 0.493 [estimated according to the procedure described in Wigginton et al., 2005] and the frequency of the A allele (33.51%)—which is associated with increased risk for psychosis—was in a similar range as previously reported in association studies [e.g., 33% Green et al., 2010 and 33.28% Nyegaard et al., 2010]. Rs1006737 genotype groups did not significantly differ with regards to age and education, Fs(2,91) < 0.47, Ps > 0.624 (Table 1). However, we found a trend for differences in frequencies of female and male participants X2(2) = 5.6, P = 0.059, which was significant if tested for a linear association with the rs1006737 genotype (GG < GA < AA), X2(1) = 5.53, P < 0.022. Participants' sex was therefore controlled for and introduced as covariate in the random‐effects models of the fMRI data analyses.
FMRI Paradigm and Behavioral Data
Working memory was assessed by a letter variant of the n‐back task previously applied in imaging genetics [Jansen et al., 2009; Paulus et al., in press] with letter fixation as a high‐level baseline, 0‐back, and 2‐back. In each condition, pseudo‐randomized sequences of 19 red Latin letters were presented on a black background using the Presentation software package (Neurobehavioral Systems, San Francisco, CA). During 0‐back, responses were required for the target letter “X”; in the 2‐back condition, target letters were defined as all letters which were identical to the one presented two steps before. Responses were made with the right index finger on a response button (LUMItouch™ Lightwave Technologies, Richmond, B.C., Canada). However, due to irregularities in the data recordings, behavioral responses of 13 subjects had to be excluded from the analyses of behavioral data. During each non‐baseline block, seven targets required a response (target rate = 0.37). Each letter presentation trial consisted of a blank screen which was presented for 500 ms, followed by the letter presentation for 500 ms and a blank screen for 400 ms. In all three conditions the blocks lasted 27.4 s. The instruction screens announcing the next condition were presented for 2.1 s. Four 0‐back blocks (selective attention) were alternated with four 2‐back blocks (working memory) with eight baseline blocks (letter fixation) in between conditions. Including an initial pause of 6.8 s, the whole fMRI task lasted 8.13 min. Subjects were thoroughly instructed prior to the scanning procedure. Detailed descriptions of the experimental timing and stimulus presentation have been provided elsewhere [Paulus et al., in press].
Behavioral data were analyzed within the subsample of 81 subjects for which valid response data were accessible. Hits, misses, false alarms, and reaction times were each examined for effects of rs1006737 genotype on performance. Further, A′ was computed as non‐parametric measure of participants' sensitivity to detect the targets [Grier, 1971] in the 2‐back and 0‐back condition. Rs1006737 genotype effects were assessed with (i) an additive genetic model with the number of rs1006737 A alleles encoding gene‐dosage effects in a linear regression and (ii) an ANOVA to examine the variance between rs1006737 genotype groups.
MRI Data Acquisition
Data were acquired on a 3‐Tesla TIM‐Trio MR scanner (Siemens Medical Systems) at the Forschungszentrum Jülich. Functional images were collected with a T2*‐weighted echo planar imaging (EPI) sequence sensitive to BOLD contrast (64 × 64 matrix, FOV 200 mm, in plane resolution 3.13 mm, 36 slices, slice thickness 3 mm, TR = 2.25 s, TE = 30 ms, flip angle 90°). Slices covered the whole brain and were positioned transaxially parallel to the anterior‐posterior commissural line. Two hundred and seventeen functional images were collected, and the initial three images were excluded from further analysis to remove the influence of T1 saturation effects.
FMRI Data Analyses
SPM5 (http://www.fil.ion.ucl.ac.uk/spm) standard routines and templates were used for the fMRI data analysis. After slice‐timing, functional images were realigned, normalized (resulting voxel size 2 × 2 × 2 mm3), smoothed (8‐mm isotropic Gaussian filter), and high‐pass filtered (cut‐off period 128 s). The preprocessed images were statistically analyzed for rs1006737 genotype related (i) neural activation and (ii) functional connectivity of the right DLPFC in a two‐level, mixed effects procedure.
Working‐memory‐related neural activation
To identify task‐related hemodynamic responses on the subject‐level, a fixed‐effect general linear model (GLM) included three epoch regressors, modeling the 2‐back condition, the 0‐back condition, and the instructions, as well as six regressors modeling head movement parameters. Parameter estimate (ß‐) and t‐statistic images were calculated for each subject. Rs1006737 gene‐dosage effects were tested in an additive genetic model with the number of rs1006737 A alleles as covariate of interest. To replicate the results of Bigos et al., we additionally modeled a recessive, risk‐associated comparison using a two‐sample t‐test (AA vs AG + GG). Both models included participants' sex as covariate of no interest. To test our prior hypothesis, we conducted a region of interest (ROI) analysis with smoothed masks (9 mm) of the right DLPFC (BA9 and the lateral sections of BA46, see [Esslinger et al., 2009; Paulus et al., in press] created with the Marina toolbox (http://www.bion.de). ROI analyses were calculated with the Wake Forest University (WFU) PickAtlas (http://www.fmri.wfubmc.edu) toolbox as implemented in SPM 5. All results were controlled for false positive findings according to Gaussian random field theory as implemented in SPM5 with a thresholded of P < 0.05. Locations of activation maxima are reported as MNI‐coordinates [Brett et al., 2002].
To explore the blood oxygen level dependent (BOLD) effect at the time resolution of one TR (2.25 s), we also fitted a finite impulse response (FIR) model during the 2‐back and 0‐back conditions. On the individual subject level, 18 bins of the length of one TR were modeled in a time window of 40.5 s at the onset of the 0‐back and 2‐back instructions, respectively. Resulting images for each individual and time bin were entered in random‐effects GLM with the repeated factor coding the 18 different levels in the time domain and rs1006737 genotype as between‐subject factor.
Functional connectivity analysis
For the analysis of functional connectivity, we applied a seed region approach, analogous to the procedure described previously [Esslinger et al., 2009; Paulus et al., in press]. Accordingly, the right DLPFC was selected as the seed region. To determine seed voxels located within the right DLPFC, we constrained the search space to a right DLPFC mask. Starting at the peak activation at the group level at MNI‐coordinates 52, 30, 30 mm, we identified the next local maximum within each subject for the 2‐back vs. 0‐back contrast at P < 0.01 uncorrected. Additionally, we limited the next local maximum to clusters extending 20 voxels. One subject (GG) did not show DLPFC activation within this cluster at this threshold and was therefore excluded from the connectivity analysis. Seed time‐series were extracted as the first eigenvariate in a sphere of 6 mm radius as implemented in SPM5. Task‐related variance was removed by applying an effects‐of‐interest correction with the F‐contrast set on the six movement parameters [Esslinger et al., 2009]. The seed regions' location in the right DLPFC approximated normal distribution with the center of the seed time series at 49.2, 30.8, 29.2 mm. Notably, we observed a trend for differences in seed region allocation along the y‐dimension between rs1006737 genotype groups, F(2, 90) = 2.96, P = 0.057, which was significant if tested for a linear association with the rs1006737 genotype (GG < GA < AA), r = 0.24, P = 0.023 (GG: M = 29.2, SD = 6.51; GA: M = 32.00, SD = 5.2, AA: M = 32.67, SD = 5.80). Effects were less strong and non‐significant in the x‐, F(2, 90) = 0.55, P = 0.578, and z‐dimension F(2, 90) = 1.92, P = 0.152. To account for noise, two additional time‐series were extracted for each subject from the first eigenvariates of all voxels within masks [Esslinger et al., 2009] covering medial cerebrospinal fluid regions (CSF) or white matter (WM) at P < 0.99.
The fixed‐effects GLM on the subject‐level included the extracted seed time series of the right DLPFC, the two WM and CSF noise regressors, one regressor modeling the instruction period and six regressors modeling head movement parameters. Regressors for the 2‐back and 0‐back conditions explained variance due to hemodynamic responses induced by the experimental task. Parameters of the GLM were calculated for each subject and the ß‐maps of the DLPFC seed time series (connectivity maps) were analyzed at the group‐level. Rs1006737 gene‐dosage effects were tested with the number of rs1006737 A alleles (GG < GA < AA) as covariate in a linear regression model similar to previous studies [Esslinger et al., 2009, 2011; Paulus, et al., in press1]. Participants' sex and individual seed region location in the x, y, and z dimensions in MNI space [see Bedenbender et al., 2011] were entered as covariate of no interest. To test our prior hypotheses, we conducted ROI analyses within the DLPFCs and the HFs. Results were thresholded following the same procedure as described above for the analysis of activation differences.
RESULTS
Behavioral Data
Overall, response times, amount of misses, and false alarms were significantly higher in the 2‐back condition compared to the 0‐back condition, ts(80) > 3.22, Ps < 0.002, and amount of hits were significantly lower, t(80) = 7.52, P < 0.001. Accordingly, the sensitivity to detect the target—as indicated by A′—significantly declined in the 2‐back condition (M = 0.97, SD = 0.05) compared to 0‐back (M = 0.99, SD = 0.01), t (80) = 5.61, P < 0.001. However, the hit rate of above 91% (SD = 0.10) in the 2‐back condition and above 99% (SD = 0.02) in the 0‐back condition indicated a generally high‐level of performance.
The additive regression model showed no significant association of rs1006737 genotype with any measure of n‐back task performance (all Ps > 0.405). Similarly, hits, misses, false alarms, and reaction times during the 2‐back and 0‐back condition did not significantly differ with rs1006737 genotype in the ANOVA model, Fs(2,78) < 3.00, all Ps > 0.056. The potential trend toward differences in N‐back performance (2‐back hits and misses, see Table 2 for detailed description of subjects' performance) was not gene‐dose dependent and exclusively driven by the heterozygous group that showed slightly fewer 2‐back hits and greater 2‐back misses than both homozygous groups. This trend did not surface in the analysis of participants' sensitivity to detect the target as measured with A′, which did not differ across rs1006737 genotype groups, even at trend level (F(2,78) < 1.89, P = 0.158).
Table 2.
N‐back performance
| rs1006737 genotype | P# | P§ | |||
|---|---|---|---|---|---|
| GG (n = 35) | GA (n = 37) | AA (n = 9) | |||
| N‐back performance | |||||
| 2‐back A′ | 0.971 ± 0.029 | 0.957 ± 0.061 | 0.987 ± 0.014 | 0.946 | 0.158 |
| 2‐back hits | 26.0 ± 1.7 | 24.9 ± 3.6 | 27.0 ± 0.9 | 0.923 | 0.056 |
| 2‐back misses | 2.0 ± 1.7 | 3.1 ± 3.6 | 1.0 ± 0.9 | 0.923 | 0.056 |
| 2‐back false alarms | 1.0 ± 1.4 | 1.0 ± 1.4 | 0.4 ± 1.7 | 0.414 | 0.520 |
| 2‐back reaction times | 444.0 ± 45.8 | 444.0 ± 77.0 | 417.1 ± 60.0 | 0.405 | 0.494 |
| 0‐back A′ | 0.995 ± 0.008 | 0.993 ± 0.010 | 0.998 ± 0.004 | 0.793 | 0.324 |
| 0‐back hits | 27.9 ± 0.2 | 27.7 ± 0.7 | 28 ± 0.0 | 0.519 | 0.101 |
| 0‐back misses | 0.1 ± 0.2 | 0.2 ± 0.6 | 0.0 ± 0.0 | 0.587 | 0.158 |
| 0‐back false alarms | 0.5 ± 0.7 | 0.5 ± 0.7 | 0.2 ± 0.4 | 0.393 | 0.572 |
| 0‐back reaction times | 381.7 ± 41.5 | 385.3 ± 53.8 | 359.6 ± 13.0 | 0.425 | 0.324 |
Note: Each cell contains averages with standard deviations. Reaction times are displayed in ms. Behavioral data were analyzed using (#) an additive regression model with the number of A alleles coding gene‐dosage effects (GG < GA < AA) and (§) an univariate ANOVA design with rs1006737 genotype (GG, GA, and AA) as a between‐subject factor and working‐memory‐task performance as dependent variables. Valid behavioral data were available for a subset of n = 81 subjects.
Data on the neuropsychological assessments showed no significant group differences and no gene‐dosage dependent association with rs1006737 genotype (see Supporting Information Table SI).
FMRI Data
Analysis of activation differences
First, we determined the effect of rs1006737 genotype on working memory related neural activation (2‐back > 0‐back). The additive genetic model indicated a significant effect of rs1006737 genotype on brain activity in the right DLPFC at 54, 10, 38, F(1,91) = 17.80, P < 0.037, corrected. The post‐hoc analysis showed that the effect was characterized by weaker prefrontal activation with increasing number of A alleles (AA < GA < GG, t(91) = 4.22, P < 0.019, corrected). The two‐sample t‐test (AA vs. AG + GG), additionally performed to reproduce the results of Bigos et al., confirmed the results obtained with the additive genetic model showing that the decrease was mainly driven by the group that was homozygous for the A allele. This group showed significantly less working memory related brain activity compared to G‐allele carriers in the right DLPFC at 54, 10, 40, t(91) = 4.67, P < 0.004, corrected (see Fig. 1A,B). After controlling for working‐memory performance using A′ in the subsample of subjects for which valid behavioral data were available, the reduced activation remained statistically significant with t(76) = 3.91, P < 0.048, corrected. Also, the inclusion of participants' age as additional covariate in the random‐effects analyses did not change the results for both the additive genetic model and the two‐sample t‐test. Second, to examine the unexpected direction of the DLPFC activation differences, we explored the BOLD response at a time resolution of one TR (2.25 s) using a FIR model. Comparing the average time‐course of the 2‐back with the 0‐back condition, the BOLD response of the A homozygotes did not exceed the other groups during 2‐back at any time. The average parameter estimates of the significant DLPFC cluster in the 40.5‐s interval are displayed in Figure 1C.
Figure 1.
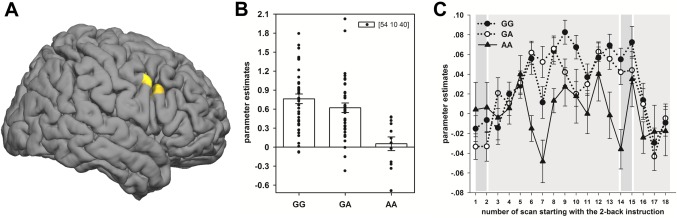
Effect of the rs1006737 genotype on working‐memory‐related neural activation in the prefrontal cortex. A. Results of a two‐sample t‐test comparing working‐memory‐related activation (2‐back > 0‐back) in G‐allele carriers with A homozygotes ([GG + GA] > 2AA) rendered on an individual surface image. Displayed results are controlled for participants sex and thresholded at t(91) > 3.18, P < 0.001, uncorrected, k = 216–1.73 cm3. B. Average parameter estimates for the contrast 2‐back > 0‐back of the significant DLPFC cluster are shown for the three rs1006737 genotype groups (GG, GA, and AA), indicating that the group homozygous for the A allele has significantly less activation than the other groups. C. Differences in measured signal between 2‐back and 0‐back at the resolution of one TR within the significant cluster. Average parameter estimates are extracted within the cluster at (54, 10, 38 mm) for a finite impulse response model and plotted for each rs1006737 genotype group separately with the standard error. From left to right, the first dark‐grey shaded area indicates the instruction period for the 2‐back and 0‐back condition, followed by the light‐grey shaded 0‐back and 2‐back condition. [Color figure can be viewed in the online issue, which is available at http://wileyonlinelibrary.com.]
Analysis of functional connectivity
Across all subjects, the correlation profile reflected the activated network during the working memory task. These results have been previously described (Paulus, et al., in press), but see Supporting Information Figure S1 for an illustration of the functional connectivity results and the correspondence of working memory related activation and functional integration with the right DLPFC.
The ROI analyses in both hippocampal formations (HFs) indicated a significant increase in functional coupling with the right DLPFC in rs1006737 A allele carriers (left HF: −22, −26, −10 mm, t(87) = 3.72, P < 0.05, corrected; right HF: 38, −8, −22 mm, t(87) = 3.61, P < 0.05, corrected, see Fig. 2A). After controlling for the influences of task, instructions as well as WM, CSF, and movement‐related noise, the connectivity parameters of the right DLPFC time series in the HFs indicate that the hippocampus is rather uncorrelated in G homozygotes and connectivity increased with the number of A alleles (Fig. 2B). The ROI analyses in both DLPFCs did not indicate statistically significant changes in frontal connectivity. Exploratory whole brain analyses showed rs1006737 genotype modulated DLPFC connectivity in an additional cluster located in the right parahippocampal cortex at 44, −52, −16 mm surviving the cluster extent threshold of the whole brain analysis, t(87) > 3.88, P < 0.0001, uncorrected, k = 52 (Fig. 2C). Again, the effect of rs1006737 genotype on the DLPFC connectivity remained unchanged after controlling for age.
Figure 2.
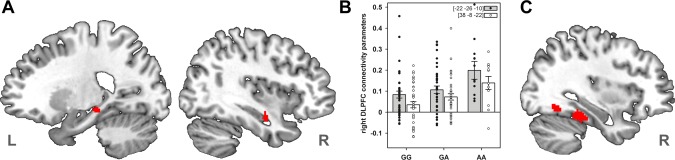
Effects of rs1006737 genotype on prefrontal‐hippocampal functional connectivity. A. Genetic risk‐dependent altered functional connectivity with the right dorsolateral prefrontal cortex (DLPFC) time series in both hippocampal formations (HFs). Sagittal slides illustrate the results of a random‐effects analysis in an additive genetic model (GG < GA < AA) controlling for participants' sex and seed time series location, thresholded at t(87) > 3.19, P < 0.001, uncorrected. B. Connectivity parameters with the right DLPFC seed time series in the left HF (gray columns) and right HF (white columns). Individual β‐parameters were averaged within the significant clusters and plotted together with the mean and standard error for each level of rs1006737 genotype after controlling for sex and the seed time series location. Numbers in brackets denote MNI coordinates for the peak voxel of the corresponding cluster. C. Increase of functional connectivity with number of A alleles in the parahippocampal cortex, thresholded at t(87) > 3.19, P < 0.001, uncorrected, k = 470. [Color figure can be viewed in the online issue, which is available at http://wileyonlinelibrary.com.]
DISCUSSION
In the present study we investigated the effect of SNP rs1006737 in the CACNA1C gene on the neural correlates of working memory in a large single‐site sample of healthy subjects. While achieving a generally high‐level of working‐memory performance, the SNP rs1006737 modulated brain activity in the right DLPFC. The group that was homozygous for the A allele showed significantly less activity in comparison to the G‐allele carriers. Furthermore, we found evidence for aberrant connectivity between the right DLPFC and the medial temporal lobe.
Rs1006737 Genotype‐Modulated DLPFC Activation
In a previous study, Bigos et al. 2010 reported increased activity in the right DLPFC for the homozygous A group during a working memory n‐back task. At the very same location (peak MNI coordinates: [54, 12, 39] in the Bigos study and [54, 10, 40] in the present study), we also found rs1006737 genotype associated changes in brain activity of the right DLPFC. However, the effect was reversed so that working memory related neural activation was reduced in A allele carriers. The recessive, risk‐associated allele model—additionally performed to reproduce the findings of Bigos et al.—corroborated the present results showing that A homozygotes had significantly lower activation within the DLPFC. The subsequent exploration of the BOLD response in the time window of the 2‐back condition indicated a consistently stronger signal compared to 0‐back for G‐allele carriers. This finding is specifically intriguing since there was no evidence for reduced behavioral performance in this group and on the contrary, the group of A homozygotes had comparably strong working‐memory performance. The present sample therefore contradicts the previously reported finding of inefficient prefrontal processing and resulting compensatory activation in rs1006737 A homozygotes.
It is unlikely that these divergent results between both studies are merely attributed to methodological differences.2 Despite the fact that participants in the present sample were ∼8 years younger on average with one third of the standard deviation, both samples were comparable, consisting of physically and psychiatrically healthy subjects of Caucasian descent. While genetic effects on neural systems phenotypes might increase with age, this does not explain why this effect should reverse. Although the analytical procedures were comparable, the experimental setup to probe working memory slightly differs between both studies. Bigos et al. (2010) used a spatial working‐memory task that required subjects to give a response to all presented stimuli with the correct button of one out of four spatial locations. In the letter n‐back task applied in this study, responses were required for targets only, and, as illustrated by the high level of performance, the task was therefore comparably less demanding. Working‐memory task difficulty and DLPFC‐activation have been linked in the form of a reversed U‐shaped function [Callicott et al., 1999; Manoach, 2003] with a peak at medium task loads and decreasing activation under heavy task loads. According to the prefrontal inefficiency hypothesis, subjects with SCZ have a similar shaped function, however, shifted toward earlier increased DLPFC activation. This left shift would explain why SCZ patients have greater DLPFC activation at low to medium task loads and reduced activation at high loads. Within this framework however, the inconsistencies between the previous and the current data cannot be explained by the differences in working‐memory task difficulty since CACNA1C rs1006737 related inefficient prefrontal engagement would still manifest in a greater neural activation of A homozygotes also in context of reduced task demands.
Although the present findings are not in line with the popular prefrontal inefficiency hypothesis [e.g., Callicott et al., 2003], it is noteworthy that the DLPFC hypoactivation we have found in rs1006737 A homozygotes fits the evidence obtained in coordinate based meta‐analyses. Examining n‐back [Glahn et al., 2005] and executive control tasks [Minzenberg et al., 2009], Glahn et al. concluded that patients with SCZ show hypoactivation within the DLPFC, whereas compensatory hyperactivation is found in rather ventral aspects of the prefrontal cortex. It is therefore not necessarily straightforward to assume that the rs1006737 neural system phenotype manifests in DLPFC hyperactivation during working memory execution. Notably, this is not the first imaging study on genetic variation in CACNA1C that shows inconsistent effects across different samples [Franke et al., 2010; Kempton et al., 2009; Perrier et al., 2011; Wang et al., 2011] and task variations [Bigos et al., 2010; Erk et al., 2010]. The observed heterogeneity might be rooted in the low frequency of rs1006737 minor allele (A). Even if the overall sample sizes suggest relatively robust estimates, especially the effects driven by the small subgroups of A homozygotes likely fluctuate across samples due to the stronger impact of sampling error. Beyond that, the potential influences of gene‐gene and gene‐environment interactions might impact the variability of effects obtained in the smaller subsamples to a larger degree. The small sample size of those homozygous for the rs1006737 A allele might thus be a limitation of the present study, but, as a matter of fact, is likely to affect other recent and future studies on the rs1006737 as well. At present, one key solution to overcome the heterogeneity of empirical findings lies in repeated efforts to replicate the existing evidence across independent samples to consolidate the empirical literature. Therefore, it is necessary to explicitly address neural activation in context of comparable conditions with regards to experimental paradigms, analytical procedures, and statistical models, as well as targeted brain systems. In case of other common risk variants in COMT (Mier, et al., 2010), 5‐HTTLPR [Munafo et al., 2008], and very recently ZNF804A [Esslinger et al., 2011; Paulus et al., in press] this has shown to distil the brain phenotypes which achieved most consistent support across independent samples.
Disconnectivity of the DLPFC With the Medial Temporal Lobe
The neural systems architecture of SCZ is frequently associated with altered connectivity in neural networks [Stephan et al., 2009] and, in particular, atypical functional integration of the DLPFC during working memory task execution [Meyer‐Lindenberg et al., 2005; Schlösser et al., 2003a, 2011]. Analogous to recent imaging genetics studies on other risk variants for psychosis [Bertolino et al., 2006; Esslinger et al., 2009; Paulus et al., in press] we found that the number of rs1006737 risk alleles is associated with an increase in functional coupling between the right DLPFC and HFs. A similar rs1006737 genotype‐dependent increase in prefrontal connectivity was found in adjacent regions of the right parahippocampal cortex. Notably, the increased connectivity between the prefrontal cortex and medial temporal lobe regions is robust and not affected by variations in the analytical procedures i.e., the DLPFC seed time series identification or global noise regression [see Bedenbender et al., 2011 for methodological details].
The finding of increased fronto‐hippocampal connectivity is supported by results from both molecular and imaging studies that suggest the hippocampus to represent one of the focal points for CACNA1C genotype‐associated alterations in the neural system architecture. CACNA1C encodes the alpha 1C subunit of the L‐type voltage‐gated calcium channel Cav1,2. Voltage‐gated calcium channels mediate a variety of calcium‐dependent processes in electrically excitable cells by linking changes in membrane potential to intracellular pathways. Being expressed in the entire nervous system, it has been demonstrated that Cav1.2 channels play a role in memory formation by activating cAMP‐response‐element‐binding dependent protein synthesis. Accordingly, the selective inactivation of the CACNA1C gene in mice was associated with impaired hippocampal functions and lead to disturbances of long‐term potentiation and to impaired memory formation [Moosmang et al., 2005a, 2005b; White et al., 2008; Woodside et al., 2004]. This evidence is supported by two recent imaging genetics studies in healthy individuals that suggest the presence of rs1006737 effects on hippocampal activation and connectivity. First, the A allele was associated, albeit at a trend level, with greater bilateral hippocampal activity during the encoding of aversive images [Bigos et al., 2010]. Second, Erk et al. (2010) found that healthy carriers of the rs1006737 A allele have reduced activity in the bilateral hippocampi as well as diminished functional coupling between the left and right hippocampus, specifically during memory recall but not during encoding and recognition. In accordance with these studies and the fronto‐hippocampal dysconnectivity hypothesis of SCZ [Meyer‐Lindenberg, 2010] the present data could provide another piece of evidence that the functional integration of the HF is a significant target for rs1006737 genotype‐dependent changes in the neural systems functional organization.
CONCLUSION
The results of the present analyses allow two conclusions. First, we provided new evidence for rs1006737 genotype‐related alterations in brain connectivity, specifically between the prefrontal cortex and the medial temporal lobe. This pattern has already been previously reported and replicated for other SCZ or BPD susceptibility loci (e.g., ZNF804A and COMT), suggesting a more generalizable neural system phenotype for psychosis that is mediated by different genetic risk variants. The molecular mechanisms causing the aberrant fronto‐hippocampal connectivity are yet not understood and may affect the neural system through different pathways. Based on the available molecular and imaging studies one may speculate that in the case of the rs1006737 in CACNA1C the main point of action for changes in the functional connectivity is the hippocampal formation. Second, the rs1006737 genotype‐related decrease of the DLPFC's efficiency remains yet to be verified across independent samples. In contrast to a previous study, within the present data we even observed significantly reduced prefrontal activation in association with the A allele. As it is the case for CACNA1C rs1006737, heterogeneity of empirical results is rather common in brain imaging studies. This heterogeneity is not problematic in so far that in the long run potential inconsistencies resolve if the published literature is not biased towards publishing significant or non‐contradictory findings. Because the association of CACNA1C rs1006737 with SZ is relatively novel, it might be even more important to get an unbiased perspective on the effects that the SNP rs1006737 has on prefrontal functioning. Prior to speculating about the effect sizes which rs1006737 and other SNPs have on brain function repeated (non‐) replication of initially promising results is a major step towards validating the current scientific hypotheses. This would provide the required database potentially explaining between‐study heterogeneity and objectively estimate true population effect sizes.
Supporting information
Supporting Information
ACKNOWLEDGMENTS
The authors thank two anonymous reviewers for their valuable comments and suggestions how to improve an earlier version of this manuscript.
REFERENCES
- Antilat M, Partonen T, Kieseppa T, Suvisaari J, Eerola M, Lonnqvist J, Tuulio‐Henriksson A (2009): Cognitive functioning of bipolar I patients and relatives from families with or without schizophrenia or schizoaffective disorder. J Affect Disord 116:70–79. [DOI] [PubMed] [Google Scholar]
- Arts B, Jabben N, Krabbendam L, van Os J (2008): Meta‐analyses of cognitive functioning in euthymic bipolar patients and their first‐degree relatives. Psychol Med 38:771–785. [DOI] [PubMed] [Google Scholar]
- Barrantes‐Vidal N, Aguilera M, Campanera S, Fatjo‐Vilas M, Guitart M, Miret S, Valero S, Fananas L (2007): Working memory in siblings of schizophrenia patients. Schizophr Res 95:70–75. [DOI] [PubMed] [Google Scholar]
- Bedenbender J, Paulus FM, Krach S, Pyka M, Sommer J, Krug A, Witt SH, Rietschel M, Laneri D, Kircher T, Jansen A (2011): Functional connectivity analyses in imaging genetics: Considerations on methods and data interpretation. PLoS One 6:e26354. [DOI] [PMC free article] [PubMed] [Google Scholar]
- Bertolino A, Rubino V, Sambataro F, Blasi G, Latorre V, Fazio L, Caforio G, Petruzzella V, Kolachana B, Hariri A, Meyer‐Lindenberg A, Nardini M, Weinberger DR, Scarabino T (2006): Prefrontal‐hippocampal coupling during memory processing is modulated by COMT val158met genotype. Biol Psychiatry 60:1250–1258. [DOI] [PubMed] [Google Scholar]
- Bigos KL, Mattay VS, Callicott JH, Straub RE, Vakkalanka R, Kolachana B, Hyde TM, Lipska BK, Kleinman JE, Weinberger DR (2010): Genetic variation in CACNA1C affects brain circuitries related to mental illness. Arch Gen Psychiatry 67:939–945. [DOI] [PMC free article] [PubMed] [Google Scholar]
- Brett M, Johnsrude IS, Owen AM (2002): The problem of functional localization in the human brain. Nat Rev Neurosci 3:243–249. [DOI] [PubMed] [Google Scholar]
- Callicott JH, Mattay VS, Bertolino A, Finn K, Coppola R, Frank JA, Goldberg TE, Weinberger DR (1999): Physiological characteristics of capacity constraints in working memory as revealed by functional MRI. Cereb Cortex 9:20–26. [DOI] [PubMed] [Google Scholar]
- Callicott JH, Egan MF, Mattay VS, Bertolino A, Bone AD, Verchinksi B, Weinberger DR (2003): Abnormal fMRI response of the dorsolateral prefrontal cortex in cognitively intact siblings of patients with schizophrenia. Am J Psychiatry 160:709–719. [DOI] [PubMed] [Google Scholar]
- Cohen MX (2011): Hippocampal‐prefrontal connectivity predicts midfrontal oscillations and long‐term memory performance. Curr Biol 21:1900–1905. [DOI] [PubMed] [Google Scholar]
- Courtney SM, Petit L, Haxby JV, Ungerleider LG (1998): The role of prefrontal cortex in working memory: Examining the contents of consciousness. Philos Trans R Soc B Biol Sci 353:1819–1828. [DOI] [PMC free article] [PubMed] [Google Scholar]
- Craddock N, Sklar P (2009): Genetics of bipolar disorder: Successful start to a long journey. Trends Genet 25:99–105. [DOI] [PubMed] [Google Scholar]
- Daban C, Amado I, Bourdel MC, Loo H, Olie JP, Poirier MF, Krebs MO (2005): Cognitive dysfunctions in medicated and unmedicated patients with recent‐onset schizophrenia. J Psychiatr Res 39:391–398. [DOI] [PubMed] [Google Scholar]
- Erk S, Meyer‐Lindenberg A, Schnell K, Opitz von Boberfeld C, Esslinger C, Kirsch P, Grimm O, Arnold C, Haddad L, Witt SH, Cichon S, Nöthen MM, Rietschel M, Walter H (2010): Brain function in carriers of a genome‐wide supported bipolar disorder variant. Arch Gen Psychiatry 67:803–811. [DOI] [PubMed] [Google Scholar]
- Esslinger C, Walter H, Kirsch P, Erk S, Schnell K, Arnold C, Haddad L, Mier D, Opitz von Boberfeld C, Raab K, Witt SH, Rietschel M, Cichon S, Meyer‐Lindenberg A (2009): Neural mechanisms of a genome‐wide supported psychosis variant. Science 324:605. [DOI] [PubMed] [Google Scholar]
- Esslinger C, Kirsch P, Haddad L, Mier D, Sauer C, Erk S, Schnell K, Arnold C, Witt SH, Rietschel M, Cichon S, Walter H, Meyer‐Lindenberg A (2011): Cognitive state and connectivity effects of the genome‐wide significant psychosis variant in ZNF804A. Neuroimage 54:2514–2513. [DOI] [PubMed] [Google Scholar]
- Ferreira MA, O'Donovan MC, Meng YA, Jones IR, Ruderfer DM, Jones L, Fan J, Kirov G, Perlis RH, Green EK, Smoller JW, Grozeva D, Stone J, Nikolov I, Chambert K, Hamshere ML, Nimgaonkar VL, Moskvina V, Thase ME, Caesar S, Sachs GS, Franklin J, Gordon‐Smith K, Ardlie KG, Gabriel SB, Fraser C, Blumenstiel B, Defelice M, Breen G, Gill M, Morris DW, Elkin A, Muir WJ, McGhee KA, Williamson R, MacIntyre DJ, MacLean AW, St CD, Robinson M, Van Beck M, Pereira AC, Kandaswamy R, McQuillin A, Collier DA, Bass NJ, Young AH, Lawrence J, Ferrier IN, Anjorin A, Farmer A, Curtis D, Scolnick EM, McGuffin P, Daly MJ, Corvin AP, Holmans PA, Blackwood DH, Gurling HM, Owen MJ, Purcell SM, Sklar P, Craddock N (2008): Collaborative genome‐wide association analysis supports a role for ANK3 and CACNA1C in bipolar disorder. Nat Genet 40:1056–1058. [DOI] [PMC free article] [PubMed] [Google Scholar]
- Ferrier IN, Stanton BR, Kelly TP, Scott J (1999): Neuropsychological function in euthymic patients with bipolar disorder. Br J Psychiatry 175:246–251. [DOI] [PubMed] [Google Scholar]
- Franke B, Vasquez AA, Veltman JA, Brunner HG, Rijpkema M, Fernandez G (2010): Genetic variation in CACNA1C, a gene associated with bipolar disorder, influences brainstem rather than gray matter volume in healthy individuals. Biol Psychiatry 68:586–588. [DOI] [PubMed] [Google Scholar]
- Glahn DC, Therman S, Manninen M, Huttunen M, Kaprio J, Lonnqvist J, Cannon TD (2003): Spatial working memory as an endophenotype for schizophrenia. Biol Psychiatry 53:624–626. [DOI] [PubMed] [Google Scholar]
- Glahn DC, Ragland JD, Abramoff A, Barrett J, Laird AR, Bearden CE, Velligan DI (2005): Beyond hypofrontality: A quantitative meta‐analysis of functional neuroimaging studies of working memory in schizophrenia. Hum Brain Mapp 25:60–69. [DOI] [PMC free article] [PubMed] [Google Scholar]
- Green EK, Grozeva D, Jones I, Jones L, Kirov G, Caesar S, Gordon‐Smith K, Fraser C, Forty L, Russell E, Hamshere ML, Moskvina V, Nikolov I, Farmer A, McGuffin P, Holmans PA, Owen MJ, O'Donovan MC, Craddock N (2010): The bipolar disorder risk allele at CACNA1C also confers risk of recurrent major depression and of schizophrenia. Mol Psychiatry 15:1016–1022. [DOI] [PMC free article] [PubMed] [Google Scholar]
- Grier JB (1971): Nonparametric indexes for sensitivity and bias: Computing formulas. Psychol Bull 75:424–429. [DOI] [PubMed] [Google Scholar]
- Jansen A, Krach S, Krug A, Markov V, Eggermann T, Zerres K, Stocker T, Shah NJ, Nothen MM, Treutlein J, Rietschel M, Kircher T (2009): A putative high risk diplotype of the G72 gene is in healthy individuals associated with better performance in working memory functions and altered brain activity in the medial temporal lobe. Neuroimage 45:1002–1008. [DOI] [PubMed] [Google Scholar]
- Kempton MJ, Ruberto G, Vassos E, Tatarelli R, Girardi P, Collier D, Frangou S (2009): Effects of CACNA1C risk allele for bipolar disorder on cerebral gray matter volume in healthy individuals. Am J Psychiatry 166:1413–1414. [DOI] [PubMed] [Google Scholar]
- Krug A, Nieratschker V, Markov V, Krach S, Jansen A, Zerres K, Eggermann T, Stocker T, Shah NJ, Treutlein J, Muhleisen TW, Kircher T (2010): Effect of CACNA1C rs1006737 on neural correlates of verbal fluency in healthy individuals. Neuroimage 49:1831–1836. [DOI] [PubMed] [Google Scholar]
- Lee KW, Woon PS, Teo YY, Sim K (2012): Genome wide association studies (GWAS) and copy number variation (CNV) studies of the major psychoses: What have we learnt? Neurosci Biobehav Rev 36:556–571. [DOI] [PubMed] [Google Scholar]
- Ma X, Wang Q, Sham PC, Liu X, Rabe‐Hesketh S, Sun X, Hu J, Meng H, Chen W, Chen EY, Deng W, Chan RC, Murray RM, Collier DA, Li T (2007): Neurocognitive deficits in first‐episode schizophrenic patients and their first‐degree relatives. Am J Med Genet B Neuropsychiatr Genet 144B:407–416. [DOI] [PubMed] [Google Scholar]
- Manoach DS (2003): Prefrontal cortex dysfunction during working memory performance in schizophrenia: Reconciling discrepant findings. Schizophr Res 60:285–298. [DOI] [PubMed] [Google Scholar]
- Markov V, Krug A, Krach S, Jansen A, Eggermann T, Zerres K, Stocker T, Shah NJ, Nothen MM, Treutlein J, Rietschel M, Kircher T (2010): Impact of schizophrenia‐risk gene dysbindin 1 on brain activation in bilateral middle frontal gyrus during a working memory task in healthy individuals. Hum Brain Mapp 31:266–275. [DOI] [PMC free article] [PubMed] [Google Scholar]
- McGrath J, Chapple B, Wright M (2001): Working memory in schizophrenia and mania: Correlation with symptoms during the acute and subacute phases. Acta Psychiatr Scand 103:181–188. [DOI] [PubMed] [Google Scholar]
- Meyer‐Lindenberg A (2009): Neural connectivity as an intermediate phenotype: Brain networks under genetic control. Hum Brain Mapp 30:1938–1946. [DOI] [PMC free article] [PubMed] [Google Scholar]
- Meyer‐Lindenberg A (2010): From maps to mechanisms through neuroimaging of schizophrenia. Nature 468:194–202. [DOI] [PubMed] [Google Scholar]
- Meyer‐Lindenberg A, Olsen RK, Kohn PD, Brown T, Egan MF, Weinberger DR, Berman KF (2005): Regionally specific disturbance of dorsolateral prefrontal‐hippocampal functional connectivity in schizophrenia. Arch Gen Psychiatry 62:379–386. [DOI] [PubMed] [Google Scholar]
- Mier D, Kirsch P, Meyer‐Lindenberg A (2010): Neural substrates of pleiotropic action of genetic variation in COMT: A meta‐analysis. Mol Psychiatry 15:918–927. [DOI] [PubMed] [Google Scholar]
- Minzenberg MJ, Laird AR, Thelen S, Carter CS, Glahn DC (2009): Meta‐analysis of 41 functional neuroimaging studies of executive function in schizophrenia. Arch Gen Psychiatry 66:811–822. [DOI] [PMC free article] [PubMed] [Google Scholar]
- Moosmang S, Haider N, Klugbauer N, Adelsberger H, Langwieser N, Muller J, Stiess M, Marais E, Schulla V, Lacinova L, Goebbels S, Nave KA, Storm DR, Hofmann F, Kleppisch T (2005a): Role of hippocampal Cav1.2 Ca2+ channels in NMDA receptor‐independent synaptic plasticity and spatial memory. J Neurosci 25:9883–9892. [DOI] [PMC free article] [PubMed] [Google Scholar]
- Moosmang S, Lenhardt P, Haider N, Hofmann F, Wegener JW (2005b): Mouse models to study L‐type calcium channel function. Pharmacol Ther 106:347–355. [DOI] [PubMed] [Google Scholar]
- Munafo MR, Flint J (2004): Meta‐analysis of genetic association studies. Trends Genet 20:439–444. [DOI] [PubMed] [Google Scholar]
- Munafo MR, Brown SM, Hariri AR (2008): Serotonin transporter (5‐HTTLPR) genotype and amygdala activation: A meta‐analysis. Biol Psychiatry 63:852–857. [DOI] [PMC free article] [PubMed] [Google Scholar]
- Nyegaard M, Demontis D, Foldager L, Hedemand A, Flint TJ, Sorensen KM, Andersen PS, Nordentoft M, Werge T, Pedersen CB, Hougaard DM, Mortensen PB, Mors O, Borglum AD (2010): CACNA1C (rs1006737) is associated with schizophrenia. Mol Psychiatry 15:119–121. [DOI] [PubMed] [Google Scholar]
- Oldfield RC (1971): The assessment and analysis of handedness: The Edinburgh inventory. Neuropsychologia 9:97–113. [DOI] [PubMed] [Google Scholar]
- Paulus FM, Krach S, Bedenbender J, Pyka M, Sommer J, Krug A, Knake S, Nöthen MM, Witt SH, Rietschel M, Kircher T, Jansen A: Partial support for ZNF804A risk status dependent alterations in prefrontal connectivity. Human Brain Mapping (in press). [DOI] [PMC free article] [PubMed] [Google Scholar]
- Perrier E, Pompei F, Ruberto G, Vassos E, Collier D, Frangou S (2011): Initial evidence for the role of CACNA1C on subcortical brain morphology in patients with bipolar disorder. Eur Psychiatry 26:135–137. [DOI] [PubMed] [Google Scholar]
- Pettersson‐Yeo W, Allen P, Benetti S, McGuire P, Mechelli A (2011): Dysconnectivity in schizophrenia: Where are we now? Neurosci Biobehav Rev 35:1110–1124. [DOI] [PubMed] [Google Scholar]
- Raine A, Benishay D (1995): The SPQ‐B: A brief screening instrument for schizotypal personality disorder. J Pers Disord 9:346–355. [Google Scholar]
- Rasetti R, Sambataro F, Chen Q, Callicott JH, Mattay VS, Weinberger DR (2011): Altered cortical network dynamics: A potential intermediate phenotype for schizophrenia and association with ZNF804A. Arch Gen Psychiatry 68:1207–1217. [DOI] [PubMed] [Google Scholar]
- Schlösser R, Gesierich T, Kaufmann B, Vucurevic G, Hunsche S, Gawehn J, Stoeter P (2003a): Altered effective connectivity during working memory performance in schizophrenia: A study with fMRI and structural equation modeling. Neuroimage 19:751–763. [DOI] [PubMed] [Google Scholar]
- Schlösser R, Gesierich T, Kaufmann B, Vucurevic G, Stoeter P (2003b): Altered effective connectivity in drug free schizophrenic patients. Neuroreport 14:2233–2237. [DOI] [PubMed] [Google Scholar]
- Schmitt A, Hasan A, Gruber O, Falkai P (2011)Schizophrenia as a disorder of disconnectivity. Eur Arch Psychiatry Clin Neurosci 261:150–154. [DOI] [PMC free article] [PubMed] [Google Scholar]
- Silver H, Feldman P, Bilker W, Gur RC (2003): Working memory deficit as a core neuropsychological dysfunction in schizophrenia. Am J Psychiatry 160:1809–1816. [DOI] [PubMed] [Google Scholar]
- Sklar P, Smoller JW, Fan J, Ferreira MA, Perlis RH, Chambert K, Nimgaonkar VL, McQueen MB, Faraone SV, Kirby A, de Bakker PI, Ogdie MN, Thase ME, Sachs GS, Todd‐Brown K, Gabriel SB, Sougnez C, Gates C, Blumenstiel B, Defelice M, Ardlie KG, Franklin J, Muir WJ, McGhee KA, MacIntyre DJ, McLean A, VanBeck M, McQuillin A, Bass NJ, Robinson M, Lawrence J, Anjorin A, Curtis D, Scolnick EM, Daly MJ, Blackwood DH, Gurling HM, Purcell SM (2008): Whole‐genome association study of bipolar disorder. Mol Psychiatry 13:558–569. [DOI] [PMC free article] [PubMed] [Google Scholar]
- Smoller JW, Rosenbaum JF, Biederman J, Kennedy J, Dai D, Racette SR, Laird NM, Kagan J, Snidman N, Hirshfeld‐Becker D, Tsuang MT, Sklar PB, Slaugenhaupt SA (2003): Association of a genetic marker at the corticotropin‐releasing hormone locus with behavioral inhibition. Biol Psychiatry 54:1376–1381. [DOI] [PubMed] [Google Scholar]
- Stephan KE, Friston KJ, Frith CD (2009): Dysconnection in schizophrenia: From abnormal synaptic plasticity to failures of self‐monitoring. Schizophr Bull 35:509–527. [DOI] [PMC free article] [PubMed] [Google Scholar]
- Sweeney JA, Kmiec JA, Kupfer DJ (2000): Neuropsychologic impairments in bipolar and unipolar mood disorders on the CANTAB neurocognitive battery. Biol Psychiatry 48:674–684. [DOI] [PubMed] [Google Scholar]
- Thimm M, Kircher T, Kellermann T, Markov V, Krach S, Jansen A, Zerres K, Eggermann T, Stocker T, Shah NJ, Nothen MM, Rietschel M, Witt SH, Mathiak K, Krug A (2011): Effects of a CACNA1C genotype on attention networks in healthy individuals. Psychol Med:1–11. [DOI] [PubMed] [Google Scholar]
- Tost H, Bilek E, Meyer‐Lindenberg A (2012): Brain connectivity in psychiatric imaging genetics. Neuroimage 62:2550–2260. [DOI] [PubMed] [Google Scholar]
- Wang F, McIntosh AM, He Y, Gelernter J, Blumberg HP (2011): The association of genetic variation in CACNA1C with structure and function of a frontotemporal system. Bipolar Disorders 13:696–700. [DOI] [PMC free article] [PubMed] [Google Scholar]
- Wernicke C (1900):Grundriss der Psychiatrie in klinischen. Vorlesungen:Leipzig. G. Thieme. [Google Scholar]
- White JA, McKinney BC, John MC, Powers PA, Kamp TJ, Murphy GG (2008): Conditional forebrain deletion of the L‐type calcium channel Ca V 1.2 disrupts remote spatial memories in mice. Learn Mem 15:1–5. [DOI] [PubMed] [Google Scholar]
- Wigginton JE, Cutler DJ, Abecasis GR (2005): A note on exact tests of Hardy–Weinberg equilibrium. Am J Hum Genet 76:887–893. [DOI] [PMC free article] [PubMed] [Google Scholar]
- Woodside BL, Borroni AM, Hammonds MD, Teyler TJ (2004): NMDA receptors and voltage‐dependent calcium channels mediate different aspects of acquisition and retention of a spatial memory task. Neurobiol Learn Mem 81:105–114. [DOI] [PubMed] [Google Scholar]
- W.T.C.C.C. (2007): Genome‐wide association study of 14,000 cases of seven common diseases and 3,000 shared controls. Nature 447:661–678. [DOI] [PMC free article] [PubMed] [Google Scholar]
- Zhang Q, Shen Q, Xu Z, Chen M, Cheng L, Zhai J, Gu H, Bao X, Chen X, Wang K, Deng X, Ji F, Liu C, Li J, Dong Q, Chen C (2012): The effects of CACNA1C gene polymorphism on spatial working memory in both healthy controls and patients with schizophrenia or bipolar disorder. Neuropsychopharmacology 37:677–684. [DOI] [PMC free article] [PubMed] [Google Scholar]
Associated Data
This section collects any data citations, data availability statements, or supplementary materials included in this article.
Supplementary Materials
Supporting Information