

Abstract
It has been shown that brain volume and general intellectual ability are to a significant extent influenced by the same genetic factors. Several cortical regions of the brain also show a genetic correlation with intellectual ability, demonstrating that intellectual functioning is probably represented in a heritable distributed network of cortical regions throughout the brain. This study is the first to investigate a genetic association between subcortical volumes and intellectual ability, taking into account the thalamus, caudate nucleus, putamen, globus pallidus, hippocampus, amygdala, and nucleus accumbens using an extended twin design. Genetic modeling was performed on a healthy adult twin sample consisting of 106 twin pairs and 30 of their siblings, IQ data was obtained from 132 subjects. Our results demonstrate that of all subcortical volumes measured, only thalamus volume is significantly correlated with intellectual functioning. Importantly, the association found between thalamus volume and intellectual ability is significantly influenced by a common genetic factor. This genetic factor is also implicated in cerebral brain volume. The thalamus, with its widespread cortical connections, may thus play a key role in human intelligence. Hum Brain Mapp 35:2632–2642, 2014. © 2013 Wiley Periodicals, Inc.
Keywords: twin, heritability, IQ, thalamus, MRI, subcortical, volumetric
INTRODUCTION
Understanding the relative influences of genes and environment on differences in human brain structure is of key importance for understanding the dynamics of brain development and its relation to behavioral phenotypes [Peper et al., 2007; Toga and Thompson, 2005]. Twin designs have shown to be a powerful approach to measure the extent to which genes and environment influence behavioral and biological phenotypes [for review see Boomsma et al., 2002; van Dongen et al., 2012]. Using the twin design, it has been established that whole brain volume is a highly heritable trait [Baaré et al., 2001a,b; Posthuma et al., 2000; Thompson et al., 2001]. Heritability estimates for whole brain volume range from 66% to 97% [Blokland et al., 2012; Peper et al., 2007; van Soelen et al., 2012a,b].
Human intellectual ability as measured by the intelligence quotient (IQ) tests is a trait that shows a linearly increasing heritability through childhood (41%), adolescence (55%) and young adulthood (66%) [Haworth et al., 2009]. In adults, it is estimated that 80% of the variance in intellectual ability is accounted for by additive genetic factors, while unique environmental factors explain about 15–20% of the variance [Boomsma et al., 2002]. Importantly, the association between brain volume and IQ is explained by a genetic correlation, which suggests that both traits are influenced by a partly overlapping set of genes, i.e. genetic pleiotropy or that the traits are causally related [Posthuma et al., 2003, 2002; Thompson et al., 2001; Toga and Thompson, 2005].
Distinct anatomical brain structures may vary considerably in heritability, suggesting that different genes influence brain structure through development and functional segregation [Brans et al., 2010; Hulshoff Pol et al., 2006; Rimol et al., 2010; van Soelen et al., 2012a,b]. This is also reflected in the substantial differences in the association between volume and intellectual ability across different regions of the cortex, that to a certain extent differ between males and females [Haier et al., 2004, 2005]. In fact, many theories on the neural correlates of intelligence focus mainly on the cortex [Jung and Haier, 2007; Navghani and Nyberg, 2005; Neubauer and Fink, 2009]. Especially, regions in the frontal and parietal cortex are thought to be of major importance for human intelligence as is suggested by the P‐FIT theory of Haier and Jung [2007].
Several studies which investigated the genetic association between local brain regions and intelligence have found that many brain regions typically associated with intelligence also show evidence for shared genetic variance. Using voxel based morphometry (VBM) it was shown that intellectual ability shares a common genetic origin with areas involving the frontal, occipital, and parahippocampal cortices and with connecting white matter of the superior occipitofrontal fascicle and corpus callosum [Hulshoff Pol et al., 2006]. Furthermore, the superior frontal cortex and parahippocampal cortex are known to show different developmental trajectories for adults with above average intellectual abilities versus people with normal or below average intellectual abilities. Importantly, these age‐related changes in cortical thickness are also partially genetically determined [Brans et al., 2010]. These genetic associations suggest that intelligence is represented through a genetically determined spatially distributed network of cortical regions.
Certain aspects of subcortical structures have also been found to correlate with intellectual ability, including the thalamus with general intelligence, the putamen and caudate nucleus with the spatial component of IQ, as measured using VBM [Frangou et al., 2004; Haier et al., 2009]. In addition, volumetric studies revealed that a larger thalamus was associated with faster cognitive processing speed [van der Werf et al., 2001] and a larger hippocampus with higher performance intelligence [MacLullich et al., 2002]. The above findings suggest that subcortical structures also contribute to intelligence and that perhaps they should be emphasized in theories about the neural correlates of intelligence. Evidence for a genetic association between subcortical structures and intellectual ability would greatly stress this point. Indeed, since at least some subcortical brain structures correlate with aspects of intelligence, and considering that volumes of subcortical structures, such as caudate nucleus, putamen, globus pallidus, thalamus, hippocampus, amygdala and nucleus accumbens, are under strong genetic control [Blokland et al., 2012; Kremen et al., 2010; White et al., 2002], we can hypothesize a genetic relation between subcortical volumes and intelligence.
This study was set up to measure the associations between subcortical volumes and intellectual ability, and the extent to which these can be attributed to genetic factors influencing both traits. This was done using structural equation modeling in data from mono‐ and dizygotic twins and additional non‐twin siblings (see Fig. 1 for illustration). Because of the known genetic correlation between brain volume and intellectual ability [Posthuma et al., 2002], a trivariate genetic model was implemented to account for this effect. Specifically, it was tested whether genetic influences on subcortical volumes and intellectual ability overlapped with genetic influences on brain volume to identify whether genetic influences on brain volume and IQ act in unity or separately.
Figure 1.
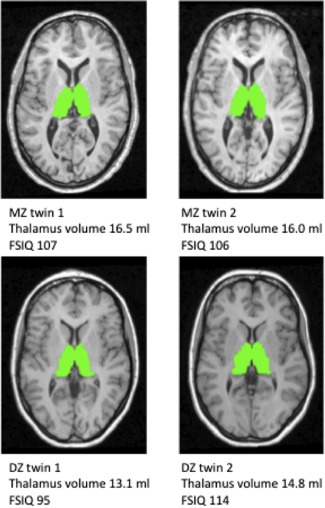
Thalamus segmentation and FSIQ score for a MZ and a DZ twin pair T1‐weighted images of one 26.7 year old MZ female twin pair (upper) and one 29.1 year old DZ female twin pair (lower). The automatically segmented outline of the thalamus is shown in green. The thalamus volume and FSIQ are denoted for each subject as an illustration of the difference in similarity between MZ and DZ twin pairs.
MATERIALS AND METHODS
Cohort Demographics
A total number of 242 subjects from 107 families were included in this study (see Table 1 for demographics) [Baaré et al., 2001b; Hulshoff Pol et al., 2006; Posthuma et al., 2002]. They consisted of 50 MZ twin pairs (31 male, 19 female), 56 DZ twin pairs (17 male, 20 female, 19 opposite sex) and 30 of their siblings (17 male, 13 female). All subjects were between 19 and 55 years of age with a mean of 29.6 years (S.D.=7.2 years). Handedness was determined by the laterality index of the Comprehensive Assessment of Symptoms and History (CASH) [Andreasen et al., 1992]: 199 subjects were right‐handed (82.2%), 32 left‐handed (13.2%) and 11 ambidextrous (4.5%).
Table 1.
Summary of Sample Demographics
| Measure | Total | MZ | DZ | Sibling |
|---|---|---|---|---|
| N, % male | 242,56 | 100,62 | 112,47 | 30,57 |
| Age in years (s.d.) | 29.6 (7.21) | 30.5 (8.20) | 29.2 (6.94) | 28.5 (3.69) |
| % Right handed | 82 | 80 | 85 | 80 |
| Years of education (s.d.) | 13.4 (2.8) | 13.7 (2.7) | 13.3(2.6) | 12.7 (3.2) |
| Parental years of education (s.d.) | 12.1 (2.7) | 12.2 (2.6) | 12.0 (2.7) | 12.1 (2.8) |
| FSIQ (s.d.) | 99.4 (12.2) | 99.3 (15.6) | 99.0 (8.9) | 100.8 (12.3) |
N stands for number of participants, s.d. stands for standard deviation. Parental years of education completed is reported for parent with highest years of education. FSIQ is reported in only 132 subjects, for sample demographics of subsample see Supporting Information Table I.
All subjects were recruited from the healthy twin sample of the Department of Psychiatry of the University Medical Center Utrecht (http://www.neuromri.eu) and the Netherlands Twin Registry (http://www.tweelingregister.org/en/). Zygosity was based on resemblance for polymorphic DNA markers. Except for one twin pair, all twins and their siblings were reared together. Two twin pairs were born by caesarean section delivery. Mental and physical health at baseline was assessed by means of the Family interview of Genetic Studies [Nurnberger et al., 1994] and the Comprehensive Assessment of Symptoms and History [CASH; Andreasen, 1992]. The CASH interview was used to obtain scores for the level of education in years completed, level of parental education and handedness. All subjects' written consent was obtained before participation in this study. The Scientific and Ethical Committee of the University Medical Center Utrecht and of the VU University hospital approved the study.
Image Acquisition
Structural magnetic resonance brain images were collected on a 1.5T Philips NT MRI scanner [Hulshoff Pol et al., 2006; Baaré et al., 2001]. For each participant a T1‐weighted 3D fast‐field echo scan was acquired with the following parameters: 160–180 1.2 mm contiguous slices; echo time (TE) 4.6 ms; repetition time (TR) 30 ms; flip angle 30˚; field of view (FOV) 256 mm/80%; in‐plane voxel size 1 x 1 mm2.
Image Processing
Prior to processing, all scans were clinically evaluated by a trained radiologist to assure that there were no radiological abnormalities of the brain. Subsequently, all scans were deidentified to ensure researcher blindness when processing and analyzing the volumes. Volume segmentation was performed using the FreeSurfer 5.1.0 structural imaging pipeline. Anatomic volumes of the bilateral caudate nucleus, putamen, nucleus accumbens, globus pallidus, thalamus, hippocampus, and amygdala were delineated using information on image intensity, probabilistic atlas location and spatial relationships between subcortical structures [Fischl et al., 2002, 2004]. Also, subcortical grey matter volume, cortical volume and white matter volume were extracted. To account for the known association between brain volume and FSIQ, a measure of cerebral brain volume (CBV) was calculated by combining subcortical and cortical grey matter volume with cerebral white matter volume.
Quality checks were performed by visual monitoring of the segments onto the individual T1‐weighted image of each subject in which volumes were found that statistically deviated significantly from the population mean (>2.0 S.D.) or in which the laterality index exceeded normal limits (> 2.0 S.D.) [Goldman et al., 2007; Kremen et al., 2010]. Segmentations were deemed unfit for further analysis only when visual inspection of the statistically deviant volumes clearly showed a segmentation fault, either by not including the whole structure or by clearly exceeding the structure boundary. As a result of this procedure, hippocampal volume was discarded in three subjects. From one of these three subjects, a FSIQ score was obtained. The subject's FSIQ was 95. Therefore it is not very likely that the exclusion of these hippocampus volumes has influenced the reliability of further analyses much, or that there is a direct relation between FSIQ score and hippocampal segmentation performance.
Assessment of IQ
Assessment of IQ was performed by administration of the WAIS‐III (1997) adult intelligence test. A measure for full scale IQ (FSIQ) was calculated for 132 subjects that were recruited from the Netherlands Twin Registry [Brans et al., 2010; Hulshoff Pol et al., 2006; Posthuma et al., 2002]. The subjects for which FSIQ data was available consisted of 24 MZ twin pairs, one MZ singleton, 24 DZ twin pairs, 5 DZ singletons and 20 siblings (Supporting Information Table I). Mean age, sex, and handedness did not differ significantly among these groups or from the complete sample.
Statistical Analysis
All statistical analyses were carried out using the R statistical software package (version 1.40, R Core Team 2012). The output volumes of the FreeSurfer pipeline were corrected for subject's age, handedness and sex using a linear regression. All further data analysis was carried out on the unstandardized residuals from these regressions, except for the analysis on sex differences. In this analysis, unstandardized residuals from a linear regression of age and handedness only were used.
Structural Equation Modeling and the Extended Twin Model
To estimate heritability, the extended twin model focuses on the difference in resemblance for a particular trait between monozygotic (MZ) twins who share (nearly always) 100% of their genes relative to dizygotic (DZ) twin and sibling pairs who share on average 50% of their segregating genes. Thus, if MZ twins resemble each other closer than DZ twin and sibling pairs, there is reason to assume that the trait is heritable. A contribution of common environmental influences shared by relatives growing up in the same home, is suggested when DZ / twin‐sibling correlations are larger then half the MZ correlations. Thus, the extended twin model includes siblings of twins under the assumption that they share on average 50% of their segregating genes with their twin siblings and a similar amount of shared environment, just like DZ twin pairs. Thereby, the power to detect both genetic and common environmental influences is increased substantially with a relatively low sample size [Posthuma and Boomsma, 2000].
The twin model can be implemented using structural equation modeling (SEM) approaches, in which the contributions of additive genetic effects (A), shared environmental effects (C) and unique environmental effects (E) to trait variation and covariation are estimated by full information maximum likelihood. For estimating the relative contributions of A, C, and E factors to the variance of subcortical volumes and intellectual ability, we used SEM as implemented in OpenMx software [Boker et al., 2011] in R (R Core Team 2012).
To estimate the phenotypic and genetic correlations between subcortical volumes and FSIQ, while taking into account the effect of brain volume a trivariate model was used. In this model, the covariances between brain volume, subcortical volume and FSIQ were decomposed into genetic and environmental sources. The FSIQ data from 132/242 subjects were analyzed simultaneously with the volumetric information from all subjects (N = 242). All available data were entered in a trivariate model by using raw‐data maximum likelihood analyses as implemented in OpenMx. Sex differences were investigated by fitting the model on data from male and female subjects separately.
We tested whether the full ACE model (family resemblance is attributable to both additive genetic and environmental factors) fitted as well as an AE model (family resemblance is solely attributable to additive genetic effects), a CE model (family resemblance is solely attributable to common environmental factors), or an E model (no family resemblance), favoring the simplest model explaining the data (Neale, 2004). The likelihoods of nested models were compared (−2 log likelihood difference is then χ 2 distributed). A χ 2 larger than 3.84 (1 df) or 23.04 (6 df) indicates a significant difference at α = 0.05, which means that the reduced model provided a significantly worse fit to the data. When a variance component was fixed at zero, a one‐tailed test was used [Dominicus et al., 2006].
Decomposition of covariance between traits was carried out based on the comparison of cross‐trait/cross‐twin correlations for MZ and DZ twins and siblings (i.e., the correlation between a trait [e.g., thalamus volume] of twin 1 with another trait [e.g., FSIQ] of twin 2 or sibling, where twin 1 and twin 2 represent a twin‐pair) [Neale and Cardon, 1992]. If the absolute value of the correlation between thalamus volume of twin 1 and IQ of twin 2 is larger in MZ twins than in DZ twins or siblings, this indicates that genes influencing subcortical volume (partly) overlap with genes that influence FSIQ. In other words, there is a genetic correlation between the two traits. If this correlation is less than twice as large in MZ twins as compared to DZ twins and siblings, there is a common environmental correlation between the two traits. Finally, it is possible that a unique environmental component drives the association between two traits. In this case, there is a correlation between the two traits, but only within persons (and not between members of a twin pair), for an extensive discussion of the model see van Soelen et al. [2011].
To distinguish whether genetic covariance between subcortical volumes and FSIQ was unique or shared with CBV, the significance of the path estimates of the trivariate model was calculated by estimating a 95% confidence interval based on the model fit (Fig. 3). Significance of the path from A1 to FSIQ (a1,3) would suggest that the genetic covariance between CBV, subcortical volume and FSIQ is significant. Significance of the path from A2 to FSIQ (a2,3) would suggest that additional genetic covariance between subcortical volume and FSIQ is significant, separate from CBV.
Figure 3.
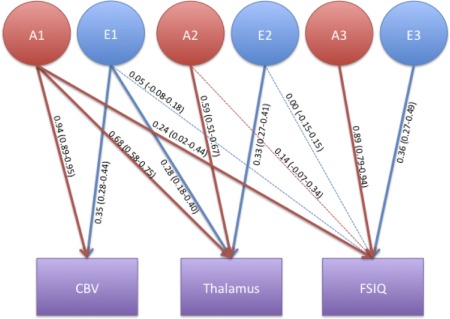
Trivariate twin model incorporating cerebral brain volume, thalamus volume and FSIQ The variance in the traits shown in the purple boxes is decomposed into additive genetic (A) and environmental (E) influences denoted with the red and blue circles. Standardised path coefficients (95% confidence interval) are displayed for each decomposition, fat arrows indicate a significant contribution.
RESULTS
Demographics/Volumes
No statistical differences were found between MZ twins, DZ twins, and the sibling group on measures of age, handedness, parental education, level of education and FSIQ (Table 1). As is known from this sample, there are no differences in (co)‐variances according to birth order, zygosity, and twin‐singleton status regarding brain volume (Hulshoff Pol et al., 2002). The MZ sample consisted of more males than the DZ sample (Table 1). Because of the higher percentage of males, the average MZ whole brain and subcortical volumes tended to be slightly larger than the DZ volumes (Table 2). Subsequent analyses were corrected for sex, age, and handedness.
Table 2.
Summary of Subcortcial Volumes and TB
| Measure | Volume (ml) Total | Volume (ml) MZ | Volume (ml) DZ | Volume (ml) Sibling |
|---|---|---|---|---|
| Thalamus (s.d.) | 14.9 (1.5) | 15.1 (1.4) | 14.9 (1.6) | 15.4 (1.3) |
| Caudate N. (s.d.) | 6.8 (0.9) | 6.8 (0.7) | 6.8 (1.0) | 7.0 (0.8) |
| Putamen (s.d.) | 10.1 (1.2) | 10.2 (1.2) | 10.1 (1.1) | 10.2 (1.3) |
| G. Pallidus (s.d.) | 3.2 (0.3) | 3.2 (0.3) | 3.2 (0.4) | 3.3 (0.3) |
| Hippocampus (s.d.) | 8.8 (0.8) | 8.9 (0.8) | 8.7 (0.8) | 8.9 (0.8) |
| Amygdala (s.d.) | 3.1 (0.4) | 3.1 (0.4) | 3.0 (0.4) | 3.2 (0.3) |
| N. Accumbens (s.d.) | 1.1 (0.1) | 1.1 (0.2) | 1.1 (0.1) | 1.1 (0.1) |
| TB (s.d.) | 1189.9 (120.1) | 1207.6 (124.3) | 1160.0 (113.5) | 1220.1 (117.7) |
S.d. stands for standard deviation.
Structural Equation Modeling
A trivariate ACE model was fitted for each subcortical volume with CBV and FSIQ to calculate the genetic influences affecting the relation between these traits. The influence of common environmental factors was not significantly different from zero as the −2 LL increased on average only 3.43 for a gain of 6° of freedom (Table 3). Additionally, AIC fit statistics consistently suggest that the AE model explains the data best (Supporting Information Table 2).
Table 3.
Trivariate Model Fitting
| Trivial model fitting | ||||
|---|---|---|---|---|
| Subcorital structure | −2 LL ACE Mode 591 df | −2 LL AE Model 597 df (diff −2LL ACE) | −2 LL CE Model 597 df (diff −2LL ACE) | −2 LL E Model 603 df (diff −2LL ACE) |
| Thalamus | 10,957.11 | 10,959.40 (2,29) | 11,013.94 (56.83) | 11,175.07 (217.96) |
| Caudate N. | 10,869.59 | 10,870.99 (1.40) | 10,929.84 (60.25) | 11,080.68 (211.09) |
| Putamen | 10,937.60 | 10,941.57 (3.97) | 10,991.01 (53.41) | 11,152.71 (215.11) |
| Pallidum | 10,385.37 | 10,388.30 (2.93) | 10,437.90 (52.53) | 10,574.24 (188.87) |
| Hippocampus | 10,701.37 | 10,705.63 (4.26) | 10,754.87 (53.50) | 10,914.28 (212.91) |
| Amygdala | 10.366.99 | 10,371.94 (4.95) | 10,415.91 (48.92) | 10,566.89 (199.90) |
| N. Accumbens | 10,035.93 | 10,040.14 (4.21) | 10,096.40 (60.47) | 10,219.83 (183.90) |
SV stands for subcortical volume. −2 log likelihoods are displayed for the full ACE model and nested AE, CE and E submodels.
Proceeding with an AE model, it was established that additive genetic factors make a significant contribution to subcortical volume (Table 4). Substantial genetic contributions (h 2 > 0.70) were found in the thalamus, caudate nucleus, putamen, pallidum, hippocampus, and amygdala. A moderate contribution of genetic factors was estimated for the nucleus accumbens (h 2 = 0.49 (0.30–0.65)). Based on the trivariate AE model including thalamus volume, the heritability of CBV was estimated at 0.94 (0.90–0.96). The heritability of FSIQ was estimated to be 0.87 (0.76–0.92).
Table 4.
Trivariate AE Model Results
| Trivariate AE model results | ||||||||
|---|---|---|---|---|---|---|---|---|
| SV | h2 SV (95%CI) | e2 SV (95%CI) | Rph SV ∼ FSIQ (95%CI) | Rg SV ∼ FSIQ (95% CI) | Re SV∼FSIQ (95% CI) | Rph SV∼TB (95%CI) | Rg SV∼CBV (95% CI) | Re SV∼CBV (95% CI) |
| Thalamus | 0.81 (0.71‐0.88) | 0.19 (0.12‐0.29) | 0.26 (0.07–042) | 0.29 (0.06‐0.50) | 0.08 (028‐0.42) | 0.73 (0.66‐0.79) | 0.75 (0.66‐0.82) | 0.65 (0.46‐0.78) |
| Caudate N. | 0.79 (0.67‐0.87) | 0.21 (0.13‐0.33) | −0.01 (−0.18‐0.16) | 0.02 (−0.21‐0.25) | −0.14 (−0.52‐0.30) | 0.43 (0.31‐0.54) | 0.44 (0.66‐0.82) | 0.65 (0.46‐0.78) |
| Putamen | 0.80 (0.70‐0.87) | 0.20 (0.13‐0.30) | 0.01 (−0.17‐0.20) | 0.00 (−0.23‐0.23) | 0.08 (−0.45‐0.46) | 0.53 (0.42‐0.62) | 0.58 (0.44‐0.69) | 0.28 (0.03‐0.55) |
| Pallidum | 0.71 (0.56‐0.81) | 0.29 (0.19‐0.44) | 0.02 (−0.16‐0.20) | −0.05 (0.29‐0.20) | 0.29 (−0.16‐0.62) | 0.54 (0.43‐0.63) | 0.60 (0.45‐0.72) | 0.28 (0.03‐0.55) |
| Hippocampus | 0.75 (0.62‐0.83) | 0.26 (0.17‐0.38) | 0.18 (−0.02‐0.36) | 0.22 (−0.04‐0.44) | 0.02 (−0.34‐0.38) | 0.62 (0.52‐0.70) | 0.64 (0.52‐0.74) | 0.56 (0.35‐0.71) |
| Amygdala | 0.76 (0.63‐0.84) | 0.25 (0.16‐0.37) | 0.13 (−0.08‐0.32) | 0.15 (−0.11‐0.39) | 0.02 (−0.34‐0.38) | 0.59 (0.49‐0.68) | 0.66 (0.52‐0.76) | 0.34 (0.08‐0.55) |
| N.Accumbens | 0.49 (0.30‐0.65) | 0.51 (0.35.070) | 0.10 (−0.08‐0.27) | 0.02 (0.28‐0.30) | 0.33 (−0.05‐0.61) | 0.44 (0.32‐0.55) | 0.47 (0.27‐0.64) | 0.55 (0.33‐0.71) |
Columns one and two provide estimates of heritability and environmental factors on subcortical volume. Column three shows the phenotypic correlation between subcortical volumes (SV) and FSIQ. In column four and five show the genetic and environmental correlations between SV and FSIQ. Column six shows the phenotypic correlation between SV and CBV. Columns seven and eight display the genetic and environmental correlations between subcortical volumes and CBV. All estimates are followed by a 95% conficence interval (CI) between brackets.
Within the trivariate model, phenotypic correlations (R ph) between FSIQ and subcortical volumes were estimated taking into account the dependency of the data due to family relations among the subjects. The R ph is defined as the bivariate correlation within subject, between traits. The only subcortical structure that showed a significant correlation with FSIQ was the thalamus (R ph = 0.26 (0.07–0.42)).
Cross‐twin‐cross‐trait (CT/CT) plots between thalamus volume and FSIQ were fitted for MZ and DZ twins separately (Fig. 2). The CT/CT correlation (R CT/CT), for the MZ associations shows a significant interaction (R CT/CT =0.35; P = 0.01), the CT/CT correlation for the DZ twins was not significant (R CT/CT =0.16; P = 0.20) suggesting that the association between the two traits is due to a genetic correlation. None of the other subcortical structures showed a significant correlation with FSIQ, although a trend towards significance was estimated in the hippocampus (R ph=0.18 (−0.02–0.36)) (Table 4). As the phenotypic correlations presented above suggest, a significant genetic correlation was estimated for thalamus volume and FSIQ (R g = 0.29 (0.06–0.50)). In the same model, the genetic correlation between CBV and IQ was estimated at 0.28 (0.06–0.47). The same genetic factor acted on CBV, thalamus volume and FSIQ. Genetic influences acting only on thalamus volume and FSIQ, separate from cerebral brain volume did not reach significance (Fig. 3). To estimate the total variance in FSIQ explained by this common genetic factor, the variance accounted for by the common genetic factor was divided by the total (i.e., genetic and environmental) variance in FSIQ. It was estimated that the common genetic factor accounts for 5.7% of the total variance in FSIQ and that 6.6% of the variance due to genetic factors only in FSIQ was explained by the common genetic factor.
Figure 2.
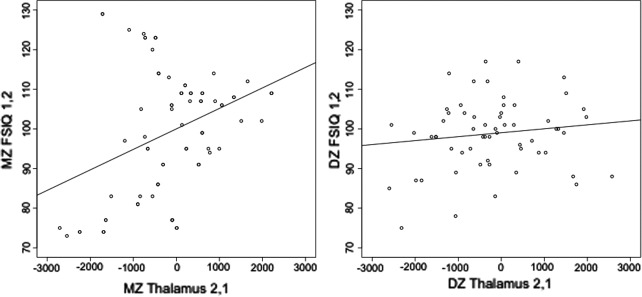
Thalamus volume and intelligence among twin pairs. Plots of MZ (left) and DZ (right) cross‐twin/cross‐trait associations. The plotted values for thalamus volume are unstandardised residuals after correction for age, sex and handedness. Thalamus volume of twin one is plotted against IQ of twin 2 and vice versa, for both MZ and DZ twin groups.
Furthermore, a trend towards significance was found for the genetic correlation between hippocampus volume and FSIQ (R g = 0.22 (−0.04–0.44)). No other significant genetic correlations between subcortical volumes and FSIQ were observed, while all subcortical volumes showed a significant genetic and environmental correlation with CBV (Table 4).
Bivariate Modeling
In a subsequent analysis, it was tested whether the genetic correlation between thalamus volume and FSIQ remained significant with CBV added as a covariate, using a bivariate twin model. When CBV was added as a covariate to thalamus volume the heritability of thalamus volume did not decline significantly (see Table 5), implying that there are additive genetic factors acting on thalamus volume separate from CBV. The genetic correlation between thalamus volume and FSIQ was no longer significant (R g = 0.14 (−0.08−0.37)). Interestingly, genetic influences between CBV and FSIQ also were no longer significant when adding thalamus volume as a covariate to CBV (R g = 0.03 (−0.20−0.25)). For further details, see Table 5.
Table 5.
Bivariate Model Fitting
| Bivariate AE model results | |||||
|---|---|---|---|---|---|
| Volume | h2 SV | e2 SV | Rph SV∼ FSIQ | Rg SV∼ FSIQ | Re SV ∼ FSIQ |
| (95% CI) | (95% CI | (95% CI) | (95% CI) | (95% CI) | |
| Thalamus | 0.81 (071‐0.88) | 0.19 (0.12‐0.29) | 0.24 (0.05‐0.41) | 0.27 (0.04‐0.48) | 0.10 (−0.26‐0.44) |
| CBV | 0.88 (0.81‐0.92) | 0.12 (0.08‐0.19) | 0.23 (0.03‐0.42) | 0.25 (0.01‐0.47) | 0.13 (−0.21‐0.43) |
| Thalamus∼ CBV | 0.77 (0.63‐0.84) | 0.23 (0.16‐0.37) | 0.12 (−0.05‐0.29) | 0.14 (−0.08‐0.29) | 0.01 (−0.36‐0.38) |
| CBV ∼ Thalamus | 0.82 (0.73‐0.88) | 0.18 (0.12‐0.27) | 0.18 (0.12‐0.27) | 0.03 (−0.15‐0.27) | 0.07 (−0.31‐0.42) |
Columns one and two show the additive genetic and environmental influences on thalamus volume, cerebral brain volume (CBV), thalamus volume corrected for CBV and CBV corrected for thalamus volume. Column three shows the phenotypic correlation (Rph) of each volume with FSIQ. Columns four and five show the genetic and environmental correlations between the volumes and FSIQ. All values are followed by their 95% confidence intervals (CI).
Sex Differences
The trivariate model was fitted to the data from female and male subjects separately to explore sex differences in the genetic correlation between subcortical volumes and FSIQ. The significant genetic correlation between thalamus volume and FSIQ was not significant in either males or females, although the size of the correlations was similar to the total sample. No other genetic correlations between subcortical volumes and FSIQ could be observed to differ significantly between males and females (Supporting Information Table III).
DISCUSSION
In this study, the relative contributions of genes and environment on the association between intellectual ability and subcortical and cerebral brain volumes were examined using an extended twin design. To our knowledge, this is the first study to show that a significant positive phenotypic correlation between thalamus volume and intellectual ability, which can largely be attributed to a shared genetic variance. This finding indicates that intellectual ability and thalamus volume share in part a set of overlapping genes. The trivariate analysis showed that these same genes also contribute to brain volume. Importantly, none of the other subcortical brain volumes showed a significant correlation with intellectual ability. This finding suggests a special role for the thalamus in intelligence, which might be explained by its central role in many neural information‐processing streams.
Many studies on the neural correlates of intelligence focus heavily on cortical models [Jung and Haier, 2007; Navghani and Nyberg, 2005; Neubauer and Fink, 2009], our results suggest that the thalamus might need to be incorporated in such models. An anatomical argument for this is that the thalamus is connected to every region of the cerebral cortex through cortico‐striato‐thalamic loops and thalamo‐cortical connections [Alexander et al., 1986; Behrens et al., 2003; Caviness and Frost, 1980]. Perhaps its widely distributed network properties [van den Heuvel et al., 2011] make the thalamus particularly suitable to contribute to a general ability such as intellectual ability.
Thalamus volume substantially correlates with brain volume [Hardan et al., 2006; Tsatsanis et al., 2003]. In fact, the thalamus was found to be the most highly correlated subcortical structure with cerebral brain volume in this study. However, confidence intervals were largely overlapping with other volumes such as the hippocampus, amygdala and the pallidum. Of these volumes, only the hippocampus showed a trend towards a correlation with IQ, suggesting that factors unique to the thalamus might also contribute to its correlation with IQ although these did not become significant in the genetic model.
Our results further demonstrate that the correlation between thalamus volume and cerebral brain volume is mostly due to shared genetic variance, indicating a strong common genetic background for these volumes. Especially, this observation was underscored by the additional bivariate analysis. In the bivariate model, both cerebral brain volume and thalamus volume display a significant genetic correlation with IQ. Both volumes remained highly heritable after putting in the other as a covariate. However, adding the covariate extinguished the genetic correlation with IQ for both volumetric measures. Taking into account that the thalamus encompasses on average only 1.3% of cerebral brain volume in our adult sample, this is a remarkable finding. In our view, these findings suggest that thalamus volume is not simply a reflection of CBV. Instead, we propose that it is part of their shared variance that is also implicated in intelligence.
Our finding of highly shared genetic variance between thalamus volume and cerebral brain volume may be explained in the light of early embryonic development. At that time the prosencephalon divides into two parts: the telencephalon and the diencephalon. The telencephalon gives rise to the cortex, striatum, and amygdala‐hippocampal complex, while the diencephalon gives rise to the thalamus and hypothalamus [Blackshaw et al., 2010]. Despite this early division in neural development, the growth of thalamo‐cortical connections already starts at embryonic Day 10 in mice [Lickiss et al., 2012]. Such connections play an essential part in shaping cortical area development and functional differentiation [Kaas et al., 1999; Pallas, 2001]. Although initial functional patterning of the cortex seems to be independent of external signaling from the thalamus, several studies have shown that thalamo‐cortical connections can influence the size and even the identity of cortical areas [López‐Bendito and Molnár, 2003]. Such an early impact on the size and identity of cortical areas possibly puts the thalamus in a position to influence intellectual abilities at later stages in development. In light of these developmental arguments, it may not be surprising that we found substantial genetic overlap between thalamus volume and cerebral brain volume.
Of all subcortical structures measured, the thalamus was the only structure that displayed a significant correlation with intellectual ability. The genetic factor influencing both traits and CBV explains about 5.7% of the total variance in IQ. When only taking into account genetic variance in IQ, 6.6% of the variance was explained by the genetic overlap between IQ, thalamus and brain. Both the genetic and phenotypic correlations between intelligence and hippocampus volume showed a trend towards significance. In the strict sense, our study does not replicate the findings of MacLullich et al. [2002], who report a significant correlation between hippocampus volume and a measure of performance intelligence. This could be related to differences in study samples as the study by MacLullich et al. included only healthy elderly men [MacLullich et al., 2002] while in the present study healthy, young to middle aged adults were investigated. This difference in samples suggests that hippocampus, being a highly neuroplastic structure, might show a different developmental trajectory with IQ over time [Fotuhi et al., 2012]. The trivariate model was fitted to the data from male and female subjects separately to explore whether sex differences might contribute to the genetic correlation between subcortical volume and IQ. If the earlier finding by MacLullich et al. [2002] on the hippocampus and IQ is specific to males, this might have explained why we only found an association at trend level. However, our analysis for sex differences could not detect any significant effects. It is possible that limited statistical power has affected this analysis as the genetic factor influencing CBV, thalamus and IQ failed to reach significance for males and females separately. Therefore, a replication study with larger sample size is needed to test for sex differences conclusively.
There are several limitations in this study that have to be taken into consideration when interpreting its findings. One, overall smaller subcortical volumes had lower heritability estimates then larger volumes, we can therefore not exclude the possibility that the segmentation is less reliable for smaller structures such as the nucleus accumbens and amygdala. However, heritability estimates were high for all structures except the nucleus accumbens. As the lower bound of the confidence intervals for the heritability can be seen as a proxy for segmentation reliability, the results of the trivariate AE model suggest that reliability of the segmentation was at least greater than 70% (see Table 4). Two, although the trivariate decomposition of variance did not reveal a significant genetic relation between thalamus volume and intelligence independent of total brain volume, such influences cannot be completely ruled out, as FSIQ scores were available in 55% of the sample. It could be that this study was statistically underpowered to detect such an effect. Three, the results clearly show a genetic correlation between thalamus volume and intellectual ability. The interpretation of such a correlation is consistent with a partially overlapping set of genes directly influencing both phenotypes, but may also be explained by other mechanisms, including linkage‐disequilibrium, phenotypic causality or environmentally mediated effects of one genetically influenced trait on another [de Moor et al., 2008; Rijsdijk and Sham, 2002]. However, as intellectual ability and brain volume are both complex traits in which additive genetic factors are of major influence [Boomsma et al., 2002; Peper et al., 2007], it is unlikely that a genetic correlation between them is entirely explained by non‐additive factors. Finally, we did not directly assess the thalamo‐cortical networks that may be implicated in the trivariate association between thalamus, cerebral brain volume and intelligence. However, a positive correlation has been found between white matter integrity as measured by diffusion tensor imaging (DTI) and intelligence in the superior thalamic radiation and left posterior thalamic radiation, the latter also showing a genetic component [Chiang et al., 2009]. The white matter fibers of the superior thalamic radiation primarily connect the thalamus to the superior and lateral frontal cortex and primary sensorimotor cortex while the posterior thalamic radiation primarily connects to the (pre)cuneus [Wakana et al., 2004]. These findings suggest that thalamus connections to mainly frontal and parietal cortical areas are likely to be implicated in intelligence, which is in line with studies showing that cortical volume in these areas is associated with intelligence [Jung and Haier, 2007]. Furthermore, thalamic white matter integrity has been shown to be more heritable in individuals with higher intellectual ability [Chiang et al., 2011], emphasizing the influence of thalamic connectivity on this trait.
The hypothesis that the thalamus is an important relay station (hub) in the anatomical organization of intelligence in the brain could be further supported by a DTI network approach, using tractography methods [van den Heuvel et al., 2011]. Future study may reveal to which extent this hub position of the thalamus with its widespread fiber connections to the cerebral cortex is related to intellectual ability as a new twin sample is currently being recruited in which DTI scans are acquired at 3 Tesla. Although our current findings suggest that the thalamus might be part of the cortical network that is associated with intelligence, research on the connections of the thalamus to areas which are known to correlate with intelligence, such as described by the P‐FIT model [Jung and Haier, 2007], would be necessary to support this hypothesis.
In conclusion, our results suggest that larger thalamus volume, and no other subcortical volume, is correlated with higher intellectual ability as measured by IQ. Importantly, we find that shared genes mediate this correlation. When cerebral brain volume is taken into account, our data suggest that a single genetic factor is contributing to all three traits. Possibly, this finding can be explained by thalamo‐cortical connections through which the relatively small thalamus can exert influence on the differentiation of large (cortical) brain areas during development. Through this process, the thalamus is in a position to contribute to brain size and intelligence during later stages in life.
Supporting information
Supplementary Information Table 1
Supplementary Information Table 2
Supplementary Information Table 3
REFERENCES
- Alexander GE, DeLong MR, Strick PL (1986): Parallel organization of functionally linking basal ganglia and cortex. Ann Rev Neurosci 9:357–381. [DOI] [PubMed] [Google Scholar]
- Andreasen NC, Flaum M, Arndt S (1992): The Comprehensive Assessment of Symptoms and History (CASH): An instrument for assessing diagnosis and psychopathology. Arch Gen Psychiatry 49:615–623. [DOI] [PubMed] [Google Scholar]
- Baaré WFC, van Oel CJ, Hulshoff Pol HE, Schnack HG, Durston S, Sitskoorn MM, Kahn RS (2001a): Volumes of Brain Structures in Twins Discordant for Schizophrenia. Arch Gen Psychiatry 58. [DOI] [PubMed] [Google Scholar]
- Baaré, WFC , Hulshoff Pol HE, Kahn RS (2001b). Quantitative genetic modeling of variation in human brain morphology. Cerebral Cortex 816–824. [DOI] [PubMed] [Google Scholar]
- Behrens TEJ, Johansen‐Berg H, Woolrich MW, Smith SM, Wheeler‐Kingshott CM, Boulby P, Barker GJ, et al. (2003): Non‐invasive mapping of connections between human thalamus and cortex using diffusion imaging. Nature Neurosci 6:750–757. [DOI] [PubMed] [Google Scholar]
- Bijl RV, Ravelli A, van Zessen G (1998) : Prevalence of psychiatric disorder in the general population: results of The Netherlands Mental Health Survey and Incidence Study (NEMESIS). Social Psychiatry Psychiatric Epidemiol 33:587–595. [DOI] [PubMed] [Google Scholar]
- Blackshaw S, Scholpp S, Placzek M, Ingraham H, Simerly R, Shimogori T (2010): Molecular pathways controlling development of thalamus and hypothalamus: From neural specification to circuit formation. J Neurosci 30:14925–14930. [DOI] [PMC free article] [PubMed] [Google Scholar]
- Blokland GA, de Zubicaray GI, McMahon KL, Wright MJ (2012): Genetic and environmental influences on neuroimaging phenotypes: A meta‐analytical perspective on twin imaging studies. Twin Res Hum Genet 15:351–371. [DOI] [PMC free article] [PubMed] [Google Scholar]
- Boker S (2011): OPENMX: An open source extended structural equation modeling. Psychometrika 76:306–317. [DOI] [PMC free article] [PubMed] [Google Scholar]
- Boomsma DI, Busjahn A, Peltonen L (2002): Classical twin studies and beyond. Nat Rev Gene 3:872–882. [DOI] [PubMed] [Google Scholar]
- Brans RGH, Kahn RS, Schnack HG, van Baal GCM, Posthuma D, van Haren NEM, Lepage C, et al. (2010): Brain plasticity and intellectual ability are influenced by shared genes. J Neurosci 30:5519–5524. [DOI] [PMC free article] [PubMed] [Google Scholar]
- Caviness VS, Frost DO (1980): Tangential organization of thalamic projections to the neocortex in the mouse. J Comparative Neurol 194:335–367. [DOI] [PubMed] [Google Scholar]
- Chiang MC, Barysheva M, Shattuck DW, Lee AD, Madsen SK, Avedissian C, Klunder AD, et al. (2009): Genetics of brain fiber architecture and intellectual performance. J Neurosci 29:2212–2224. [DOI] [PMC free article] [PubMed] [Google Scholar]
- Chiang MC, McMahon KL, De Zubicaray GI, Martin NG, Hickie I, Toga AW, Wright MJ, et al. (2011): Genetics of white matter development: A DTI study of 705 twins and their siblings aged 12 to 29. NeuroImage 54:2308–2317. [DOI] [PMC free article] [PubMed] [Google Scholar]
- Dominicus A, Skrondal A, Gjessing HK, Pedersen NL, Palmgren J (2006): Likelihood ratio tests in behavioral genetics: problems and solutions. Behav Gene 36:331–340. [DOI] [PubMed] [Google Scholar]
- van Dongen J, Slagboom PE, Draisma HHM, Martin NG, Boomsma DI (2012): The continuing value of twin studies in the omics era. Nat Rev Gene 13:640–653. [DOI] [PubMed] [Google Scholar]
- Fischl B, Salat DH, Busa E, Albert M, Dieterich M, Haselgrove C, van der Kouwe A, et al. (2002): Whole brain segmentation: Automated labeling of neuroanatomical structures in the human brain. Neuron 33:341–355. [DOI] [PubMed] [Google Scholar]
- Fischl B (2004): Automatically parcellating the human cerebral cortex. Cerebral Cortex 14:11–22. [DOI] [PubMed] [Google Scholar]
- Fotuhi M, Do D, Jack C (2012): Modifiable factors that alter the size of the hippocampus with ageing. Nature reviews. Neurology 8:189–202. [DOI] [PubMed] [Google Scholar]
- Frangou S, Chitins X, Williams SCR (2004): Mapping IQ and gray matter density in healthy young people. NeuroImage 23 :800–805. [DOI] [PubMed] [Google Scholar]
- Gold G, Kövari E, Herrmann FR, Canuto A, Hof PR, Michel JP, Bouras C, et al. (2005): Cognitive consequences of thalamic, basal ganglia, and deep white matter lacunes in brain aging and dementia. Stroke 36:1184–1188. [DOI] [PubMed] [Google Scholar]
- Goldman AL, Pezawas L, Mattay VS, Fischl B, Verchinski BA, Zoltick B, Weinberger DR, Meyer‐Lindenberg A. (2007). Heritability of brain morphology related to schizophrenia : A large‐scale automated magnetic resonance imaging segmentation study. Biological Psychiatry. [DOI] [PubMed] [Google Scholar]
- Haier RJ, Jung RE, Yeo R, Head K, Alkire MT (2004): Structural brain variation and general intelligence. NeuroImage 23:425–433. [DOI] [PubMed] [Google Scholar]
- Haier RJ, Jung RE, Yeo R, Head K, Alkire MT (2005): The neuroanatomy of general intelligence: Sex matters. NeuroImage 25:320–327. [DOI] [PubMed] [Google Scholar]
- Haier RJ, Colom R, Schroeder DH, Condon CA, Tang C, Eaves E, Head K (2009): Intelligence Gray matter and intelligence factors : Is there a neuro‐g ? Intelligence 37:136–144. [Google Scholar]
- Hardan AY, Girgis RR, Adams J, Gilbert AR, Keshavan MS, Minshew NJ (2006): Abnormal brain size effect on the thalamus in autism. Psychiatry Res 147(2–3):145–151. [DOI] [PubMed] [Google Scholar]
- Haworth CM, Wright MJ, Luciano M, Martin NG, de Geus EJC, van Beijsterveldt CEM, Bartels M, et al. (2010): The heritability of general cognitive ability increases linearly from childhood to young adulthood. Mol Psychiatry 15:1112–1120. [DOI] [PMC free article] [PubMed] [Google Scholar]
- van den Heuvel MP, Sporns O (2011): Rich‐club organization of the human connectome. J Neurosci 31:15775–15786. [DOI] [PMC free article] [PubMed] [Google Scholar]
- Hulshoff Pol HE, Posthuma D, Baaré WFC, De Geus EJC, Schnack HG, van Haren NEM, van Oel CJ, et al. (2002): Twin‐singleton differences in brain structure using structural equation modelling. Brain 125(Part 2):384–390. [DOI] [PubMed] [Google Scholar]
- Hulshoff Pol HE, Schnack HG, Posthuma D, Mandl RCW, Baaré WF, van Oel C, van Haren NEM, et al. (2006): Genetic contributions to human brain morphology and intelligence. J Neurosci 26:10235–10242. [DOI] [PMC free article] [PubMed] [Google Scholar]
- Jung RE, Haier RJ (2007): The Parieto‐Frontal Integration Theory (P‐FIT) of intelligence: Converging neuroimaging evidence. Behav Brain Sci 30:135–154; discussion 154–187. [DOI] [PubMed] [Google Scholar]
- Kaas JH (1999): Commentary is most of neural plasticity in the thalamus cortical ?, 96(July), 7622–7623. [DOI] [PMC free article] [PubMed]
- Lickiss T, Cheung AF, Hutchinson CE, Taylor JS, Molnar Z (2012): Examining the relationship between early axon growth and transcription factor expression in the developing cerebral cortex. J Anat 220 :201–211. [DOI] [PMC free article] [PubMed] [Google Scholar]
- López‐Bendito G, Molnár Z (2003) : Thalamocortical development: How are we going to get there? Nature reviews. Neuroscience 4:276–289. [DOI] [PubMed] [Google Scholar]
- McDaniel M (2005). Big‐brained people are smarter: A meta‐analysis of the relationship between in vivo brain volume and intelligence. Intelligence 33:337–346. [Google Scholar]
- MacLullich MJ, Ferguson KJ, Deary IJ, Seckl JR, Starr JM, Wardlaw JM (2002): Intracranial capacity and brain volumes are associated with cognition in healthy elderly men. Neurology 59:169–174. [DOI] [PubMed] [Google Scholar]
- de Moor, MHM , Boomsma DI, Stubbe JH, Willemsen G, de Geus, EJ (2008): Testing causality in the assciation between regular exercise and symptoms of anxiety and depression. Arch Gen Psychiatry 65:897–905. doi: 10.1001/archpsyc.65.8.897. [DOI] [PubMed] [Google Scholar]
- Naghavi HR, Nyberg L (2005): Common fronto‐parietal activity in attention, memory, and consciousness: Shared demands on integration? Consciousness Cogn 14:390–425. [DOI] [PubMed] [Google Scholar]
- Neale MCCL, Cardon LR (1992): Methodology for genetic studies of twins and families (No. 67). Springer. [Google Scholar]
- Neubauer AC, Fink A (2009): Intelligence and neural efficiency. Neurosci Biobehav Rev 33:1004–1023. [DOI] [PubMed] [Google Scholar]
- Pallas SL (2001): Intrinsic and extrinsic factors that shape neocortical specification. Trends Neurosci 24:417–423. [DOI] [PubMed] [Google Scholar]
- Pennington BF, Filipek P, Lefly D, Chhabildas N, Kennedy DN, Simon JH, Filley CM, et al. (2000): A twin MRI study of size variations in human brain. J Cogn Neurosci 12:223–232. [DOI] [PubMed] [Google Scholar]
- Peper JS, Brouwer RM, Boomsma DI, Kahn RS, Hulshoff Pol HE (2007): Genetic influences on human brain structure: A review of brain imaging studies in twins. Hum Brain Mapp 28:464–473. [DOI] [PMC free article] [PubMed] [Google Scholar]
- Posthuma D, Boomsma DI (2000): A note on the statistical power in extended twin designs. Behav Genet 30:147–158. [DOI] [PubMed] [Google Scholar]
- Posthuma D, de Geus EJC, Neale MC, Hulshoff Pol HEH, Baaré WEC, Kahn RS, Boomsma DI (2000): Multivariate genetic analysis of brain structure in an extended twin design. Behav Gene 30:4. [DOI] [PubMed] [Google Scholar]
- Posthuma D, Baaré WFC, Hulshoff Pol HE, Kahn RS, Boomsma DI, De Geus EJC (2003): Genetic correlations between brain volumes and the WAIS‐III dimensions of verbal comprehension, working memory, perceptual organization, and processing speed. Twin Res 6:131–139. [DOI] [PubMed] [Google Scholar]
- Posthuma D, de Geus EJC, Baaré W, Hulshoff Pol HE, Kahn RS, Boomsma DI (2002): The association between brain volume and intelligence is of genetic origin. Nat Neurosci 5:83–84. [DOI] [PubMed] [Google Scholar]
- R Core Team (2012): R: A language and environment for statistical computing. R Foundation for Statistical Computing, Vienna, Austria. ISBN 3–900051‐07‐0, URL http://www.R-project.org/.
- Rijsdijk FV, Sham PC (2002): Analytic approaches to twin data using structural equation models. Briefings Bioinformatics 3:119–133. [DOI] [PubMed] [Google Scholar]
- Rimol LM, Panizzon MS, Fennema‐Notestine C, Eyler LT, Fischl B, Franz CE, Hagler DJ, et al. (2010): Cortical thickness is influenced by regionally specific genetic factors. Biological Psychiatry 67:493–499. [DOI] [PMC free article] [PubMed] [Google Scholar]
- Shaw P, Greenstein D, Lerch J, Clasen L, Lenroot R, Gogtay N, Evans A, et al. (2006): Intellectual ability and cortical development in children and adolescents. Nature 440:676–679. [DOI] [PubMed] [Google Scholar]
- van Soelen ILC, Brouwer RM, van Baal GCM, Schnack HG, Peper JS, Collins DL, Evans AC, Kahn RS, Boomsma DI, Hulshoff Pol HE. (2012a): Genetic influences on thinning of the cerebral cortex during development. NeuroImage 59:3871–3880. [DOI] [PubMed] [Google Scholar]
- Van Soelen ILC, Brouwer RM, Peper JS, van Leeuwen M, Koenis MMG, Van Beijsterveldt TCEM, Swagerman SC, Kahn RS, Hulshoff Pol HE, Boomsma DI. (2012b): Brain SCALE: Brain structure and cognition: An adolescent longitudinal twin study into the genetic etiology of individual differences. Twin Res Hum Gene 15:453–467. [DOI] [PubMed] [Google Scholar]
- Thompson P, Cannon TD, Narr KL, Erp TV, Poutanen V, Huttunen M, Lönnqvist J, et al. (2001): Genetic influences on brain structure. Nat Neurosci 4:1–6. [DOI] [PubMed] [Google Scholar]
- Toga AW, Thompson PM (2005): Genetics of brain structure and intelligence. Ann Rev Neurosci 28:1–23. [DOI] [PubMed] [Google Scholar]
- Toulopoulou T, Picchioni M, Rijsdijk F, Hua‐Hall M, Ettinger U, Sham P, Murray R (2007): Substantial genetic overlap between neurocognition and schizophrenia. Arch Gen Psychiatry 64:1348–1355. [DOI] [PubMed] [Google Scholar]
- Tsatsanis KD, Rourke BP, Klin A, Volkmar FR, Cicchetti D, Schultz RT (2003): Reduced thalamic volume in high‐functioning individuals with autism. Biol Psychiatry 53:121–129. [DOI] [PubMed] [Google Scholar]
- van der Werf YD, Tisserand DJ, Visser PJ, Hofman PA, Vuurman E, Uylings HB, Jolles J (2001): Thalamic volume predicts performance on tests of cognitive speed and decreases in healthy aging. A magnetic resonance imaging‐based volumetric analysis. Cognitive Brain Res 11:377–385. [DOI] [PubMed] [Google Scholar]
- Wakana S, Jiang H, Nagae‐Poetscher L, Zijl PCM , Van Mori S (2004): Radiology Fiber Tract – Based Atlas of Human White Matter Anatomy. Radiology 230:77–87. [DOI] [PubMed] [Google Scholar]
- White T, Andreasen NC, Nopoulos P (2002): Brain volumes and surface morphology in monozygotic twins. Cerebral Cortex 12:486–493. [DOI] [PubMed] [Google Scholar]
Associated Data
This section collects any data citations, data availability statements, or supplementary materials included in this article.
Supplementary Materials
Supplementary Information Table 1
Supplementary Information Table 2
Supplementary Information Table 3