

Abstract
Impairment in controlled semantic association is a central feature of schizophrenia, and the goal of the current functional magnetic resonance imaging study was to identify the neural correlates of this impairment. Thirty people with schizophrenia and 30 healthy age‐ and gender‐matched control subjects performed a task requiring participants to match word pairs that varied in semantic distance (distant vs. close). A whole‐brain multivariate connectivity analysis revealed three functional brain networks of primary interest engaged by the task: two configurations of a multiple demands network, in which brain activity did not differ between groups, and a semantic integration network, in which coordinated activity was reduced in schizophrenia patients relative to healthy controls, for distantly relative to closely related word pairs. The hypoactivity during controlled semantic integration in schizophrenia reported here, combined with hyperactivity in automatic semantic association reported in the literature, suggests an imbalance between controlled integration and automatic association. This provides a biological basis for Bleuler's concept of schizophrenia as a “split mind” arising from an impaired ability to form coherent associations between semantic concepts. Hum Brain Mapp 36:2948–2964, 2015. © 2015 Wiley Periodicals, Inc.
Keywords: schizophrenia, functional magnetic resonance imaging, functional connectivity, constrained principal component analysis, semantic association, semantic integration, semantic distance
INTRODUCTION
When Bleuler coined the term schizophrenia [Bleuler, 1911], the “split mind” to which he referred was primarily based on the observation of impaired association (i.e., split or schizo) of semantic concepts (i.e., mind or phrenia) during observed speech. Accordingly, association of semantic concepts has been the focus of a number of empirical investigations of schizophrenia, typically focusing on automatic semantic association using semantic priming [Kiang et al., 2008; Moritz et al., 2003; Spitzer, 1997; Vistoli et al., 2011]. Functional neuroimaging studies of semantic priming in schizophrenia have reported hyperactivity in language areas such as the inferior prefrontal and temporal cortices [Kuperberg et al., 2007], suggesting that this hyperactivity “may be a neural correlate of the abnormal associative activity conceived by Bleuler as being fundamental to understanding positive thought disorder and schizophrenia psychosis as a whole” [Kuperberg et al., 2007, p. 149].
In addition to automatic semantic association, cognitive control processes are required when integrating semantic concepts in working memory (WM) during everyday communication [Hagoort, 2013]. This poses a problem for people with schizophrenia, due to their well‐documented impairments in controlled cognitive processes such as WM and sustained attention [Heinrichs and Zakzanis, 1998]. Thus, identification of the neural correlates of controlled semantic integration impairments in schizophrenia is important for understanding the biological substrates of the illness. Some functional neuroimaging investigations into schizophrenia have studied controlled judgments about semantic information, such as abstract/concrete judgments [Kubicki et al., 2003], processing incongruous sentences [Kuperberg et al., 2008], and yes/no decisions about the presence of semantic relations [Jamadar et al., 2013]. However, functional neuroimaging investigations into schizophrenia using controlled selection of semantically associated word pairs, combined with manipulation of semantic “load” by varying semantic distance, have not been carried out. Such a parametric approach can facilitate interpretation of the function of brain activity, under the assumption that cognitive processes involved in semantic association should be engaged to a greater degree as semantic integration demands increase. This functional magnetic resonance imaging (fMRI) study directly investigated the anatomical substrates of controlled semantic integration in schizophrenia using a word association task, and used semantic distance of word pairs as a load manipulation.
Increasing the semantic distance of the to‐be‐associated word pairs should engage a functional brain network that subserves language‐specific processing, which we will refer to as the semantic integration network (SIN). It should also engage a second anatomically distinct network that subserves multiple cognitive demands related to task performance in general, referred to as the multiple demands network [MDN; Duncan and Owen, 2000; Fedorenko et al., 2013]. The SIN involves activity in the left inferior (ventrolateral) prefrontal cortex due to controlled retrieval of semantic information [Wagner et al., 2001], and/or selection of information among competing alternatives [Thompson‐Schill et al., 1997, 1999; Van Petten and Luka, 2006]. The left middle temporal cortex, which is involved in storage of semantic knowledge [Badre et al., 2005; Lau et al., 2008], should also emerge on the SIN. In fMRI studies with healthy subjects, processing word pairs with increasing semantic distance led to increased activity in the SIN; for example, activity in left inferior (ventrolateral) prefrontal cortex and left middle temporal cortex was greater when processing distant semantic associations compared to close semantic associations [Bunge et al., 2005; Gold et al., 2006; Wagner and Davachi, 2001]. The MDN involves a set of frontal and parietal brain regions in which activity increases in response to a wide range of resource‐demanding neurocognitive processes including focused attention, goal maintenance, strategy selection, performance monitoring, aspects of perception, response selection, executive control, WM, episodic memory, and problem solving. Regions of the dorsolateral prefrontal cortex, insular cortex, somatosensory and motor cortices, and anterior/midcingulate cortex comprise this network [Duncan and Owen, 2000; Fedorenko et al., 2013].
All of the investigations into controlled judgments about semantic information mentioned above used univariate analysis methods. However, because the MDN and SIN are active in parallel during controlled semantic integration, univariate task‐based regression methods cannot isolate their unique functionality, but instead limit observations of brain activity to the combined spatial and temporal effects of the MDN and SIN. Even in well‐controlled experiments designed to separate them, the MDN and SIN remain very difficult to parse with univariate analysis methods [e.g., Badre et al., 2005; Gold et al., 2006]. In contrast, multivariate methods allow quantification of the coordinated task‐based activity of multiple distinct, simultaneously active functional brain networks. In this study, we used constrained principal component analysis for fMRI (fMRI‐CPCA; http://www.nitrc.org/projects/fmricpca) to identify these networks. fMRI‐CPCA estimates subject‐ and condition‐specific hemodynamic response (HDR) shapes for multiple functional networks using a finite impulse response (FIR) model, which makes no a priori assumptions concerning the shape of the HDR [Henson et al., 2001]. Since condition‐specific HDR shapes are derived for every subject, these HDR shapes can be compared across groups, a methodology that referred to as group fMRI‐CPCA [see Lavigne et al., 2015a for another application of group fMRI‐CPCA]. Thus, group fMRI‐CPCA was used to separately estimate task‐related fluctuations in blood‐oxygen level dependent (BOLD) responses in the MDN and SIN, and compare the coordinated activity in those networks across groups.
One of the major theoretical accounts of brain dysfunction in schizophrenia proposes a disconnection syndrome, specifically implicating prefrontal and temporal regions [Fletcher et al., 1999; Frith et al., 1995; Li et al., 2009; Stephan et al., 2009], which would predict a reduction in coordinated activity in the SIN in schizophrenia patients during controlled semantic integration. Correspondingly, in past work, it has been shown that when processing incongruous (relative to congruous) sentences, concrete (relative to abstract) sentences, and for abstract/concrete judgments, schizophrenia patients failed to recruit prefrontal regions of the SIN [Kubicki et al., 2003; Kuperberg et al., 2008]. In contrast, in WM studies, people with schizophrenia show reduced efficiency in the MDN, such that greater activation was required to match the performance of controls, even under moderate cognitive loads [Callicott et al., 2003; Karlsgodt et al., 2009; Metzak et al., 2012, Components 2 and 3]. Therefore, in this study, we expected that (1) the MDN and SIN would be spatially and temporally separable in both people with schizophrenia and healthy controls, (2) coordinated activity in both networks would increase as the semantic distance between word pairs increased in both groups, (3) coordinated activity in the MDN would be increased for people with schizophrenia relative to healthy controls for closely associated word pairs due to inefficient processing, and (4) coordinated activity in the SIN would be reduced for people with schizophrenia relative to healthy controls for distantly associated word pairs due to a frontotemporal disconnection syndrome thought to be characteristic of schizophrenia.
METHODS
Participants
The participants were 30 patients with a diagnosis of schizophrenia or schizoaffective disorder, recruited from psychiatric hospitals and community mental health agencies, and 30 healthy control subjects, recruited via advertisements and word‐of‐mouth, around Vancouver, British Columbia, Canada. Age, education, sex, handedness, and estimated intelligence quotient (IQ) summaries are presented in Table 1. The mini‐international neuropsychiatric interview [Sheehan et al., 1998] was administered on the date of MRI testing to confirm diagnoses. Patients' symptoms were assessed using the Signs and Symptoms of Psychotic Illness (SSPI) scale [Liddle et al., 2002].
Table 1.
Mean age, education, sex, handedness, and IQ presented as a function of group
| Controls | Patients | Statistical comparison | |
|---|---|---|---|
| Mean Age (SD) | 26.8 (6.11) | 30.5 (8.92) | t(58)=1.87, p = .06 |
| Mean Education (SD) | 15.80 (3.72) | 13.43 (1.85) | t(58)=3.11, p < .01 |
| Sex | 13 male; 17 female | 17 male; 13 female | χ2(1) = 1.07, p = .44 |
| Handedness | 28 right; 2 left | 29 right; 1 left | χ2(1) = 0.35, p = .55 |
| Estimated IQ (Quick) | 101.75 (12.23) | 100.63 (11.79) | t(57)=0.37, p = .72a |
Standard deviations in parentheses
IQ estimate missing for one schizophrenia patient. IQ = intelligence quotient.
All patients were taking stable doses of antipsychotic medications at the time of testing, and had no current or prior history of psychiatric illness. All participants gave written informed consent prior to participation, were screened for MRI compatibility, and were compensated $10/h. Participants were excluded if they had ever been diagnosed with a neurological illness, or ever suffered a head injury resulting in a loss of consciousness for 10 or more minutes. Substance use, including alcohol use, was assessed by chart review and interview, and participants were excluded if they currently met DSM‐IV‐TR [Association, 2000] criteria for a substance‐related disorder. Three patients and two control subjects in the original data set were excluded from the analysis set because of head motion during fMRI scanning or incomplete data, resulting in the sample sizes reported above. The University of British Columbia clinical research ethics board approved all experimental procedures.
Semantic Integration Task
The controlled semantic integration task involved selecting the word that was most closely associated with a prompt word from a choice of three possible match options. Only one of the match options was related to the prompt word. Prior to entering the scanner, participants were instructed that during each trial, four words would be presented: a prompt word (e.g., ARCHER) at the top of the presentation screen, and three potential semantic matches (e.g., ARROW, DIME, and OVAL) below (see Fig. 1 for task timing information). Participants were instructed to choose the match word that was most clearly related to the prompt word, using their index (left word), middle (middle word), or ring (right word) fingers. Further, they were instructed that if none of the potential semantic matches seemed related to the prompt word, they should choose the word that best fits according to any relationship that made sense to them. During “Relax” trials, participants were instructed to relax and clear their mind.
Figure 1.
Timeline of the experimental procedure. During each trial a word quadruplet was presented that consisted of a prompt word (e.g., ARCHER) at the top of the presentation screen, and three potential semantic matches (e.g., ARROW, DIME, and OVAL) below. Participants chose the match word that was most related to the prompt word, using their index (left word), middle (middle word), or ring (right word) fingers. Instructions for the task were displayed for 4 s: “Which of the three words below is most associated with the word above?” Following this, the word association trials were presented. The word quadruplets were shown on the screen until a response was made, and this was followed by a blank screen for the remainder of the 7 s. A fixation asterisk was displayed for 1 s prior to each event.
One hundred nouns were pseudorandomly selected (to span the alphabet) from the South Western Ontario Semantic Neighbourhood Database [Durda and Buchanan, 2006] to serve as prompt words in the practice and functional runs of the task. The top 100 semantic associates for each prompt word were also generated from the database, and were divided into three groups: close associates (100–67), moderate associates (66–33), and distant associates (32–1). A 3–10 letter semantic associate (either a close or a distant associate with a probability of 0.5) was selected as the “target” word for each prompt word. Further, two unassociated words (selected from a different prompt word's list of semantic associates) were selected to be the “nontarget” companion word options for each prompt word. All prompt words were excluded from the lists of potential match words. The Edinburgh Associative Thesaurus [EAT; Kiss et al., 1973] was used to confirm that the unassociated match words were not associated with the prompt words nor with each other. Unassociated match words that were not included in the EAT were determined to be unassociated by consensus of the research staff. The location of the “target” word among the three match options was pseudorandomly determined, with an equal number of left, middle, and right occurrences.
Before entering the scanner, subjects completed a practice run of 10 association trials. During the scanned functional run, they were presented with 90 association trials. All participants were presented with the same association trials, in a randomized order, for the practice and functional runs. In the scanner, experimental stimuli shown via Presentation software (version 9.70, http://www.neurobs.com) were projected onto a screen fastened at the entrance of the magnet bore. Participants viewed the screen using a mirror mounted onto the head coil. They indicated their responses by pressing one of three buttons on an MRI‐compatible response box, with the second, third, or fourth digit of their dominant hand signaling left, middle, and right words, respectively.
First, the words “Here we go!” were displayed for 4 s to signal the start of the experiment. Next, instructions for the task were displayed for 4 s: “Which of the three words below is most associated with the word above?” Following this, the 90 word association trials were presented for 7 s each. The word quadruplets were shown on the screen until a response was made, and were followed by a blank screen for the remainder of the 7 s. A fixation asterisk was displayed for 1‐s prior to each event to cue participants that the stimulus was about to be presented. Four 9‐s blank trials, in which the word “Relax” was presented on the screen, were pseudorandomly inserted throughout the trials to improve efficiency of the experimental design [Dale, 1999; Serences, 2004]. The duration of the functional run was 14 min and 15 s. Trials in which the subject did not respond (fewer than 1% of all trials) were excluded from all functional and behavioral analyses.
Image Acquisition
Imaging was performed at the University of British Columbia's MRI Research Centre on a Phillips Achieva 3.0 Tesla MRI scanner with Quasar Dual Gradients (maximum gradient amplitude 80 mT/m and maximum slew rate 200 mT/m/s). The participant's head was firmly secured using a custom head holder. Functional image volumes were collected using a T2*‐weighted gradient echo spin pulse sequence (repetition time [TR]/echo time [TE] = 2,000/30 ms, flip angle 90°, 36 slices, 3 mm thick, 1 mm gap, sense factor 2, 80 × 80 matrix reconstructed at 128, field of view [FOV] 240.0 mm, measured voxel = 1.875 × 1.875 × 3.972 mm3, actual band width = 53.4 Hz per pixel) effectively covering the whole brain (145 mm axial extent). Functional images were reconstructed offline, and the scan series was realigned and normalized using the method implemented in Statistical Parametric Mapping 8 (SPM8; http://www.fil.ion.ucl.ac.uk/spm). Translation and rotation corrections did not exceed 3 mm or 3° for any of the participants. Parameters for spatial normalization into the Montreal Neurological Institute (MNI) coordinate space used in SPM8 were determined by warping mean functional images constructed from the realigned images of each participant and scan series to the SPM8 echo planar imaging [EPI] template. Voxels were normalized to 3 × 3 × 3 mm3. The normalized functional images were smoothed with an 8 mm full width at half maximum Gaussian filter. All X Y Z coordinates listed in this manuscript are MNI coordinates.
Data Analysis
CPCA for fMRI
fMRI data analysis was carried out using group fMRI‐CPCA (http://www.nitrc.org/projects/fmricpca). The theory and proofs for CPCA are detailed in previously published work [Hunter and Takane, 2002; Takane and Shibayama, 1991]. Briefly, fMRI‐CPCA combines multivariate multiple regression analysis and principal component analysis into a unified framework to reveal multiple independent sources of poststimulus fluctuations in brain activity. fMRI‐CPCA is able to (1) identify multiple functional brain networks simultaneously involved in executing a cognitive task, (2) estimate the Poststimulus Time course of coordinated BOLD activity fluctuations associated with each functional network, and (3) statistically test the effect of experimental manipulations and group differences on BOLD activity in each functional brain network.
Matrix equations
We now present a brief summary of the logic and matrix equations for fMRI‐CPCA. Broadly speaking, whole‐brain BOLD activity variance was partitioned into task‐related and task‐unrelated fluctuations using multivariate multiple regression. Orthogonal sources (components) of task‐related BOLD activity fluctuations were then determined using PCA. Functional brain networks associated with each orthogonal source of BOLD variance were spatially interpreted by examining the voxels whose activity dominated each component/network, and temporally interpreted by statistically assessing the HDR shape associated with each component.
Two matrices were prepared for the fMRI‐CPCA analysis. The first matrix, Z, contained the intensity values for the normalized and smoothed BOLD time‐series of each voxel, with one column per voxel and one row per TR or scan. Subject‐specific data sets (both patients and controls) were stacked vertically to produce Z. The second matrix, G, consisted of a FIR basis set, which was used to estimate the increase in BOLD signal at specific poststimulus scans relative to all other scans. The value 1 is placed in rows of G for which BOLD signal amplitude is to be estimated, and the value 0 in all other rows (“mini boxcar” functions). The time points for which a basis function was specified in this study were the 1st–10th scans following stimulus presentation. Since the TR for these data was 2 s, resulting in estimating BOLD signal changes over a 20 s window, with the start of the first time point (time = 0) corresponding to stimulus onset. A G matrix was created that estimated subject‐ and condition‐specific effects by including a separate FIR basis set for each condition and for each subject. The columns in this subject‐ and condition‐based G matrix code 10 points of Poststimulus Time for each of the two conditions (distant and closely related words) for each of the 60 subjects, totalling 1,200 columns (10 × 2 × 60 = 1,200). Each column of Z and G were standardized for each subject separately.
The matrix of BOLD time series (Z) and the design matrix (G) were input to group fMRI‐CPCA, with BOLD signal in Z being predicted from the FIR model in G. To achieve this, multivariate least‐squares linear multiple regression was carried out, whereby the BOLD time series (Z) was regressed onto the design matrix (G):
| (1) |
where . The C matrix represents condition‐specific regression weights, which are akin to the beta images produced by conventional univariate fMRI analyses. GC represents the variability in Z that was predictable from the design matrix G (i.e., the task‐related variability in Z).
Subsequently, singular value decomposition (of which PCA is a special case) was used to extract components in GC that represented temporally orthogonal functional brain networks in which BOLD activity fluctuated coherently with experimental stimuli. The singular value decomposition of GC resulted in:
| (2) |
where U = matrix of left singular vectors; D = diagonal matrix of singular values; and V = matrix of right singular vectors. After reduction of dimensionality, each column of , where m is the number of columns in Z, was overlaid on a structural brain image to allow spatial visualization of the brain regions dominating each functional network. The rescaled VD is referred to as a loading matrix, and the values are correlations between the components scores (in U) and the variables in GC.
Predictor weights
To interpret the functional brain networks with respect to the conditions represented in G, predictor weights in matrix P are produced. These are the weights that, when applied to each column of the matrix of predictor variables (G), create U (U = GP). Thus, the P matrix relates each column of the G matrix to the component scores in U, and provides information about the similarity of the fluctuation of the BOLD signal over all scans to the FIR model coded into G. For the current analysis, this would provide 1,200 values per functional brain network, one for each combination of poststimulus scan, subject, and condition. Each subject‐ and condition‐specific set of predictor weights is expected to take the shape of a HDR, with the highest values corresponding to the HDR peaks.
Repeated measures analysis of variance of predictor weights
Predictor weights were produced for each point in Poststimulus Time, each condition and each subject, and then submitted to an analysis of variance (ANOVA) to test for (1) reliability of each component, (2) differences between conditions in the activation of each functional brain network, and (3) differences between groups in the activation of each functional brain network. To achieve this, predictor weights were submitted to a 10 × 2 × 2 mixed‐model ANOVA, with Poststimulus Time point (10 TRs or full‐brain scans) and Relatedness (distantly vs. closely related word pairs) as within‐subjects factors, and Group (patient vs. controls) as a between‐subjects factor. Tests of sphericity were carried out for all repeated measures ANOVAs. In the cases where this assumption was violated, the Greenhouse‐Geisser adjustment to degrees of freedom was carried out, and did not affect any of the results. Therefore, the unadjusted degrees of freedom are reported below.
RESULTS
Behavioural Results
Mean response times (RTs) are reported in Table 2 as a function of Relatedness and Group. They were analyzed in a 2 × 2 mixed‐model ANOVA, with Relatedness (distantly vs. closely related word pairs) as a within‐subjects factor, and Group (patient vs. controls) as a between‐subjects factor. Overall, matching distant associations (M = 1,713 ms) was slower than matching close associations (M = 1,182 ms), F(1,58) = 496.94, P < 0.001. There were no significant effects involving the Group factor (main effect P > 0.1, interaction P > 0.6).
Table 2.
Mean (SD) response time in milliseconds as a function of semantic distance and group
| Semantic Distance | Controls | Patients | Statistical Test |
|---|---|---|---|
| Close | 1132 (24.68) | 1231 (25.92) | t(58)=1.45, p = .15 |
| Distant | 1654 (30.88) | 1772 (36.83) | t(58)=1.51, p = .14 |
Imaging
fMRI‐CPCA revealed multiple independent sources of task‐related variance in BOLD activity. The percentage of task‐related brain activity variance accounted for by each rotated component was visualized using a screen plot, which suggested a four‐component solution accounting for 14.18, 7.20, 3.04, and 1.86%, for Components 1–4, respectively. Component rotation was not carried out because the unrotated solution was interpretable and produced biologically valid HDR shapes. Components 1 and 2 reflected distinct functional configurations of the MDN, overlapping substantially with a known MDN template [Fedorenko et al., 2013]. Component 3 reflected the SIN, overlapping substantially with brain regions identified in previous studies of semantic integration [e.g., Badre et al., 2005; Gold et al., 2006; Wagner et al., 2001]. Component 4 was characterized by activation peaks in the bilateral superior medial frontal gyrus (BA 9/10), bilateral inferior frontal operculum (BA 44) and dorsal anterior cingulate cortex (dACC; BA 32), and deactivations in the bilateral inferior frontal gyri (BA 11) and insula. Component 4 did not reflect the MDN or SIN, and thus is not discussed further; however, details about this component are presented as Supporting Information.
Multiple demands network
The functional brain network associated with positive loadings for Component 1 (Fig. 2A and Table 3) is part of the MDN. The pattern of estimated BOLD responses (CPCA predictor weights) suggests that Component 1 defines a response‐based functional configuration of the MDN (Fig. 2b). This is because condition‐specific HDR peaks were staggered in time as would be expected due to longer RTs for the distantly related condition. In addition, the height of the peaks did not differ between distantly and closely related word pairs, suggesting this network did not mediate cognitive operations related to either general task demands or semantic association. Predictor weights reflecting the estimated HDR for Component 1 were entered into a mixed‐model ANOVA, and there were significant main effects of Poststimulus Time, F(9,522) = 38.31, P < 0.001, and Relatedness, F(1,58) = 16.22, P < 0.001, and a significant Poststimulus Time × Relatedness interaction, F(9,522) = 22.52, P < 0.001, caused by an earlier peak for close associations than distant associations. The interaction was strongest between 7 and 9 s, F(1,58) = 104.23, P < 0.001, due to the activity falling off the peak at 7 s for close associations, but increasing to the peak at 9 s for distant associations, clearly indicating an earlier peak for close associations than distant associations. No significant main effects or interactions involving Group emerged (all Ps > 0.28).
Figure 2.
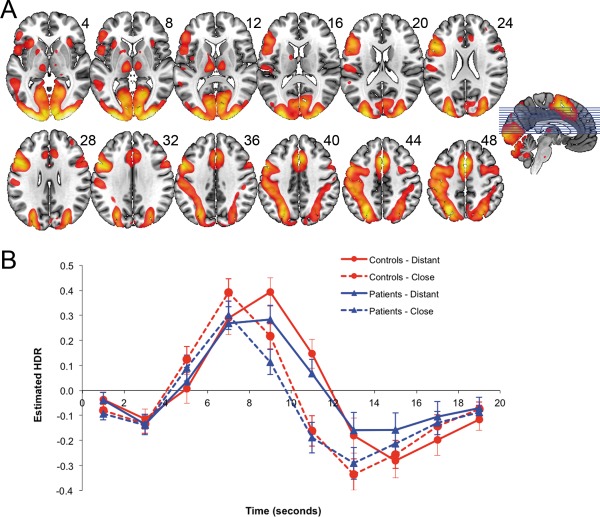
A (top): dominant 20% of component loadings for MDN Component 1 (red/yellow = positive loadings, threshold = 0.12, max = 0.38). MNI Z‐axis coordinates are displayed. Images are displayed in neurological orientation (left is left). B (bottom): mean FIR‐based predictor weights plotted as a function of Poststimulus Time. [Color figure can be viewed in the online issue, which is available at http://wileyonlinelibrary.com.]
Table 3.
Cluster volumes for the most extreme 10% of Component 1 loadings, with anatomical labels, Brodmann's areas, and MNI coordinates for the peak of each subcluster
| Anatomical label | Cluster volume (voxels) | Brodmann's area for peak locations | MNI coordinate for peak locations | ||
|---|---|---|---|---|---|
| x | y | z | |||
| Positive loadings | |||||
| Cluster 1: bilateral | 24,575 | ||||
| Occipital pole | 18 | 30 | ‐100 | ‐4 | |
| Occipital pole | 18 | ‐34 | ‐98 | ‐6 | |
| Occipital pole | 17 | 20 | ‐104 | ‐4 | |
| Lateral occipital cortex, inferior division | 19 | ‐40 | ‐80 | ‐16 | |
| Occipital fusiform gyrus | 18 | ‐28 | ‐86 | ‐18 | |
| Occipital fusiform gyrus | 18 | 22 | ‐80 | ‐14 | |
| Lingual gyrus | 18 | 12 | ‐84 | ‐14 | |
| Superior parietal lobule | 7 | ‐28 | ‐66 | 52 | |
| Inferior frontal gyrus, pars opercularis | 44 | ‐52 | 10 | 32 | |
| Premotor cortex | 6 | ‐42 | ‐10 | 58 | |
| Occipital pole | 17 | ‐8 | ‐98 | ‐2 | |
| Lateral occipital cortex, inferior division | 19 | 42 | ‐70 | ‐18 | |
| Occipital fusiform gyrus | 19 | 38 | ‐64 | ‐20 | |
| Intracalcarine cortex | 17 | 20 | ‐64 | 4 | |
| Lateral occipital cortex, superior division | 19 | ‐28 | ‐82 | 24 | |
| Intracalcarine cortex | 17 | ‐12 | ‐78 | 8 | |
| Lateral occipital cortex, superior division | 19 | 30 | ‐76 | 26 | |
| Intracalcarine cortex | 17 | ‐14 | ‐68 | 4 | |
| Cerebellum VI | n/a | ‐40 | ‐52 | ‐26 | |
| Cerebellum VI | n/a | 36 | ‐48 | ‐28 | |
| Cerebellum Crus II | n/a | 4 | ‐82 | ‐24 | |
| Primary somatosensory cortex | 3 | ‐52 | ‐26 | 46 | |
| Superior parietal lobule | 7 | 26 | ‐72 | 52 | |
| Primary somatosensory cortex | 2 | ‐44 | ‐36 | 56 | |
| Superior parietal lobule | 40 | ‐34 | ‐52 | 48 | |
| Cluster 2: bilateral | 1732 | ||||
| Paracingulate cortex | 32 | 0 | 12 | 50 | |
| Cluster 3: right Hemisphere | 207 | ||||
| Middle frontal gyrus | 6 | 36 | 0 | 62 | |
| Cluster 4: left Hemisphere | 67 | ||||
| Thalamus | n/a | ‐10 | ‐18 | 8 | |
| Cluster 5: left Hemisphere | 36 | ||||
| Insular cortex | 47 | ‐30 | 24 | ‐4 | |
| Cluster 6: right Hemisphere | 15 | ||||
| Insular cortex | 47 | 32 | 24 | ‐6 | |
Clusters smaller than 270 mm3 were omitted
The brain network associated with the positive loadings for Component 2 represented a functional configuration of the MDN (Fig. 3A and Table 4). While the positive loadings for Components 1 and 2 are distributed spatially across largely overlapping MDN areas, Component 2 is distinguished from Component 1 by prominent negative loadings in regions associated with the default mode network [DMN; Raichle et al., 2001]. Despite involving largely overlapping anatomical regions, Components 1 and 2 provided distinct task‐related BOLD time‐courses (Fig. 3b). In contrast to Component 1, HDR peaks for Component 2 were not staggered in time, and did show distinctly heightened peaks for distantly related to closely related word pairs. Predictor weights reflecting the estimated HDR for Component 2 were submitted to a mixed model ANOVA. There were significant main effects of Poststimulus Time, F(9,522) = 37.42, P < 0.001, and Relatedness, F(1,58) = 58.72, P < 0.001, and a significant Poststimulus Time × Relatedness interaction, F(9,522) = 24.26, P < 0.001, reflecting a higher peak for distant associations relative to close associations. The interaction was strongest between 5 and 7 s, F(1,58) = 114.46, P < 0.001, due to the activity falling off for close associations, but increasing sharply to the peak at 7 s for distant associations. No significant main effects or interactions involving Group emerged (all Ps > 0.22).
Figure 3.
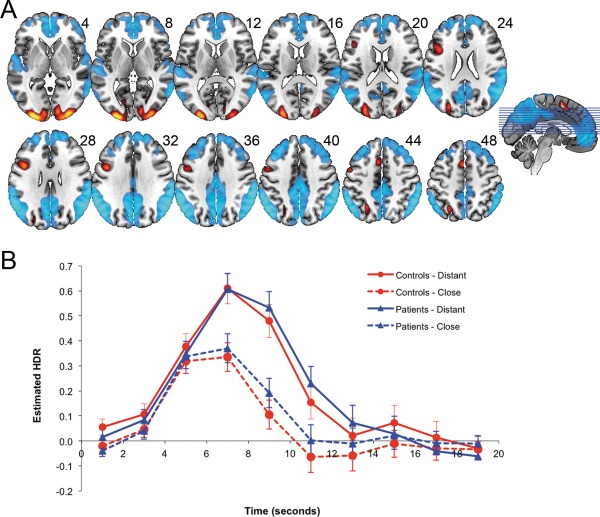
A (top): dominant 20% of component loadings for MDN Component 2. MNI Z‐axis coordinates are displayed. Images are displayed in neurological orientation (left is left). Red/yellow = positive loadings, positive threshold = 0.10, max = 0.22; blue/white = negative loadings, negative threshold = −0.10 min = −0.22. B (bottom): mean FIR‐based predictor weights plotted as a function of Poststimulus Time. [Color figure can be viewed in the online issue, which is available at http://wileyonlinelibrary.com.]
Table 4.
Cluster volumes for the most extreme 10% of Component 2 loadings, with anatomical labels, Brodmann's areas, and MNI coordinates for the peak of each subcluster
| Anatomical Label | Cluster volume (voxels) | Brodmann's area for peak locations | MNI coordinate for peak locations | ||
|---|---|---|---|---|---|
| x | y | z | |||
| Positive Loadings | |||||
| Cluster 1: Right Hemisphere | 5595 | ||||
| Angular gyrus | 39 | 60 | −56 | 30 | |
| Supramarginal gyrus, anterior region | 40 | 62 | −32 | 40 | |
| Supramarginal gyrus, posterior region | 40 | 60 | −44 | 40 | |
| Angular gyrus | 40 | 58 | −46 | 44 | |
| Lateral occipital cortex, superior division | 39 | 50 | −60 | 46 | |
| Lateral occipital cortex, inferior division | 37 | 60 | −62 | 10 | |
| Middle temporal gyrus, temporooccipital part | 37 | 64 | −54 | −4 | |
| Middle temporal gyrus, posterior division | 20 | 60 | −12 | −26 | |
| Middle temporal gyrus, temporooccipital part | 21 | 66 | −40 | −6 | |
| Middle temporal gyrus, posterior division | 21 | 66 | −36 | −6 | |
| Parietal operculum cortex | 42 | 52 | −32 | 20 | |
| Cluster 2: Bilateral | 4594 | ||||
| Precuneus cortex | 18 | −4 | −74 | 30 | |
| Precuneus cortex | 23 | −2 | −44 | 42 | |
| Precuneus cortex | 7 | 4 | −60 | 36 | |
| Cingulate gyrus, posterior division | 23 | 0 | −24 | 40 | |
| Precuneus cortex | 5 | −2 | −48 | 56 | |
| Precuneus cortex | 5 | 4 | −52 | 64 | |
| Precuneus cortex | 7 | −2 | −64 | 58 | |
| Postcentral gyrus | 5 | 2 | −42 | 78 | |
| Cluster 3: Bilateral | 4375 | ||||
| Paracingulate gyrus | 10 | −4 | 48 | −4 | |
| Paracingulate gyrus | 10 | 4 | 46 | −8 | |
| Frontal pole | 10 | −2 | 58 | 0 | |
| Cingulate gyrus, anterior division | 25 | 0 | 34 | 8 | |
| Frontal pole | 9 | 22 | 48 | 38 | |
| Middle frontal gyrus | 9 | 48 | 18 | 44 | |
| Middle frontal gyrus | 44 | 46 | 20 | 42 | |
| Superior frontal gyrus | 9 | 16 | 36 | 52 | |
| Frontal pole | 10 | 18 | 64 | 18 | |
| Superior frontal gyrus | 8 | 24 | 30 | 52 | |
| Paracingulate gyrus | 32 | 10 | 46 | 8 | |
| Cluster 4: Left hemisphere | 3834 | ||||
| Supramarginal gyrus, posterior division | 40 | −60 | −46 | 38 | |
| Angular gyrus | 39 | −56 | −58 | 34 | |
| Lateral occipital cortex, superior division | 39 | −46 | −72 | 40 | |
| Planum temporale | 22 | −58 | −24 | 8 | |
| Cluster 5: Left hemisphere | 921 | ||||
| Frontal pole | 9 | −26 | 40 | 42 | |
| Middle frontal gyrus | 44 | −42 | 22 | 42 | |
| Middle frontal gyrus | 9 | −36 | 32 | 42 | |
| Middle frontal gyrus | 46 | −38 | 30 | 40 | |
| Frontal pole | 46 | −24 | 56 | 24 | |
| Frontal pole | 10 | −18 | 62 | 10 | |
| Cluster 6: Left hemisphere | 754 | ||||
| Cerebellum Crus II | n/a | −38 | −80 | −44 | |
| Cerebellum Crus I | n/a | −24 | −78 | −30 | |
| Cluster 7: Right hemisphere | 335 | ||||
| Cerebellum Crus II | n/a | 24 | −88 | −32 | |
| Cluster 8: Left hemisphere | 284 | ||||
| Superior temporal gyrus, anterior division | 48 | −60 | −2 | −2 | |
| Planum polare | 48 | −50 | −8 | −2 | |
| Cluster 9: Left hemisphere | 246 | ||||
| Middle temporal gyrus, posterior division | 20 | −62 | −24 | −18 | |
| Cluster 10: Right | 175 | ||||
| Postcentral gyrus | 1 | 28 | −38 | 70 | |
| Cluster 11: Right hemisphere | 132 | ||||
| Frontal pole | 46 | 44 | 52 | −2 | |
| Frontal pole | 45 | 48 | 44 | 0 | |
| Cluster 12: Left hemisphere | 117 | ||||
| Superior parietal lobule | 5 | −22 | −46 | 70 | |
| Cluster 13: Right hemisphere | 115 | ||||
| Superior temporal gyrus, anterior division | 38 | 60 | 2 | −4 | |
| Cluster 14: Left hemisphere | 84 | ||||
| Lateral occipital cortex, inferior division | 37 | −64 | −64 | −8 | |
| Cluster 15: Left hemisphere | 36 | ||||
| Insular cortex | 48 | −42 | 2 | −10 | |
| Cluster 16: Right hemisphere | 18 | ||||
| Planum polare | 20 | 42 | −10 | −14 | |
| Cluster 17: Right hemisphere | 16 | ||||
| Frontal orbital cortex | 47 | 48 | 30 | −18 | |
| Negative Loadings | |||||
| Cluster 1: Left hemisphere | 2516 | ||||
| Occipital fusiform gyrus | 18 | −24 | −88 | −14 | |
| Occipital pole | 18 | −24 | −100 | 2 | |
| Occipital pole | 17 | −12 | −96 | −4 | |
| Lateral occipital cortex, inferior division | 19 | −38 | −78 | −14 | |
| Lateral occipital cortex, superior division | 18 | −28 | −88 | 18 | |
| Cluster 2: Right hemisphere | 1849 | ||||
| Occipital pole | 18 | 26 | −96 | −8 | |
| Occipital fusiform gyrus | 18 | 26 | −84 | −12 | |
| Occipital pole | 17 | 20 | −102 | −4 | |
| Occipital fusiform gyrus | 19 | 34 | −66 | −16 | |
| Cluster 3: Left hemisphere | 381 | ||||
| Precentral gyrus | 44 | −44 | 8 | 28 | |
| Precentral gyrus | 6 | −52 | 2 | 42 | |
| Cluster 4: Left hemisphere | 157 | ||||
| Supplementary motor cortex | 6 | −4 | 8 | 54 | |
| Cluster 5: Left hemisphere | 81 | ||||
| Lateral occipital cortex, superior division | 7 | −24 | −64 | 48 | |
Semantic integration network
The brain network associated with positive loadings for Component 3 (Figs. 4A and 5 and Table 5) accords with the SIN, indicating that controlled integration of semantic information involves left middle temporal gyrus, left fusiform gyrus, left inferior (ventrolateral) prefrontal cortex, and dACC [Badre et al., 2005; Bunge et al., 2005; Gold et al., 2006; Thompson‐Schill et al., 1997, 1999; Wagner et al., 2001]. Component 3 dACC activity (positive loadings) was more anterior to that of Components 1 and 2, the left‐lateralized frontal activity was more inferior and anterior, and insular and lateralized occipital activity seen in Components 1 and 2 were absent. Component 3 activity reductions (negative loadings) included posterior anterior cingulate DMN regions and visual primary sensory regions (BA 17, 18), which, notably, were prominently activated in Components 1 and 2. The bilateral supramarginal and angular gyri DMN regions that were prominent in Component 2 were absent from Component 3.
Figure 4.
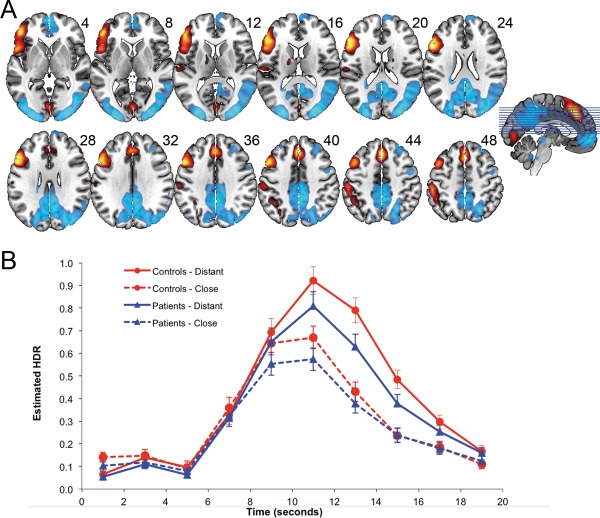
A (top): dominant 20% of component loadings for SIN Component 3. MNI Z‐axis coordinates are displayed. Images are displayed in neurological orientation (left is left). Red/yellow = positive loadings, positive threshold = 0.06, max = 0.21; blue/white = negative loadings, negative threshold = −0.06 min = −0.17. B (bottom): mean FIR‐based predictor weights plotted as a function of Poststimulus Time. * ((distant > close) controls) > ((distant > close) patients), p < .05; ** ((distant > close) controls) > ((distant > close) patients), P < 0.01. [Color figure can be viewed in the online issue, which is available at http://wileyonlinelibrary.com.]
Figure 5.
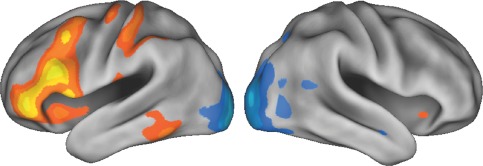
Dominant 20% of component loadings for SIN Component 3, rendered view. Red/yellow = positive loadings, positive threshold = 0.06, max = 0.21; blue/white = negative loadings, negative threshold = −0.06 min = −0.17. [Color figure can be viewed in the online issue, which is available at http://wileyonlinelibrary.com.]
Table 5.
Cluster volumes for the most extreme 10% of Component 3 loadings, with anatomical labels, Brodmann's areas, and MNI coordinates for the peak of each subcluster
| Anatomical label | Cluster volume (voxels) | Brodmann's Area for peak locations | MNI Coordinate for peak locations | ||
|---|---|---|---|---|---|
| x | y | z | |||
| Positive Loadings | |||||
| Cluster 1: Bilateral | 14086 | ||||
| Occipital fusiform gyrus | 18 | 24 | −90 | −10 | |
| Occipital pole | 18 | −26 | −96 | 8 | |
| Occipital pole | 18 | 28 | −92 | 12 | |
| Occipital fusiform gyrus | 19 | −28 | −80 | −10 | |
| Occipital fusiform gyrus | 19 | 32 | −70 | −12 | |
| Precuneus cortex | 23 | 2 | −44 | 44 | |
| Lateral occipital cortex, inferior division | 19 | −44 | −82 | 0 | |
| Precuneus cortex | 18 | −14 | −72 | 28 | |
| Precuneus cortex | 18 | 10 | −68 | 30 | |
| Cingulate gyrus, posterior division | 23 | −12 | −50 | 32 | |
| Lateral occipital cortex, superior division | 7 | 24 | −62 | 50 | |
| Cingulate gyrus, posterior division | 23 | 4 | −28 | 44 | |
| Lateral occipital cortex, superior division | 39 | 44 | −78 | 28 | |
| Lateral occipital cortex, inferior division | 37 | 50 | −68 | −2 | |
| Angular gyrus | 21 | 52 | −54 | 16 | |
| Temporal occipital fusiform cortex | 37 | 32 | −44 | −22 | |
| Lateral occipital cortex, superior division | 19 | 32 | −84 | 40 | |
| Precentral gyrus | 4 | −8 | −34 | 46 | |
| Middle temporal gyrus, temporooccipital part | 21 | 60 | −50 | 8 | |
| Cluster 2:Right hemisphere | 1424 | ||||
| Frontal pole | 10 | 4 | 68 | 12 | |
| Cluster 3: Right hemisphere | 219 | ||||
| Middle temporal gyrus, anterior division | 21 | 56 | −2 | −24 | |
| Cluster 4: Right hemisphere | 102 | ||||
| Temporal pole | 20 | 34 | 26 | −40 | |
| Cluster 5: Right hemisphere | 102 | ||||
| Frontal pole | 9 | 28 | 38 | 48 | |
| Cluster 6: Left hemisphere | 86 | ||||
| White matter (callosal body) | n/a | −24 | −40 | 20 | |
| Cluster 7: Bilateral | 70 | ||||
| Brain stem | n/a | 6 | −30 | −6 | |
| Brain stem | n/a | −4 | −30 | −6 | |
| Negative Loadings | |||||
| Cluster 1: Left hemisphere | 5121 | ||||
| Temporal pole | 38 | −52 | 16 | −8 | |
| Inferior frontal gyrus, par opercularis | 45 | −54 | 20 | 24 | |
| Middle frontal gyrus | 44 | −52 | 16 | 36 | |
| Frontal pole | 47 | −46 | 44 | −8 | |
| Inferior frontal gyrus, pars triangularis | 45 | −52 | 28 | 18 | |
| Frontal pole | 45 | −48 | 42 | 0 | |
| Middle frontal gyrus | 6 | −32 | 2 | 66 | |
| Middle frontal gyrus | 9 | −44 | 14 | 48 | |
| Precentral gyrus | 4 | −42 | −18 | 64 | |
| Cluster 2: Bilateral | 2147 | ||||
| Cerebellum Crus II | n/a | 10 | −86 | −30 | |
| Cerebellum Crus I | n/a | 32 | −74 | −28 | |
| Intracalcarine cortex | 17 | −2 | −82 | 2 | |
| Cerebellum VI | n/a | 18 | −74 | −18 | |
| Cluster 3: Left hemisphere | 1343 | ||||
| Paracingulate gyrus | 8 | 0 | 30 | 44 | |
| Superior frontal gyrus | 6 | −10 | 22 | 60 | |
| Cluster 4: Left hemisphere | 1048 | ||||
| Cerebellum Crus I | n/a | −52 | −66 | −26 | |
| Inferior temporal gyrus | 20 | −60 | −42 | −20 | |
| Cluster 5: Left hemisphere | 673 | ||||
| Postcentral gyrus | 2 | −50 | −34 | 56 | |
| Supramarginal gyrus, posterior division | 40 | −48 | −48 | 48 | |
| Postcentral gyrus | 1 | −30 | −32 | 72 | |
| Angular gyrus | 40 | −40 | −54 | 44 | |
| Cluster 6: Right hemisphere | 143 | ||||
| Frontal orbital cortex | 47 | 48 | 20 | −12 | |
| Cluster 7: Left hemisphere | 41 | ||||
| Central opercular cortex | 22 | −60 | −20 | 12 | |
| Cluster 8: Right hemisphere | 20 | ||||
| Middle frontal gyrus | 46 | 54 | 34 | 30 | |
Predictor weights reflecting the estimated HDR for Component 3 were submitted to a mixed‐model ANOVA. There were significant main effects of Poststimulus Time, F(9,522) = 122.58, P < 0.001, and Relatedness, F(1,58) = 58.67, P < 0.001, but the main effect of Group was not significant, F(1,58) = 2.01, P = 0.16. As with the MDN components, the Poststimulus Time × Relatedness interaction was significant, F(9,522) = 59.72, P < 0.001. However, unlike for the MDN, for the SIN the Poststimulus Time × Relatedness × Group interaction was significant, F(9,522) = 2.73, P < 0.005, which indicated a group difference in the effect of semantic distance that occurred at particular time points. The 3‐way interaction was followed up with a series of Poststimulus Time × Relatedness × Group ANOVAs using adjacent time points, which indicated that the group difference in Relatedness was greatest between 11 and 13 s, F(1,58) = 4.50, P < 0.05, and between 15 and 17 s, F(1,58) = 6.04, P < 0.05, due to a higher and sustained peak for controls relative to patients in the distantly related condition. Described another way, the Relatedness effect differed between patients and controls most at the 13 s, t(58) = 5.85, P < 0.05, and 15 s, t(58) = 7.18, P < 0.01, time points. This suggests that coordinated activity in the SIN was increased and sustained for controls relative to patients, in the distantly related condition relative to the closely related condition.
DISCUSSION
In the current fMRI study, people with schizophrenia were compared to healthy controls on a task involving controlled semantic integration, in which semantic distance between a prompt and target word was manipulated. A task‐based, whole‐brain connectivity analysis revealed three functional networks of interest. Two were distinct functional configurations of the MDN, both defined by coordinated activity in the dACC, bilateral insula, left inferior frontal and sensorimotor cortex, bilateral thalamus, and bilateral occipital/fusiform regions. The third reflected the SIN, defined by coordinated activity in left fusiform gyrus, left inferior (ventrolateral) prefrontal cortex, and dACC. The level of coordinated activity did not differ between groups for either functional configuration of the MDN; however, in the SIN, coordinated activity attributable to controlled semantic association was reduced in people with schizophrenia relative to healthy controls. These data support an account of schizophrenia that emphasizes the clinical significance of disturbances in controlled language processes such as semantic integration, and points to reduced functional brain connectivity in as a key neurocognitive feature of this disorder.
Regions of the SIN identified in this study have been observed previously in healthy controls, with left fusiform gyrus (e.g., peak: −56 −60 −18), and left inferior (ventrolateral) prefrontal cortex (e.g., peaks: −52, 16, −8; −46, 44, −8; −54, 20, 24) implicated in controlled selection and integration of semantic information [Badre et al., 2005; Bunge et al., 2005; Gold et al., 2006; Thompson‐Schill et al., 1997, 1999]. BOLD activity in these regions, as well as in dACC (peak: 0, 30, 44) is known to increase as semantic integration demands increase [Wagner et al., 2001]. Involvement of the left middle temporal cortex (peak: −66, −44, −2; BA 21; see Fig. 5) was also observed, and is known to be involved in storage of semantic knowledge [Badre et al., 2005; Lau et al., 2008]. Reduced activity in the SIN in schizophrenia has also been observed for other types of controlled semantic integration, such as presentation of incongruous sentences and abstract/concrete judgments [Kubicki et al., 2003; Kuperberg et al., 2008]. Relating the SIN to a recently proposed 7‐network brain parcellation derived from resting state data [Buckner et al., 2011; Choi et al., 2012; Yeo et al., 2011], the dACC, prefrontal, caudate (subthreshold), and cerebellar activations are all located on the frontoparietal network. Furthermore, a language network reported elsewhere [Hacker et al., 2013] matches the left prefrontal and right cerebellar SIN activation seen in this study. However, notably the SIN does not include the superior temporal regions seen in the language network [Hacker et al., 2013], typically engaged when auditory linguistic stimuli are processed [Belin et al., 2000; Lavigne et al., 2015b; Rapin et al., 2012; Zatorre et al., 1992].
Considered alongside previous findings of increased BOLD signal in schizophrenia patients relative to healthy controls in automatic semantic priming paradigms [e.g., Kuperberg et al., 2007], the current results are in line with an account proposing a language‐based impairment in schizophrenia characterized by both hypoactivity (or disconnection) of coordinated frontotemporal brain regions underlying controlled semantic integration, and hyperactivity in brain processes underlying automatic semantic propagation through conceptual networks [Kuperberg, 2007; Kuperberg et al., 2008]. Combined, these impairments cover what Bleuler was referring to when defining schizophrenia as fundamentally a disorder of semantic concepts. However, more research will be required to determine whether or not a causal relationship exists between hypoactivity for controlled semantic integration and hyperactivity for automatic semantic retrieval in schizophrenia.
One of the major theoretical accounts of brain dysfunction in schizophrenia proposes a disconnection syndrome, specifically implicating prefrontal and temporal regions [Fletcher et al., 1999; Frith et al., 1995; Li et al., 2009], which are both considered aspects of the SIN. In early work using verbal memory and fluency paradigms with positron emission tomography, normal frontal activation was observed alongside an absence of an expected reduction in the superior temporal cortex in schizophrenia [Frith et al., 1995], and evidence was later provided showing that this was modulated by the dACC [Fletcher et al., 1999]. However, in this study, no superior temporal deactivity (or activity) was observed on the SIN in concert with prefrontal activation. Instead, middle temporal activity and prefrontal activity was positively coordinated, but reduced in schizophrenia. In a more recent study using fMRI and a lexical decision task [Li et al., 2010], left inferior (ventrolateral) prefrontal cortex showed reduced connectivity with the middle temporal gyrus (and a number of other brain regions), as was observed in this study. Thus, it may be necessary to more precisely define the brain substrates underlying prefrontal–temporal disconnection in schizophrenia.
The MDN was captured by Components 1 and 2. Relating the MDN to a 7‐network brain parcellation recently proposed based on resting state data [Buckner et al., 2011; Choi et al., 2012; Yeo et al., 2011], occipital, lingual, and cerebellar activations were located on the visual network, dACC activations were located in the ventral attention network, and frontal and parietal activations were located in the dorsal attention network. For Component 1, the HDR peaks were staggered in time, with a delay in the peak for the distantly related condition, likely reflecting its longer RTs relative to the closely related condition. Importantly, the height of the peaks did not differ between distantly and closely related word pairs, suggesting that this component was driven by response processes rather than semantic association processes. Functional brain networks characterized by activations in left sensorimotor regions (congruent with right‐handed responding), and an absence of load‐dependent modulation, were previously reported by our group [see Metzak et al., 2012, Component 1; Woodward et al., 2013, Component 3], and were also interpreted as reflecting cognitive processes related to responding. Taken together, these observations suggest that Component 1 represents a response‐based functional configuration of the MDN. Interestingly, the primary visual cortex activations observed on Component 1 (and Component 2) re‐emerged as negative loadings on Component 3 (SIN), indicating that visual processing activity in the MDN decreased as the processing of the semantic relations of the word pairs continued in the SIN. This reciprocal functional relationship, combined with the late peak for Component 3 (SIN) relative to Components 1 and 2 (MDN), suggests that processing of the semantic relations linking word pairs continued even after they were removed from the screen.
The estimated HDR time‐courses for Component 2 suggest load‐dependent BOLD activation in the MDN, and a concurrent load‐dependent BOLD deactivation in the DMN. Previous studies of WM from our lab [Metzak et al., 2012; Woodward et al., 2013] identified functional brain networks sensitive to increasing cognitive load that included both task‐positive activation of the MDN and reciprocal deactivation of the DMN, alongside functional brain networks involved in response processes that showed the task‐positive activation of the MDN but not the reciprocal deactivation of the DMN. Taken together, these results are suggestive of a broader principle of MDN functionality, such that cognitive‐load‐sensitive configurations of the MDN are more closely tied to reciprocal DMN activity than response‐process‐sensitive configurations of the MDN. The ability of fMRI‐CPCA to separately image simultaneously active functionally connected brain networks and assign them a cognitive function through interpretation of estimated HDR time‐courses provides a powerful new approach to cognitive neuroscience that promises to open up new avenues for understanding the complexity and flexibility of functional brain organization.
The finding that the processing efficiency of the load‐dependent MDN (Component 2) did not differ between patient and control groups was unexpected in light of previous work from our lab that demonstrated a reduction in MDN efficiency in schizophrenia (i.e., greater activation of MDN and reciprocal deactivation of DMN) at moderate cognitive loads [Lavigne et al., 2015b; Metzak et al., 2012]. Thus, the decreased efficiency of the linked MDN/DMN response to WM load in schizophrenia may result from a disease process that does not impact this brain response in the context of semantic integration. An implication of this finding is that disease processes cannot necessarily be said to affect spatially defined functional brain networks per se, but rather the specific functioning of those networks with respect to the task at hand. This points to the importance of task‐based (as opposed to resting‐state) connectivity studies for understanding disease processes, and emphasizes that spatially similar networks need to be compared across task contexts to determine the brain markers of neuropsychiatric disorders. It also gives weight to the idea that large‐scale functional brain networks such as those identified here are functionally flexible, perhaps owing to task‐specific reconfigurations that occur among smaller‐scale functional modules that comprise the larger network, or the influence of off‐peak patterns of activity [Whitman et al., 2013]. An intriguing avenue for future research will be to investigate the mechanisms of these task‐specific reconfigurations within large‐scale functional brain networks, and how these processes are affected by psychiatric illnesses.
Four limitations should be considered in this study. First, the patient group sampled here showed very mild thought disorder symptoms (i.e., the highest score was 2 on the SSPI scale ranging from 0 to 4, indicating no substantial communication impairment). This precluded testing for a correlation between thought disorder and brain activity in the SIN, which may be predicted based on previous work linking severity of thought disorder in schizophrenia to hyperactivity of semantic association processes [Kuperberg et al., 2007; Moritz et al., 2003; Spitzer, 1997; Weinstein et al., 2006]. This limitation could be mitigated by future studies recruiting a larger sample of patients (e.g., 100) with increased variation in the severity of thought disorder. Second, it is possible that the absence of inefficiency in the MDN was the result of the cognitive demand being too low to elicit this effect; however, inefficiency has been demonstrated at very low cognitive loads for thought generation and WM tasks [e.g., Lavigne et al., 2015b, thought generation condition; Metzak et al., 2012, Component 3, two letter condition), suggesting that inefficiency may be task specific. Third, in addition to semantic integration, a number of other cognitive operations could differ between the processing of distant relative to close semantic relations, such as cognitive load and cognitive conflict, although these could still be considered some of the cognitive operations required for controlled semantic integration. Further experimentation would be necessary to discount these alternative interpretations. Finally, the current results could be confounded to the extent that the cognitive processes studied here are affected by antipsychotic medication, but this is unlikely, since the administration of antipsychotic medication is thought to have little effect on neurocognitive abilities (e.g., attention and memory) in schizophrenia [Keefe et al., 2007].
CONCLUSION
The multivariate analysis results of this fMRI study demonstrate that coordinated activity in the language‐based SIN was reduced in schizophrenia relative to healthy controls, for distantly relative to closely related word pairs. There were no group differences, however, in coordinated brain activity for either the response‐based (Component 1) or cognitive‐based (Component 2) functional configuration of the MDN. These data support an account of schizophrenia that emphasizes the clinical significance of disturbances in controlled language processes such as semantic integration, and points to reduced functional brain connectivity in a SIN as a key neurocognitive feature of this disorder. Considered alongside the literature on automatic semantic association in schizophrenia, this suggests that a language‐based impairment in schizophrenia may be characterized by both hypoactivity in controlled integrative processes and hyperactivity in automatic association processes, providing a biological underpinning to Bleuler's concept of schizophrenia as a “split mind” of impaired association between semantic concepts. Clarifying the interplay between these two forms of neurocognitive dysfunction in schizophrenia, and the degree to which each underlies communication impairments in schizophrenia, may aid therapeutic attempts to reduce the severity of thought disorder, which, despite its historical and clinical significance to schizophrenia, is currently an undertreated symptom of the illness [Beck et al., 2009].
Supporting information
Supporting Information
ACKNOWLEDGMENTS
The authors acknowledge the UBC High Field Magnetic Resonance Imaging Centre, thank John Paiement for assistance with computer programming, and Tara Cairo for assistance with stimulus preparation.
REFERENCES
- American Psychiatric Association (2000): Diagnostic and Statistical Manual of Mental Disorders, Fourth Edition, Text Revision. Washington: American Psychiatric Association. [Google Scholar]
- Badre D, Poldrack RA, Pare‐Blagoev EJ, Insler RZ, Wagner AD (2005): Dissociable controlled retrieval and generalized selection mechanisms in ventrolateral prefrontal cortex. Neuron 47:907–918. [DOI] [PubMed] [Google Scholar]
- Beck AT, Rector NA, Stolar N, Grant P ( 2009): Schizophrenia: Cognitive Theory, Research, and Therapy. New York: Guilford. [Google Scholar]
- Belin P, Zatorre RJ, Lafaille P, Ahad P, Pike B (2000): Voice‐selective areas in human auditory cortex. Nature 403:309–312. [DOI] [PubMed] [Google Scholar]
- Bleuler E (1911): Dementia praecox: Or, the Group of Schizophrenias. Zinkin J, translator. New York: International Universities Press. [Google Scholar]
- Buckner RL, Krienen FM, Castellanos A, Diaz JC, Yeo BT (2011): The organization of the human cerebellum estimated by intrinsic functional connectivity. J Neurophysiol 106:2322–2345. [DOI] [PMC free article] [PubMed] [Google Scholar]
- Bunge SA, Wendelken C, Badre D, Wagner AD (2005): Analogical reasoning and prefrontal cortex: Evidence for separable retrieval and integration mechanisms. Cereb Cortex 15:239–249. [DOI] [PubMed] [Google Scholar]
- Callicott JH, Mattay VS, Verchinski BA, Marenco S, Egan MF, Weinberger DR (2003): Complexity of prefrontal cortical dysfunction in schizophrenia: More than up or down. Am J Psychiatry 160:2209–2215. [DOI] [PubMed] [Google Scholar]
- Choi EY, Yeo BT, Buckner RL (2012): The organization of the human striatum estimated by intrinsic functional connectivity. J Neurophysiol 108:2242–2263. [DOI] [PMC free article] [PubMed] [Google Scholar]
- Dale AM (1999): Optimal experimental design for event‐related fMRI. Hum Brain Mapp 8:109–114. [DOI] [PMC free article] [PubMed] [Google Scholar]
- Duncan J, Owen AM (2000): Common regions of the human frontal lobe recruited by diverse cognitive demands. Trends Neurosci 23:475–483. [DOI] [PubMed] [Google Scholar]
- Durda K, Buchanan L (2006): WordMine2 Available Online at http://web2.uwindsor.ca/wordmine. Last accessed April 29, 2015.
- Fedorenko E, Duncan J, Kanwisher N (2013): Broad domain generality in focal regions of frontal and parietal cortex. Proc Natl Acad Sci USA 110:16616–16621. [DOI] [PMC free article] [PubMed] [Google Scholar]
- Fletcher P, McKenna PJ, Friston KJ, Frith CD, Dolan RJ (1999): Abnormal cingulate modulation of fronto‐temporal connectivity in schizophrenia. Neuroimage 9:337–342. [DOI] [PubMed] [Google Scholar]
- Frith CD, Friston KJ, Herold S, Silbersweig P, Fletcher C, Cahill RJ, Dolan R, Frackowiak SJ, Liddle PF (1995): Regional brain activity in chronic schizophrenic patients during the performance of a verbal fluency task. Br J Psychiatry 167:343–349. [DOI] [PubMed] [Google Scholar]
- Gold BT, Balota DA, Jones SJ, Powell DK, Smith CD, Andersen AH (2006): Dissociation of automatic and strategic Lexical‐semantics: Functional magnetic resonance imaging evidence for differing roles of multiple frontotemporal regions. J Neurosci 26:6523–6532. [DOI] [PMC free article] [PubMed] [Google Scholar]
- Hacker CD, Laumann TO, Szrama NP, Baldassarre A, Snyder AZ, Leuthardt EC, Corbetta M (2013): Resting state network estimation in individual subjects. NeuroImage 82:616–633. [DOI] [PMC free article] [PubMed] [Google Scholar]
- Hagoort P (2013): MUC (memory, unification, control) and beyond. Front Psychol 4:416 [DOI] [PMC free article] [PubMed] [Google Scholar]
- Heinrichs W, Zakzanis KK (1998): Neurocognitive deficit in schizophrenia: A quantitative review of the evidence. Neuropsychology 12:426–445. [DOI] [PubMed] [Google Scholar]
- Henson R, Rugg MD, Friston K (2001): The choice of basis functions in event‐related fMRI. NeuroImage 13:149s [Google Scholar]
- Hunter MA, Takane Y (2002): Constrained principal component analysis: Various applications. J Educ Behav Stat 27:105–145. [Google Scholar]
- Jamadar SD, Pearlson GD, O'Neil KM, Assaf M (2013): Semantic association fMRI impairments represent a potential schizophrenia biomarker. Schizophr Res 145:20–26. [DOI] [PMC free article] [PubMed] [Google Scholar]
- Karlsgodt KH, Sanz J, van Erp TGM, Bearden CE, Nuechterlein KH, Cannon TD (2009): Re‐evaluating dorsolateral prefrontal cortex activation during working memory in schizophrenia. Schizophr Res 108:143–150. [DOI] [PMC free article] [PubMed] [Google Scholar]
- Keefe RS, Bilder RM, Davis SM, Harvey PD, Palmer BW, Gold JM, Meltzer HY, Green MF, Capuano G, Stroup TS, McEvoy JP, Swartz MS, Rosenheck RA, Perkins DO, Davis CE, Hsiao JK, Lieberman JA, CATIE Investigators, Neurocognitive Working Group (2007): Neurocognitive effects of antipsychotic medications in patients with chronic schizophrenia. Arch Gen Psychiatry 64:633–647. [DOI] [PubMed] [Google Scholar]
- Kiang M, Kutas M, Light GA, Braff DL (2008): An event‐related brain potential study of direct and indirect semantic priming in schizophrenia. Am J Psychiatry 165:74–81. [DOI] [PubMed] [Google Scholar]
- Kiss GR, Armstrong C, Milroy R, Piper J ( 1973): An associative thesaurus of English and its computer analysis In: Aitkin AJ, Bailey RW, Hamilton‐Smith N, editors. The Computer and Literary Studies. Edinburgh: University Press; pp 153–165. [Google Scholar]
- Kubicki M, McCarley RW, Nestor PG, Huh T, Kikinis R, Shenton ME, Wible CG (2003): An fMRI study of semantic processing in men with schizophrenia. NeuroImage 20:1923–1933. [DOI] [PMC free article] [PubMed] [Google Scholar]
- Kuperberg GR (2007): Neural mechanisms of language comprehension: Challenges to syntax. Brain Res 1146:23–49. [DOI] [PubMed] [Google Scholar]
- Kuperberg GR, Deckersbach T, Holt DJ, Goff D, West WC (2007): Increased temporal and prefrontal activity in response to semantic associations in schizophrenia. Arch Gen Psychiatry 64:138–151. [DOI] [PubMed] [Google Scholar]
- Kuperberg GR, West WC, Lakshmanan BM, Goff D (2008): Functional magnetic resonance imaging reveals neuroanatomical dissociations during semantic integration in schizophrenia. Biol Psychiatry 64:407–418. [DOI] [PMC free article] [PubMed] [Google Scholar]
- Lau EF, Phillips C, Poeppel D (2008): A cortical network for semantics: (De)Constructing the n400. Nat Rev Neurosci 9:920−933. [DOI] [PubMed] [Google Scholar]
- Lavigne KM, Metzak PD, Woodward TS (2015a): Functional brain networks underlying detection and integration of disconfirmatory evidence. NeuroImage 112:138–151. [DOI] [PubMed] [Google Scholar]
- Lavigne KM, Rapin LA, Metzak PM, Whitman JC, Jung K, Dohen M, Loevenbruck H, Woodward TS (2015b): Left‐dominant temporal‐frontal hypercoupling in schizophrenia patients with hallucinations during speech perception. Schizophr Bull 41:259–267. [DOI] [PMC free article] [PubMed] [Google Scholar]
- Li X, Branch CA, DeLisi LE (2009): Language pathway abnormalities in schizophrenia: A review of fMRI and other imaging studies. Curr Opin Psychiatry 22:131–139. [DOI] [PubMed] [Google Scholar]
- Li X, Branch C, Nierenberg J, DeLisi L (2010): Disturbed functional connectivity of cortical activation during semantic discrimination in patients with schizophrenia and subjects at genetic High‐risk. Brain Imaging Behav 4:109–120. [DOI] [PubMed] [Google Scholar]
- Liddle PF, Ngan ETN, Duffield G, Kho K, Warren AJ (2002): Signs and symptoms of psychotic illness: A rating scale. Br J Psychiatry 180:45–50. [DOI] [PubMed] [Google Scholar]
- Metzak PD, Riley JD, Wang L, Whitman JC, Ngan ETC, Woodward TS (2012): Decreased efficiency of task‐positive and task‐negative networks during working memory in schizophrenia. Schizophr Bull 38:803–813. [DOI] [PMC free article] [PubMed] [Google Scholar]
- Moritz S, Woodward TS, Küppers D, Lausen A, Schickel M (2003): Increased automatic spreading of activation in thought‐disordered schizophrenic patients. Schizophr Res 59:181–186. [DOI] [PubMed] [Google Scholar]
- Raichle ME, MacLeod AM, Snyder AZ, Powers WJ, Gusnard DA, Shulman GL (2001): A default mode of brain function. Proc Natl Acad Sci USA 98:676–682. [DOI] [PMC free article] [PubMed] [Google Scholar]
- Rapin L, Loevenbruck H, Dohen M, Metzak PD, Whitman JC, Woodward TS (2012): Hyperintensity of functional networks involving voice‐selective cortical regions during silent thought in schizophrenia. Psychiatry Res: Neuroimaging 202:110–117. [DOI] [PubMed] [Google Scholar]
- Serences JT (2004): A comparison of methods for characterizing the event‐related BOLD timeseries in rapid fMRI. NeuroImage 21:1690–1700. [DOI] [PubMed] [Google Scholar]
- Sheehan DV, Lecrubier Y, Sheehan KH, Amorim P, Janavs J, Weiller E, Hergueta T, Baker R, Dunbar GC (1998): The Mini‐international neuropsychiatric interview (M.I.N.I.): The development and validation of a structured diagnostic psychiatric interview for DSM‐IV and ICD‐10. J Clin Psychiatry 59:22–33. [PubMed] [Google Scholar]
- Spitzer M (1997): A cognitive neuroscience view of schizophrenic thought disorder. Schizophr Bull 23:29–50. [DOI] [PubMed] [Google Scholar]
- Stephan KE, Friston KJ, Frith CD (2009): Dysconnection in schizophrenia: From abnormal synaptic plasticity to failures of self‐monitoring. Schizophr Bull 35:509–527. [DOI] [PMC free article] [PubMed] [Google Scholar]
- Takane Y, Shibayama T (1991): Principal component analysis with external information on both subjects and variables. Psychometrika 56:97–120. [Google Scholar]
- Thompson‐Schill SL, D'Esposito M, Aguirre GK, Farah MJ (1997): Role of left inferior prefrontal cortex in retrieval of semantic knowledge: A reevaluation. Proc Natl Acad Sci USA 94:14792–14797. [DOI] [PMC free article] [PubMed] [Google Scholar]
- Thompson‐Schill SL, D'Esposito M, Kan IP (1999): Effects of repetition and competition on activity in left prefrontal cortex during word generation. Neuron 23:513–522. [DOI] [PubMed] [Google Scholar]
- Van Petten C, Luka BJ (2006): Neural localization of semantic context effects in electromagnetic and hemodynamic studies. Brain Lang 97:279–293. [DOI] [PubMed] [Google Scholar]
- Vistoli D, Passerieux C, Houze B, Hardy‐Baylé M, Brunet‐Gouet E (2011): Neural basis of semantic priming in schizophrenia during a lexical decision task: A magneto‐encephalography study. Schizophr Res 130:114–122. [DOI] [PubMed] [Google Scholar]
- Wagner AD, Davachi L (2001): Cognitive neuroscience: Forgetting of things past. Curr Biol 11:R964–R967. [DOI] [PubMed] [Google Scholar]
- Wagner AD, Paré‐Blagoev EJ, Clark J, Poldrack RA (2001): Recovering meaning: Left prefrontal cortex guides controlled semantic retrieval. Neuron 31:329–338. [DOI] [PubMed] [Google Scholar]
- Weinstein S, Werker JF, Vouloumanos A, Woodward TS, Ngan ET (2006): Do you hear what I hear? Neural correlates of thought disorder during listening to speech in schizophrenia. Schizophr Res 86:130–137. [DOI] [PubMed] [Google Scholar]
- Whitman JC, Metzak PD, Lavigne K, Woodward TS (2013): Functional connectivity in a frontoparietal network involving the dorsal anterior cingulate cortex underlies decisions to accept a hypothesis. Neuropsychologia 51:1132–1141. [DOI] [PubMed] [Google Scholar]
- Woodward TS, Feredoes E, Metzak PD, Takane Y, Manoach DS (2013): Epoch‐specific functional networks involved in working memory. NeuroImage 65:529–539. [DOI] [PubMed] [Google Scholar]
- Yeo BT, Krienen FM, Sepulcre J, Sabuncu MR, Lashkari D, Hollinshead M, Roffman JL, Smoller JW, Zollei L, Polimeni JR, Fischl B, Liu H, Buckner RL (2011): The organization of the human cerebral cortex estimated by intrinsic functional connectivity. J Neurophysiol 106:1125–1165. [DOI] [PMC free article] [PubMed] [Google Scholar]
- Zatorre RJ, Evans AC, Meyer E, Gjedde A (1992): Lateralization of phonetic and pitch discrimination in speech processing. Science 256:846–849. [DOI] [PubMed] [Google Scholar]
Associated Data
This section collects any data citations, data availability statements, or supplementary materials included in this article.
Supplementary Materials
Supporting Information