Abstract
Cognitive dysfunction is common in patients with multiple sclerosis (MS). Saccadic eye movement paradigms such as antisaccades (AS) can sensitively interrogate cognitive function, in particular, the executive and attentional processes of response selection and inhibition. Although we have previously demonstrated significant deficits in the generation of AS in MS patients, the neuropathological changes underlying these deficits were not elucidated. In this study, 24 patients with relapsing–remitting MS underwent testing using an AS paradigm. Rank correlation and multiple regression analyses were subsequently used to determine whether AS errors in these patients were associated with: (i) neurological and radiological abnormalities, as measured by standard clinical techniques, (ii) cognitive dysfunction, and (iii) regionally specific cerebral white and gray‐matter damage. Although AS error rates in MS patients did not correlate with clinical disability (using the Expanded Disability Status Score), T2 lesion load or brain parenchymal fraction, AS error rate did correlate with performance on the Paced Auditory Serial Addition Task and the Symbol Digit Modalities Test, neuropsychological tests commonly used in MS. Further, voxel‐wise regression analyses revealed associations between AS errors and reduced fractional anisotropy throughout most of the cerebellum, and increased mean diffusivity in the cerebellar vermis. Region‐wise regression analyses confirmed that AS errors also correlated with gray‐matter atrophy in the cerebellum right VI subregion. These results support the use of the AS paradigm as a marker for cognitive dysfunction in MS and implicate structural and microstructural changes to the cerebellum as a contributing mechanism for AS deficits in these patients. Hum Brain Mapp 35:2310–2319, 2014. © 2013 Wiley Periodicals, Inc.
Keywords: multiple sclerosis, cognitive dysfunction, antisaccades, MRI, DTI, cerebellum
INTRODUCTION
Cognitive impairment is increasingly recognized as an important functional disability in multiple sclerosis (MS) [Benedict and Zivadinov, 2011], and is now thought to predate the appearance of gross structural abnormalities found using conventional imaging techniques [Glanz et al., 2007]. Significantly, cognitive processes recruit extensive brain networks that may be affected by multifocal neuroinflammatory demyelination and axonal degeneration as occurs in these patients. As changes in cognitive impairment potentially relate to progression in MS, developing sensitive and specific markers for cognitive impairment is critical for identifying early neurological dysfunction and for assessing treatments that act to maintain or restore neuronal function early in the disease course.
Saccadic eye movements are influenced by a wide range of cognitive processes, in particular those involved in working memory and attention, with response inhibition a key determinant of motor output [Hutton, 2008]. We have previously shown that MS patients exhibit dysfunction in several saccadic behaviors including visually guided saccades, memory‐guided saccades, and antisaccades (AS), and that the degree of dysfunction correlates with cognitive test scores [Fielding et al., 2009a, 2009b, 2009c, 2012]. Deficits in working memory and attentional processes were evident across a range of ocular motor behaviors, reflected in slow and inaccurate volitional saccades and difficulty inhibiting inappropriate reflexive or preprogrammed saccades. In particular, patients displayed significant inaccuracies when performing the antisaccade (AS) task [Fielding et al., 2009a, 2012], which involves inhibiting a reflexive prosaccade in favor of a saccade of equal magnitude in the opposite direction. Cross‐sectionally, AS errors were found to negatively correlate with Paced Auditory Serial Addition Task (PASAT) scores [Fielding et al., 2009a, 2012] and longitudinally, the rate of increase in AS errors for more than 2 years correlated with the decline in PASAT performance [Fielding et al., 2012], demonstrating the utility of the AS paradigm as a marker of cognitive function.
Functional magnetic resonance imaging (fMRI) studies have reported multiple cortical and subcortical regions implicated in performing AS compared to prosaccades including primary visual cortex, dorsolateral prefrontal cortex, frontal eye fields, parietal eye fields, supramarginal gyrus, anterior cingulate cortex, thalamus, and cerebellum [Ettinger et al., 2008; Matsuda et al., 2004]. The structural connectivity between these regions traverses many of the major white‐matter pathways of the brain. As such, patients with multifocal white‐ and gray‐matter lesions characteristic of MS are likely to be highly susceptible to diminished performance on the AS task. However, it remains unclear whether AS dysfunction in MS is a product of generalized dysfunction of the AS network or damage to specific vulnerable pathways.
Recent studies employing diffusion tensor imaging (DTI), a MRI technique sensitive to anisotropic water diffusion in white matter, have demonstrated associations between cognitive dysfunction and damage to specific white‐matter pathways in MS patients including the cingulum, the corpus callosum, and the cerebellar peduncles [Dineen et al., 2009; Mesaros et al., 2012; Roosendaal et al., 2009]. However, no similar studies have been undertaken to establish the underlying neuropathological sources of AS dysfunction in MS. We have previously shown that DTI together with macroscopic volumetric assessments can provide complementary information regarding the loss of primary visual function in the context of MS [Kolbe et al., 2009]. In this study, we utilized these two complementary techniques to assess the macro‐ and microstructural alterations to white and gray matter associated with AS errors in patients with MS. We hypothesized, based on the previous evidence linking cognitive dysfunction and damage to the cingulum, corpus callosum, and cerebellum, that dysfunction to cognitively controlled saccades would also be associated with atrophy of and microstructural alterations within these regions.
MATERIALS AND METHODS
Participants
Twenty‐four participants were recruited prospectively from the Royal Melbourne Hospital MS outpatient clinic. Patients were included based on: (a) diagnosis of clinically definite relapsing–remitting MS, (b) lack of overt oculomotor impairments such as nystagmus, and (c) lack of overt clinical relapse at the time of testing. Fourteen healthy control subjects were recruited for comparison and reported no history of neurological or psychiatric illness. Demographic and disease characteristics for patients and controls are summarized in Table 1. Patient and control cohorts were not different in terms of age (P = 0.15) or IQ (P = 0.89). Patients underwent a standard clinical neurological examination as well as ocular motor testing, neuropsychological assessment, and MR imaging. This study was approved by the Royal Melbourne Hospital Human Research Ethics Committee. All participants provided voluntary written consent in accordance with the Declaration of Helsinki.
Table 1.
Demographic, disease, AS, and cognitive parameters for patients and control subjects
| Controls (median range) | Patients (median range) | Difference from control (P)a | Correlation with AS errors (Spearman's ρ) | |
|---|---|---|---|---|
| Age (years) | 41 (30–62) | 47 (28–63) | 0.15 | 0.26 |
| Disease duration (years) | — | 6 (2–18) | — | 0.12 |
| NART IQ | 116 (107–124) | 113 (101–119) (n = 21) | 0.89 | −0.07 |
| EDSS | — | 3 (1–6) | — | 0.16 |
| Lesion Fraction (%) | — | 1.1 (0.01–14) | — | 0.16 |
| BPF (%) | — | 83.3 (75.5–88.7) | — | −0.33 |
| PASAT | 85.8 (80–100) | 84.2 (33.3–100) (n = 20) | 0.02 | −0.48 (P = 0.03) |
| SDMT | 66 (54–77) | 54 (30–72) (n = 21) | <0.0001 | −0.66 (P = 0.001) |
| AS latency (ms) | 256 (197–343) | 310 (217–467) (n = 23) | 0.005 | 0.20 |
| AS errors (%) | 8.3 (2.1–22.9) | 29.1 (0–95.8) | <0.0001 | — |
P‐values were calculated from nonparametric Mann–Whitney U‐tests. For controls, n = 24 and for patients n = 24 unless otherwise stated.
Neuropsychological Tests
Neuropsychological tests were administered using standardized instructions and included the PASAT, the California Verbal Learning Test: learning stage (CVLT), Symbol Digit Modalities Test (SDMT), and the backward digit span subtest derived from the Wechsler Adult Intelligence Scale (WAIS‐III), as recommended by Sartori and Edan (2006). The National Adult Reading Test (NART) [Nelson, 1982] was used to indicate IQ.
Antisaccade Task
Horizontal displacement of the eye was recorded using a Skalar IRIS infrared eye tracker (Skalar Medical, BV, Delft, The Netherlands), with output sampled at 1 kHz. Stimuli were generated using E‐Prime software (Psychology Software Tools, Pennsylvania) and displayed on a 53‐cm monitor (Mitsubishi Electric, Tokyo, Japan), viewed at a distance of 840 mm. Participant's head stabilization was facilitated using a custom‐made bite bar. A photodiode placed directly over a nonvisible portion of the screen concurrently recorded stimulus changes in real time.
The AS stimulus presentation sequence is shown in Figure 1. Participants were first instructed to fixate a centrally positioned target (green cross, 30 × 30 mm). After either 1,250 or 1,600 ms, the target disappeared coincident with the appearance of a peripheral target (green cross, 30 × 30 mm, 5 or 10° from center in either hemi‐field). Participants were instructed to make a saccade opposite and equidistant from the target. The target disappeared after 1,500 ms and a refixation stimulus (white square ring, 10 × 10 mm) was presented for 150 ms during which time subjects redirected gaze back to center prior to the onset of the next trial. Subjects completed 48 trials (equal numbers of left and right for both 5 and 10°) after completing a variable number of practice trials. Antisaccade latency (ms) and AS errors (incorrect saccade toward a peripheral target: %) were recorded and analyzed.
Figure 1.
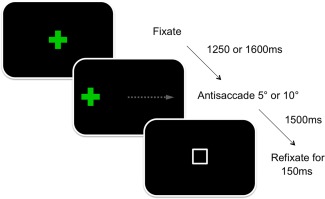
A schematic representation of the AS task. The stimulus (green cross) disappears and reappears in one hemisphere eliciting a saccade in the opposite direction of equal magnitude (gray arrow). A white refixation box appears upon completion of each trial. [Color figure can be viewed in the online issue, which is available at http://wileyonlinelibrary.com.]
MRI Acquisition and Lesion Assessments
All MRI scans were performed using a 3‐Tesla MRI system (Trio TIM, Siemens, Erlangen, Germany) with a 12‐channel head coil. Specific MRI sequence parameters are included in Supporting Information. Three MRI sequences were acquired for each subject, a 3D whole brain fluid‐attenuated inversion recovery (FLAIR) T2‐weighted sequence for lesion identification, a 3D whole brain T1‐weighted sequence for volumetric assessments, and a whole brain 60‐direction diffusion‐weighted spin‐echo echo‐planar imaging sequence for calculation of DTI parameters. Lesions were delineated on the FLAIR images using a semi‐automated thresholding technique [Rorden and Brett, 2000]. For each patient, lesion volume was calculated as a percentage of brain parenchymal volume.
DTI Analysis
Whole brain diffusion‐weighted images were eddy‐current corrected and realigned using a linear registration algorithm (FLIRT, FSL) [Jenkinson and Smith, 2001]. The diffusion tensor was calculated using FSL diffusion toolkit [Behrens et al., 2003]. To perform voxel‐wise assessments of gray‐ and white‐matter DTI parameters, DTI data were normalized to MNI152 space using a diffusion tensor image registration toolkit (DTI‐TK) [Zhang et al., 2006]. Because of the lack of a suitable DTI template, we constructed a study‐specific template in MNI‐152 space using the following procedure.
First, an initial estimate of the registration was obtained by linearly registering each subject's DTI data to the ICBM DTI‐81 template. The resulting linearly registered images were averaged to create a first‐pass template. Next, each subject's DTI data were linearly and nonlinearly registered to the first‐pass template and the resulting registered DTI data were averaged to create a second‐pass template. This procedure was repeated to create the final (third‐pass) template. Each subject's DTI data were subsequently normalized to the final template using an affine and nonlinear registration. Mean diffusivity (MD) and fractional anisotropy (FA) maps were calculated from the normalized DTI data for each subject. The MD and FA maps were smoothed using a Gaussian kernel (full width at half maximum, 5 mm) and analyzed using voxel‐wise statistical procedures described in the Statistical Analyses section.
Volumetric Analysis
Volumes of cortical and subcortical brain structures were calculated using probabilistic atlases registered to each subject's T1‐weighted volumetric image. First, T1‐weighted images were skull‐stripped using brain extraction tool (BET) [Smith, 2002] and segmented into GM, WM, and CSF using a segmentation algorithm (FAST) [Zhang et al., 2001]. Skull‐stripped images were checked and manually edited if necessary to remove voxels in the neck and around the orbits not removed by BET. Voxels previously classified as lesion on FLAIR scans were manually classified as WM. For each subject, the total volume of GM, WM, and CSF was calculated as the intracranial volume, the total volume of GM and WM was calculated as brain parenchymal volume, and the brain parenchymal fraction (BPF) was calculated as the fraction of parenchyma to total intracranial volume expressed as a percentage.
The T1‐weighted images were registered to a standard brain atlas (MNI152) by first using a 12‐parameter affine registration (FLIRT) followed by a nonlinear deformable registration (FNIRT, FSL, FMRIB, Oxford, United Kingdom). The deformation field required to transform each subject's image to standard space as well as the inverse deformation was calculated. The inverse deformation field was used to transform standard space regions of interest (ROIs) to each subject's T1 image. All ROIs were obtained from the published probabilistic atlases described in the following section. Each ROI was multiplied by each subject's GM mask to obtain weighted volumes for region‐specific cortical and subcortical GM. Regional volumes were analyzed using statistical procedures described in the Statistical Analyses section.
Two probabilistic atlases were used in this study. The first atlas contained 48 cortical and 21 subcortical structures defined using T1‐weighted scans from 37 healthy subjects (http://www.fmrib.ox.ac.uk/fsl/data/atlas-descriptions.html). The second atlas contained 28 cerebellar subregions defined using T1‐weighted scans from 20 healthy subjects [Diedrichsen et al., 2009]. Both atlases contained values ranging from 0 to 100, indicating the percentage probability of a specific structure being located in each voxel. Individual ROIs were thresholded at 15% to remove low‐probability voxels and reduce overlap between neighboring regions.
Statistical Analyses
Neuropsychological scores and AS errors in patients were compared to controls using nonparametric Mann–Whitney U‐tests. Correlations were performed between AS errors in patients and AS latency, clinical parameters (age, Expanded Disability Status Scale (EDSS) score, lesion fraction, and BPF) and neuropsychological scores (PASAT, SDMT, CVLT, Digit Span, and NART IQ) using Spearman's rank correlation procedures.
Voxel‐wise linear regressions were performed between AS errors and FA or MD maps which were masked to exclude nonbrain voxels using BET [Smith, 2002]. Regression analyzed was adjusted for age and sex and performed using a permutation‐based statistical testing method (RANDOMISE) [Nichols and Holmes, 2002] with 5,000 samples. The resulting P‐value maps were corrected for multiple comparisons using the threshold‐free cluster enhancement (TFCE) method [Smith and Nichols, 2009]. Voxels with TFCE corrected P‐values of <0.05 were considered significant. In addition to regression analyses, we performed voxel‐wise group analyses between patients and healthy controls to establish the degree of white‐ and gray‐matter injury in patients.
Partial linear regressions were performed between AS errors and gray‐matter volumes for each cortical, subcortical, and cerebellar ROI adjusting for age, sex, and BPF. For each ROI, the P‐value was calculated from the median beta weight from 5,000 bootstrap regressions. Given the large number of ROIs analyzed, multiple comparison correction was performed using the false discovery rate (FDR) method [Benjamini and Yekutieli, 1995]. FDR‐corrected P‐values (q‐values) of <0.05 were considered significant.
RESULTS
Disease Severity and AS Errors
Patients had a median EDSS of 3 (range, 1–6), lesion fraction of 1.1% (range, 0.01–14%), and BPF of 83.3% (range, 75.5–88.7) (Table 1). No correlations with AS errors were detected for EDSS, lesion fraction, or BPF. Compared to control participants, patients displayed no significant difference in IQ (P = 0.89). However, patients scored lower on the PASAT (P = 0.02) and SDMT (P < 0.0001) and reductions in scores for both tests were associated with a greater number of AS errors (PASAT: ρ = −0.48, P = 0.03; SDMT: ρ = −0.66, P = 0.001, Figs. 2 and 3). We did not detect any significant correlations between clinical or cognitive variables and AS latency.
Figure 2.
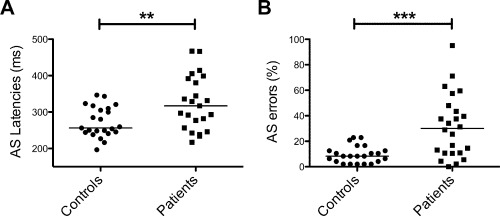
AS latencies (A) and errors (B) for controls and patients. (**P < 0.01 and ***P < 0.0001 for Mann–Whitney U‐tests).
Figure 3.
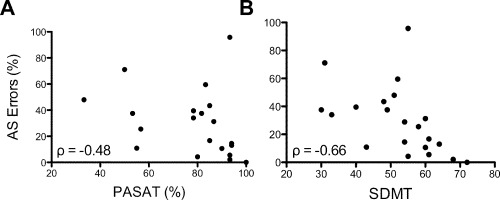
Scatterplots illustrating covariation between AS errors and PASAT (A) and SDMT (B). Spearman's rho correlation coefficients are shown in the bottom left of each plot.
DTI and AS Errors
Voxel‐wise comparisons of FA and MD between patients and controls demonstrated reduced FA and increased MD (TFCE corrected) across most of the brain in patients compared to controls (Supporting Information Figs. 1 and 2). Regions of significant covariation between AS errors and FA or MD were detected within the cerebellum exclusively after adjustment for age and sex and multiple comparison correction using the TFCE method. For both FA and MD, the cluster centers of mass were located within the cerebellar vermis (FA: vermis VI; MD: vermis–Crus II) (Table 2). For FA, the region extended across much of the cerebellum (Fig. 4) but for MD, the region was restricted to a small cluster surrounding the vermis (Fig. 5).
Table 2.
Summary statistics for voxel‐wise regression analyses between AS errors and FA or MD
| Cluster volume (mm3) | Cluster max TFCE corrected P‐value | Cluster max P‐value voxel coordinate (MNI space) | Cluster center of mass coordinate (MNI space) | |
|---|---|---|---|---|
| FA | 78,375 | 0.009 | 24, −83, −32 (Right Crus I) | −2, −70, −26 (Vermis VI) |
| MD | 3,840 | 0.026 | 1, −73, −30 (vermis–Crus II) | −3, −73, −29 (vermis–Crus II) |
Figure 4.
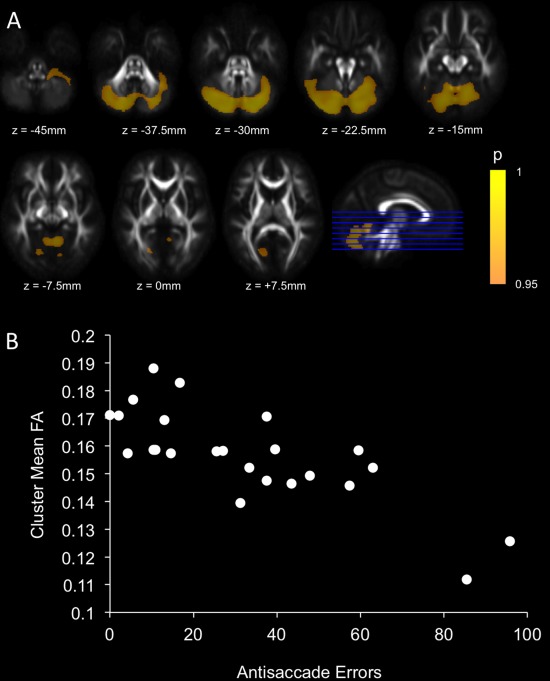
Regions of significant covariation after TFCE correction between FA and AS errors after adjustment for age and sex (A). Scatterplot illustrating the covariation between mean FA within the significant cluster and AS errors for patients (B). [Color figure can be viewed in the online issue, which is available at http://wileyonlinelibrary.com.]
Figure 5.
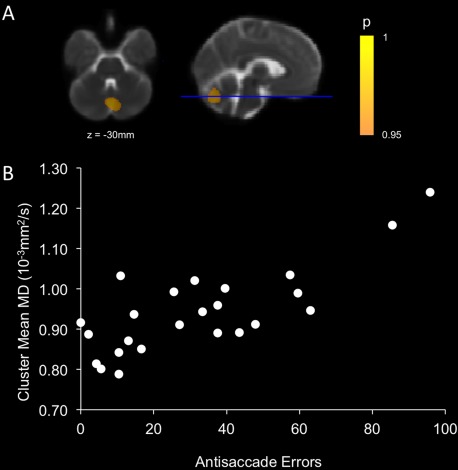
Regions of significant covariation after TFCE correction between MD and AS errors after adjustment for age and sex (A). Scatterplot illustrating the covariation between mean MD within the significant cluster and AS errors for patients (B). [Color figure can be viewed in the online issue, which is available at http://wileyonlinelibrary.com.]
Regional GM Volume and AS Errors
After adjustment for BPF, age, and sex and FDR multiple comparison correction, only cerebellum right VI GM volume remained significantly associated with AS errors (q = 0.027) (Fig. 6). Gray‐matter volume in an additional 18 cerebellum subregions correlated with AS errors at an uncorrected level (P < 0.05 but FDR correct q > 0.05) (Supporting Information Table).
Figure 6.
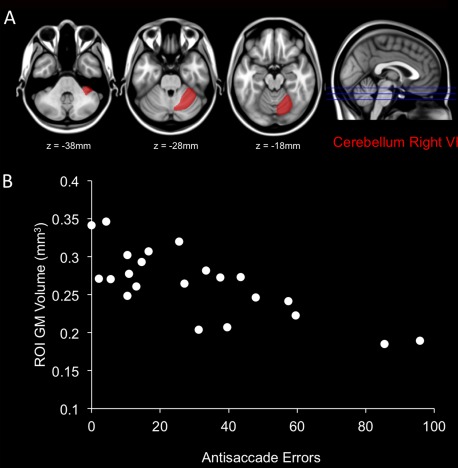
Significant covariation was observed between gray matter (GM) atrophy in the cerebellum right VI subregion and AS errors after adjustment for BPF, age and sex (A). Scatterplot illustrating the covariation between GM volume within the cerebellum right VI and AS errors for patients (B). [Color figure can be viewed in the online issue, which is available at http://wileyonlinelibrary.com.]
DISCUSSION
Cognitive dysfunction is an important and often overlooked disability in MS. AS and other saccadic eye movements can reveal many aspects of cognition, and hence quantification of erroneous eye movements can provide a highly sensitive and objective behavioral marker for cognitive dysfunction. We have previously reported significant differences in AS performance between MS patients and controls [Fielding et al., 2009a]. The aim of this study was to assess the structural neural correlates of such dysfunction using MRI. We confirmed that patients in this study elicited significantly more AS errors than controls, and those errors were associated with cognitive dysfunction (worse PASAT and SDMT scores) but not clinical neurological or radiological disease progression (EDSS, lesion load, and brain atrophy). AS errors, therefore, reflect cognitive dysfunction to a greater extent than overall disease burden. AS latency did not correlate with either cognitive dysfunction or disease progression, suggesting a disassociation between physiological (response latency) and cognitive (response appropriateness) aspects of AS.
AS errors were associated with white‐ and gray‐matter injuries in the cerebellum in MS patients. Importantly, we were able to replicate this finding using two independent imaging acquisition and analysis techniques based on DTI and volumetric imaging. We observed significant covariation between AS errors and FA reduction across the cerebellum, suggesting that the cerebellar injuries contributing to AS errors may not be regionally specific. The MD increase associated with AS errors was confined to a small cluster around the cerebellar vermis, however, when multiple comparison corrections were relaxed (P uncorrected < 0.01) an extended area of subthreshold MD increase was also observed (data not shown). Similarly, comparisons of regional GM atrophy associated with AS errors implicated only the cerebellum right V1 subregion at a corrected level. However, at an uncorrected level an additional 18 subregions displayed significant covariation. Neuroimaging studies reporting voxel‐ or region‐wise statistics commonly employ strict multiple comparison corrections to avoid Type I errors. However, in cases where a spatial clustering is observed, relaxing statistical thresholds can be informative for revealing potential Type II errors. Importantly, both DTI and volumetric analyses implicate structural and microstructural changes within the cerebellum as a mechanism associated with dysfunction of cognitive aspects of AS in MS patients.
Several cerebellar regions implicated in this study have been reported in saccadic behaviors, including the vermis (Lobules V–VII) [Stanton et al., 1988a,1988b; Takagi et al., 1998; Van Opstal et al., 1996] and the cerebellar hemispheres which project to the cortex via the dentate nucleus [Ohki et al., 2009]. Until recently, the cerebellum was thought to be primarily involved in fine motor control, whereas more recent theories implicate a role for the cerebellum in cognitive processes [Schmahmann and Caplan, 2006]. Trans‐synaptic tracer studies have demonstrated cerebellar connectivity to nonmotor regions of the cerebral cortex, including prefrontal and parietal cortices, and thus identifying pathways by which the cerebellum could contribute to cognitive control processes governing eye movement [Schmahmann and Pandya, 1995]. Moreover, several cognitive processes relevant to the AS task have been proposed for the cerebellum including orientating attention, error detection and correction, and stimulus anticipation [Courchesne and Allen, 1997; Nitschke et al., 2003; Wolpert and Kawato, 1998].
Several recent human neuroimaging studies have implicated the contribution of cerebellar injury to cognitive dysfunction in MS patients [Mesaros et al., 2008, 2012; Rocca et al., 2010]. Mesaros et al. (2012) recently tested the ability of DTI measures in specific WM tracts to discriminate MS patients with and without cognitive impairments. The white‐matter pathways that best discriminated patients based on cognitive performance included the superior and middle cerebellar peduncles and the cingulum. An earlier study by Mesaros et al. (2008) reported greater regional cerebellar GM atrophy in patients with secondary progressive MS and cognitive impairment compared to patients with benign MS and no cognitive impairment. Patients with MS and cognitive impairment have also been reported to display increased cerebellar fMRI activation compared to cognitively intact patients [Rocca et al., 2010]. Rocca et al. (2010) propose that this might reflect a maladaptive response, possibly related to tissue damage. In contrast, two studies comparing DTI parameters in WM to cognitive performance in MS patients reported no associations with cerebellar WM changes but did report associations with damage to the corpus callosum [Dineen et al., 2009; Roosendaal et al., 2009] and cingulum [Dineen et al., 2009]. In contrast, we did not observe DTI changes in either the cingulum or the corpus callosum associated with AS dysfunction. This is potentially related to differences in study cohorts between our study and previous studies.
There is significant variability in the published findings of correlational analyses between parameters and functional scores in MS patient cohorts. This highlights the limitations of using cross‐sectional correlation analyses in studies where the relationship between brain injury and functional status is complex. A key motivation for using saccadic eye movements as a behavioral surrogate for assessing underlying cognitive decline relates to the sensitivity and objectivity of eye movement parameters. Further studies are required to assess the longitudinal variability of measuring these saccadic parameters in patients with MS, and the comparison of variability to the rate of cognitive decline or the accumulation of disability, particularly early in the course of the disease or in clinically isolated syndrome patients.
CONCLUSIONS
Cognitive dysfunction commonly occurs in MS patients and represents a significant burden of disease. Saccadic eye movement paradigms provide sensitive measures of cognitive function, in particular the executive and attentional processes of response selection and inhibition. The results of this study suggest that cerebellar injury contributes to ocular motor deficits in MS, and that saccadic measures may be useful for assessing cognitive dysfunction in MS patients.
Supporting information
Supplementary Information Figures
Supplementary Information Table
REFERENCES
- Behrens TE, Woolrich MW, Jenkinson M, Johansen‐Berg H, Nunes RG, Clare S, Matthews PM, Brady JM, Smith SM (2003): Characterization and propagation of uncertainty in diffusion‐weighted MR imaging. Magn Reson Med 50:1077–1088. [DOI] [PubMed] [Google Scholar]
- Benedict RH, Zivadinov R (2011): Risk factors for and management of cognitive dysfunction in multiple sclerosis. Nat Rev Neurol 7:332–342. [DOI] [PubMed] [Google Scholar]
- Benjamini Y, Yekutieli D (1995): The control of the false discovery rate in multiple testing under dependency. Ann Stats 29:1165–1188. [Google Scholar]
- Courchesne E, Allen G (1997): Prediction and preparation, fundamental functions of the cerebellum. Learn Mem 4:1–35. [DOI] [PubMed] [Google Scholar]
- Diedrichsen J, Balsters JH, Flavell J, Cussans E, Ramnani N (2009): A probabilistic MR atlas of the human cerebellum. Neuroimage 46:39–46. [DOI] [PubMed] [Google Scholar]
- Dineen RA, Vilisaar J, Hlinka J, Bradshaw CM, Morgan PS, Constantinescu CS, Auer DP (2009): Disconnection as a mechanism for cognitive dysfunction in multiple sclerosis. Brain 132:239–249. [DOI] [PubMed] [Google Scholar]
- Ettinger U, Ffytche DH, Kumari V, Kathmann N, Reuter B, Zelaya F, Williams SC. (2008): Decomposing the neural correlates of antisaccade eye movements using event‐related FMRI. Cereb Cortex 18:1148–1159. [DOI] [PubMed] [Google Scholar]
- Fielding J, Kilpatrick T, Millist L, White O (2009a): Antisaccade performance in patients with multiple sclerosis. Cortex 45:900–903. [DOI] [PubMed] [Google Scholar]
- Fielding J, Kilpatrick T, Millist L, White O (2009b): Control of visually guided saccades in multiple sclerosis: Disruption to higher‐order processes. Neuropsychologia 47:1647–1653. [DOI] [PubMed] [Google Scholar]
- Fielding J, Kilpatrick T, Millist L, White O (2009c): Multiple sclerosis: Cognition and saccadic eye movements. J Neurol Sci 277:32–36. [DOI] [PubMed] [Google Scholar]
- Fielding J, Kilpatrick T, Millist L, Clough M, White O (2012): Longitudinal assessment of antisaccades in patients with multiple sclerosis. PLoS One 7:e30475. [DOI] [PMC free article] [PubMed] [Google Scholar]
- Glanz BI, Holland CM, Gauthier SA, Amunwa EL, Liptak Z, Houtchens MK, Sperling RA, Khoury SJ, Guttmann CR, Weiner HL (2007): Cognitive dysfunction in patients with clinically isolated syndromes or newly diagnosed multiple sclerosis. Mult Scler 13:1004–1010. [DOI] [PubMed] [Google Scholar]
- Hutton SB (2008): Cognitive control of saccadic eye movements. Brain Cogn 68:327–340. [DOI] [PubMed] [Google Scholar]
- Jenkinson M, Smith S (2001): A global optimisation method for robust affine registration of brain images. Med Image Anal 5:143–156. [DOI] [PubMed] [Google Scholar]
- Kolbe S, Chapman C, Nguyen T, Bajraszewski C, Johnston L, Kean M, Mitchell P, Paine M, Butzkueven H, Kilpatrick T, Egan G (2009): Optic nerve diffusion changes and atrophy jointly predict visual dysfunction after optic neuritis. Neuroimage 45:679–686. [DOI] [PubMed] [Google Scholar]
- Matsuda T, Matsuura M, Ohkubo T, Ohkubo H, Matsushima E, Inoue K, Taira M, Kojima T (2004): Functional MRI mapping of brain activation during visually guided saccades and antisaccades: Cortical and subcortical networks. Psychiatry Res 131:147–155. [DOI] [PubMed] [Google Scholar]
- Mesaros S, Rovaris M, Pagani E, Pulizzi A, Caputo D, Ghezzi A, Bertolotto A, Capra R, Falautano M, Martinelli V, Comi G, Filippi M (2008): A magnetic resonance imaging voxel‐based morphometry study of regional gray matter atrophy in patients with benign multiple sclerosis. Arch Neurol 65:1223–1230. [DOI] [PubMed] [Google Scholar]
- Mesaros S, Rocca MA, Kacar K, Kostic J, Copetti M, Stosic‐Opincal T, Preziosa P, Sala S, Riccitelli G, Horsfield MA, Drulovic J, Comi G, Filippi M (2012): Diffusion tensor MRI tractography and cognitive impairment in multiple sclerosis. Neurology 78:969–975. [DOI] [PubMed] [Google Scholar]
- Nelson HE (1982): The National Adult Reading Test (NART): Test Manual. Windsor, UK: NFER‐Nelson. [Google Scholar]
- Nichols TE, Holmes AP (2002): Nonparametric permutation tests for functional neuroimaging: A primer with examples. Hum Brain Mapp 15:1–25. [DOI] [PMC free article] [PubMed] [Google Scholar]
- Nitschke MF, Stavrou G, Melchert UH, Erdmann C, Petersen D, Wessel K, Heide W (2003): Modulation of cerebellar activation by predictive and non‐predictive sequential finger movements. Cerebellum 2:233–240. [DOI] [PubMed] [Google Scholar]
- Ohki M, Kitazawa H, Hiramatsu T, Kaga K, Kitamura T, Yamada J, Nagao S (2009): Role of primate cerebellar hemisphere in voluntary eye movement control revealed by lesion effects. J Neurophysiol 101:934–947. [DOI] [PubMed] [Google Scholar]
- Rocca MA, Riccitelli G, Rodegher M, Ceccarelli A, Falini A, Falautano M, Meani A, Comi G, Filippi M (2010): Functional MR imaging correlates of neuropsychological impairment in primary‐progressive multiple sclerosis. AJNR Am J Neuroradiol 31:1240–1246. [DOI] [PMC free article] [PubMed] [Google Scholar]
- Roosendaal SD, Geurts JJG, Vrenken H, Hulst HE, Cover KS, Castelijns JA, Pouwels PJW, Barkhof F (2009): Regional DTI differences in multiple sclerosis patients. Neuroimage 44:1397–1403. [DOI] [PubMed] [Google Scholar]
- Rorden C, Brett M (2000): Stereotaxic display of brain lesions. Behav Neurol 12:191–200. [DOI] [PubMed] [Google Scholar]
- Sartori E, Edan G (2006): Assessment of cognitive dysfunction in multiple sclerosis. J Neurol Sci 245:169–175. [DOI] [PubMed] [Google Scholar]
- Schmahmann JD, Caplan D (2006): Cognition, emotion and the cerebellum. Brain 129:290–292. [DOI] [PubMed] [Google Scholar]
- Schmahmann JD, Pandya DN (1995): Prefrontal cortex projections to the basilar pons in rhesus monkey: Implications for the cerebellar contribution to higher function. Neurosci Lett 199:175–178. [DOI] [PubMed] [Google Scholar]
- Smith SM (2002): Fast robust automated brain extraction. Hum Brain Mapp 17:143–155. [DOI] [PMC free article] [PubMed] [Google Scholar]
- Smith SM, Nichols TE (2009): Threshold‐free cluster enhancement: Addressing problems of smoothing, threshold dependence and localisation in cluster inference. Neuroimage 44:83–98. [DOI] [PubMed] [Google Scholar]
- Stanton GB, Goldberg ME, Bruce CJ (1988a): Frontal eye field efferents in the macaque monkey: I. Subcortical pathways and topography of striatal and thalamic terminal fields. J Comp Neurol 271:473–492. [DOI] [PubMed] [Google Scholar]
- Stanton GB, Goldberg ME, Bruce CJ (1988b): Frontal eye field efferents in the macaque monkey: II. Topography of terminal fields in midbrain and pons. J Comp Neurol 271:493–506. [DOI] [PubMed] [Google Scholar]
- Takagi M, Zee DS, Tamargo RJ (1998): Effects of lesions of the oculomotor vermis on eye movements in primate: Saccades. J Neurophysiol 80:1911–1931. [DOI] [PubMed] [Google Scholar]
- Van Opstal J, Hepp K, Suzuki Y, Henn V (1996): Role of monkey nucleus reticularis tegmenti pontis in the stabilization of Listing's plane. J Neurosci 16:7284–7296. [DOI] [PMC free article] [PubMed] [Google Scholar]
- Wolpert DM, Kawato M (1998): Multiple paired forward and inverse models for motor control. Neural Netw 11:1317–1329. [DOI] [PubMed] [Google Scholar]
- Zhang H, Yushkevich P, Alexander D, Gee J (2006): Deformable registration of diffusion tensor MR images with explicit orientation optimization. Med Image Anal 10:764–785. [DOI] [PubMed] [Google Scholar]
- Zhang Y, Brady M, Smith S (2001): Segmentation of brain MR images through a hidden Markov random field model and the expectation‐maximization algorithm. IEEE Trans Med Imaging 20:45–57. [DOI] [PubMed] [Google Scholar]
Associated Data
This section collects any data citations, data availability statements, or supplementary materials included in this article.
Supplementary Materials
Supplementary Information Figures
Supplementary Information Table


