

Abstract
Microstructural analyses by MRI brain scans and by DTI analysis of MR images were used to investigate the possible relationship between deep gray matter structures (amygdala and hippocampus) and dreaming in healthy subjects. Thirty‐four subjects ranging in age 20s to 70s underwent to a MRI protocol for the assessment of volume and mean diffusivity (MD) in the amygdala and hippocampus and were asked to fill out a dream diary via audiotape recording upon morning awakening for two weeks. Multiple regression analyses evaluated the relationships between anatomical measures and quantitative and qualitative measures of the reported dreams. The main result points to a dissociation between some quantitative and qualitative aspects of dream reports. While the mean number of dreams recalled per day did not show any significant relationship with the neuroanatomical measures, significant associations with some qualitative features of the recalled dreams (emotional load, bizarreness, and vividness) and, to some extent, with the length of dream reports were observed. Particularly, a higher MD of the left amygdala, reflecting a decreased microstructural integrity, was associated with shorter dream reports and lower scores on emotional load. Bizarreness of dream reports was negatively correlated with the left amygdala volume and positively correlated with the right amygdala MD. Some specific, although weaker, relationships were also found between bizarreness and hippocampal measures. These findings indicate some direct relationships between volumetric and ultrastructural measures of the hippocampus‐amygdala complex and specific qualitative features of dreaming. Hum Brain Mapp, 2010. © 2010 Wiley‐Liss, Inc.
Keywords: amygdala, hippocampus, dreaming, sleep, MRI, DTI
INTRODUCTION
Laboratory studies have consistently shown that dreaming (i.e., processing of a dream experience) is an essential part of all stages of human sleep. The frequency of successful recall upon provoked awakening is more than 80% for REM sleep (REMS) and about 50% for NREM sleep (NREMS) [for review, see Nielsen,2000]. The contents of dreaming can be more or less “dreamlike” (i.e., perceptually vivid, bizarre, and emotionally charged) according to whether they are collected upon awakening from REMS or NREMS [for review, see Fagioli,2002].
The specific functions of the brain structures, which are putatively involved in the processing of dreaming experiences, are partly unknown. Studies carried out within the so‐called “neuropsychology of dreaming” framework [Hobson et al.,1998a; Stickgold et al.,2001a] have outlined a fairly coherent, albeit not complete, picture of how brain structures interact in dreaming. Particularly, two deep gray matter structures, the hippocampus and the amygdala seem to play an important role in the processing of mnestic and emotional sources of dream contents, respectively.
Concerning the hippocampus, it has been hypothesized [Nielsen and Stenstrom,2005] that its specific activity during sleep compared to wakefulness is responsible for the partial reproduction of memories of events occurred during wakefulness into dream contents [Fosse et al.,2003]. Neuroimaging studies have shown that the activity in the hippocampus, entorhinal cortex, and other perihippocampal regions increases during REMS compared with both wakefulness and NREMS [Hobson et al.,1998b; Nofzinger et al.,2002] and is correlated with the oculomotor activity during REMS [Hong et al.,1995; Peigneux et al.,2001; Wehrle et al.,2005]. Others have reported an increased cerebral blood flow in the hippocampal formation during REMS compared with wakefulness, and no differences between Slow‐Wave Sleep (SWS) and wakefulness [Braun et al.,1997]. Finally, healthy subjects without training for any daytime task have shown bilateral higher regional activity in the hippocampal formation and parahippocampal gyrus during NREMS and REMS compared to wakefulness, and higher during SWS than during REMS [Peigneux et al.,2004].
More directly linked to the current topic, an investigation using stereo‐EEG recordings in epileptic patients has shown a close association between a successful recall of a dream upon awakening from a period of REM sleep and an enhancement in rhinal‐hippocampal and intrahippocampal EEG connectivity during such period [Fell et al.,2006].
With regard to the amydgala, involved during wakefulness in both control of the encoding and retrieval of emotional memories and the physical expression of emotions [Misane et al.,2005], its activity is higher during REMS [Maquet,2000; Wehrle et al.,2007] and NREMS [Nofzinger et al.,2002] compared to wakefulness. More directly, Maquet et al. [1996] have shown a bilateral amygdalar activation in subjects capable to report a dream upon awakening from REMS. However, there was no comparison with awakenings from REMS without dream reports or with awakenings from NREMS. These findings have however legitimated the hypothesis that the combined hippocampal and amygdalar (re)activation would allow a readout of emotionally salient memory fragments in REMS [Hobson and Pace‐Schott,2002].
The function of hippocampus and amygdala during sleep may be complementary, since the retrieval of cues of fear‐conditioning stimuli has proved capable to affect the emotional quality of dream experience of NREMS [Wamsley and Antrobus,2009]. During wakefulness, both hippocampus and amygdala are involved in the processing and execution of fear memories [Selden et al.,1991], and recent studies on the circuitry of fear conditioning and extinction point to the basolateral amygdala as the primary site of initial plasticity of both fear and extinction memory, with hippocampus mediating contextual aspects of both [Ji and Maren,2007; Quirk and Mueller,2008; Milad et al.,2007]. Hence, a specific form of learning involving amygdala and hippocampus at different stages seems susceptible to affect the emotional quality of dreaming.
Several recent findings converge to indicate that the structural characteristics of hippocampus and amygdala are associated with cognitive and emotional processing in waking tasks [Maguire et al.,2000; Bohbot et al.,2007; Iaria et al.,2008]. More generally, a relationship between diffusion anisotropy of distinct brain regions and specific cognitive skills—such as reading abilities [Klingberg et al.,2000], visuo‐spatial attention [Tuch et al.,2005], visual target detection [Madden et al.,2004], and mental rotation [Wolbers et al.,2006]—has been recently found in healthy young individuals.
These findings suggest that the individual volumetric and ultrastructural measures of hippocampus and amygdala, which are stable over time, may be related to similarly stable (i.e., trait‐like) individual features of dream experience.
Aiming to test the hypothesis that individual volumetric and ultrastructural measures of hippocampus and amygdala are related to characteristics of dream experience, we examined the relationships between specific quantitative (dream recall frequency per night and length of dream reports) and qualitative measures (bizarreness, vividness, and emotional load) of dreams reported by a sample of healthy individuals, on the one hand, and the volumetric and ultrastructural measures of right and left hippocampus and amygdala, on the other hand.
In our view, this approach may overcome some of the limits of the existing literature: (A) the brain mechanisms underlying dreaming are still largely unknown; (B) empirical data are scarce; (C) the study of the brain mechanisms involved in dreaming has been restricted to REMS, under the implicit assumption that dreaming strictly depends on the specific physiology of REMS; (D) PET and fMRI methods have a low temporal resolution with some intrinsic difficulties to “capture” changes on a hourly time scale.
Volumetric and ultrastructural measures of hippocampus and amydgala were obtained by means of 3 Tesla high‐resolution T1‐weighted MR images—that provide sufficient anatomical detail to measure the volume of gray matter (GM) of subcortical nuclei [Pfefferbaum et al.,1994; Good et al.,2001; Fox and Schott,2004]—and Diffusion Tensor Imaging (DTI). These images allow studying microstructural alterations at GM level and interindividual differences in the brain tissue [Cherubini et al.,2009b; Muller et al.,2007; Piras et al.,2010]. It is common practice in DTI to identify as “Mean Diffusivity” (MD) the scalar parameter corresponding to the average of the three eigenvalues—or principal diffusivities—(L1+L2+L3)/3. This parameter is influenced by the amount of cellular barriers that restrict the free diffusion of water molecules in tissues. Indeed, recent studies using diffusion MRI and DTI show that a loss in neuronal spines and synapses, or an increase in extracellular space following neuronal loss causes an increase in diffusivity values (observed in DTI measures as an increase in MD). Consequently, these changes can be interpreted as an early dysfunction of the gray matter structures that precedes the atrophy [Cherubini et al.,2009b, Cherubini et al.,2010], or as an indirect measure of neuroprotection efficiency [Carlesimo et al.,2010; Piras et al.,2010].
More in detail, a smaller volume is usually associated with a structural atrophy, as a potential indicator of subtle tissue disruption and/or decreased function in both hippocampus [Cherubini et al.,2010] and amygdala [van Eijndhoven et al.,2009]. A higher MD in the hippocampus is associated with aging [Piras et al.,2010], with lower education [Piras et al.,2010], and with Alzheimer's disease [Wang et al.,2010; Cherubini et al.,2010]. A higher MD in the amygdala is associated to lifetime alcohol consumption [Sasaki et al.,2009], and with Alzheimer's disease [Cherubini et al.,2010; Rose et al.,2008].
A complete picture of the functional correlates of these structural or microstructural changes in the hippocampus and amygdala still lacks, though two very recent studies have shown that a reduction of the hippocampal volume in nondemented elderly parallels [Carlesimo et al.,2010] and precedes [den Heijer et al.,2010] a specific decline in delayed word recall.
On this basis, in this study we collected volumetric and ultrastructural measures of the hippocampus and the amygdala, under the hypothesis that their interindividual differences may be associated with variations of the quantitative and qualitative characteristics of dreaming.
MATERIALS AND METHODS
Participants
Thirty‐four healthy subjects (22 women, 12 men; mean age ± standard error [SE] = 37.7 ± 2.7 years; age range = 19–74 years; education level: 15.5 years; SE = 0.5) gave their informed written consent to participate in the study, which was approved by the Joint Ethics Committee of the “Fondazione Santa Lucia.” All subjects, who were right‐handed according to the Edinburgh Handedness Inventory [Oldfield,1971], were unaware of the aims of the study.
Inclusion criteria were as follows: (i) Vision and hearing sufficient for compliance with testing procedures; (ii) Laboratory values within the normal reference intervals; (iii) Neuropsychological scores (the neuropsychological tests are described in the experimental procedures section) above the cut‐off values, corrected for age and education, identifying normal cognitive level in the Italian population.
Exclusion criteria were as follows: (i) Major medical illnesses, history of alcoholism or drug dependence and abuse during lifetime; (ii) Mental disorders according with DSM‐IV criteria [American Psychiatric Association,2000], as assessed by the Structured Clinical Interviews for DSM‐IV Axis I (SCID‐I [First et al.,1996]) and Axis II (SCID‐II [First et al.,1997]), and/or neurologic disorders diagnosed by an accurate clinical neurological examination; (iii) Dementia diagnosis, according to DSM‐IV criteria [American Psychiatric Association,2000] or Mild Cognitive Impairment (MCI) according to Petersen criteria [Petersen et al.,1999], and confirmed by through the Mental Deterioration Battery (MDB [Carlesimo et al.,1996]); (iv) Mini Mental State Examination (MMSE) score <27 [Folstein et al.,1975]; v. Presence of vascular brain lesions, white matter lesions, brain tumor and/or cortical and subcortical atrophy, even of mild level, as assessed through MRI scan; (vi) Presence of sleep disorders, as assessed by a >5 score at the 19‐item Pittsburgh Sleep Quality Index [Buysse et al.,1989].
Two expert blind neuroradiologists examined independently all MRIs to exclude potential brain abnormalities. White matter lesions were considered present if they were hyperintense on both FLAIR and T2 weighted images. We included only subjects who, according to both observers, had not lesions. Thus, even one visible lesion of any dimension was considered as an exclusion criterion.
Study Design
All subjects who were considered eligible for the study were submitted to a neuropsychological examination and an MRI experimental protocol.
Cognitive Evaluation
A trained psychologist, unaware of the study aims and design, conducted the cognitive evaluation of individuals eligible for the study. MMSE was used to obtain a global index of cognitive level, and the Mental Deterioration Battery (MDB: Carlesimo et al.,1996] was used to assess single cognitive domains.
Dream Collection
Participants were requested to maintain regular sleep habits during the two weeks of the study and to record their dreams after each morning awakening by dictating them into a hand‐held tape‐recorder. Subjects were instructed to give an as accurate as possible description of any aspect of the dream experienced and, when more than one dream was recalled, to specify when a distinct dream was going to be reported [Cohen,1979]. The procedure was repeated for 14 consecutive days. The technique of audio‐recording—instead of writing—was chosen since it provides a more accurate report of dream mentation and a higher compliance [Casagrande and Cortini,2008; Mazzetti et al.,2010].
After dream tape‐recording, a sleep diary was completed, in order to collect subjective estimates of the characteristics of the overall night‐time sleep (sleep duration, possible occurrence of nightmares, and/or spontaneous arousal after one or more of the reported dreams).
Dream reports were collected at home instead of at laboratory because it has been shown in previous studies that: (a) after a night of uninterrupted sleep the frequency and qualitative characteristics of dreams recalled upon morning awakening are comparable in home and laboratory context [Weisz and Foulkes,1970; Cohen,1979]; (b) the qualitative characteristics of dream experiences elaborated during NREMS and REMS in the second half of the night are more similar (and more “dreamlike”) than those elaborated at the beginning of the night [Snyder,1970; Foulkes and Pope,1973; Foulkes and Schmidt,1983]; (c) the likelihood of spontaneous awakening in REMS and NREMS at morning is fairly similar [Webb and Kersey,1967; Weisz and Foulkes,1970] and with comparable proportions of successful recall of dreams [De Gennaro et al.,2010].
MRI Protocol
All participants underwent the same neuroimaging protocol with a whole‐brain T1‐weighted and diffusion‐weighted scanning using a 3T Allegra MR imager (Siemens, Erlangen, Germany) with a standard quadrature head coil. All planar sequence acquisitions were obtained in the plane of the AC‐PC line. Particular care was taken to center the subject in the head coil and to restrain the subject's movements with cushions and adhesive medical tape. Diffusion‐weighted volumes were acquired using spin‐echo echo‐planar imaging (TE/TR = 89/8500 ms, bandwidth = 2126 Hz/vx; matrix size 128 × 128; 80 axial slices, voxel size 1.8 × 1.8 × 1.8 mm3) with 30 isotropically distributed orientations for the diffusion‐sensitising gradients at a b‐value of 1,000 s·mm2 and 6 b = 0 images. Scanning was repeated three times to increase the signal‐to‐noise ratio. Whole‐brain T1‐weighted images were obtained in the sagittal plane using a modified driven equilibrium Fourier transform [MDEFT [Deichmann et al.,2004]] sequence (TE/TR = 2.4/7.92 ms, flip angle 15°, voxel‐size 1 × 1 × 1 mm3).
Image processing was performed using FSL 4.1 (http://www.fmrib.ox.ac.uk/fsl/) and in‐house developed software (Matlab 6.5, The MathWorks) with procedures similar to those described in previous works [Cherubini et al.,2009a,b).
Image distortions induced by eddy currents and head motion in the DTI data were corrected by applying a 3D full affine (mutual information cost function) alignment of each image to the mean no diffusion weighting (b0) image. After distortion corrections, DTI data were averaged and concatenated into 31 (1 b0 + 30 b1000) volumes. A diffusion tensor model was fit at each voxel, generating fractional anisotropy (FA) and mean diffusivity (MD) maps. For registering DTI data to the T1‐weighted anatomical image, we calculated a full affine (correlation ratio cost function) transformation between FA maps and brain‐extracted whole‐brain volumes from T1‐weighted images, as suggested by Thottakara et al. [2006]. The computed transformation matrix was then applied to the MD maps with identical resampling options.
Anatomical regions of interest (ROI) on T1‐weighted images were obtained automatically through the segmentation tool FIRST 1.1 integrated within the FSL software. FIRST uses mesh models trained with a large amount of rich hand‐segmented training data to segment deep gray matter structures, and it is particularly useful for structures with a low contrast‐to‐noise ratio. In each subject and each hemisphere, the hippocampus and the amygdala were segmented. For each subject, the results of ROI segmentation and the coregistered FA map were superimposed to the original T1‐weighted volume, and the resulting images were visually assessed by two trained radiologists to exclude mis‐registration or erroneous ROI identification.
Subjects that showed less than perfect coregistration, ROI identification, or movement artifacts, were excluded from the study. Prior to statistical analysis, individual volume values were corrected with a multiplicative scaling factor derived from an affine transform calculated with the SIENAX tool, part of FSL. This scaling factor was computed as the determinant of the affine transform connecting each individual to the MNI standard template [Buckner et al.,2004]. The scaling factor represents the whole‐brain volume expansion (or contraction) required to register each individual to the template. Importantly, when computing the affine transform to the template, we used the skull images to constrain scaling and skew. The segmented hippocampi and amygdalae defined the binary masks where mean values of MD were computed for each individual. It should be remembered that increases in MD can be interpreted as an early dysfunction of the gray matter structures [Cherubini et al.,2009a, Cherubini et al.,2010].
Since FA measured outside white matter is highly variable, depends on many factors that are difficult to control for, such as voxel size, and in general depends on the underlying tissue structure, negatively correlated with MD, it has not been considered as a dependent measure of our study. FA images, clearly highlighting white matter in MRI images, were only employed to coregister (realign) DTI data to T1‐weighted anatomical data, which also exhibit hyperintense white matter structures.
Data Analysis
Dream reports
The tape‐recordings were transcribed verbatim into overall daily reports. An expert investigator, unaware of the study design, preliminarily identified the reports of distinct dreams and then pruned the report of each dream of the clauses not related to dream content (e.g., “I'm not sure, but I think … “) or repetitive of contents already encoded. Then two judges, also unaware of the study design, scored independently each dream report according to three 6‐point Likert rating scales of emotional intensity (emotional load, EL), bizarreness (B), and visual vividness (VV) [De Gennaro et al.,2003; De Gennaro et al.,2010]. The rating scales ranged from 1 (“a very small extent”) to 6 (“a very great extent”). In other words, three distinct scores on 6‐point scales (EL, B, and VV) were attributed to each of the dreams the subjects reported. Like a previous study [De Gennaro et al.,2003], these ratings were attributed by the two judges regardless of their emotional valence. Hence, EL scores rate the intensity of emotions, without any distinction between positive or negative affects. With respect to the scoring of bizarreness, the judges considered both (1) bizarre elements (improbable or impossible characters, metamorphoses, improbable or impossible actions/inappropriate roles, improbable or impossible objects), and (2) script bizarreness (physically improbable or impossible plot, logically improbable or impossible plot, plot discontinuity, improbable or impossible settings). Visual vividness of each dream report was rated according to the following scores: (1) No image at all (only thinking of the object), (2) Very vague and dim, (3) Less vague, still dim, (4) Moderately clear and vivid, (5) Clear and reasonably vivid, (6) Perfectly clear and vivid as normal vision.
Training of the two judges was based on the database of dream report scores used in a previous study [De Gennaro et al.,2003]. Inter‐rater reliability for each rating scale was very high (K > 0.80), and cases of differences between the two judges were consensually solved.
Dream recall frequency (DRF) was computed as the average number of dreams reported by each subject per night, namely by dividing the total number of recalled dreams per 14 days. Moreover, the mean length of dream report per night was computed by dividing the total number of the words of all the pruned reports by the number of days (14 or less) where subjects were capable to recall one or more dreams (total word count, TWC: Antrobus,1983; Stickgold et al.,2001b].
Also the mean ratings of the perceptual and emotional characteristics of dreams (EL, B, and VV) were individually averaged as a function of the number of days where subjects were capable to recall one or more dreams. Hence, the dependent variables of the study were: DRF, TWC, EL, B, and VV.
MRI Measures
Volume (Vol) and mean diffusivity (MD) were calculated for each hippocampus and amygdala and taken as independent variables in the following statistical analyses.
Statistical Analysis
The relationship between age and each quantitative and qualitative measure of dream was first assessed by calculating partial correlations (moment product Pearson's r) controlling for the years of formal education and gender.
To correct for multiple comparisons, the Bonferroni correction was applied. Since it is too conservative in the case of correlated outcome variables, the alpha level was adjusted by taking into account the mean correlation between the five dependent variables [Perneger,1998; Sankoh et al.,1997]. According to this procedure, we computed the mean correlation between the five dependent variables (r = 0.59). Therefore, the alpha level was adjusted to 0.0258.
To assess the best MR‐derived anatomical predictors of dream recall, stepwise forward multiple regressions were performed using the measures of dream reports as the dependent variables and anatomical measures (both Vol and MD) as the independent variables. Age and gender were also included in the regression equation, with the aim to partialing out their contribution from that of the anatomical measures.
The multiple regressions that included the DRF as the dependent variable were carried out one the whole sample (N = 34). The multiple regressions that included TWC, EL, B, and VV as the dependent variables, were carried out by considering only the subjects who were successful in dream recall after one or more morning awakenings (N = 28). Also in this case, the alpha level was adjusted to 0.0258, considering the mean correlation between the five dependent variables (r = 0.59).
RESULTS
Subjective Sleep Measures
The values of the subjective measures of sleep drawn from the 14‐days sleep diary are shown in Table I. Mean values are comparable with those of healthy individuals [De Gennaro et al.,2003] and point to a general compliance to the instruction of maintaining regular sleep habits during the two weeks of the study. Subjective daily measures of sleep, as estimated by means of a prospective questionnaire, confirmed the retrospective estimates provided by the PSQI on the absence of sleep disorders.
Table I.
Mean values (and standard errors) of each variable assessed by the sleep diary across 14 consecutive days
| Sleep variables | Means (S.E.) |
|---|---|
| Sleep latency (min) | 9.28 (2.24) |
| Total sleep time (min) | 440.8 (11.0) |
| Difficulty in falling asleep (range = 1–6) | 5.01 (0.15) |
| Number of awakenings | 0.69 (0.10) |
| Difficulty in falling asleep after nightly awakenings (range = 1–6) | 4.82 (0.26) |
| Waking after sleep onset (min) | 19.50 (4.10) |
| Time in bed after final awakening (min) | 12.59 (2.35) |
| Sleepy upon awakening (range = 1–6) | 3.43 (0.17) |
| Sleep depth (range = 1–6) | 3.78 (0.16) |
| Rested upon awakening (range = 1–6) | 3.60 (0.16) |
These subjective measures of sleep did not correlate with age with the exception of the number of awakenings (r = 0.42; P = 0.01) and the total sleep time (r = −0.35; P = 0.04), suggesting more intra‐night awakenings and shorter total sleep time as the age progresses.
Amygdala and Hippocampus Measures
The values of the volumetric and structural measures (volumes and MD) of hippocampus and amygdala are reported in Table II. All the values are comparable with those of individuals of similar age [Cherubini et al.,2009a]. The intercorrelations between these measures are reported in Table III, and indicate the existence of relatively higher inter‐hemispheric correlations for the hippocampal than for the amygdalar measures.
Table II.
Mean values and standard errors (SE) of the hippocampus and amygdala anatomical measures (both volumes and mean diffusivity)
| Mean | S.E. | |
| Normalized volumes (mm3) | ||
| RH | 2509.38 | 64.66 |
| LH | 2340.18 | 64.83 |
| RA | 806.09 | 27.59 |
| LA | 782.38 | 38.98 |
| Mean | S.E. | |
| Mean diffusivity (x10−6mm2s−1) | ||
| RH | 952.42 | 7.45 |
| LH | 948.62 | 8.61 |
| RA | 959.13 | 14.91 |
| LA | 929.02 | 14.45 |
LH, left hippocampus; RH, right hippocampus; LA, left amygdala; RA, right amygdala.
Table III.
Inter‐correlations (Pearson's r coefficients) between neuroanatomic structures
| Variables | LH Vol | RA Vol | LA Vol | RH MD | LH MD | RA MD | LA MD |
|---|---|---|---|---|---|---|---|
| RH Vol | 0.70 | 0.10 | 0.18 | 0.44 | 0.07 | 0.17 | 0.10 |
| LH Vol | 0.33 | 0.10 | 0.41 | 0.23 | 0.20 | 0.24 | |
| RA Vol | 0.47 | 0.23 | 0.45 | 0.13 | 0.20 | ||
| LA Vol | 0.21 | 0.40 | 0.11 | 0.06 | |||
| RH MD | 0.62 | 0.20 | 0.08 | ||||
| LH MD | 0.05 | 0.33 | |||||
| RA MD | 0.19 |
LH, left hippocampus; RH, right hippocampus; LA, left amygdala; RA, right amygdala; Vol, volume; MD, mean diffusivity.
Dream Recall Frequency
The frequency of recalled dreams (DRF) per night, for all the 34 subjects, was 0.43 (SE = 0.08). This value is comparable to that estimated in previous studies of dream recall upon morning awakening at home [Cohen,1979] and warrants that our sample can be considered representative of the general population [Nielsen,1999]].
Six subjects were absolute nonrecallers (NREC), as they never reported any dream. A preliminar multivariate analysis of variance (MANOVA) compared these NREC subjects with the six subjects with the highest number of dreams recalled (REC: DRF = 1.15; SE = 0.14) on all the MR‐derived anatomical measures. This analysis did not show any significant difference between the two groups (Wilk's Lambda = 0.21; Rao's R = 0.93; P = 0.61), neither the univariate ANOVAs on each dependent variable were significant (F < 1).
The values of report length (TWC) and perceptual and emotional features of dreams (EL, B, and VV) were computed on 28 subjects. Their mean values were 78.8 words (SE = 15.1) for report length, 2.8 (SE = 0.2) for EL, 1.8 (SE = 0.2) for B, and 2.3 (SE = 0.2) for VV. These variables were highly intercorrelated (Table IV).
Table IV.
Inter‐correlations (Pearson's r coefficients) between dream variables
| Variables | EL | VV | B |
|---|---|---|---|
| TWC | 0.64 | 0.82 | 0.65 |
| EL | 0.79 | 0.65 | |
| VV | 0.81 |
TWC, total word count; EL, emotional load; B, bizarreness; VV, visual vividness.
The partial correlation coefficients shown in Table V show a lack of significant relationships between all the measures of recalled dreams and age, education level, and gender.
Table V.
Partial correlations between (a) age, (b) years of formal education, (c) gender and each measure of dream reports (ND/D, TWC, EL, B, VV)
| DRF (N = 34) | TWC (N = 28) | EL (N = 28) | B (N = 28) | VV (N = 28) | |
|---|---|---|---|---|---|
| Age | r = 0.15 | r = 0.11 | r = 0.15 | r = 0.14 | r = 0.07 |
| β = 0.16 | β = 0.13 | β = 0.17 | β = 0.17 | β = 0.08 | |
| P = 0.42 | P = 0.58 | P = 0.47 | P = 0.49 | P = 0.72 | |
| Gender | r = −.06 | r = 0.23 | r = 0.21 | r = 0.07 | r = 0.16 |
| β = −0.06 | β = 0.24 | β = 0.21 | β = 0.07 | β = 0.16 | |
| P = 0.75 | P = 0.25 | P = 0.31 | P = 0.73 | P = 0.44 | |
| Education | r = 0.27 | r = 0.23 | r = 0.13 | r = 0.04 | r = 0.18 |
| β = 0.29 | β = 0.26 | β = 0.15 | β = 0.05 | β = 0.20 | |
| P = 0.13 | P = 0.25 | P = 0.52 | P = 0.83 | P = 0.39 |
The table reports correlation coefficients, beta weights, and probability. DRF, dream recall frequency; TWC, total word count; EL, emotional load; B, bizarreness; VV, visual vividness.
Finally, Table VI reports the intercorrelations between each variable assessed by the sleep diary across 14 consecutive days, and DRF and TWC, respectively. While TWC does not show any significant relation with the self‐rated sleep measures, DRF shows a significant correlation with the time in bed after final awakening and a close‐to‐significance (0.02 < P < 0.05) relation with the sleep latency and the number of awakenings.
Table VI.
Inter‐correlations (Pearson's r coefficients) between each variable assessed by the sleep diary across 14 consecutive days, and dream recall frequency (DRF) and total word count (TWC)
| Sleep variables | DRF (N = 34) | TWC (N = 28) |
|---|---|---|
| Sleep latency (min) | r = 0.33 | r = −0.25 |
| Total sleep time min) | r = −0.07 | r = −0.35 |
| Difficulty in falling asleep (range = 1–6) | r = −0.03 | r = −0.03 |
| Number of awakenings | r = 0.35 | r = 0.24 |
| Difficulty in falling asleep after nightly awakenings (range = 1–6) | r = −0.07 | r = −0.11 |
| Waking after sleep onset (min) | r = 0.17 | r = −0.16 |
| Time in bed after final awakening (min) | r = 0.40 | r = 0.36 |
| Sleepy upon awakening (range = 1–6) | r = −0.21 | r = 0.11 |
| Sleep depth (range = 1–6) | r = −0.04 | r = −0.20 |
| Rested upon awakening (range = 1–6) | r = −0.002 | r = −0.19 |
Relationships Between Amygdala and Hippocampus Measures and Dream Measures
Stepwise forward multiple regression analyses considering all the measures of recalled dreams (DRF, TWC, EL, B, and VV values) as dependent variables, and the anatomical measures (both volume and MD) of hippocampus and amygdala, age, and gender as independent variables (i.e., predictors), were significant. The only notable exception concerned the DRF, for which no independent variable entered in the regression equation (multiple r = 0.32; P = 0.98).
The upper panel of Table VI reports the results of the multiple regressions including the other measures of recalled dreams as dependent variables. The multiple regression coefficients were always statistically significant, accounting for large percentages of the variances of the dream recall variables (see Fig. 1). The partial correlations indicate that mean diffusivity (MD) of the left amygdala (LA) was associated negatively with the length of dream reports (as measured by TWC) and with the scores of emotional load (EL), while its volume was negatively correlated with the bizarreness (B) scores (see Fig. 2). The volume of the right amygdala (RA) was negatively correlated with the EL scores, while its MD was positively correlated with the B scores. MD of the left hippocampus (LH) was associated negatively with the visual vividness (VV) of dream reports. Finally, the volume of the right hippocampus (RH) was negatively associated with the B scores. The lower panel of Table VII provides a synopsis of these results, aimed at further clarifying the complex pattern of these relationships.
Figure 1.
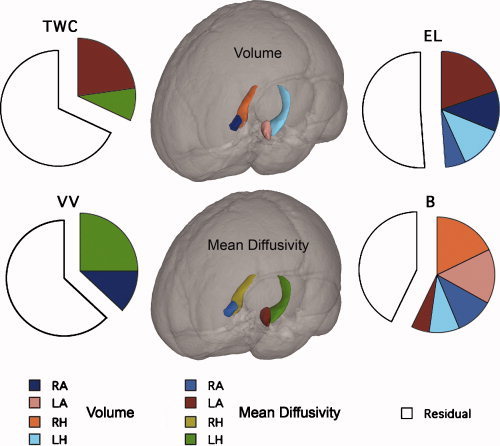
Pie graphs of the relative percentages of variance (R2) explained by the anatomical measures (both volumes and mean diffusivity) of hippocampus and amygdala entering in the multiple regression equations, which considered each measure of dream recall as the dependent variable (TWC, EL, B, and VV). Each pie graph expresses the components of the total variance (100%) explained by the anatomical measures and residuals. TWC = total word count, EL = emotional load, B = bizarreness, VV = visual vividness, LH = left hippocampus, RH = right hippocampus, LA = left amygdala, RA = right amygdala. [Color figure can be viewed in the online issue, which is available at wileyonlinelibrary.com.]
Figure 2.
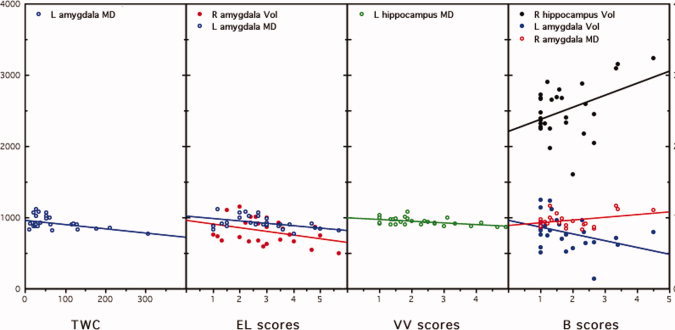
Scatterplots of the partial correlations between the anatomical measures (both volumes and mean diffusivity) of hippocampus and amygdala significantly entering in the regression equation (ordinate) and the considered measures of dream recall (abscissa). TWC, total word count; EL, emotional load; B, bizarreness; VV, visual vividness; R, right; L, left; Vol, volume; MD, mean diffusivity. [Color figure can be viewed in the online issue, which is available at wileyonlinelibrary.com.]
Table VII.
Results of the stepwise forward multiple regressions considering measures of dream reports (TWC, EL, B, and VV) as dependent variables, and hippocampus and amygdala anatomical measures (bilateral volume and MD), age and gender, as predictors
| Dependent variables | Variables in the equation | Beta | Partial correlation coefficients | t (24) | P‐level |
|---|---|---|---|---|---|
| TWC: multiple r = 0.56, F 2,25 = 5.80, P = 0.008 | LA MD | −0.37 | −0.39 | −2.10 | 0.05 |
| EL: multiple r = 0.70; F 4,23 = 5.44, P = 0.003 | LA MD | −0.49 | −0.55 | −3.17 | 0.004 |
| RA Vol | −0.46 | −0.52 | −2.90 | 0.008 | |
| VV: multiple r = 0.61; F3,24 = 4.76, P = 0.009 | LH MD | −0.57 | −0.50 | −2.83 | 0.009 |
| B: multiple r = 0.76; F 5,22 = 5.93, P = 0.001 | RH Vol | 0.59 | 0.53 | 2.90 | 0.008 |
| LA Vol | −0.49 | −0.59 | −3.42 | 0.002 | |
| RA MD | 0.47 | 0.42 | 3.00 | 0.006 | |
| Deep gray matter structures | Anatomic and functional significance | MRI measure | Influence on dream recall variables | ||
| Left amygdale | Lower structural integrity | +MD | Lower EL | ||
| Left amygdale | Smaller volume | −Vol | Greater B | ||
| Left hippocampus | Smaller volume | −Vol | Greater B | ||
| Right amygdale | Smaller volume | −Vol | Lower EL | ||
| Right amygdale | Lower structural integrity | +MD | Greater B | ||
| Right hippocampus | Larger volume | +Vol | Greater B |
The upper panel reports variables significantly entering the regression equation. The lower panel reports a synopsis of these effects [mean diffusivity of left amygdala (LA MD), as a predictor entering in the regression equation on TWC values, is not reported in this synoptic table, since its probability (P = 0.05) does not reach the adjusted alpha level (≤0.0258)]. Vol, volume; MD, mean diffusivity; DRF, dream recall frequency; TWC, total word count; EL, emotional load; B, bizarreness; VV, visual vividness; LH, left hippocampus; RH, right hippocampus; LA, left amygdala; RA, right amygdala.
These relationships were not influenced by age or gender, and the general pattern of the statistical relationships was again confirmed when the same analyses were carried out by excluding the five subjects with a ≥60 years age (multiple r coefficients: TWC = 0.41; EL = 0.66; VV = 0.62; B = 0.75; alpha level = 0.034, considering that the mean correlation between the four dependent variables was r = 0.73).
To check for the specificity of these relationships, similar stepwise regressions on the same dependent variables were carried out considering as anatomical measures both the global brain volume and the mean brain diffusivity (without including amygdalae and hippocampi measures). The multiple regression coefficients were never significant, and no variable ever entered in the regression equations (multiple r coefficients: TWC = 0.39; EL = 0.38; VV = 0.30; B = 0.34).
Since the qualitative aspects of dreams (i.e., EL, VV, and B scores) could have been partly dependent on the length of dream reports, as shown in several studies on dream recall [Snyder,1970; Nielsen,2000], a final control for these partial correlations was carried out. In fact, the scores of all the qualitative measures considered here were positively and closely correlated with the length of dream reports (measured on TWC): EL (r = 0.64, p = 0.0002), VV (r = 0.82, p < 0.0001), and B (r = 0.65, p = 0.0002). Therefore, partial correlations considering the EL, VV, and B, as dependent variables, were again carried out with the same set of predictors, but partialling out the contribution of TWC. With respect to EL and B scores, results mostly confirmed those obtained without partialling out the contribution of the length of dream report (Table VIII), while VV scores showed a weak ‐ although significant ‐ negative relation with MD of RA and a positive relation with volume of LA.
Table VIII.
Partial correlations between each qualitative measures of dream reports (EL, B, and VV), and hippocampus and amygdala anatomical measures (both volumes and MD), total word count (TWC), age, and gender as predictors
| Dependent variables | Variables in the equation | Beta | Partial correlations | t (24) | P‐level |
|---|---|---|---|---|---|
| EL | LA MD | −0.35 | −0.45 | −2.17 | 0.04 |
| RA Vol | −0.42 | −0.52 | −2.62 | 0.02 | |
| VV | RA MD | 0.27 | 0.49 | 2.76 | 0.01 |
| LA Vol | −0.21 | −0.41 | −2.18 | 0.04 | |
| B | RH Vol | 0.45 | 0.61 | 3.54 | 0.002 |
| LH Vol | −0.30 | −0.43 | −2.20 | 0.04 | |
| LA Vol | −0.41 | −0.71 | −4.58 | 0.0001 | |
| RA MD | 0.42 | 0.70 | 4.53 | 0.0002 |
Variables significantly entering the regression equation are reported. The table reports significant correlations for the anatomical measures. EL, emotional load; B, bizarreness; VV, visual vividness; LH, left hippocampus; RH, right hippocampus; LA, left amygdala; RA, right amygdala.
DISCUSSION
This study aimed at assessing for the first time the relationship between volumetric and ultrastructural measures of bilateral hippocampus and amygdala, and quantitative and qualitative aspects of the recalled dreams.
While the considered anatomical measures did not show any significant relationship with the dream recall frequency (DRF), several significant associations were found with the qualitative features of dream reports (EL, B, and VV) and, to some extent, also with the length of dream reports (TWC). With respect to the quantitative aspects of dream recall (DRF), the lack of any significant association with the volumetric and ultrastructural measures of the hippocampus and the amygdala has been also confirmed by a between‐group comparison (i.e, nonrecallers vs. high‐recallers). Although the MANOVA results should be taken with caution, due to the small sample of absolute nonrecallers, the results are confirmatory of the correlational approach on the whole sample. Notably, this finding relies on a fairly strong empirical background, given that: (a) the present DRF value (0.43 per night) was comparable with that estimated (around 0.50 per night) in naturalistic studies of dream recall [Cohen,1979], and (b) DRF was estimated over a quite long period (two weeks). Also the replication of previous findings [Nielsen,2000] showing positive correlations between report length and all the qualitative measures of dream report (EL, B and VV scores) strengthens the reliability of our data on dreams.
The relationships found between the amygdala measures and the qualitative (perceptual and emotional) aspects of dreams further support the hypothesis that the amygdala is involved in the access and processing of the emotional sources of dreaming [Hobson and Pace‐Schott,2002]. Support for this hypothesis comes from the fact that (a) the activation of the amygdala is higher during REMS compared with wakefulness [Maquet,2000; Wehrle et al.,2007] and (b) the subjects awakened during REMS and recalling a dream show a bilateral amygdalar activation [Maquet et al.,1996]. The present findings allow deepening this relationship by outlining specific features of dreams which are related to macro‐ and micro‐structural measures of the amygdalae in an asymmetric manner.
Indeed, a higher mean diffusivity (MD) of the left amygdala, reflecting a decreased microstructural integrity, was associated to shorter dream reports and to lower EL scores. Complementarily, higher EL scores were associated to a smaller volume of the right amygdala. Additionally, bizarreness of dream reports was correlated negatively with LA volume and positively with the RA Mean Diffusivity.
These findings as a whole are consistent with one of the assumptions of the revised Activation‐Synthesis hypothesis (the so‐called Activation‐Input source‐Modulation model, AIM [Hobson et al.,2000]), namely that the emotional salience of dream imagery is due to the activation of the paralimbic cortices by the amygdala. In general terms, our findings suggest that the associations between the qualitative (or “dream‐like”) features of dream reports and the structural measures of the amygdala may rely on specific inter‐hemispheric differences. This suggestion in turn is coherent with the general hypothesis that the emotional sources of dreaming are related to amygdalar functioning, given that EL scores are predicted by both diffusivity alterations of LA and a smaller volume of gray matter of RA.
Our data are also compatible with another basic assumption of the AIM model, namely that bizarreness of dream content is a consequence of a prefrontal deactivation functionally reducing the higher order control on the amygdalar and hippocampal functioning, as previously suggested by Maquet et al. [1996]. Our correlational findings on dream reports allow updating this assumption within the framework of the relationships between the amygdalar and hippocampal complex, which governs two independent memory systems that necessarily act in concert when emotion meets memory. Our findings indicate that both the amygdalae and the hippocampi are associated with the bizarreness of dream content. While lower B scores are related to a smaller volume of LA and to a decreased microstructural integrity (i.e., a higher Mean Diffusivity) of RA, an intrinsically asymmetrical mechanism seems to control the relationship with the hippocampus, since we observed a positive relation with the RH volume and a negative one with the LH volume. This last finding seems coherent with the only study, to the best of our knowledge, on the dreams of patients with hippocampal damage [Torda,1969]. These patients reported dreams which were short, stereotyped, repetitious, unemotional and lacking day‐residues or symbolic elaborations. Thus, the interaction between the two deep gray matter structures seems necessary to plan the dream plot within which the complex and coordinated contents of the ongoing dream experience have to be inserted.
Laterality Effects
The pattern of significant effects synthesized by the lower panel of Table VII suggests the existence of some laterality effects in mediating the relationship between neuroanatomical structures and measures of dream reports.
Actually, some lateralization models have been proposed mainly for the amygdala, based on the established hemispheric differences associated with language. Namely, the left amygdala would be involved in the processing of semantic material, whereas nonsemantic information would engage the right amygdala [Markowitsch,1998; Phelps et al.,2001]. More recent lateralization models have been proposed in terms of the temporal dynamics of the amygdala activity in response to emotional stimuli, based on its differential patterns of habituation [Phillips et al.,2001; Whalen et al., 1998; Wright et al., 2001]. However, two recent meta‐analyses suggested that (a) there is some evidence of hemispheric specialization for the amygdala only when stimuli containing language are used [Costafreda et al.,2008], and (b) there is no difference in terms of effect sizes between hemispheres, either in the mean values or their distributions, when activations of both amygdalae are reported in neuroimaging studies [Sergerie et al.,2008]. We think that both the limited available knowledge on this issue and the preliminary nature of our findings preclude any definitive interpretation of these laterality effects at this point in time. Particularly, the pattern of interhemispheric intercorrelations reported in Table III, lower for the amygdala than for the hippocampus, prompt to a very cautious intepretation. In fact, this finding could be interpreted again in terms of neuroanatomic laterality effects or, alternatively, in terms of a measurement error, due to the smaller size of the amygdala compared with the hippocampus.
Limitations of the Study
This study has some methodological limitations, concerning: the naturalistic approach to dream recall, the method of dream sampling limited to morning recall, the lack of information about the sleep stages at which the recalled dreams have been processed, and the relatively small sample size. Thus our results have to be taken into consideration with the caution that the interpretation of correlational studies usually requires, and bearing in mind that the potential for direct causal links between subcortical anatomy and dream experiences is still unknown. Nevertheless, they provide the very first evidence of a significant relationships between volumetric and ultrastructural measures of the amygdala‐hippocampus complex and specific qualitative features of dreaming. Future studies should both consider volumetric and ultrastructural measures of the whole brain and relate them with the measures of the functioning of brain regions during the various stages of sleep, under the assumption that only the integrated analysis of cortical and subcortical networks is capable to account for the peculiar features of dream experience. Finally, it seems worthwhile that further studies with larger sample sizes will consider positive and negative (pleasant vs. unpleasant) emotions separately, in light of possible lateralization effects depending on emotional valence of dream experience.
Acknowledgements
The authors thank Eleonora Bergeretto and Stefania Fanelli for their help in data collection and in dream report scoring.
REFERENCES
- American Psychiatric Association ( 2000): Diagnostic and Statistical Manual of Mental Disorders, 4th ed‐TR Washington, DC: Task Force. [Google Scholar]
- Antrobus JS ( 1983): REM and NREM sleep reports: Comparison of word frequencies by cognitive classes. Psychophysiology 20: 562–568. [DOI] [PubMed] [Google Scholar]
- Bohbot VD,Lerch J,Thorndycraft B,Iaria G,Zijdenbos AP ( 2007): Gray matter differences correlate with spontaneous strategies in a human virtual navigation task. J Neurosci 27: 10078–10083. [DOI] [PMC free article] [PubMed] [Google Scholar]
- Braun AR,Balkin TJ,Wesensten NJ,Carson RE,Varga M,Baldwin P,Selbie S,Belenky G,Herscovitch P ( 1997): Regional cerebral blood flow throughout the sleep‐wake cycle: An (H2O)‐O‐15 PET study. Brain 120: 1173–1197. [DOI] [PubMed] [Google Scholar]
- Buckner RL,Head D,Parker J,Fotenos AF,Marcus D,Morris JC,Snyder AZ ( 2004): A unified approach for morphometric and functional data analysis in young, old, and demented adults using automated atlas‐based head size normalization: Reliability and validation against manual measurement of total intracranial volume. Neuroimage 23: 724–738. [DOI] [PubMed] [Google Scholar]
- Buysse DJ,Reynolds CF,Monk TH,Berman SR,Kupfer DJ ( 1989): The Pittsburgh Sleep Quality Index: A new instrument for psychiatric practice and research. Psychiatry Res 28: 193–213. [DOI] [PubMed] [Google Scholar]
- Carlesimo GA,Caltagirone C,Gainotti G ( 1996): The mental deterioration battery: Normative data, diagnostic reliability and qualitative analyses of cognitive impairment. The Group for the Standardization of the Mental Deterioration Battery. Eur Neurol 36: 378–384. [DOI] [PubMed] [Google Scholar]
- Carlesimo GA,Cherubini A,Caltagirone C,Spalletta G ( 2010): Hippocampal mean diffusivity and memory in healthy elderly individuals: A cross‐sectional study. Neurology 74: 194–200. [DOI] [PubMed] [Google Scholar]
- Casagrande M,Cortini P ( 2008): Spoken and written dream communication: Differences and methodological aspects. Conscious Cogn 17: 145–158. [DOI] [PubMed] [Google Scholar]
- Cherubini A,Péran P,Luccichenti G,Hagberg G,Caltagirone C,Sabatini U,Spalletta G ( 2009a): Characterization of white matter fiber bundles with T2* relaxometry and diffusion tensor imaging. Magn Reson Med 61: 1066–1072. [DOI] [PubMed] [Google Scholar]
- Cherubini A,Péran P,Caltagirone C,Sabatini U,Spalletta G ( 2009b): Aging of subcortical nuclei: Microstructural, mineralization and atrophy modifications measured in vivo using MRI. Neuroimage 48: 29–36. [DOI] [PubMed] [Google Scholar]
- Cherubini A,Péran P,Spoletini I,Di Paola M,Di Iulio F,Hagberg GE,Sancesario G,Gianni W,Bossù P,Caltagirone C,Sabatini U,Spalletta G ( 2010): Combined volumetry and DTI in subcortical structures of mild cognitive impairment and Alzheimer's disease patients. J Alzheimers Dis 19: 1273–1282. [DOI] [PubMed] [Google Scholar]
- Cohen D. 1979. Sleep and Dreaming: Origins, Nature and Functions. New York: Pergamon Press. [Google Scholar]
- Costafreda SG,Brammer MJ,David AS,Fu CH ( 2008): Predictors of amygdala activation during the processing of emotional stimuli: A meta‐analysis of 385 PET and fMRI studies. Brain Res Rev 58: 57–70. [DOI] [PubMed] [Google Scholar]
- De Gennaro L,Ferrara M,Cristiani R,Curcio G,Martiradonna V,Bertini M ( 2003): Alexithymia and dream recall upon spontaneous morning awakening. Psychosom Med 65: 301–306. [DOI] [PubMed] [Google Scholar]
- De Gennaro L,Marzano C,Moroni F,Curcio G,Ferrara M,Cipolli C ( 2010): Recovery sleep after sleep deprivation almost completely abolishes dream recall. Behav Brain Res 206: 293–298. [DOI] [PubMed] [Google Scholar]
- Deichmann R,Schwarzbauer C,Turner R ( 2004): Optimisation of the 3D MDEFT sequence for anatomical brain imaging: Technical implications at 1.5 and 3 T. Neuroimage 21: 757–767. [DOI] [PubMed] [Google Scholar]
- den Heijer T,van der Lijn F,Koudstaal PJ,Hofman A,van der Lugt A,Krestin GP,Niessen WJ,Breteler MMBA ( 2010): 10‐year follow‐up of hippocampal volume on magnetic resonance imaging in early dementia and cognitive decline. Brain 133: 1163–1172. [DOI] [PubMed] [Google Scholar]
- Fagioli I ( 2002): Mental activity during sleep. Sleep Med Rev 6: 307–320. [DOI] [PubMed] [Google Scholar]
- Fell J,Fernández G,Lutz MT,Kockelmann E,Burr W,Schaller C,Elger CE,Helmstaedter C ( 2006): Rhinal‐hippocampal connectivity determines memory formation during sleep. Brain 129: 108–114. [DOI] [PubMed] [Google Scholar]
- First MB,Spitzer RL,Gibbon M,Williams JBW ( 1996): Structured Clinical Interview for DSM‐IV Axis I Disorders (SCID). Washington: American Psychiatric Press. [Google Scholar]
- First MB,Gibbon M,Spitzer RL,Williams JBW,Benjamin LS ( 1997): Structured Clinical Interview for DSM‐IV Axis II Personality Disorders (SCID‐II). New York: Biometrics Research Institute, New York State Psychiatric Institute. [Google Scholar]
- Folstein MF,Folstein SE,McHugh PR ( 1975): “Mini‐mental state”. A practical method for grading the cognitive state of patients for the clinician. J Psychiatr Res 12: 189–198. [DOI] [PubMed] [Google Scholar]
- Fosse MJ,Fosse R,Hobson JA,Stickgold RJ ( 2003): Dreaming and episodic memory: A functional dissociation? J Cogn Neurosci 15: 1–9. [DOI] [PubMed] [Google Scholar]
- Foulkes D,Pope R ( 1973): Primary visual experience and secondary cognitive elaboration in stage REM: A modest confirmation and an extension. Percept Mot Skills 37: 107–118. [DOI] [PubMed] [Google Scholar]
- Foulkes D,Schmidt M ( 1983): Temporal sequence and unit composition in dream reports from different stages of sleep. Sleep 6: 265–280. [DOI] [PubMed] [Google Scholar]
- Foulkes D ( 1985): Dreaming: A Cognitive‐Psychological Analysis. Hillsdale, NJ: Erlbaum. [Google Scholar]
- Fox N,Schott J ( 2004): Imaging cerebral atrophy: Normal ageing to Alzheimer's disease. Lancet 363: 392–394. [DOI] [PubMed] [Google Scholar]
- Good C,Johnsrude I,Ashburner J,Henson R,Friston K,Frackowiak R ( 2001): A voxel‐based morphometric study of ageing in 465 normal adult human brains. Neuroimage 14: 21–36. [DOI] [PubMed] [Google Scholar]
- Hobson JA,Pace‐Schott EF ( 2002): The cognitive neuroscience of sleep: Neuronal systems, consciousness and learning. Nat Rev Neurosci 3: 679–693. [DOI] [PubMed] [Google Scholar]
- Hobson JA,Pace‐Schott EF,Stickgold R,Kahn D ( 1998b): To dream or not to dream? Relevant data from new neuroimaging and electrophysiological studies. Curr Opin Neurobiol 8: 239–244. [DOI] [PubMed] [Google Scholar]
- Hobson JA,Stickgold R,Pace‐Schott EF ( 1998a): The neuropsychology of REM sleep dreaming. Neuroreport 9: R1–R14. [DOI] [PubMed] [Google Scholar]
- Hobson JA,Pace‐Schott EF,Stickgold R ( 2000): Dreaming and the brain: Toward a cognitive neuroscience of conscious states. Behav Brain Sci 23: 793–842. [DOI] [PubMed] [Google Scholar]
- Hong CC,Gillin JC,Dow BM,Wu J,Buchsbaum MS ( 1995): Localized and lateralized cerebral glucose metabolism associated with eye movements during REM sleep and wakefulness: A positron emission tomography (PET) study. Sleep 18: 570–580. [DOI] [PubMed] [Google Scholar]
- Iaria G,Lanyon LJ,Fox CJ,Giaschi D,Barton JJ ( 2008): Navigational skills correlate with hippocampal fraction anisotropy in humans. Hippocampus 18: 335–339. [DOI] [PubMed] [Google Scholar]
- Ji J,Maren S ( 2007): Hippocampal involvement in contextual modulation of fear extinction. Hippocampus 17: 749–758. [DOI] [PubMed] [Google Scholar]
- Klingberg T,Hedehus M,Temple E,Salz T,Gabrieli JD,Moseley ME,Poldrack RA ( 2000): Microstructure of temporo‐parietal white matter as a basis for reading ability: Evidence from diffusion tensor magnetic resonance imaging. Neuron 25: 493–500. [DOI] [PubMed] [Google Scholar]
- Lee HJ,Choi JS,Brown TH,Kim JJ ( 2001): Amygdalar NMDA receptors are critical for the expression of multiple conditioned fear responses. J Neurosci 21: 4116–4124. [DOI] [PMC free article] [PubMed] [Google Scholar]
- Madden DJ,Whiting WL,Huettel SA,White LE,MacFall JR,Provenzale JM ( 2004): Diffusion tensor imaging of adult age differences in cerebral white matter: Relation to response time. Neuroimage 21: 1174–1181. [DOI] [PubMed] [Google Scholar]
- Maguire EA,Gadian DG,Johnsrude IS,Good CD,Ashburner J,Frackowiak RS,Frith CD ( 2000): Navigation‐related structural change in the hippocampi of taxi drivers. Proc Natl Acad Sci USA 97: 4398–4403. [DOI] [PMC free article] [PubMed] [Google Scholar]
- Maquet P ( 2000): Functional neuroimaging of normal human sleep by positron emission tomography. J Sleep Res 9: 207–231. [DOI] [PubMed] [Google Scholar]
- Maquet P,Péters J,Aerts J,Delfiore G,Degueldre C,Luxen A,Franck G ( 1996): Functional neuroanatomy of human rapid‐eye‐movement sleep and dreaming. Nature 383: 163–166. [DOI] [PubMed] [Google Scholar]
- Markowitsch HJ ( 1998): Differential contribution of right and left amygdala to affective information processing. Behav Neurol 11: 233–244. [DOI] [PubMed] [Google Scholar]
- Mazzetti M,Bellucci C,Mattarozzi K,Plazzi G,Tuozzi G,Cipolli C ( 2010): REM‐dreams recall in patients with narcolepsy‐cataplexy. Brain Res Bull 81: 133–140. [DOI] [PubMed] [Google Scholar]
- Milad MR,Wright CI,Orr SP,Pitman RK,Quirk GJ,Rauch SL ( 2007): Recall of fear extinction in humans activates the ventromedial prefrontal cortex and hippocampus in concert. Biol Psychiat 62: 446–454. [DOI] [PubMed] [Google Scholar]
- Misane I,Tovote P,Meyer M,Spiess J,Ogren SO,Stiedl O ( 2005): Time‐dependent involvement of the dorsal hippocampus in trace fear conditioning in mice. Hippocampus 15: 418–426. [DOI] [PubMed] [Google Scholar]
- Müller MJ,Greverus D,Weibrich C,Dellani PR,Scheurich A,Stoeter P,Fellgiebel A ( 2007): Diagnostic utility of hippocampal size and mean diffusivity in amnestic MCI. Neurobiol Aging 28: 398–403. [DOI] [PubMed] [Google Scholar]
- Nielsen TA ( 1999): Mentation during sleep: The NREM/REM distinction In: Lydic R, Baghdoyan H, editors. Handbook of Behavioral State Control: Molecular and Cellular Mechanisms. Boca Raton: CRC Press; pp 101–128. [Google Scholar]
- Nielsen TA ( 2000): A review of mentation in REM and NREM sleep: “covert” REM sleep as a possible reconciliation of two opposing models. Behav Brain Sci 23: 851–866. [DOI] [PubMed] [Google Scholar]
- Nielsen TA,Stenstrom P ( 2005): What are the memory sources of dreaming? Nature 437: 1286–1289. [DOI] [PubMed] [Google Scholar]
- Nofzinger EA,Buysse DJ,Miewald JM,Meltzer CC,Price JC,Sembrat RC,Ombao H,Reynolds CF,Monk TH,Hall M,Kupfer DJ,Moore RY ( 2002): Human regional cerebral glucose metabolism during non‐rapid eye movement sleep in relation to waking. Brain 125: 1105–1115. [DOI] [PubMed] [Google Scholar]
- Oldfield RC ( 1971): The assessment and analysis of handedness: The Edinburgh inventory. Neuropsychologia 9: 97–113. [DOI] [PubMed] [Google Scholar]
- Peigneux P,Laureys S,Fuchs S,Delbeuck X,Degueldre C,Aerts J,Del Fiore G,Luxen A,Maquet P ( 2001): Generation of rapid eye movements during paradoxical sleep in humans. Neuroimage 14: 701–708. [DOI] [PubMed] [Google Scholar]
- Peigneux P,Laureys S,Fuchs S,Collette F,Perrin F,Reggers J,Phillips C,Degueldre C,Del Fiore G,Aerts J,Luxen A,Maquet P ( 2004): Are spatial memories strengthened in the human hippocampus during slow wave sleep? Neuron 44: 535–545. [DOI] [PubMed] [Google Scholar]
- Perneger TV ( 1998): What is wrong with Bonferroni adjustments. BMJ 136: 1236–1238. [DOI] [PMC free article] [PubMed] [Google Scholar]
- Petersen RC,Smith GE,Waring SC,Ivnik RJ,Tangalos EG,Kokmen E ( 1999): Mild cognitive impairment: Clinical characterization and outcome. Arch Neurol 56: 303–308. [DOI] [PubMed] [Google Scholar]
- Pfefferbaum A,Mathalon D,Sullivan E,Rawles J,Zipursky R,Lim K ( 1994): A quantitative magnetic resonance imaging study of changes in brain morphology from infancy to late adulthood. Arch Neurol 51: 874–887. [DOI] [PubMed] [Google Scholar]
- Phelps EA,O'Connor KJ,Gatenby JC,Gore JC,Grillon C,Davis M ( 2001): Activation of the left amygdala to a cognitive representation of fear. Nature Neurosci 4: 437–441. [DOI] [PubMed] [Google Scholar]
- Phillips ML,Medford N,Young AW,Williams L,Williams SC,Bullmore ET,Gray JA,Brammer MJ ( 2001): Time courses of left and right amygdalar responses to fearful facial expressions. HBM 12: 193–202. [DOI] [PMC free article] [PubMed] [Google Scholar]
- Piras F,Cherubini A,Caltagirone C,Spalletta G ( 2010): Education mediates microstructural changes in bilateral hippocampus. Hum Brain Mapp (Epub ahead of print). [DOI] [PMC free article] [PubMed]
- Quirk GJ,Mueller D ( 2008): Neural mechanisms of extinction learning and retrieval. Neuropsychopharmacology 33: 56–72. [DOI] [PMC free article] [PubMed] [Google Scholar]
- Rose SE,Janke AL,Chalk JB ( 2008): Gray and white matter changes in Alzheimer's disease: A diffusion tensor imaging study. J Magn Reson Imaging 27: 20–26. [DOI] [PubMed] [Google Scholar]
- Sankoh AJ,Huque MF,Dubey SD ( 1997): Some comments on frequently used multiple endpoint adjustments methods in clinical trials. Stat Med 16: 2529–2542. [DOI] [PubMed] [Google Scholar]
- Sasaki H,Abe O,Yamasue H,Fukuda R,Yamada H,Takei K,Suga M,Takao H,Kasai K,Aoki S,Ohtomo K ( 2009): Structural and diffusional brain abnormality related to relatively low level alcohol consumption. Neuroimage 46: 505–510. [DOI] [PubMed] [Google Scholar]
- Selden NRW,Everitt BJ,Jarrard LE,Robbins TW ( 1991): Complementary roles for the amygdala and hippocampus in aversive fear conditioning to explicit and contextual cues. Neuroscience 42: 335–350. [DOI] [PubMed] [Google Scholar]
- Sergerie K,Chochol C,Armony JL ( 2008): The role of the amygdala in emotional processing: A quantitative meta‐analysis of functional neuroimaging studies. Neurosci Biobehav Rev 32: 811–830. [DOI] [PubMed] [Google Scholar]
- Snyder F ( 1970): The phenomenology of dreaming In: Meadow L, Snow L, editors. The Psychodynamic Implications of the Physiological Studies on Dreams. Springfield, IL: Thomas; pp 124–151. [Google Scholar]
- Stickgold R,Hobson JA,Fosse R,Fosse M ( 2001a): Sleep, learning, and dreams: Off‐line memory reprocessing. Science 294: 1052–1057. [DOI] [PubMed] [Google Scholar]
- Stickgold R,Maila A,Fosse R,Hobson JA ( 2001b): Brain‐mind states. I. Longitudinal field study of sleep/wake factors influencing mentation report length. Sleep 24: 171–179. [DOI] [PubMed] [Google Scholar]
- Thottakara P,Lazar M,Johnson SC,Alexander AL ( 2006): Application of Brodmann's area templates for ROI selection in white matter tractography studies. Neuroimage 29: 868–878. [DOI] [PubMed] [Google Scholar]
- Torda C ( 1969): Dreams of subjects with bilateral hippocampal lesions. Acta Psychiatr Scand 45: 277–288. [DOI] [PubMed] [Google Scholar]
- Tuch DS,Salat DH,Wisco JJ,Zaleta AK,Hevelone ND,Rosas HD ( 2005): Choice reaction time performance correlates with diffusion anisotropy in white matter pathways supporting visuospatial attention. Proc Natl Acad Sci USA 102: 12212–12217. [DOI] [PMC free article] [PubMed] [Google Scholar]
- van Eijndhoven P,van Wingen G,van Oijen K,Rijpkema M,Goraj B,Jan Verkes R,Oude Voshaar R,Fernández G,Buitelaar J,Tendolkar I ( 2009): Amygdala volume marks the acute state in the early course of depression. Biol Psychiatry 65: 812–818. [DOI] [PubMed] [Google Scholar]
- Wamsley EJ,Antrobus JS ( 2009): The expression of trace conditioning during non‐REM Sleep and its relation to subjective experience. Neurobiol Learn Mem 92: 283–291. [DOI] [PubMed] [Google Scholar]
- Wang C,Stebbins GT,Medina DA,Shah RC,Bammer R,Moseley ME,Detoledo‐Morrell L ( 2010): Atrophy and dysfunction of parahippocampal white matter in mild Alzheimer's disease. Neurobiol Aging (Epub ahead of print). [DOI] [PMC free article] [PubMed] [Google Scholar]
- Webb WB,Kersey J ( 1967): Recall of dreams and the probability of stage 1‐REM sleep. Percept Mot Skills 24: 627–630. [DOI] [PubMed] [Google Scholar]
- Wehrle R,Czisch M,Kaufmann C,Wetter TC,Holsboer F,Auer DP,Pollmacher T ( 2005): Rapid eye movement‐related brain activation in human sleep: A functional magnetic resonance imaging study. Neuroreport 16: 853–857. [DOI] [PubMed] [Google Scholar]
- Wehrle R,Kaufmann C,Wetter TC,Holsboer F,Auer DP,Pollmächer T,Czisch M ( 2007): Functional microstates within human REM sleep: First evidence from fMRI of a thalamocortical network specific for phasic REM periods. Eur J Neurosci 25: 863–871. [DOI] [PubMed] [Google Scholar]
- Weisz R,Foulkes D ( 1970): Home and laboratory dreams collected under uniform sampling conditions. Psychophysiology 6: 588–596. [DOI] [PubMed] [Google Scholar]
- Wolbers T,Schoell ED,Büchel C ( 2006): The predictive value of white matter organization in posterior parietal cortex for spatial visualization ability. Neuroimage 32: 1450–1455. [DOI] [PubMed] [Google Scholar]
- Wright CI,Martis B,Schwartz CE,Shin LM,Fischer HH,McMullin K,Rauch SL ( 2003): Novelty responses and differential effects of order in the amygdala, substantia innominata, and inferior temporal cortex. Neuroimage 18: 660–669. [DOI] [PubMed] [Google Scholar]