

Abstract
Theta burst stimulation (TBS) is a protocol of subthreshold repetitive transcranial magnetic stimulation (rTMS) inducing changes in cortical excitability. From functional imaging studies with conventional subthreshold rTMS protocols, it remains unclear what type of modulation occurs (direction and dependency to neural activity) and whether putative effects are bound to unspecific changes in cerebral perfusion or require a functional challenge. In a within‐subjects (n = 17) repeated measurement design including real TBS and a control session without stimulation, we examined neural activation in a choice‐reaction task after application of intermittent TBS, a protocol, which enhances cortical excitability over the left motor cortex (M1). Brain activity was monitored by blood oxygenation level‐dependent (BOLD) functional magnetic resonance imaging interleaved with measuring regional cerebral blood flow (rCBF) at rest using MR‐based perfusion imaging. On a separate day, TMS‐induced compound muscle action potentials (cMAPs) amplitude of the right hand was measured after excitatory TBS. Compared to control, a significant decrease in BOLD signal due to right hand motor activity during the choice‐reaction task was observed mainly in the stimulated M1 and motor‐related remote areas after stimulation. This decrease might represent a facilitating effect, because cMAPs amplitude increased upon TBS compared to control. No changes in rCBF at rest were observed. The data demonstrate that subthreshold intermittent TBS targets both the stimulated cortical area as well as remote areas. The facilitation changing the efficacy of neural signal transmission seems to be reflected by a BOLD signal decrease, whereas the network at rest does not appear to be affected. Hum Brain Mapp, 2011. © 2010 Wiley‐Liss, Inc.
Keywords: human motor cortex, repetitive transcranial magnetic stimulation, choice‐reaction time, network facilitation, subthreshold stimulation, BOLD decrease
INTRODUCTION
Theta burst stimulation (TBS) is a novel variant of repetitive transcranial magnetic stimulation (rTMS). The protocol was inspired by hippocampal in vitro studies in which theta bursts were applied to evoke synaptic potentiation [Hess et al.,1996; Larson and Lynch,1986]. Observations of spontaneous θ–γ oscillations in the neocortex [Lisman and Idiart,1995] suggest that this stimulation pattern provides an effective mechanism for cerebral network modulation in humans [Canolty et al.,2006].
Huang et al. [2005] established two modalities of TBS raising significant effects on motor cortical excitability: intermittent TBS (iTBS) and continuous TBS (cTBS). ITBS applied to the primary motor cortex (M1) generates a facilitatory effect reflected by an increase in the amplitude of compound muscle action potentials (cMAPs) evoked by single‐pulse TMS. By contrast, cTBS induces inhibitory effects [Cárdenas‐Morales et al.,2010; Huang et al.,2005].
The effects of TBS on the human M1 excitability have widely been characterized by electrophysiological measurements of motor output [Di Lazzaro et al.,2008; Gentner et al.,2008; Huang et al.,2005,2007; Talelli et al.,2007; Teo et al.,2007]. However, the mechanisms underlying TBS after‐effects are not completely understood. It has been suggested that they might be similar to those involved in long‐term potentiation (LTP) and long‐term depression processes [Huang et al.,2005,2007]. Pharmacological studies in humans demonstrated that the after‐effects of TBS depend at least partially on N‐methyl‐d‐aspartate receptor activity [Huang et al.,2007; Teo et al.,2007]. More recently, a study by using magnetic resonance spectroscopy showed an increase in γ‐aminobutyric acid (GABA) concentration after cTBS supporting the long‐lasting inhibitory effects of cTBS on corticospinal excitability [Stagg et al.,2009]. Moreover, TBS was shown to affect the expression of activity‐dependent proteins in rat cortical inhibitory interneurons [Trippe et al.,2009]. ITBS increased the expression of the Zif268 protein involved in the early phase of LTP [Aydin‐Abidin et al.,2008] and reduced the number of inhibitory parvalbumine (PV)‐positive cells [Benali et al.,2009].
Given the evidence for excitatory and inhibitory processes involved in iTBS after‐effects, it is of interest to elucidate the modulation of excitability in cortical regions after the application of TBS over the human M1. Previously, TMS was combined with positron emission tomography (PET) to investigate rTMS effects on the modulated network [Fox et al.,1997; Paus et al.,1997; Siebner et al.,1998]. Alternatively, functional magnetic resonance imaging (fMRI) techniques like blood oxygenation level‐dependent (BOLD) signal opens the possibility to measure modulatory effects of rTMS without subject's exposition to radioactive substances [Bestmann et al.,2003; Bohning et al.,1997; Moisa et al.,2009]. Additionally, MR‐based regional perfusion imaging such as continuous arterial spin labeling (CASL) has also been demonstrated to be a well‐suited method to measure acute effects of rTMS [Moisa et al.,2010]. BOLD signal and CASL appear therefore as ideal methods to study the after‐effects of TBS in within‐subjects repeated measurements study designs in the active and resting network.
This multimodal combination has already been applied in neuroimaging studies focusing on changes in BOLD signal under conventional subthreshold rTMS over the motor cortex (M1) with, however, ambiguous results. For example, high‐frequency rTMS was shown not to change the BOLD signal in M1 during motor activity but rather to increase the signal in remote brain areas [Bestmann et al.,2003; Yoo et al.,2008]. On the other hand, using PET, low and high‐frequency rTMS were also shown to increase regional cerebral blood flow (rCBF) locally at M1 and in remote areas, which do not easily integrate with the well‐described electrophysiological effects [Lee et al.,2003; Rounis et al.,2005].
We set out to analyze the after‐effects of a single session of iTBS delivered over the left human M1 by means of BOLD fMRI during a choice‐reaction time task for 1 h. Because rTMS after‐effects have been shown to affect the resting brain as well, in addition to the active state, we investigated the resting brain with CASL perfusion seeking for iTBS‐induced modulations at rest in terms of rCBF changes.
METHODS
Subjects
Twenty healthy, male volunteers aged between 24 and 33 years (mean age, 27.3 ± 2.6 years) were recruited by local advertisement. They were right handed (0.87 ± 0.14, mean score ± SD) according to the Edinburgh inventory [Oldfield,1971]. Exclusion criteria were a history of brain injury, the presence of major medical illness, neurological or psychiatric clinical history, intake of medication during the study, and history of drug intake. All participants gave their written informed consent for the experiments and were paid for participation. The project followed the Declaration of Helsinki and was approved by the Ethics Committee of the University of Ulm. Two subjects presented hyperventilation symptoms upon application of TMS and therefore discontinued the study. In one subject, an anatomical abnormality was discovered during his first MRI session (control), which led to exclusion from the study. The remaining 17 subjects completed the study.
TMS
Single‐pulse TMS and intermittent theta burst stimulation (iTBS) were delivered over the left motor cortex using a Magpro X100 stimulator (Medtronic, Skovlunde, Denmark) with the figure‐of‐eight coil MC‐B70. Stimulation parameters were a biphasic pulse waveform and anteroposterior current direction in the brain in both, single‐pulse TMS, and iTBS. According to Huang et al. [2005], iTBS consisted of three pulses delivered at a frequency of 50 Hz every 200 ms during 2 s (10 bursts) and repeated every 10 s for a total duration of 191.84 s (600 pulses). Intensity of iTBS was set to 90% of active motor threshold (AMT, see below). It was triggered using an audio file (wav) generated by a custom program written in Python (2.4, Python Software Foundation, Hampton, NH) and played by Windows media player.
CMAPs amplitude were measured from the right abductor pollicis brevis (APB) muscle with a belly‐tendon montage using a universal amplifier (Toennies‐Jaeger, Höchberg, Germany, bandpass 20–2,000 Hz). Signals were digitized with an A/D data acquisition board (DAP 4200a, Microstar Laboratories, Bellevue, WA) at a sample rate of 5,000 Hz and stored on a PC. A custom program in DASYLab (V 9.0, National Instruments, measX GmbH & Co KG, Mönchengladbach, Germany) calculated and stored peak‐to‐peak amplitudes in an appropriate time window.
Coil position was monitored and stored with the frameless stereotactic positioning system BrainView (V 2, Fraunhofer IPA, Stuttgart, Germany, cf. Kammer et al. [2007]). The motor hot spot over left M1 was defined as the point of the maximum cMAPs amplitude in the right APB muscle at rest. Threshold measurements started with suprathreshold intensities that were decreased in steps of 1%. Resting motor threshold (RMT) was defined as the lowest stimulus intensity that elicited at least six responses ≥50 μV within 10 consecutive single pulses (cf. Ziemann et al. [1998]). AMT was defined as the lowest stimulus intensity that elicited an response ≥200 μV averaged from 10 consecutive single pulses during voluntary contraction (10% of maximum force, online measured, and visualized as average of a quadratic mean amplitude, based on Ziemann et al. [1997]).
Magnetic Resonance Imaging
A 3‐Tesla MRI head‐only system (Magnetom Allegra, Siemens, Erlangen, Germany) was used for the experiment. Visual stimuli were projected by means of MR‐compatible LCD goggles (VisuaStim Digital Interface Box, Resonance Technology, CA) that covered a horizontal visual angle of 30° and allowed an individual correction for refraction abnormalities.
The choice‐reaction time task was written in Presentation (V 11.0 Neurobehavioral Systems, San Francisco, CA). Motor responses were recorded with a precision of 1 ms using a custom‐made keyboard.
Structural Imaging
High‐resolution T1‐weighted anatomical images were obtained using a 3D MPRAGE sequence with repetition time (TR) 2.08 s, inversion time 1 s, echo time (TE) 3.93 ms, bandwidth (BW) 130 Hz/pixel, flip angle 12°, and matrix 256 × 256 pixels (1 × 1 mm2). The volume consisted of 256 contiguous slices of 1‐mm thickness acquired in sagittal direction. Total scan time was about 7.5 min.
BOLD Imaging
T2*‐weighted functional MR images were obtained using gradient echo echo‐planar imaging (EPI) in axial orientation along the AC–PC line with TR = 2 s (TE = 36 ms, BW 3906 Hz/pixel, and flip angle 90°). In‐planar matrix size was 64 × 64 pixels (3.6 × 3.6 mm2). The volumes consisted of 30 slices of 3 mm with a gap of 0.6 mm, resulting in isotropic voxel sizes. A total of 180 volumes were acquired for each scan lasting 6 min. The first two volumes of each scan were discarded to allow for T1 equilibration.
Perfusion Imaging
In CASL [Wang et al.,2005], positioning of the labeling plane was 8 cm below the center of the imaging sections. Labeling was accomplished by means of 20 RF‐pulses of 100 ms duration in combination with a gap of 7.5 ms between labeling pulses. Mean duration of the control or labeling sequence was 2142.5 ms. A delay of 1 s between the end of the labeling pulses and the image acquisition was inserted to reduce transit‐related effects. Control for off‐resonance artifacts was accomplished by applying a sinusoidal amplitude modulated version of the labeling pulse. T2*‐weighted interleaved (label, control) images with and without labeling were acquired using a gradient echo EPI sequence with TR of 4 s (TE 16 ms BW 3004 Hz/Px). In‐planar matrix size was 64 × 64 pixels (3.44 × 3.44 mm2). Along the AC‐PC line, 18 transversal slices with a thickness of 5 mm and a gap of 1.5 mm were acquired in ascending order. One perfusion, block comprised 60 acquisitions of labeled and control images. Effective scan time for one perfusion scan was 4 min.
Experimental Design
The study design comprised three different sessions performed on three different days always separated by 48 h each. All sessions started at the same time of the day. During the first day, the electrophysiological monitoring with iTBS was performed. During the second and third days, the fMRI measurements with iTBS (real) or without iTBS (control) were carried out. The order of real and control fMRI sessions was randomized and counterbalanced across subjects.
Electrophysiological Monitoring
CMAPs amplitude evoked by single‐pulse TMS was evaluated before and after the delivery of iTBS. Subjects were lying on a MR compatible couch during threshold measurements and monitoring. Baseline corticospinal excitability was assessed during 10 min by measuring the amplitude of cMAPs in the right APB muscle at rest to single‐pulse TMS applied with an intensity of 110% of the RMT. Every minute, eight pulses were applied at a frequency of 0.25 Hz. After the baseline period, iTBS was delivered over left M1 and immediately followed by a one minute lasting contraction of the right APB muscle at 10% of maximal individual force, as controlled online using DASYLab, to increase the facilitatory effect [Huang et al.,2008]. CMAPs amplitude after iTBS was recorded every minute for 60 min with the same procedure as used for the baseline measurement.
MRI Sessions
A slow event‐related design was applied to measure the BOLD fMRI signal during a choice‐reaction time task. On average, for every 25 s (±3 s jitter), an arrow appeared on the screen directing either to the left or to the right. Upon appearance of the stimulus, subjects had to press a button with the corresponding index finger as fast as possible. In each BOLD scan, a total of 18 arrows (nine pointing to the left and nine pointing to the right) were presented in pseudo‐randomized order. After each BOLD scan, subjects were asked to close their eyes for 4 min while running the CASL protocol to capture brain activity at rest in the absence of any functional challenge (see Fig. 1).
Figure 1.
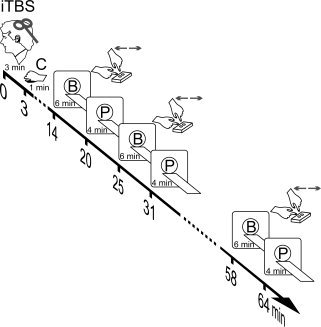
Experimental design. Participants received iTBS (three pulses at 50 Hz at 90% of the AMT delivered every 200 ms during 2 s and repeated every 10 s with a total of 600 pulses) over the left motor cortex followed by 1 min of contraction (C) of the abductor pollicis brevis (APB) muscle. Fourteen minutes after the beginning of iTBS BOLD scans (B) were acquired during a choice reaction time task with duration of 6 min per scan. The task is illustrated in the insets close to (B). BOLD acquisitions were alternated with 4 min lasting perfusion scans (P) at rest (eyes closed). A total of 10 fMRI scans were measured (five B alternated with five P) totaling 69 min per test day. Please notice that time line indicates the beginning of the scans. For the control session, fMRI scans were acquired without applying TBS but in presence of the 1 min lasting muscular contraction as on the days with real iTBS applied. Not depicted in the figure is that before iTBS or control subjects were anatomically scanned (T1), and a sequence of B–P–B scans were performed (baseline measures to compute inclusive functional sensory‐motor masks).
All MRI sessions started with an anatomical T1 scan to equilibrate the cardio‐vascular system to the supine position. Then, a baseline sequence comprising a BOLD scan with RT task, a CASL perfusion scan at rest and a second BOLD scan with RT task were performed before the TMS intervention. The two BOLD baseline measurements served to compute a functional sensory‐motor mask for further analysis and were not considered for further analysis of treatment effects (see Results section). Similarly, the baseline CASL scan was not included in the analysis. TMS was performed outside the scanner in a separate room. For transportation, subjects were carefully laid on a MR compatible examination couch and rolled into the separate room. Neuronavigated iTBS over the left M1 hot spot as determined in the electrophysiological session was applied in the real session, followed by the one minute contraction of the right APB muscle. In the control session, no TMS was applied, and subjects waited for the time interval the real stimulation had lasted and then performed the muscle contraction. In both MRI sessions, subjects lay on the MR compatible couch during stimulation or control session in a separate room.
Immediately after the end of the muscle contraction, subjects were replaced in the MR scanner. Across all subjects, the first BOLD scan comprising the choice‐reaction time task consistently started 14 min after the beginning of iTBS. A total of 10 scans (five functional BOLD scans during the motor task and five CASL scans at rest) were performed in an alternated order starting always with a BOLD scan (see Fig. 1).
Data Analysis
Behavioral Responses and cMAPs
Statistical analyses were computed using Statistica (V 8.0, StatSoft, Tulsa, OK). Data from the electrophysiological monitoring (amplitude of cMAPs) were averaged to a baseline value and across five separate blocks after stimulation, according to the timing of BOLD scans. They were analyzed using a repeated‐measures analysis of variance (ANOVA) with the factor time (six levels). Repeated measures were accounted for by using Greenhouse–Geisser corrections (epsilon values are reported together with the corrected P‐values). The same analysis was used to test on significant treatment effects on choice‐reaction time data obtained during fMRI. For each scan and hand, median values of individual response times were considered for analysis. Within‐subject factors were hand (two levels: right and left), time (five levels: BOLD scans), and treatment (two levels: control and real iTBS). Again P‐values were corrected according to Greenhouse–Geisser when appropriate, and post hoc Newman–Keuls tests were applied in case of significant interactions to further detail differences between factor combinations. The nominal level of significance for behavioral data was set to P < 0.05.
BOLD
Image preprocessing and statistical analyses were performed using Statistical Parametric Mapping (SPM5, Wellcome Department of Cognitive Neurology, London, UK; http://www.fil.ion.ucl.ac.uk). First, data from each scan were temporally slice‐time corrected and resliced. Second, functional images for each series were realigned to correct for small movements during the scan. Third, functional images acquired during the pre and post stimulation fMRI scans of one experimental day were spatially aligned and coregistered to the individual T1 image. Forth, all images were spatially normalized to a canonical T1 template in Montreal Neurological Institute (MNI) space. Finally, data were spatially smoothed with a 12‐mm3 full width at half maximum isotropic Gaussian kernel.
Scan separated regressors in the General Linear Model described the occurrences of the different motor responses of the right hand or left hand in form of delta functions at each onset of a button press, which were convoluted with a canonical hemodynamical response function. Image time series were scaled to a grand mean of 100 over all voxels and volumes. Low‐frequency drifts were removed by a high‐pass filter with a cut‐off of 128 s. Parameter estimation was corrected for serial correlations by use of a first‐order autoregressive model.
An individual first‐level analysis for each of the 14 different scans including the baseline BOLD scans (seven control and seven real iTBS scans) was carried out. The difference of neural activity upon right minus left hand motor responses was estimated using a one‐tailed t contrast. These 14 individual contrast images were transferred to a group analysis. A full‐factorial ANOVA was set up with two factors: treatment (two levels) and time (seven levels). Treatment effects were tested by means of an appropriate two‐tailed F‐test contrasting differential neural activity following control and real iTBS per each of the five BOLD scans that had followed the intervention phase. Treatment‐effects were evaluated on statistical significance within a functional sensory‐motor mask (see Results section). The level of significance to infer significant treatment effects was set to P < 0.05 [family‐wise error (FWE) corrected]. Furthermore, a whole‐brain analysis was performed for the treatment‐effect. Anatomical localization of results was corroborated within anatomical masks for dorsal premotor cortex (PMd), M1, and primary sensory cortex (S1) based on a meta‐analysis of 126 studies [Mayka et al.,2006].
CASL
Image preprocessing and statistical analyses of perfusion data were done using Statistical Parametric Mapping (SPM5, Wellcome Department of Cognitive Neurology, London, UK; http://www.fil.ion.ucl.ac.uk) in combination with software implemented in MATLAB (The Mathworks, Natick, MA) for use as a toolbox under SPM5. The toolbox code is based on a MATLAB script by H.Y. Rao and J.J. Wang from the Center for Functional Imaging at the University of Pennsylvania (http://www.cfn.upenn.edu/perfusion/software.htm) that implements a single compartment CASL perfusion model [Wang et al.,2005] for reconstructing raw perfusion images from EPI images by subtracting labeled and unlabeled control images, and for calculating images of quantified rCBF in units of mL/100 g tissue/min.
Images of each perfusion block were realigned to correct for head movements, and pair wise difference images between label and control images were converted into absolute rCBF images. Additionally, averaging across labeled and control images delivered one mean EPI per block. The mean EPIs from perfusion blocks P2–P6 of the first experimental day and the mean EPIs from all perfusion blocks of the second experimental day were co‐registered onto the mean EPI of block P1 of the first day. The transformation matrices for the mean EPI of one perfusion block were then applied to the rCBF images of the corresponding perfusion block, thus aligning all rCBF images across blocks and testing days. The individual T1 image was then coregistered onto the individual mean EPI of the first perfusion block. The coregistered T1 image was then used to derive the normalization matrices with respect to a canonical T1 template in MNI space. Resulting normalized rCBF images were spatially smoothed with a three‐dimensional, 12‐mm3 full‐width at half‐maximum isotropic Gaussian kernel. General linear models were used for voxel‐wise averaging of the rCBF data in each subject, including the volume mean over time as a covariate to reduce the effect of spatially coherent noise [Wang et al.,2003]. RCBF images were scaled to a grand mean of 50.
For each subject, the differential time course of rCBF changes between real iTBS and control was determined by pair wise subtraction of the mean rCBF images per perfusion block of either test day. Resulting individual mean difference images were transferred to a group random‐effects analysis. The design comprised the factors time with five levels (five perfusion blocks following either control or real iTBS) and subjects to further remove subjects' related variability. To infer significant treatment effects in terms of changing mean rCBF, differences over time these differences were tested by means of an appropriate F‐test comprising all five perfusion blocks following the intervention testing on significant deviations from zero per each perfusion block. Local effects within the inclusive functional sensory‐motor mask were considered statistically significant at a priori set of P < 0.01 (uncorrected) at the voxel level.
RESULTS
None of the included subjects reported any severe side effects after iTBS. Two participants experienced mild headache, which disappeared after some minutes without the intake of medication.
Effects of iTBS on Compound MAP Amplitudes Monitoring
Repeated measures ANOVA on averaged amplitudes of cMAPs showed a significant effect of time [F(5,80) = 3.55; P = 0.032; ε = 0.48]. Post hoc tests revealed a significant increase in the amplitude of cMAPs after iTBS up to a factor of 2.2 lasting for 42 min (interval of 14–20 min: P = 0.011, 25–31 min: P = 0.001, and 36–42 min: P = 0.0003) but not at later intervals of 47–53 min and 58–64 min (see Fig. 2).
Figure 2.
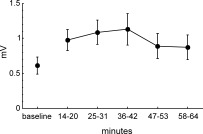
Compound muscle action potentials (cMAPs) amplitude in the right APB muscle (in mV) evoked by single pulse TMS. Error bars depict SEM. Baseline amplitude of cMAPs was assessed during 10 min at rest. After application of iTBS (600 pulses, 191.84 s), cMAPs were measured every minute for 1 h and averaged in time‐blocks corresponding to the time‐line of the different BOLD scans. The increase in the amplitude of cMAPs was significant (see text).
Choice Reaction Time Task During BOLD Experiment
Repeated measures ANOVA showed a significant effect of treatment [F (1,16) = 9.90; P = 0.006, Fig. 3]. Mean reaction times (RTs) were slightly faster after iTBS for the average of both hands [417 ± 8 ms, mean ± standard error of the mean (SEM)] compared to control (434 ± 9 ms). Neither the factor hand [F (1,16) = 0.71; P = 0.41] nor the factor time [F (4,64) = 2.02; P = 0.101] nor interactions between factors reached significance. All but one subject made at least one error in the choice‐reaction time task. However, overall error rates per session and hand were very low (range, 1–6, left control: 4.2 ± 1.6; left iTBS: 4.8 ± 1.3; right control: 2.4 ± 1.1; right iTBS: 2.0 ± 0.7; mean ± SD). Mean error rates did not significantly differ comparing control and iTBS sessions (right hand: Z = 0.55, P = 0.58, left hand: Z = 0.67, P = 0.50, Wilcoxon signed‐rank test). No significant correlations between RTs and error rates were found.
Figure 3.
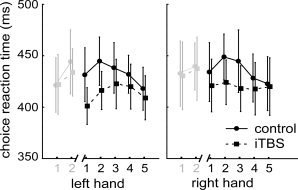
Results of choice reaction times (RTs) task during the five BOLD scans following iTBS and control session, separately for the right and left hand (black lines). Error bars depict SEM. The three‐factor ANOVA yielded a significant effect of factor treatment (see text). Although no interactions were found group‐averaged mean RTs data are depicted separately for the left and right hand to ease graphical inspection of treatment effects of iTBS. Lines in light gray depict RTs obtained during the two BOLD scans before iTBS. This data was not included in the ANOVA and indicate that the treatment effect could be calculated in the presence of homogenous baselines.
Effects of iTBS on BOLD Signal
Two functional regions of interest (ROI) defining sensory‐motor areas were determined using t‐statistics (FWE corrected, P < 0.05) contrasting neural activity upon right hand minus left hand motor responses, and vice versa. These t‐contrasts were calculated for an average of the 2 × 2 BOLD scans at the beginning of the two sessions before the intervention comprising either control or real iTBS. For right hand minus left hand activation, we got a cluster of 1,056 voxels (center −42 −20 66, Z = 7.37, P < 0.0001). According to the masks by Mayka et al. [2006] (see Methods section), 358 voxel were located in the left M1 region, and 780 voxel in the left S1 region (Fig. 4, inset, red). No activation was observed in left PMd. Left hand minus right hand activation revealed a cluster of 3,238 voxels (center 42 −22 54, Z = 7.99, P < 0.0001) including right M1 (1,135 voxel, according to Mayka et al. [2006]), right S1 (1,379 voxel), rostral parts of right superior and inferior parietal gyrus (BA 7 and BA40), and a small overlap into the right premotor area [BA 6, PMd (five voxels), see Fig. 4, inset, blue].
Figure 4.
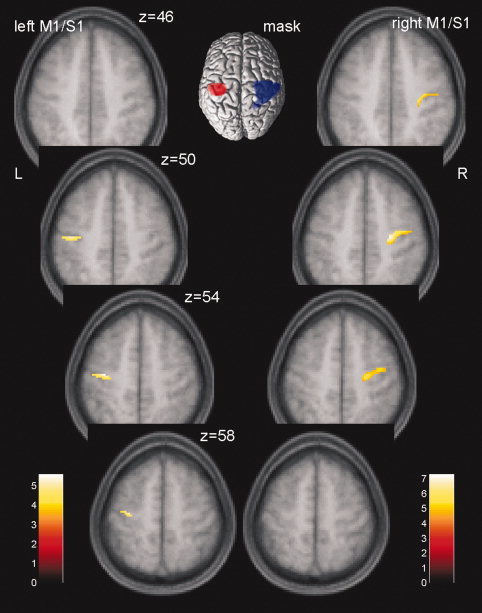
Significant treatment effects on BOLD responses for the difference right hand minus left hand in left and right clusters of M1/S1. Results at P < 0.05 [family‐wise error (FWE) corrected] are displayed on four axial sections of a mean T1‐image from all 17 subjects. t‐Values are color coded. The inset shows the two functional ROIs computed from a cluster of right (red) and left hand (blue) motor activity before the intervention.
The main analysis of iTBS effect was calculated separately for each hemisphere within the corresponding functional ROI. We observed a significant effect of an F‐test (FWE corrected, P < 0.05) in left and right sensory‐motor areas when contrasting the control versus the real iTBS measurements across all time‐points following the intervention (Table I, Fig. 4). Although effects for the left hemisphere are obviously located in and around the hand knob, effects in the right hemisphere are localized also a bit more anterior, including the dorsal premotor area. Significant results were due to the negative effect sizes from the second to the fifth BOLD scan after iTBS (25–64 min, Fig. 5A) indicating that neural activations for right hand motor responses minus left hand motor responses decreased after iTBS when compared with control sessions. To obtain further insight into the origin of the effect sizes' directions, individual BOLD responses upon left and right hand motor activity against baseline were averaged across all voxels in the left and right M1/S1 which were significant in the F‐test above (Fig. 5B). A graphical inspection of the distinct hand responses revealed two important observations: First, treatment effects as computed earlier in left and right M1/S1 were due to a consistent decrease in BOLD activity upon right hand motor responses and less consistent to an increase of BOLD activity upon left hand motor responses. Because treatment effects had been calculated on the differential brain activity of right hand minus left hand motor responses, this pattern conditioned the negative effect sizes depicted in Figure 5A for the second to the fifth time points of BOLD measurements after treatment (iTBS minus control). Second, the direction of left hand signals changed from the first to the second scan in either sensory‐motor area.
Table I.
ITBS effects on BOLD signal within the functional sensory‐motor mask
| Brain region | Talairach coordinates | Z‐score | P * | Cluster size | ||
|---|---|---|---|---|---|---|
| x | y | z | ||||
| Left M1/S1 | −34 | −16 | 56 | 3.81 | 0.0037 | 94 |
| M1** | 43 | |||||
| S1** | 68 | |||||
| Right M1/S1 | 26 | −18 | 48 | 4.59 | 0.00047 | 187 |
| M1** | 183 | |||||
| S1** | 17 | |||||
P values were family‐wise error (FWE) corrected.
Number of voxels in the anatomical region according to the masks of Mayka et al. [2006]. Because of a small overlap at the boarder of each mask, the number of voxels in the subregions does not add up to the total number of voxels.
Figure 5.
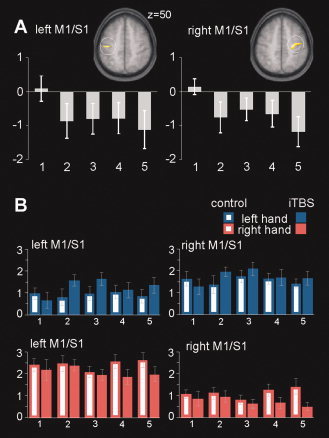
A: Parameter estimates of treatment effects (iTBS minus control) for the difference right hand minus left hand averaged over significant voxels in the clusters of left and right M1/S1 (compare Fig. 4). B: Mean neural magnitudes for each combination of factors treatment, hand, and time are shown as parameter estimates averaged across significant voxels in clusters of left and right M1/S1 separately. Abscissa: numbers refer to BOLD scans after treatment (14–64 min). Error bars depict SEM.
To test on treatment effects, we submitted the averaged parameter estimates to a repeated‐measure ANOVA with factors hand (two levels), treatment (two levels), and time (five levels). As expected, this analysis revealed a significant main effect of hand [F (1,16) = 62.6; P = 0.000001 and F (1,16) = 41.5; P = 0.000008] for the left and right M1/S1, respectively, as well as a significant interaction of factors treatment‐by‐hand in both hemispheres [left M1/S1: F (1,16) = 8.7; P = 0.0089; right M1/S1: F (1,16) = 24.8; P = 0.00014]. No other significant main effects (left M1/S1 treatment: F (1,16) = 0.002; P = 0.96; time: F (4,64) = 0.38; P = 0.82; right M1/S1 treatment: F (1,16) = 0.57; P = 0.46; time: F (4,64) = 0.28; P = 0.89) were observed. Averaged over time‐points a post hoc analysis (Newman–Keuls tests) of the significant treatment‐by‐hand interaction revealed that the BOLD signal on right hand movements significantly decreased after iTBS in both left M1/S1 (P = 0.046) and right M1/S1 (P = 0.0003, Fig. 5B, red bars) when compared against scans in control session. The increase of BOLD signals in both M1/S1 regions upon left hand motor responses almost reached significance in both sensory‐motor regions (left M1/S1 P = 0.0568, right M1/S1 P = 0.0564, Fig. 5B, blue bars).
In addition to the analysis based on the functional ROIs, a whole‐brain analysis of treatment effects (P < 0.05, false discovery rate corrected) was performed for exploratory reasons. Treatment effects were consistent with the analysis in the functional ROIs. In addition, the same pattern of results as demonstrated in M1/S1 was observed in some remote brain regions including premotor and extended somato‐sensory areas (Table II and Fig. 6).
Table II.
ITBS effects on BOLD signal in the whole brain
| Brain region | BA | Talairach coordinates | Z‐score | P | Cluster size | ||
|---|---|---|---|---|---|---|---|
| x | y | z | |||||
| Right | |||||||
| M1/S1 | 4/3 | 26 | −18 | 48 | 4.59 | 0.031 | 2089 |
| SMA, PMA, insula | 6, 13 | 48 | −12 | 8 | 3.99 | ||
| Superior temporal | 41 | 46 | −34 | 12 | 3.95 | ||
| Left | |||||||
| Middle and posterior cingulate | 24/31 | −16 | −28 | 50 | 4.53 | 0.031 | 268 |
| S1 | 3 | −62 | −10 | 40 | 4.45 | 0.031 | 1746 |
| M1 | 4 | −36 | −6 | 32 | 4.17 | ||
| SMA, PMA | 6 | −36 | −14 | 54 | 3.9 | ||
| Angular gyrus | 39 | −28 | −54 | 24 | 4.36 | 0.031 | 168 |
M1, primary motor cortex; S1, primary somatosensory cortex; PMA, premotor area; SMA, supplemental motor area.
Significance was set to P < 0.05 (FDR‐corrected).
Figure 6.
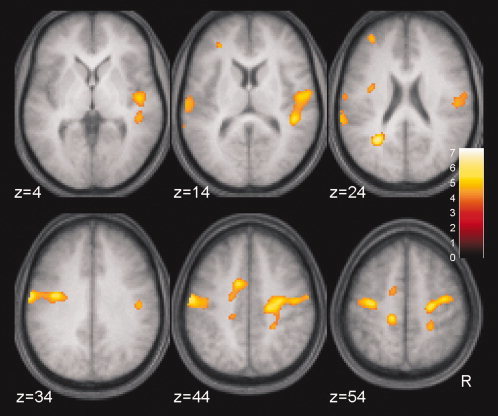
Treatment effects on BOLD signals in a whole brain analysis. The same F‐test as for the within‐ROI analysis was applied testing on significant differential (right hand minus left hand) signal changes by comparison of iTBS versus control over the five time‐points following the TMS intervention. Significance was set to P < 0.05 (false discovery rate‐corrected). t‐Values are color coded. Anatomical description is given in Table II.
We tested on significant correlations between BOLD signal changes and cMAPs as well as changes in reaction times. No significant results were obtained.
Effects of iTBS on CASL Perfusion
Similar to the analytic procedure for the BOLD data, treatment effects on perfusion data (CASL) were analyzed by an F‐test voxel‐wise contrasting mean perfusion rates between iTBS and control measurements across the five perfusion blocks following the TMS intervention. With this analysis confined to the inclusive functional sensory‐motor masks, no significant effects were observed neither at the site of stimulation (left M1/S1) nor contralaterally in right M1/S1, even at P‐values P < 0.1 uncorrected.
DISCUSSION
The main aim of this study was to explore effects of iTBS, a subthreshold rTMS protocol over left M1 on neuronal activity and rCBF. In line with previous electrophysiological studies, the iTBS protocol, measured in a separate session, increased the amplitude of cMAPs, thus replicating its excitatory profile [Huang et al.,2005,2007]. Behaviorally, iTBS was associated with an acceleration of RTs in a choice‐reaction time task averaged across left and right hand motor responses. This task served as the functional challenge during fMRI used to monitor changes in neural activity after iTBS in terms of BOLD signal changes. Compared to control, a significant decrease in BOLD signal on right hand motor responses was observed with iTBS. Interestingly, this decrease was consistent for each BOLD scan following the iTBS intervention and was evident in both, ipsi‐ and contralateral M1/S1 regions with respect to the stimulation site. Less consistent left hand motor responses after iTBS yielded slightly increased BOLD signaling in both regions of a functional sensory‐motor mask. MR‐based perfusion imaging realized by CASL did not indicate that the excitatory effects of iTBS involve a change in rCBF at rest.
Electrophysiological and Behavioral Effects
The present results could confirm and extend previous evidence of the facilitatory effect of iTBS on the amplitude of cMAPs [Huang et al.,2005,2007]. Moreover, increases in the amplitude of cMAPs after iTBS lasted longer than those initially described. [Cheeran et al.,2008; Huang et al.,2005,2007]. Very likely, this difference with previous reports may be due to the higher stimulation intensity used (90% AMT when compared with 80% AMT in Huang et al. [2005]) combined with a one minute lasting muscle contraction that followed iTBS [Huang et al.,2008]. Significance of control versus real iTBS differences of cMAPs amplitude vanished in time intervals after 1 h with respect to the beginning of iTBS application supporting the assumption that reliable excitatory effects will presumably no longer exist beyond this time‐point, at least with the given iTBS protocol.
A behavioral effect as a consequence of iTBS has not been observed in previous studies. Huang et al. [2005] did not find tapping frequency changes after iTBS, although they described a significant increase in tapping frequencies for the right hand after cTBS stimulation of the left M1 region. As regards present data the decrease in RTs, we observed for the right hand is in line with the facilitation obtained from electrophysiological data. The decrease in RTs observed for the left hand was unexpected and lacks a satisfactory explanation. We only can speculate that acceleration of motor responses in the choice‐reaction time task evoked by iTBS could be conditioned either by a modulation of premotor regions not specific for the side of reaction or by modulation of supramodal cortical regions involved in the attentional aspects of the task.
Effects on BOLD Signals
Because our study represents the first experimental step toward an MR‐based evaluation of a novel and specific subthreshold high‐frequency rTMS protocol, it is rather difficult to align present data with previous results using a combined multimodal approach. These previous studies showed that high frequency (3–10 Hz) subthreshold rTMS evoked changes in BOLD signals during motor activity only in remote areas immediately after the stimulation [Bestmann et al.,2003,2004] or as a persisting modulation in an off‐line design [Yoo et al.,2008]. By contrast, suprathreshold rTMS was shown to induce immediate changes at the stimulated area and some more distal regions [Bestmann et al.,2004; Moisa et al.,2010]. From that pattern of previous results, our data of BOLD signal change predominantly at the stimulated area as well as several cortical motor pathways (e.g., contralateral M1/S1, SMA, PMA, and cingulate cortex, see Fig. 6) would more align with conventional suprathreshold [Bestmann et al.,2004] than subthreshold rTMS. All regions were involved in the execution of the motor task, showing that the facilitatory effect of iTBS might be extended to the whole motor system [Rounis et al.,2006; Solodkin et al.,2001; Toni et al.,1999]. However, the present iTBS protocol was applied with subthreshold intensities and, on the other hand, conditioned a pronounced excitatory effect in cMAPs amplitude, which is hardly reached with conventional suprathreshold protocols [Maeda et al.,2000; Pascual‐Leone et al.,1994]. It could be that subthreshold iTBS modulates cortical excitability in a different way compared to conventional rTMS including modulation of the cortical area close to the coil.
An alternative explanation for the differences in spatial distribution between our results and previous studies could be represented in the difference of experimental protocols. Tapping or sequential finger tasks [Bestmann et al.,2003,2004; Yoo et al.,2008] as previously used in blocked fMRI design force continuous motor activity and therefore measure the more sustained BOLD changes. In contrast, the present choice‐reaction time task induces rather short motor actions interleaved with long periods of rest, which is more aligning with measuring the transient aspect of BOLD changes.
Direction of BOLD Modulation
The main iTBS treatment effect was conditioned by an overall significant decrease in BOLD signals in bilateral M1/S1 regions upon right hand motor responses in a choice‐reaction time task. Less consistently, the treatment effect further depended on an increase of BOLD signals associated with left hand motor responses.
Although an increase in BOLD signal is most likely to reflect an increase in neural activity, it is much more difficult to assign a decrease in BOLD signal to a particular change in neural activity [Logothetis,2008]. Across multiple sessions of a simple motor task a decrease in BOLD signal was observed in healthy subjects over time suggesting habituation or attentional modulation to take place [Goodyear and Douglas,2009; Loubinoux et al.,2001]. Moreover, decreased activity in prefrontal, anterior cingulate, parietal, premotor, and motor cortex and reduced GABA concentrations at least in the primary sensorimotor cortex have been found over scans during short‐term motor learning [Floyer‐Lea and Matthews,2005; Floyer‐Lea et al.,2006].
Our study design, however, excludes the presence of a mere habituation process. We included a control condition incorporating the same task, which therefore controlled for any putative habituation or adaptation phenomena that might have biased inference of treatment effects. An alternative explanation to account for the BOLD decreases suggests that, after iTBS, the motor network requires less neuronal activity to perform the same task. The altered cortical excitability induced by rTMS might change the efficacy of neural signal transmission resulting in reduced postsynaptic field potentials and therefore reduced BOLD signal similarly to the decrease observed during short‐term motor learning. Although the mechanisms by which iTBS exerts these effects are not completely understood, it is quite plausible that facilitation after iTBS results from a change of the balance between inhibitory and excitatory forces [Huang et al.,2005,2008; Stagg et al.,2009; Thickbroom,2007]. Recently, changes in the activity of cortical neurons have been demonstrated in rats. Specifically, iTBS reduced the number of inhibitory cells expressing PV immediately after stimulation [Benali et al.,2009], supporting the concept that an important part of modulation occurs within the inhibitory pathway. In line with this concept is the observation that a pharmacological block of GABA induces LTP after electrical TBS in the rat motor cortex [Castro‐Alamancos et al.,1995].
In PET studies, an rCBF increase associated with inhibitory subthreshold 1 Hz rTMS during motor activity was observed [Chouinard et al.,2003; Lee et al.,2003]. Lee et al. [2003] proposed an attenuation of the motor network efficacy as a condition for rCBF increase. This is in line with the spectroscopic demonstration of an increase in GABA concentration following cTBS in the absence of glutamate/glutamine (Glx) level changes [Stagg et al.,2009]. Our observations are in favor of this assumption but with the opposite direction; that is excitatory iTBS induces facilitation of motor network efficacy during motor activity via decrease of inhibitory activity, therefore decreasing the overall BOLD signal.
Following this framework, the increase in BOLD signals related to left hand motor activity might then reflect a tendency to inhibition within the motor network. This would align with previous electrophysiological data observing that after TBS the amplitude of cMAPs in the nonstimulated hemisphere was affected in the opposite direction to that in the stimulated hemisphere probably mediated by transcallosal connections [Stefan et al.,2008; Suppa et al.,2008]. Notably, however, we also observed an acceleration in reaction times for left hand motor responses, which do not easily integrate into the framework of ipsilateral facilitation and contralateral inhibition. At present, we are not in the position to give a conclusive account for this observation. Previous motor studies [Dassonville et al.,1997; Zeng et al.,2007] demonstrated that the motor network controlling for movements of the left, nondominant hand is not just a mirror of the dominant right hand motor network and an explanation for this conflicting result might be covered in this phenomenon.
Functional Imaging at Rest
Cerebral perfusion in the sensory‐motor ROIs at rest did not change with iTBS confirming previous observations in rTMS/PET studies at rest [Conchou et al.,2008]. This indicates that the BOLD signal decrease is not caused by a global change in brain perfusion within the network and supports the idea that the facilitating effect of iTBS is activity‐dependent. By contrast, previous PET/TMS studies [Lee et al.,2003; Rounis et al.,2005] observed that rTMS induced changes in rCBF not only during motor activity but even at rest. Up to now, there is no conclusive explanation for the observed differences in rTMS‐induced rCBF changes at rest. The number, intensity, and grouping of applied stimuli might be responsible for such discrepancies. Furthermore, it could be that an after‐effect of iTBS at rest declines within a few minutes after stimulation. In our experimental design, the first fMRI perfusion scan started 20 min after the beginning of iTBS, and therefore we might have missed an early effect of iTBS at rest.
Lack of Correlations Between Behavioral, Electrophysiological, and Functional Data
Two different explanations can account for the absence of significant correlations between individual BOLD‐responses and electrophysiological time courses. Because the data are obtained from two different sessions, it might be that the time course of iTBS‐induced facilitations cannot be precisely reproduced in the same subject. To our knowledge, reproducibility has not been investigated yet in a within design. Another explanation could be that electrophysiological facilitation measured at rest has a different time course compared to facilitation with active motor performance as measured during BOLD scans. The lack of significant correlations between reaction times and BOLD data indicates that the facilitation of behavior is not directly related to the amount of BOLD changes in M1/S1, in line with the observation that performance of both hands has been accelerated.
CONCLUSION
In this study, we provide evidence for a modulatory effect of iTBS on bilateral M1/S1 regions reflected by a significant decrease in BOLD signal on right hand motor responses and increased cMAPs derived from electrophysiological monitoring. MR‐based perfusion imaging (CASL) did not show any evidence for rCBF changes at rest in both sensory‐motor areas. As regards future studies in this field, the combination of TBS with neuroimaging appears as a useful approach to induce and to monitor treatment effects for example in the rehabilitation of cortical motor deficits following brain strokes. Besides a putative clinical benefit, the additional involvement of ipsi‐ or contralaterally lesioned brain regions might also be helpful in a further understanding of motor network processing.
Acknowledgements
We thank Eva Peron and Eun‐Jin Sim for technical assistance.
REFERENCES
- Aydin‐Abidin S, Trippe J, Funke K, Eysel UT, Benali A ( 2008): High‐ and low‐frequency repetitive transcranial magnetic stimulation differentially activates c‐Fos and zif268 protein expression in the rat brain. Exp Brain Res 188: 249–261. [DOI] [PubMed] [Google Scholar]
- Benali A, Mix A, Trippe J, Eysel UT, Funke K ( 2009): High and low frequency transcranial magnetic stimulation modulate the inhibitory system in the rat cortex. Soc Neurosci Abstr Chicago 719.12. [Google Scholar]
- Bestmann S, Baudewig J, Siebner HR, Rothwell JC, Frahm J ( 2003): Subthreshold high‐frequency TMS of human primary motor cortex modulates interconnected frontal motor areas as detected by interleaved fMRI‐TMS. Neuroimage 20: 1685–1696. [DOI] [PubMed] [Google Scholar]
- Bestmann S, Baudewig J, Siebner HR, Rothwell JC, Frahm J ( 2004): Functional MRI of the immediate impact of transcranial magnetic stimulation on cortical and subcortical motor circuits. Eur J Neurosci 19: 1950–1962. [DOI] [PubMed] [Google Scholar]
- Bohning DE, Pecheny AP, Epstein CM, Speer AM, Vincent DJ, Dannels W, George MS ( 1997): Mapping transcranial magnetic stimulation (TMS) fields in vivo with MRI. Neuroreport 8: 2535–2538. [DOI] [PubMed] [Google Scholar]
- Canolty RT, Edwards E, Dalal SS, Soltani M, Nagarajan SS, Kirsch HE, Berger MS, Barbaro NM, Knight RT ( 2006): High gamma power is phase‐locked to theta oscillations in human neocortex. Science 313: 1626–1628. [DOI] [PMC free article] [PubMed] [Google Scholar]
- Cárdenas‐Morales L, Nowak DA, Kammer T, Wolf RC, Schönfeldt‐Lecuona C ( 2010): Mechanisms and applications of theta‐burst rTMS on the human motor cortex. Brain Topogr 22: 294–306. [DOI] [PubMed] [Google Scholar]
- Castro‐Alamancos MA, Donoghue JP, Connors BW ( 1995): Different forms of synaptic plasticity in somatosensory and motor areas of the neocortex. J Neurosci 15: 5324–5333. [DOI] [PMC free article] [PubMed] [Google Scholar]
- Cheeran B, Talelli P, Mori F, Koch G, Suppa A, Edwards MJ, Houlden H, Bhatia K, Greenwood R, Rothwell JC ( 2008): A common polymorphism in the brain derived neurotrophic factor gene (BDNF) modulates human cortical plasticity and the response to rTMS. J Physiol 586: 5717–5725. [DOI] [PMC free article] [PubMed] [Google Scholar]
- Chouinard PA, Van Der Werf YD, Leonard G, Paus T ( 2003): Modulating neural networks with transcranial magnetic stimulation applied over the dorsal premotor and primary motor cortices. J Neurophysiol 90: 1071–1083. [DOI] [PubMed] [Google Scholar]
- Conchou F, Loubinoux I, Castel‐Lacanal E, Le Tinnier A, Gerdelat‐Mas A, Faure‐Marie N, Gros H, Thalamas C, Calvas F, Berry I, et al. ( 2008): Neural substrates of low‐frequency repetitive transcranial magnetic stimulation during movement in healthy subjects and acute stroke patients. A PET study. Hum Brain Mapp 30: 2542–2557. [DOI] [PMC free article] [PubMed] [Google Scholar]
- Dassonville P, Zhu XH, Urgurbil K, Kim SG, Ashe J ( 1997): Functional activation in motor cortex reflects the direction and the degree of handedness. Proc Natl Acad Sci USA 94: 14015–14018. [DOI] [PMC free article] [PubMed] [Google Scholar]
- Di Lazzaro V, Pilato F, Dileone M, Profice P, Capone F, Ranieri F, Musumeci G, Cianfoni A, Pasqualetti P, Tonali PA ( 2008): Modulating cortical excitability in acute stroke: A repetitive TMS study. Clin Neurophysiol 119: 715–723. [DOI] [PubMed] [Google Scholar]
- Floyer‐Lea A, Matthews PM ( 2005): Distinguishable brain activation networks for short‐ and long‐term motor skill learning. J Neurophysiol 94: 512–518. [DOI] [PubMed] [Google Scholar]
- Floyer‐Lea A, Wylezinska M, Kincses T, Matthews PM ( 2006): Rapid modulation of GABA concentration in human sensorimotor cortex during motor learning. J Neurophysiol 95: 1639–1644. [DOI] [PubMed] [Google Scholar]
- Fox P, Ingham R, George MS, Mayberg H, Ingham J, Roby J, Martin C, Jerabek P ( 1997): Imaging human intra‐cerebral connectivity by PET during TMS. Neuroreport 8: 2787–2791. [DOI] [PubMed] [Google Scholar]
- Gentner R, Wankerl K, Reinsberger C, Zeller D, Classen J ( 2008): Depression of human corticospinal excitability induced by magnetic theta‐burst stimulation: Evidence of rapid polarity‐reversing metaplasticity. Cereb Cortex 18: 2046–2053. [DOI] [PubMed] [Google Scholar]
- Goodyear BG, Douglas EA ( 2009): Decreasing task‐related brain activity over repeated functional MRI scans and sessions with no change in performance: Implications for serial investigations. Exp Brain Res 192: 231–239. [DOI] [PubMed] [Google Scholar]
- Hess G, Aizenman CD, Donoghue JP ( 1996): Conditions for the induction of long‐term potentiation in layer II/III horizontal connections of the rat motor cortex. J Neurophysiol 75: 1765–1778. [DOI] [PubMed] [Google Scholar]
- Huang YZ, Edwards MJ, Rounis E, Bhatia KP, Rothwell JC ( 2005): Theta burst stimulation of the human motor cortex. Neuron 45: 201–206. [DOI] [PubMed] [Google Scholar]
- Huang YZ, Chen RS, Rothwell JC, Wen HY ( 2007): The after‐effect of human theta burst stimulation is NMDA receptor dependent. Clin Neurophysiol 118: 1028–1032. [DOI] [PubMed] [Google Scholar]
- Huang YZ, Rothwell JC, Edwards MJ, Chen RS ( 2008): Effect of physiological activity on an NMDA‐dependent form of cortical plasticity in human. Cereb Cortex 18: 563–570. [DOI] [PubMed] [Google Scholar]
- Kammer T, Vorwerg M, Herrnberger B ( 2007): Anisotropy in the visual cortex investigated by neuronavigated transcranial magnetic stimulation. NeuroImage 36: 313–321. [DOI] [PubMed] [Google Scholar]
- Larson J, Lynch G ( 1986): Induction of synaptic potentiation in hippocampus by patterned stimulation involves two events. Science 232: 985–988. [DOI] [PubMed] [Google Scholar]
- Lee L, Siebner HR, Rowe JB, Rizzo V, Rothwell JC, Frackowiak RS, Friston KJ ( 2003): Acute remapping within the motor system induced by low‐frequency repetitive transcranial magnetic stimulation. J Neurosci 23: 5308–5318. [DOI] [PMC free article] [PubMed] [Google Scholar]
- Lisman JE, Idiart MA ( 1995): Storage of 7 ± 2 short‐term memories in oscillatory subcycles. Science 267: 1512–1515. [DOI] [PubMed] [Google Scholar]
- Logothetis NK ( 2008): What we can do and what we cannot do with fMRI. Nature 453: 869–878. [DOI] [PubMed] [Google Scholar]
- Loubinoux I, Carel C, Alary F, Boulanouar K, Viallard G, Manelfe C, Rascol O, Celsis P, Chollet F ( 2001): Within‐session and between‐session reproducibility of cerebral sensorimotor activation: A test–retest effect evidenced with functional magnetic resonance imaging. J Cereb Blood Flow Metab 21: 592–607. [DOI] [PubMed] [Google Scholar]
- Maeda F, Keenan JP, Tormos JM, Topka H, Pascual‐Leone A ( 2000): Interindividual variability of the modulatory effects of repetitive transcranial magnetic stimulation on cortical excitability. Exp Brain Res 133: 125–130. [DOI] [PubMed] [Google Scholar]
- Mayka MA, Corcos DM, Leurganse SE, Vaillancourt DE ( 2006): Three‐dimensional locations and boundaries of motor and premotor cortices as defined by functional brain imaging: A meta‐analysis. Neuroimage 31: 1453–1474. [DOI] [PMC free article] [PubMed] [Google Scholar]
- Moisa M, Pohmann R, Ewald L, Thielscher A ( 2009): New coil positioning method for interleaved transcranial magnetic stimulation (TMS)/functional MRI (fMRI) and its validation in a motor cortex study. J Magn Reson Imaging 29: 189–197. [DOI] [PubMed] [Google Scholar]
- Moisa M, Pohmann R, Uludag K, Thielscher A ( 2010): Interleaved TMS/CASL: Comparison of different rTMS protocols. NeuroImage 49: 612–620. [DOI] [PubMed] [Google Scholar]
- Oldfield RC ( 1971): The assessment and analysis of handedness: The Edinburgh inventory. Neuropsychologia 9: 97–113. [DOI] [PubMed] [Google Scholar]
- Pascual‐Leone A, Valls‐Solé J, Wassermann EM, Hallett M ( 1994): Responses to rapid‐rate transcranial magnetic stimulation of the human motor cortex. Brain 117: 847–858. [DOI] [PubMed] [Google Scholar]
- Paus T, Jech R, Thompson CJ, Comeau R, Peters T, Evans AC ( 1997): Transcranial magnetic stimulation during positron emission tomography: A new method for studying connectivity of the human cerebral cortex. J Neurosci 17: 3178–3184. [DOI] [PMC free article] [PubMed] [Google Scholar]
- Rounis E, Lee L, Siebner HR, Rowe JB, Friston KJ, Rothwell JC, Frackowiak RS ( 2005): Frequency specific changes in regional cerebral blood flow and motor system connectivity following rTMS to the primary motor cortex. NeuroImage 26: 164–176. [DOI] [PubMed] [Google Scholar]
- Rounis E, Stephan KE, Lee L, Siebner HR, Pesenti A, Friston KJ, Rothwell JC, Frackowiak RS ( 2006): Acute changes in frontoparietal activity after repetitive transcranial magnetic stimulation over the dorsolateral prefrontal cortex in a cued reaction time task. J Neurosci 26: 9629–9638. [DOI] [PMC free article] [PubMed] [Google Scholar]
- Siebner HR, Willoch F, Peller M, Auer C, Boecker H, Conrad B, Bartenstein P ( 1998): Imaging brain activation induced by long trains of repetitive transcranial magnetic stimulation. Neuroreport 9: 943–948. [DOI] [PubMed] [Google Scholar]
- Solodkin A, Hlustik P, Noll DC, Small SL ( 2001): Lateralization of motor circuits and handedness during finger movements. Eur J Neurol 8: 425–434. [DOI] [PubMed] [Google Scholar]
- Stagg CJ, Wylezinska M, Matthews PM, Johansen‐Berg H, Jezzard P, Rothwell JC, Bestmann S ( 2009): Neurochemical effects of theta burst stimulation as assessed by magnetic resonance spectroscopy. J Neurophysiol 101: 2872–2877. [DOI] [PMC free article] [PubMed] [Google Scholar]
- Stefan K, Gentner R, Zeller D, Dang S, Classen J ( 2008): Theta‐burst stimulation: Remote physiological and local behavioral after‐effects. NeuroImage 40: 265–274. [DOI] [PubMed] [Google Scholar]
- Suppa A, Ortu E, Zafar N, Deriu F, Paulus W, Berardelli A, Rothwell JC ( 2008): Theta burst stimulation induces after‐effects on contralateral primary motor cortex excitability in humans. J Physiol 586: 4489–4500. [DOI] [PMC free article] [PubMed] [Google Scholar]
- Talelli P, Cheeran BJ, Teo JTH, Rothwell JC ( 2007): Pattern‐specific role of the current orientation used to deliver Theta Burst Stimulation. Clin Neurophysiol 118: 1815–1823. [DOI] [PubMed] [Google Scholar]
- Teo JTH, Swayne OB, Rothwell JC ( 2007): Further evidence for NMDA‐dependence of the after‐effects of human theta burst stimulation. Clin Neurophysiol 118: 1649–1651. [DOI] [PubMed] [Google Scholar]
- Thickbroom GW ( 2007): Transcranial magnetic stimulation and synaptic plasticity: Experimental framework and human models. Exp Brain Res 180: 583–593. [DOI] [PubMed] [Google Scholar]
- Toni I, Schluter ND, Josephs O, Friston K, Passingham RE ( 1999): Signal‐, set‐ and movement‐related activity in the human brain: An event‐related fMRI study. Cereb Cortex 9: 35–49. [DOI] [PubMed] [Google Scholar]
- Trippe J, Mix A, Aydin‐Abidin S, Funke K, Benali A ( 2009): Theta burst and conventional low‐frequency rTMS differentially affect GABAergic neurotransmission in the rat cortex. Exp Brain Res 199: 411–421. [DOI] [PubMed] [Google Scholar]
- Wang J, Aguirre GK, Kimberg DY, Detre JA ( 2003): Empirical analyses of nullhypothesis perfusion FMRI data at 1.5 and 4 T. NeuroImage 19: 1449–1462. [DOI] [PubMed] [Google Scholar]
- Wang Z, Wang J, Connick TJ, Wetmore GS, Detre JA ( 2005): Continuous ASL (CASL) perfusion MRI with an array coil and parallel imaging at 3T. Magn Reson Med 54: 732–737. [DOI] [PubMed] [Google Scholar]
- Yoo WK, You SH, Ko MH, Tae Kim S, Park CH, Park JW, Hoon Ohn S, Hallett M, Kim YH ( 2008): High frequency rTMS modulation of the sensorimotor networks: Behavioral changes and fMRI correlates. NeuroImage 39: 1886–1895. [DOI] [PubMed] [Google Scholar]
- Zeng L, Chen H, Ouyang L, Yao D, Gao JH ( 2007): Quantitative analysis of asymmetrical cortical activity in motor areas during sequential finger movement. Magn Reson Imaging 25: 1370–1375. [DOI] [PubMed] [Google Scholar]
- Ziemann U, Tergau F, Bruns D, Baudewig J, Paulus W ( 1997): Changes in human motor cortex excitability induced by dopaminergic and anti‐dopaminergic drugs. Electroenceph Clin Neurophysiol 105: 430–437. [DOI] [PubMed] [Google Scholar]
- Ziemann U, Corwell B, Cohen LG ( 1998): Modulation of plasticity in human motor cortex after forearm ischemic nerve block. J Neurosci 18: 1115–1123. [DOI] [PMC free article] [PubMed] [Google Scholar]