

Abstract
Functional cerebral asymmetries (FCAs) in women have been shown to vary with changing levels of sex hormones during the menstrual cycle. Previous studies have suggested that interhemispheric interaction forms a key component in generating FCAs and it has been shown behaviorally and by functional imaging that interhemispheric interaction changes during the menstrual cycle, at least for a left hemisphere dominant task. We used functional MRI and an analysis of functional connectivity to examine whether changes in right hemisphere advantage for a figure comparison task as found in behavioral studies, are based on comparable mechanisms like those identified for the verbal task. Women were examined three times during the menstrual cycle, during the menstrual, follicular and luteal phases. The behavioral data confirmed the right hemisphere advantage for the figure comparison task as well as changes of the right hemisphere advantage during the menstrual cycle. Imaging data showed cycle phase‐related changes in lateralized brain activation within the task‐dominant hemisphere and changes in connectivity between nonhomotopic areas of both hemispheres, suggesting that changes in functional brain organization in women during the menstrual cycle are not only restricted to hormone‐related changes of interhemispheric inhibition between homotopic areas, as has been proposed earlier, but might additionally apply to changes of neuronal processes within the hemispheres which seem to be modulated by heterotopic functional connectivity between hemispheres. Hum Brain Mapp, 2010. © 2010 Wiley‐Liss, Inc.
Keywords: functional magnetic resonance imaging, functional cerebral asymmetries, sex differences, sex hormones, lateralization, progesterone, estradiol
INTRODUCTION
A variety of behavioral studies have shown that most higher cognitive functions are lateralized to one of the cerebral hemispheres, i.e. for certain cognitive functions either the left or the right hemisphere shows an advantage. The left hemisphere is known to be dominant for verbal tasks [Bryden et al., 1983; Beaumont, 1982; McKeever et al., 1995], while the right hemisphere is superior for spatial processing [Vogel et al., 2003].
Those behavioral studies which indentified sex differences generally found functional cerebral asymmetries (FCAs) to be more pronounced in men than in women [McGlone, 1980; Hausmann and Güntürkün, 1999; Shaywitz et al., 1995; Hausmann et al., 1998]. Furthermore, it has been found repeatedly that FCAs in women vary across the menstrual cycle [Bibawi et al., 1995; Hampson, 1990; Rode et al., 1995], while they are relatively stable in women after menopause and in men [Hausmann and Güntürkün, 2000].
Functional imaging studies, on the other hand, often do not find sex differences [Sommer et al., 2004; Kansaku and Kitazawa, 2001] in functional lateralization. For example, a meta‐analysis of functional imaging studies on language lateralization [Sommer et al., 2004] revealed that on the whole only small sex differences in language lateralization exist. The failure to identify sex differences in functional imaging studies might at least partially be explained by the fact that imaging studies usually only comprise small numbers of subjects. Moreover, it should be noted that almost none of these studies controlled for cycle phase and/or underlying sex hormone levels.
On the other hand, a behavioral study which did control for hormone concentration [Hausmann and Güntürkün, 2000] identified interactions between cycle phase and FCAs both in right‐ and left‐hemispheric dominant tasks. The authors proposed that FCAs seem to be modulated by a global mechanism. The model states that interhemispheric information transfer is a central mechanism in generating and maintaining FCAs [Chiarello and Maxfield, 1996; Cook, 1984]. The authors further assume that in the course of the menstrual cycle steroid hormones, especially progesterone, reduce cerebral asymmetries by diminishing the corticocortical transmission and thus the interhemispheric inhibition via the corpus callosum [Hausmann and Güntürkün, 2000]. Recent studies, on the other hand, have shown that other hormones, especially estradiol, also influence FCAs [Hollander et al., 2005; Hausmann, 2005; Weis et al., 2008], supporting the need to extend the hypothesis of progesterone‐modulated interhemispheric decoupling in order to incorporate estradiol‐related effects on specific aspects of interhemispheric interaction [Hausmann and Bayer, 2009].
A recent fMRI study [Weis et al., 2008], which directly examined hormonal influences on functional brain organization in healthy young women, supported the model of Hausmann and Güntürkün [ 2000] whereby interhemispheric interaction forms a key component in generating FCAs. The authors employed a verbal task, which was strongly lateralized to the left hemisphere, to study changes of the inhibitory influence of the dominant on the nondominant hemisphere during the menstrual cycle. A connectivity analysis identified a significant change in inhibition between the central area of activation, the inferior frontal gyrus of the dominant and the nondominant hemisphere between the menstrual and the follicular phase. Also, a negative correlation between estradiol level and strength of the interhemispheric inhibition during both the menstrual and the follicular phase was revealed. Even though these findings from a left‐lateralized verbal task presumably delineate a more general mechanism of hormone‐mediated changes in functional brain organization, other mechanisms might also contribute to the dynamics of functional brain organization in the female brain.
Recent results from the study of FCAs in postmenopausal women receiving hormone therapy [Bayer and Hausmann, 2009], for example, showed an estradiol‐related modulation of neuronal circuitries within the right hemisphere and not across hemispheres. These results suggest that hormonal effects on FCAs are not restricted to interhemispheric inhibition as originally proposed by Hausmann and Güntürkün, but might additionally apply to plastic changes of neuronal processes within the hemispheres.
We aimed to extend the findings concerning the left‐lateralized verbal task [Weis et al., 2008] by using fMRI to study changes in brain activation during the menstrual cycle in women performing a figure comparison task. For this task, a right hemisphere advantage has been shown behaviorally [Hausmann and Güntürkün, 1999, 2000]. Furthermore, this right hemisphere advantage has been shown to fluctuate during the menstrual cycle and to be more pronounced in men than in women [Hausmann and Güntürkün, 2000].
The figure comparison task has not yet been studied with functional imaging. For related spatial tasks, especially mental rotation, functional imaging studies have identified cortical activation in bilateral core regions in the superior and inferior parietal lobe around the intraparietal sulcus [Harris et al., 2000; Jordan et al., 2001; Dietrich et al., 2001]. These activations were found for different kinds of stimuli, including three dimensional and two dimensional abstract objects and letters. In accordance with behavioral data identifying a right hemisphere advantage for this type of task, some imaging studies have also shown a lateralization of activations in the right hemisphere [Harris et al., 2000; Dietrich et al., 2001]. A recent fMRI study [Milivojevic et al., 2009] also observed hemispheric asymmetries for a mental rotation task, but activations in these regions did not increase with the amount of angular rotation. On the basis of these findings, the authors suggest that the hemispheric asymmetries may rather be related to visuospatial processing than mental rotation per se.
The present study used functional MRI to examine whether changes in right hemisphere advantage for the figure comparison task as found in behavioral studies, are based on comparable mechanisms like those identified for the verbal task in our former study. While existing studies only tested women either during the menstrual and the luteal phase [Hausmann and Güntürkün, 2000; Fernandez et al., 2003] to identify the influence of progesterone or during the menstrual and the follicular phase [Dietrich et al., 2001; Weis et al., 2008] for estradiol‐related differences, our study is the first functional imaging study to conjointly examine the influence of progesterone and estradiol on functional brain organization in women by testing subjects three times during the menstrual cycle.
MATERIALS AND METHODS
Subjects
Fourteen right‐handed, normally cycling women, who were not taking any hormonal contraceptives, were tested once during the menstrual phase (cycle Day 1–3; low levels of estradiol and progesterone), once during the follicular phase (cycle Day 9–11; high levels of estradiol, low levels of progesterone) and once during the luteal phase (cycle Day 21–23; high levels of estradiol and progesterone). Progesterone and estradiol levels were assessed from blood samples taken immediately after each experimental session to verify the cycle phase.
The mean age of the women was 26.83 years (SD = 4.98 years; range, 21–38 years). All women were consistent right‐handers according to the Edinburgh Handedness Index [Oldfield, 1971]; mean EHI = 92.2, range, 75–100) and had normal or corrected‐to‐normal vision. Women who had used hormonal contraceptives during the last six months were excluded.
Also, a control group of 14 right‐handed men was examined three times at time intervals of 14 days. All men had normal or corrected‐to‐normal vision; their age was 27.39 years (SD = 4.78 years; range, 24–39 years). All men were right‐handed according to the Edinburgh Handedness Index [Oldfield, 1971]; mean EHI = 88.8; range, 80–100).
All subjects were native speakers of German. Following approval by the Local Ethics Committee, all subjects gave their written informed consent according to the Declaration of Helsinki [1991]. Both female and male subjects were paid for their participation.
Procedure
Prior to the experimental sessions, female subjects were informed about the general procedure and data about their menstrual cycle were collected. The women agreed to inform us of the first day of their next cycle to plan the dates for the experimental sessions. Every normally cycling woman was tested three times, once during the menstrual phase (cycle Day 1–3), once during the follicular phase (cycle Day 9–11) and once during the luteal phase (cycle Day 21–23). Each woman was monitored for six consecutive cycles before entering the experiment. Careful consideration of each woman's individual cycle length allowed accurate planning of cycle‐phase specific testing. Women with short cycles were scheduled at the beginning of the time window for a specific cycle phase, while women with long cycles were scheduled at the end of the expected cycle phase. This was done to increase the probability of the test session to respond to the respective cycle phase.
Immediately after each session a blood sample was collected from female subjects. Progesterone and estradiol levels were assessed from the blood samples by electrochemiluminescence assay (ECLIA) to evaluate the menstrual cycle phases. If hormone levels indicated that test session did not correspond to the expected cycle phase, the experimental session was repeated during the next cycle. In order to balance the design for the normally cycling women, the order of testing was randomized across subjects.
Men were tested three times, with time intervals of 14 days. For statistical evaluation, the three testing sessions a posteriori were randomly assigned to experimental sessions 1–3 to avoid confounding effects of repeated measurements.
To minimize circadian rhythm influences, every experimental session was performed at the same time of the day.
Materials and Task
The experimental procedure was adapted from Hausmann and Güntürkün [Hausmann and Güntürkün, 1999]. A pool of 160 black irregular polygons was constructed using computer software (Paintshop), within a white frame. Some example stimuli are shown in Figure 1.
Figure 1.

Example Stimuli. Examples of the stimuli employed in the figure comparison task.
Stimuli were delivered using the Presentation (Version 10.1) software package (Neurobehavioral Systems, Inc., Albany, CA). In the MR scanner, participants viewed the stimuli via MRI compatible video goggles (VisuaStim XGA, Resonance Technology, Inc.). In each experimental trial the subjects fixated a cross in the centre of the monitor for a variable interstimulus interval (ISI), after which the first shape appeared in the centre of the screen for 185 ms. One second later either the same or a different shape (pseudo‐randomly alternated) was presented for 185 ms either to the left or to the right of the fixation cross while an empty frame appeared on the other side. The stimuli extended 4° in the horizontal dimension with the inner edge being placed 2.2° to the left or the right from the fixation cross. Subjects were instructed to fixate the center of the screen during the whole experiment and to indicate as quickly and as correctly as possible whether the laterally shown shape was identical to the first shape or not. Subjects responded with the index (same shape) and middle finger (different shape) of the left or right hand.
Before entering the scanner, subjects were instructed not to move their head and body during the whole experiment and to fixate the fixation cross in the centre of the screen. During fMRI scanning, subjects were presented with 20 blocks of eight trials each (two match trials in the left hemifield, two mismatch trials in the left hemifield, two match trials in the right hemifield and two mismatch trials in the right hemifield in a pseudorandomized order). The response hand was alternated across block, such that subjects responded with the left hand for half of the blocks and with the right hand for the other half of the blocks. Before each block, the words “left hand” or “right hand” were presented for 10 s to indicate which hand had to be used for responding in the respective block. The interval from the onset of the first stimulus of one trial to the first stimulus of the next trial was jittered between 3,970 ms and 4,870 ms, resulting in a mean ISI of 4,420 ms. Subjects were tested with parallel versions of the task, using the same stimuli, but in balanced order across the experimental sessions.
fMRI Data Acquisition
All scans were performed on a 3 Tesla MRI scanner (Gyroscan Intera, Philips Medical Systems, Best, The Netherlands) using standard gradients and a circular polarized phase array head coil.
For the experimental session of each subject, one series of 476 functional volumes of T2*‐weighted axial EPI‐scans including five initial dummy scans was acquired parallel to the AC/PC line with the following parameters: number of slices (NS): 31; slice thickness (ST): 3.5 mm; interslice gap (IG): 0.35 mm; matrix size (MS): 64 × 64; field of view (FOV): 240 × 240 mm; echo time (TE): 30 ms; repetition time (TR): 2 s; flip angle (FA): 90°. During one of the experimental sessions, for each participant an anatomical scan was acquired using a high‐resolution T1‐weighted 3D‐sequence (NS: 80; ST: 1 mm; IG: 1 mm; MS: 256 × 256; FOV: 256 × 256 mm; TE: 4.60 ms; TR: 9900 ms; FA 8°).
fMRI Data Analysis
MR images were analyzed using Statistical Parametric Mapping (SPM2; www.fil.ion.ucl.ac.uk) implemented in MATLAB 6.5 (Mathworks Inc., Sherborn, MA). After discarding the five dummy volumes, all images were realigned to the first image to correct for head movement. Unwarping was used to correct for the interaction of susceptibility artifacts and head movement. After realignment and unwarping, the signal measured in each slice was shifted in time relative to the acquisition time of the middle slice using a sinc interpolation to correct for their different acquisition times. Volumes were then normalized into standard stereotaxic anatomical MNI‐space by using the transformation matrix calculated from the first EPI‐scan of each subject and the EPI‐template. The default settings for normalization in SPM2 with 16 nonlinear iterations and the standard EPI template supplied with SPM2 were used. Afterwards, the normalized data with a resliced voxel size of 4 mm × 4 mm ×4 mm were smoothed with a 10 mm FWHM isotropic Gaussian kernel to accommodate intersubject variation in brain anatomy. The time series data were high‐pass filtered with a high‐pass cut‐off of 1/128 Hz. The first‐order autocorrelations of the data were estimated and corrected for.
Four conditions were considered in the analyses, resulting from presentation to the right versus the left visual field and reaction with the right versus left hand. Since we were not interested in the effect of response hand, left and right hand responses were averaged together in the analysis.
In a first step, for each of the cycle phases in women as well as for each repeated test in men, brain activation for left and right visual field presentation were compared. None of these comparisons showed any significant differences, suggesting that for presentation to both the left and right visual field the central task‐related activations are located in the right hemisphere.
These results corroborate the “callosal relay model” of hemispheric asymmetry [Hellige, 1993], where processing of lateralized tasks always takes place in the superior hemisphere, regardless of which visual field is stimulated. Thus, for the contrasts reported here, all items were pooled together and the main effect of all conditions versus baseline was considered as a measure of brain activation during figure comparison.
The expected hemodynamic response at stimulus onset was modeled by two response functions, a canonical hemodynamic response function (HRF; [Friston et al., 1998]) and its temporal derivative. The temporal derivative was included in the model to account for the residual variance resulting from small temporal differences in the onset of the hemodynamic response, which is not explained by the canonical HRF alone. The functions were convolved with the event‐train of stimulus onsets to create covariates in a general linear model. Subsequently, parameter estimates of the HRF regressor for each of the different conditions were calculated from the least mean squares fit of the model to the time series. Parameter estimates for the temporal derivative were not further considered in any contrast.
An SPM2 random‐effects group analysis was performed by entering parameter estimates for all subjects into an ANOVA model with cycle phase (test session) as a repeated measures factor. We employed an uncorrected significance level of P < 0.01 for differential effects, i.e. activation differences between cycle phases. Since the main effects of figure comparison as compared with baseline are expected to be more extensive then the differential effects, we used a slightly more conservative threshold of P < 0.005 for the main effects.
Changes in functional brain organization in connection with changes of hormone levels are quite small. Therefore, we decided to use a cluster correction with a higher sensitivity to small samples sizes in comparison to the cluster correction implemented in SPM. Correction for multiple comparisons to P < 0.05 was thus done using a cluster extent threshold procedure first described by Slotnick et al. [Slotnick et al., 2003; Slotnick and Schacter, 2004]. In comparison to the cluster correction implemented in SPM, this correction has the advantage of higher sensitivity to smaller effect sizes, while still correcting for multiple comparisons across the whole brain volume. We employed this method since it is sensitive enough to identify changes in functional brain organization in the female brain.
The cluster extend threshold procedure relies on the fact that the probability of observing increasingly large spatially contiguous clusters of activity decreases systematically given spurious activity or noise (voxel‐wise Type I error). Therefore, the cluster extent threshold can be enforced to ensure an acceptable level of corrected cluster‐wise Type I error.
To implement such an approach, we employed a MATLAB implementation of the simulation supplied by Slotnick (http://www2.bc.edu/_slotnics/scripts.htm) with 10,000 iterations. For each iteration the brain volume was modeled as a 64 × 64 × 31 matrix (representing 31 slices of 64 × 64 voxels each) with activity at each voxel modeled by assigning a normally distributed random number, with a mean of zero and a variance of 1. A voxel‐activity threshold was then applied to achieve the desired individual voxel type I error rate (P‐value). Then, the spatial extent of each cluster was computed and the number of clusters with the same spatial extent tallied. The total number of each cluster extent, across all iterations, was used to compute an overall probability of observing that cluster extent, relative to the total number of clusters. Using these probabilities, a cluster extent threshold was selected such that the total probability of observing all clusters of that extent threshold or larger was equal to the desired cluster‐wise type I error rate (i.e. the P‐value corrected for multiple comparisons [Slotnick and Schacter, 2004]).
For an individual voxel Type I error of P < 0.005, this procedure identified a cluster extent of 19 contiguous resampled voxels as necessary to correct for multiple voxel comparisons across the whole brain at P < 0.05. For an individual voxel type I error of P < 0.01, a cluster extent of 24 contiguous resampled voxels was indicated as necessary to correct for multiple voxel comparisons across the whole brain at P < 0.05.
The reported voxel coordinates of activation peaks were transformed from MNI space to Talairach and Tournoux atlas [Talairach and Tournoux, 1988] space by nonlinear transformations. The respective Matlab code can be found at http://imaging.mrc‐cbu.cam.ac.uk/downloads/MNI2tal/mni2tal.m. This was done to allow the use of the Talairach and Tournoux atlas [Talairach and Tournoux, 1988] to identify the anatomical brain regions for the activation peaks.
Psychophysiological Interaction Analysis
In order to investigate if there are comparable changes of inibitory influence between hemispheres as in our former study [Weis et al., 2008], we calculated a Psychophysiological interaction analysis (PPI; Friston et al., 1997]). We studied the change of functional connectivity with the right temporal activation cluster, which constitutes the central functional area for the figure comparison task (see imaging results). A seed region for the correlation was determined for each subject by selecting the individual activation maximum closest to the maximum of the right temporal group activation cluster in male and female subjects, which was located at Talairach and Tournoux coordinates [Talairach and Tournoux, 1988] x = 48, y = −55, z = −14 (right fusiform gyrus, Brodmann area [BA] 37). The seed region comprised a spherical region with a radius of 10 mm around this voxel. The psychological variable was determined by the time course of the experiment, such that correlations during the experimental trial as opposed to baseline were calculated. We identified those areas which showed a correlation with the seed region. Subsequently, differences in connectivity between cycle phases were identified using an ANOVA model on the second level. We report the PPI analyses at an uncorrected significance level of P < 0.01.
Same as for the functional activations, we employed a Monte‐Carlo simulation of the brain volume to establish an appropriate voxel contiguity threshold [Slotnick et al., 2003; Slotnick and Schacter, 2004]. As above, assuming an individual voxel Type I error of P < 0.01, a cluster extent of 24 contiguous resampled voxels was indicated as necessary to correct for multiple voxel comparisons across the whole brain at P < 0.05 (based on 10,000 simulations).
Again, the reported voxel coordinates of activation peaks were transformed from MNI space to Talairach and Tournoux atlas [Talairach and Tournoux, 1988] space by nonlinear transformations.
RESULTS
Hormone Assays
The mean cycle length of the women was 28.4 days (range, 26.4–31.0 days). The results of the hormone assays are given in Table I. The mean level of serum progesterone in our group of fourteen women was 0.63 (SEM = 0.08) ng/ml in the menstrual phase, 0.52 (SEM = 0.05) ng/ml in the follicular phase and 9.69 (SEM = 1.52) ng/ml in the luteal phase. The mean level of serum estradiol of the women was 36.55 (SEM = 4.02) pg/ml in the menstrual phase, 95.59 (SEM = 15.23) pg/ml in the follicular phase and 163.20 (SEM = 21.48) pg/ml in the luteal phase. An ANOVA revealed a significant effect of cycle phase both for progesterone (F (2,26) = 36.31, P < 0.001) and estradiol (F (2,26) = 22.76, P < 0.001). Post‐hoc paired t‐tests identified a difference in progesterone levels between the menstrual and luteal phase (t 13 = 5.96, P < 0.001) as well as between the follicular and the luteal phase (t 13 = 6.09, P < 0.001). No difference in progesterone levels was found between the menstrual and the follicular phase (t 13 = 2.12, n.s.). All cycle phases differed significantly in estradiol levels (menstrual vs. follicular phase: t 13 = 4.73, P < 0.001; menstrual vs. luteal phase: t 13 = 6.08, P < 0.001; follicular vs. luteal phase: t 13 = 3.12, P < 0.01).
Table I.
Hormone Assays
| Menstrual phase | Follicular phase | Luteal phase | |
|---|---|---|---|
| Progesterone (ng/ml) | |||
| Mean | 0.63 | 0.52 | 9.69 |
| (SEM) | 0.08 | 0.05 | 1.52 |
| Range | 0.13–1.09 | 0.13–0.88 | 1.88–20.25 |
| Expected range (5–95 percentile) | n.a. | 0.2–1.5 | 1.7–27 |
| Estradiol (pg/ml) | |||
| Mean | 36.55 | 95.59 | 163.20 |
| (SEM) | 4.02 | 15.23 | 21.48 |
| Range | 21.46–77.81 | 42.59–204.48 | 56.24–292.11 |
| Expected range (5–95 percentile) | n.a. | 12.5–166 | 43.8–211 |
Behavioral Data
Female subjects
The reaction times for the correct responses of the female group were subjected to a 2 × 3 ANOVA (Greenhouse‐Geisser) with factors visual hemifield (left, right) and cycle phase (menstrual, follicular, luteal). The analysis identified significant main effects of both visual hemifield (F (1,13) = 7.79, P < 0.02) and cycle phase (F (2,26) = 4.37, P < 0.04) as well as an interaction of visual hemifield and cycle phase (F (2,26) = 4.36, P < 0.03). Post‐hoc t‐tests identified a significant left visual field advantage during the menstrual (t 13 = 1.83, P < 0.05) and the follicular phase (t 13 = 3.84, P < 0.005), but not for the luteal phase (t 13 = 0.84, n.s.). The reaction times for the female subjects are given in Table II and shown in Figure 2.
Table II.
Behavioral Data of the Normally Cycling Women
| Menstrual phase | Follicular phase | Luteal phase | |
|---|---|---|---|
| RT | |||
| Left visual field | 736.2 ms | 682.6 ms | 672.0 ms |
| (SEM) | 33.9 ms | 19.3 ms | 27.4 ms |
| Right visual field | 745.4 ms | 700.2 ms | 667.1 ms |
| (SEM) | 32.6 ms | 19.9 ms | 24.6 ms |
| Correct responses (%) | |||
| Left visual field | 92.33 | 96.42 | 95.25 |
| (SEM) | 0.02 | 0.01 | 0.01 |
| Right visual field | 92.41 | 95.36 | 94.46 |
| (SEM) | 0.17 | 0.01 | 0.01 |
Reaction times and number of correct responses for items presented to the right and the left visual hemifield during the menstrual, follicular and luteal phase (SEM, standard error of the mean).
Figure 2.
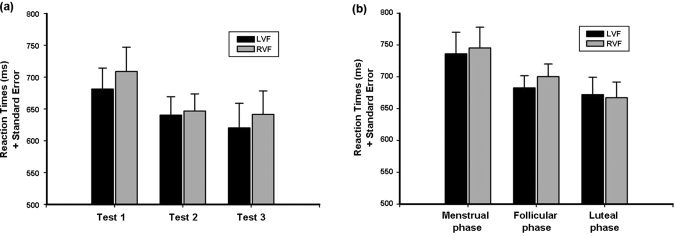
Reaction Times (RT) of the male and female group. Reaction Times (RT) and Standard Errors for the three tests in the male group (shown in (a)) and for the three cycle phases in the female group (shown in (b); LVF, left visual field; RVF, right visual field).
For the number of correct response, the 2 × 3 ANOVA (Greenhouse‐Geisser) with factors visual hemifield (left, right) and cycle phase (menstrual, follicular, luteal) identified no significant main effects (visual hemifield: F (1,13) = 1.74, n.s.; cycle phase: F (2,26) = 3.24, n.s.) and no interaction of visual hemifield and cycle phase (F (2,26) = 0.85, n.s.). The accuracy data for the female subjects are given in Table II.
Male subjects
The reaction time data of the male group were subjected to a 2 × 3 ANOVA (Greenhouse‐Geisser) with visual hemifield (left, right) and test session (Tests 1, 2, and 3) as repeated measures. As expected, the analysis identified a significant left visual field advantage (F (1,13) = 10.88, P < 0.01). Neither the effect of test session (F (2,26) = 1.42, n.s.) nor the interaction of visual hemifield and test session (F (2,26) = 0.64, n.s.) was significant, indicating a stable and significant left visual field advantage across three test sessions.
The reaction times for the male subjects are given in Table III and shown in Figure 2.
Table III.
Behavioral Data of the Male Group
| Test 1 | Test 2 | Test 3 | |
|---|---|---|---|
| RT | |||
| Left visual field | 669.75 ms | 653.78 ms | 618.38 ms |
| (SEM) | 36.59 ms | 35.67 ms | 28.99 ms |
| Right visual field | 687.59 ms | 678.33 ms | 631.19 ms |
| (SEM) | 40.11 ms | 35.67 ms | 27.04 ms |
| Correct responses | |||
| Left visual field | 88.83 | 94.81 | 96.40 |
| (SEM) | 0.06 | 0.02 | 0.01 |
| Right visual field | 88.75 | 94.01 | 90.96 |
| (SEM) | 0.06 | 0.02 | 0.01 |
Reaction times and number of correct responses for items presented to the right and the left visual hemifield during experimental session 1, experimental session 2, and experimental session 3 (SEM, standard error of the mean).
For the number of correct response, the 2 × 3 ANOVA (Greenhouse‐Geisser) with factors visual hemifield (left, right) and test session (Tests 1, 2, and 3) identified no significant main effects (visual hemifield: F (1,13) = 1.35, n.s.; test session: F (2,26) = 1.37, n.s.) and no interaction of visual hemifield and test session (F (2,26) = 0.21, n.s.). The accuracy data for the male subjects are given in Table III.
The behavioral data replicated results from previous behavioral studies in that reaction times are the more sensitive measure for the right hemisphere advantage and for changes of FCAs during the menstrual cycle [Hausmann et al., 2002].
Imaging Results
The central activations for figure comparison as compared to baseline were similar for the male and female group. In male subjects, activations during all three experimental sessions were restricted to the right hemisphere, which is in line with the behavioral results. The temporal activation comprised parts of the middle and inferior temporal gyri as well as the fusiform gyrus (BA 19, 37) while the parietal activation was located in the inferior and superior parietal lobules and the precuneus (BA 7, 40). However, the direct comparison of the left and right hemispheric activations in this network did not reveal any significant differences. No significant difference between any of the three experimental sessions was identified. The activations are shown projected onto a standard brain in Figure 3A and all maxima are reported in Table IV.
Figure 3.
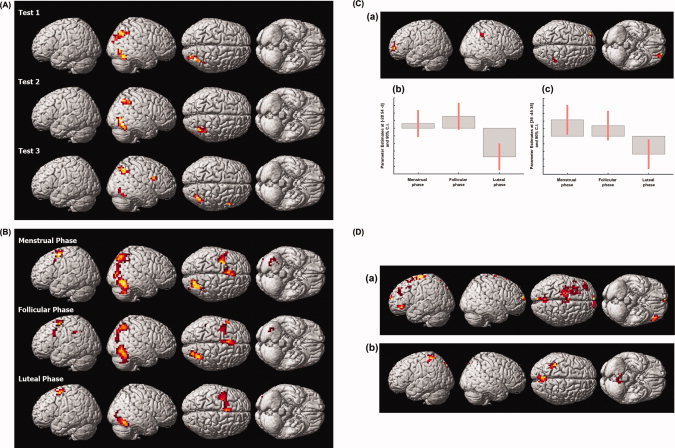
Functional activations and functional connectivity. A: Functional activations of the male group: Regions activated for figure comparison as compared to baseline during Tests 1, 2, and 3. The activation maps at P < 0.05, corrected for multiple comparisons, are shown overlaid onto a canonical brain rendered in three dimensions. B: Functional activations of the normally cycling women: Regions activated for figure comparison as compared to baseline during the menstrual phase, the follicular phase and the luteal phase. The activation maps at P < 0.05, corrected for multiple comparisons, are shown overlaid onto a canonical brain rendered in three dimensions. C: Activation differences between the menstrual and follicular as compared to the luteal phase in the normally cycling women with parameter estimates: Regions activated more for figure comparison during the menstrual and follicular phase as compared to the luteal phase. The activation map at P < 0.05, corrected for multiple comparisons, is shown overlaid onto a canonical brain rendered in three dimensions in (a). Parameter Estimates for the maximum of left frontal activation difference (MNI coordinates [−28 54 −3]; in (b)) and for the maximum of right parietal activation difference (MNI coordinates [36 −45 35]; in (c)) are shown in arbitrary units (a.u.). D: Difference in functional connectivity between phases: A seed region was defined in each female subject as a sphere around the individual local maximum located closest to the maximum of the right temporal activation cluster. Then a PPI analysis was used to identify those brain regions which show a significantly stronger connectivity with the seed region for figure comparison during the follicular as compared with the menstrual phase (a) and during the luteal as compared with the menstrual phase (b). The activation maps at P < 0.05, corrected for multiple comparisons, are shown overlaid onto a canonical brain rendered in three dimensions.
Table IV.
Functional Activations of the Male Subjects
| Effect | Anatomical Region | BA | Coordinates | Z‐value | No. voxels | ||
|---|---|---|---|---|---|---|---|
| x | y | Z | |||||
| Male subjects, experimental session 1: figure comparison > baseline, p < 0.05, corrected | |||||||
| Right middle temporal gyrus | 37 | 51 | −70 | −3 | 3.73 | 46 | |
| Right inferior parietal lobule | 40 | 36 | −60 | 40 | 3.64 | 84 | |
| Male subjects, experimental session 2: figure comparison > baseline, p < 0.05, corrected | |||||||
| Right middle temporal gyrus | 37 | 51 | −70 | 0 | 4.71 | 72 | |
| Right inferior parietal lobule | 40 | 40 | −48 | 43 | 3.44 | 64 | |
| Male subjects, experimental session 3: figure comparison > baseline, p < 0.05, corrected | |||||||
| Right middle temporal gyrus | 37 | 48 | −70 | 0 | 2.94 | 19 | |
| Right inferior parietal lobule | 40 | 36 | −60 | 44 | 3.59 | 62 | |
| Right inferior frontal gyrus | 9 | 48 | 13 | 21 | 3.34 | 19 | |
Activation peaks with their localization, significance level and the size of the respective activation cluster (number of voxels). Coordinates are listed in Talairach and Tournoux [1988] atlas space. BA is the Brodmann area nearest to the coordinate and should be considered approximate.
In the female group during the menstrual and the follicular phase, the activations where similar to the male group in that they also comprised right temporal and right parietal activation clusters, even though these clusters were somewhat more extensive than in the male group. The temporal activation was located in the right inferior and middle temporal gyrus as well as the fusiform gyrus and extended into the middle occipital gyrus (BA 19, 37). The parietal activation was located in the superior and inferior parietal lobule and the precuneus (BA 7, 19). For the follicular phase, additionally a small activation of the left inferior parietal lobule was found (BA 40). The direct comparison of left and right hemispheric activations revealed a significantly stronger activation in the right temporal cluster during the menstrual and follicular phase. During both phases, the maximum of the activation difference was located in fusiform gyrus (BA 37; menstrual phase: Z = 3.43, follicular phase: Z = 4.23).
During the luteal phase, however, activation in the female subjects was restricted to a right temporal activation located in the inferior and middle temporal gyri and the fusiform gyrus (BA 19, 37). The direct comparison between hemispheres did not approach significance during the luteal phase. Additionally, during all cycle phases, a cluster located in the left superior and middle frontal gyri (BA 6, 8) was activated. The activations are shown projected onto a standard brain in Figure 3B and all maxima are reported in Table V.
Table V.
Functional Activations of the Female Subjects
| Effect | Anatomical Region | BA | Coordinates | Z‐value | No. voxels | ||
|---|---|---|---|---|---|---|---|
| x | y | Z | |||||
| Female subjects, menstrual phase: figure comparison > baseline, p < 0.05, corrected | |||||||
| Right fusiform gyrus | 37 | 51 | −63 | −14 | 4.91 | 175 | |
| Right superior parietal lobule | 7 | 32 | −63 | 51 | 3.71 | 172 | |
| Left middle frontal gyrus | 6 | −36 | 3 | 62 | 4.22 | 89 | |
| Left superior frontal gyrus | 8 | −4 | 25 | 43 | 3.45 | 73 | |
| Female subjects, follicular phase: figure comparison > baseline, p < 0.05, corrected | |||||||
| Right fusiform gyrus | 37 | 48 | −63 | −14 | 4.61 | 146 | |
| Right superior parietal lobule | 7 | 32 | −60 | 51 | 4.35 | 126 | |
| Left middle frontal gyrus | 6 | −40 | 3 | 59 | 3.60 | 43 | |
| Left superior frontal gyrus | 8 | −4 | 18 | 51 | 3.60 | 83 | |
| Left middle frontal gyrus | 9 | −55 | 17 | 32 | 2.92 | 20 | |
| Left inferior parietal lobule | 40 | −44 | −33 | 35 | 3.01 | 24 | |
| Female subjects, luteal phase: figure comparison > baseline, p < 0.05, corrected | |||||||
| Right fusiform gyrus | 37 | 51 | −59 | −14 | 4.08 | 74 | |
| Left middle frontal gyrus | 6 | −40 | 7 | 59 | 3.82 | 108 | |
| Female subjects, menstrual + follicular > luteal phase: figure comparison > baseline, p < 0.05, corrected | |||||||
| Left superior frontal gyrus | 10 | −28 | 54 | −3 | 3.41 | 30 | |
| Right inferior parietal lobule | 40 | 36 | −45 | 35 | 2.70 | 77 | |
Activation peaks with their localization, significance level and the size of the respective activation cluster (number of voxels). Coordinates are listed in Talairach and Tournoux [ 1988] atlas space. BA is the Brodmann area nearest to the coordinate and should be considered approximate.
In accordance with previous findings [Hausmann and Güntürkün, 2000; Hausmann et al., 2002], the behavioral data identified an advantage of the right hemisphere during the menstrual and the follicular phase, i.e. during those cycle phases low in progesterone. During the luteal phase, however, the reaction time data showed no FCAs for the figure comparison tasks. Therefore, we compared brain activation during the luteal phase to the mean activation during the menstrual and the follicular phase. We found a significantly decreased activation during the luteal phase as compared to the other cycle phases in two brain regions: one was located in the left superior and middle frontal gyrus (BA 10) while the other was found in the right superior and inferior parietal lobules extending into the cingulate gyrus (BA 31, 40). The activations for this contrast, projected onto a standard brain, and the parameter estimates in the maxima of the differential activations are shown in Figure 3C.
No brain regions showed a significant increase of activation during the luteal as compared to either the menstrual or the follicular phase.
Results of the PPI Analysis
The PPI analysis was conducted to identify areas displaying a change of functional connectivity with the temporal brain region identified as a central activation for the figure comparison task both in women during all cycle phases and in men during three test sessions. The PPI analysis revealed significant differences in functional connectivity between the menstrual and the follicular and between the menstrual and the luteal phase respectively. Specifically, a stronger connectivity with the right temporal region during the follicular phase as compared to the menstrual phase was identified for brain regions mainly located in the left hemisphere. They comprised parts of the superior, inferior, middle, and medial frontal gyri (BA 8, 9, 10, 46, 47) as well as the precuneus and cuneus (BA 7). The activations of the superior and medial frontal gyrus (BA 10) as well as the precuneus (BA 7) also extended into homotopic areas of the right hemisphere.
For the luteal as compared with the menstrual phase, we identified a stronger functional connectivity of the right temporal area with bilateral parts of the precuneus (BA 7), which were more pronounced in the left hemisphere, with the left postcentral gyrus and with the left inferior parietal lobule (BA 7), as well as with bilateral parts of the cerebellum. The results of the PPI analysis are shown in Figure 3D and reported in Table VI.
Table VI.
PPI Analyses of the Female Subjects
| Effect | Anatomical Region | BA | Coordinates | Z‐value | No. voxels | ||
|---|---|---|---|---|---|---|---|
| x | y | Z | |||||
| Female subjects, PPI analysis (right temporal): follicular > menstrual phase: figure comparison > baseline, p < 0.05, corrected | |||||||
| Bilateral precuneus | 7 | 0 | −63 | 55 | 3.59 | 36 | |
| Bilateral superior frontal gyrus | 6 | 12 | 67 | 11 | 3.21 | 36 | |
| Left middle frontal gyrus | 47 | −44 | −42 | −9 | 3.17 | 27 | |
| Left middle frontal gyrus | 9 | −40 | 44 | 35 | 3.10 | 36 | |
| Left superior frontal gyrus | 6 | −24 | 23 | 62 | 3.04 | 148 | |
| Female subjects, PPI analysis (right temporal): luteal > menstrual phase: figure comparison > baseline, p < 0.05, corrected | |||||||
| Bilateral precuneus | 7 | 0 | −63 | 55 | 3.47 | 61 | |
| Left postcentral gyrus | 5 | −36 | −39 | 65 | 3.33 | 37 | |
| Bilateral cerebellum | −8 | −56 | −31 | 2.54 | 25 | ||
Activation peaks with their localization, significance level and the size of the respective activation cluster (number of voxels). Coordinates are listed in Talairach and Tournoux [ 1988] atlas space. BA is the Brodmann area nearest to the coordinate and should be considered approximate.
DISCUSSION
This study was conducted to investigate dynamic changes of functional brain organization across the menstrual cycle. We intended to supplement findings from a verbal task, which revealed cycle‐related changes in functional brain organization in young women during the menstrual cycle [Weis et al., 2008]. For that left hemisphere dominant task, a change of interhemispheric inhibition of the left hemisphere on the right hemisphere was identified in correlation with cycle‐related changes in estradiol levels. It remained open though, if the findings from the verbal task delineate a general mechanism of hormone mediated changes in functional brain organization, which might apply for right hemisphere dominant tasks as well.
Therefore, we now employed a figure comparison task, which has been used in several previous behavioral experiments and always revealed a robust left visual half‐field advantage reflecting a superiority of the right hemisphere for this task [Rode et al., 1995; Hausmann and Güntürkün, 1999; Hausmann et al., 2002]. Furthermore, the figure comparison task has been shown to be sensitive to hormonal fluctuations across the menstrual cycle [Rode et al., 1995; Hausmann et al., 2002].
A group of normally cycling women was scanned while performing the figure comparison task three times during the menstrual cycle: once during the menstrual (low levels of progesterone and estradiol), once during the follicular (low levels of progesterone, high levels of estradiol) and once during the luteal phase (high levels of progesterone and estradiol). Additionally, a male group was tested three times in two weeks intervals.
The reaction time data of both the male and the female group support the superiority of the right hemisphere for this task. While FCAs were stable across the three test sessions in men, an interaction of cycle phase and right hemisphere advantage was identified in women. During the menstrual and the follicular phase, cycle phases low in progesterone, a right hemisphere advantage was found. During the luteal phase, on the other hand, there was no significant difference between right hemisphere and left hemisphere reaction times.
The right hemisphere lateralization in the behavioral data of the spatial task is also evident in the functional imaging data of both male and female subjects. It is important to note, that the behavioral data and the imaging data focus on different aspects of lateralization and thus cannot be directly linked. While the behavioral data measures functional asymmetry by comparison of reaction times for presentation to the left and right visual field, asymmetry is represented in the functional imaging data through lateralization of the activation to the right hemispheres. Thus, both the behavioral data and the imaging data constitute measures of asymmetry which are highly correlated and both measures can be used to estimate changes of functional cerebral asymmetries.
Our data suggest that for presentation to both the left and right visual field, the central task‐related activations are located in the right hemisphere.
In men, brain activation during figure comparison as opposed to baseline was exclusively localized in the right hemisphere and remained stable across all three testing sessions. It is important to note that the reliability of the results from both the behavioral as well as the imaging data in the male group across three testing sessions support the adequacy of this task for studying changes of functional lateralization in women during the menstrual cycle, thus corroborating the results of Hausmann et al. [ 2002]. A PPI analysis (data not shown) of the male control group identified small changes in connectivity between repeated tests, which were located in the cerebellum and parietal lobe of the right hemisphere. In contrast to the female group, in men these small changes in connectivity do not result in changes of functional activations or behavior and thus do not seem to influence FCAs. Moreover, they are located within the right hemisphere network identified for figure comparisons. No changes in connectivity between contralateral regions, which might account for changes in hemispheric dominance, could be identified in the males.
Also in women, activations were more pronounced in the right hemisphere and the functional imaging data correspond with the behavioral data. During the low progesterone cycle phases, when a right hemisphere advantage is found in the behavioral data, the right hemisphere network involved with figure comparison is extended in comparison to the activations found during the high progesterone luteal phase.
When comparing activations between the low progesterone cycle phases to the luteal phase, additional clusters of activation were identified in the right parietal and the left frontal lobe during the low progesterone phases. The parameter estimates (Fig. 3C) show that the activation differences are mainly caused by a deactivation in left frontal and right parietal lobes during the luteal phase.
In a meta‐analysis of imaging experiments on word production, the left superior frontal gyrus has been shown to be activated during both word production and word generation [Indefrey and Levelt, 2004]. Thus, it might be conceivable that women during the low progesterone cycle phases tend to solve the figure comparison task not only by spatial but also by verbal strategies, perhaps by verbally labeling the geometric objects. Similar differences in strategies between men and women have been suggested for mental rotation tasks, proposing that women tend to prefer less efficient verbal or analytical strategies [Pezaris and Casey, 1991; Schultz, 1991]. While males seem to process 3D stimuli mainly as visual gestalts, using right hemisphere object recognition and rotation functions, females may use more (left) frontal lobe areas in a “serial” reasoning strategy when solving the task [Thomsen et al., 2000]. The behavioral data during the low progesterone cycle phases, however, reveal that this strategy might be less efficient since left hemisphere response times are significantly longer than response times during presentation of the stimuli to the right hemisphere.
During the luteal phase, however, the left frontal deactivation might indicate a strategy change with release from verbalization which seemingly increases left hemisphere performance for the figure comparison task. This rather speculative hypothesis might explain the loss of the right hemisphere advantage for the spatial task during the luteal phase.
Furthermore, the PPI analysis identified a stronger connectivity between the right temporal seed region and the left inferior parietal lobule during the luteal as compared with the menstrual phase. The stronger connectivity between these two regions does not only further improve overall performance (see reaction times in Table II), but also results in an abolition of the right hemisphere advantage found during the low progesterone cycle phases. This finding might be explained by an improvement of left hemisphere processing when perceptual processing of the shapes in the right temporal lobe and spatial processing in the left parietal lobe are better coordinated.
The finding of an increased coactivation of the hemispheres (which equals a reduction of interhemispheric inhibition) during the luteal phase has been found before [Weis et al., 2008]. As opposed to those data, the coactivation now involves heterotopic areas of both hemispheres.
On the other hand, stronger connectivity between the right temporal lobe and areas of the left frontal lobe during the follicular as compared with the menstrual phase does not abolish the right hemisphere advantage, but does result in better overall performance for both hemispheres, as reflected by shorter reaction times (Table II).
The second activation cluster, which differentiated between the menstrual and follicular as opposed to the luteal phase, was located in the right parietal lobe. The right parietal lobe, especially the right superior parietal lobule and the right precuneus has repeatedly been shown to be involved with (spatial) attention [Johannsen et al., 1997; Sturm et al., 1999, 2004a, b]. Thus, the significantly weaker parietal lobe activation during the luteal phase might indicate a reduction of attention to the left visual hemifield, which results in a reduction of right hemisphere advantage.
It has been shown before that attentional processes fluctuate during the menstrual cycle. In accordance with our data, a study using a line‐bisection task [Hausmann, 2005] identified a reduction of hemispheric asymmetry in spatial attention in relation with high levels of estradiol. Similarly, low gonadal steroid levels have been shown to restrict the attentional blink to the left hemisphere, while high levels of estradiol and progesterone in the midluteal phase appeared to reduce functional asymmetries by selectively increasing the attentional blink in the right hemisphere [Hollander et al., 2005].
Furthermore, the superior part of the parietal lobule constitutes part of the dorsal pathway of the visual processing system [Ungerleider and Mishkin, 1982] (BA 7) and has been shown to be involved in encoding of visual stimuli [Cohen et al., 1996] or object recognition in space [Colby et al., 1995]. Furthermore it is known that the parietal lobules seem to be specifically involved in processing of spatial relations [Heilman, 1995; Michel et al., 1994]. Less activity in the right parietal lobe during the luteal phase might thus go along with a diminished spatial coding for visual stimuli presented to the right hemisphere and might thus reduce the right hemisphere advantage.
In women, the release from a less efficient verbal strategy during the luteal phase seems to be related to a reduction of FCAs. This indicates, that women are less lateralized when their overall performance is better, whereas it has been suggested that in males, more pronounced lateralization is linked to more efficient strategies. This is in line with recent findings indicating that the relationship between degree of asymmetry and cognitive performance is task‐specific and, even more importantly, it can differ between men and women and thus the relationship between overall performance and the degree of asymmetry cannot easily be transferred from men to women in the menstrual phase when sex hormone levels are relatively low [Hirnstein et al., 2010].
In recent studies [Weiss et al., 2003; Jordan et al., 2002], women and men showed different cortical activation patterns during mental rotation tasks: it was found that males had increased activation in the inferior parietal lobule compared to females, while females showed increased activations in frontal lobe and fusiform areas.
These findings fit well with our data showing that, same as in men, the right temporal region remains activated in women during all cycle phases, indicating that perceptual processing of “what” information in the temporal lobe is not largely hormonally affected, while other processes, which are located in the parietal lobe change across the menstrual cycle. These results suggest that sex differences are rather found for spatial tasks with a higher level of cognitive processing than for purely perceptual tasks.
Our data show that hormones influence the functional organization of the female brain by changing functional connectivity and activated networks in the course of the menstrual cycle. Clearly, hormonal influences are not the only factor influencing functional brain organization. Experience and learning, for example, certainly play an important role in shaping cognitive strategies. A variety of studies has shown that practice on a task affects the functional anatomy underlying performance by increases, decreases and functional reorganization of regional activations (see [Kelly and Garavan, 2005] for a review). These studies document profound changes in functional anatomy occurring as a result of practice on tasks. Thus, we cannot fully rule out that sex hormone‐related changes in functional brain organization are especially sensitive in novel problem solving tasks, such as the figure comparison task of this study. Whether this task is similarly sensitive to fluctuation in sex hormones in experienced participants remains an open question. However, practice effects in this study are unlikely since women in the different cycle phases were examined in a counterbalanced order.
In summary, this study showed cycle phase‐related changes in lateralized brain activation within the task‐dominant hemisphere. Moreover, this study supports the idea that it is the functional connectivity between cortical modules that changes between cycle‐phases. However, these changes in functional brain organization in women during the menstrual cycle are not only restricted to hormone‐related changes of interhemispheric inhibition between homotopic areas, as has been proposed earlier [Hausmann and Güntürkün, 2000; Weis et al., 2008] but might additionally apply to changes of neuronal processes within the hemispheres which seem to be modulated by heterotopic functional connectivity between hemispheres.
Acknowledgements
The authors thank the Functional Imaging Unit of the Interdisciplinary Centre for Clinical Research at the University Hospital Aachen, Germany, especially Georg Eder, for technical assistance during data acquisition, and Prof. J. Neulen (Clinic of Gynecologic Endocrinology and Reproductive Medicine, University Hospital Aachen, Germany) for assistance with blood sample analysis.
REFERENCES
- Bayer U, Hausmann M ( 2009): Estrogen therapy affects right hemisphere functioning in postmenopausal women. Horm Behav 55: 228–234. [DOI] [PubMed] [Google Scholar]
- Beaumont JG ( 1982): Studies with verbal stimuli In: Beaumont JG, editor. Divided Visual Field Studies of Cerebral Organization. London: Academic Press; pp 58–86. [Google Scholar]
- Bibawi D, Cherry B, Hellige JB ( 1995): Fluctuations of perceptual asymmetry across time in women and men: Effects related to the menstrual cycle. Neuropsychologia 33: 131–138. [DOI] [PubMed] [Google Scholar]
- Bryden MP, Hecaen H, DeAgostini M ( 1983): Patterns of cerebral organization. Brain Lang 20: 249–262. [DOI] [PubMed] [Google Scholar]
- Chiarello C, Maxfield L ( 1996): Varieties of interhemispheric inhibition, or how to keep a good hemisphere down. Brain Cogn 30: 81–108. [DOI] [PubMed] [Google Scholar]
- Cohen MS, Kosslyn SM, Breiter HC, DiGirolamo GJ, Thompson WL, Anderson AK, Brookheimer SY, Rosen BR, Belliveau JW ( 1996): Changes in cortical activity during mental rotation. A mapping study using functional MRI. Brain 119: 89–100. [DOI] [PubMed] [Google Scholar]
- Colby CL, Duhamel JR, Goldberg ME ( 1995): Oculocentric spatial representation in parietal cortex. Cereb Cortex 5: 470–481. [DOI] [PubMed] [Google Scholar]
- Cook ND ( 1984): Callosal inhibition: The key to the brain code. Behav Sci 29: 98–110. [DOI] [PubMed] [Google Scholar]
- Dietrich T, Krings T, Neulen J, Willmes K, Erberich S, Thron A, Sturm W ( 2001): Effects of blood estrogen level on cortical activation patterns during cognitive activation as measured by functional MRI. Neuroimage 13: 425–432. [DOI] [PubMed] [Google Scholar]
- Fernandez G, Weis S, Stoffel‐Wagner B, Tendolkar I, Reuber M, Beyenburg S, Klaver P, Fell J, De GA, Ruhlmann J, Reul J, Elger CE ( 2003): Menstrual cycle‐dependent neural plasticity in the adult human brain is hormone, task, and region specific. J Neurosci 23: 3790–3795. [DOI] [PMC free article] [PubMed] [Google Scholar]
- Friston KJ, Buechel C, Fink GR, Morris J, Rolls E, Dolan RJ ( 1997): Psychophysiological and modulatory interactions in neuroimaging. Neuroimage 6: 218–229. [DOI] [PubMed] [Google Scholar]
- Friston KJ, Fletcher P, Josephs O, Holmes A, Rugg MD, Turner R ( 1998): Event‐related fMRI: Characterizing differential responses. Neuroimage 7: 30–40. [DOI] [PubMed] [Google Scholar]
- Hampson E ( 1990): Variations in sex‐related cognitive abilities across the menstrual cycle. Brain Cogn 14: 26–43. [DOI] [PubMed] [Google Scholar]
- Harris IM, Egan GF, Sonkkila C, Tochon‐Danguy HJ, Paxinos G, Watson JD ( 2000): Selective right parietal lobe activation during mental rotation: A parametric PET study. Brain 123: 65–73. [DOI] [PubMed] [Google Scholar]
- Hausmann M ( 2005): Hemispheric asymmetry in spatial attention across the menstrual cycle. Neuropsychologia 43: 1559–1567. [DOI] [PubMed] [Google Scholar]
- Hausmann M, Bayer U ( 2010): Sex hormonal effects on hemispheric asymmetry and interhemispheric interaction In: Hugdahl K, Westerhausen R, editors. The Two Halves of the Brain: Information Processing in the Cerebral Hemispheres. Cambridge (MA): MIT Press, p. 287–312. [Google Scholar]
- Hausmann M, Güntürkün O ( 1999): Sex differences in functional cerebral asymmetries in a repeated measures design. Brain Cogn 41: 263–275. [DOI] [PubMed] [Google Scholar]
- Hausmann M, Güntürkün O ( 2000): Steroid fluctuations modify functional cerebral asymmetries: The hypothesis of progesterone‐mediated interhemispheric decoupling. Neuropsychologia 38: 1374. [DOI] [PubMed] [Google Scholar]
- Hausmann M, Behrendt‐Korbitz S, Kautz H, Lamm C, Radelt F, Güntürkün O ( 1998): Sex differences in oral asymmetries during wordrepetition. Neuropsychologia 36: 1397–1402. [DOI] [PubMed] [Google Scholar]
- Hausmann M, Becker C, Gather U, Güntürkün O ( 2002): Functional cerebral asymmetries during the menstrual cycle: A cross‐sectional and longitudinal analysis. Neuropsychologia 40: 808–816. [DOI] [PubMed] [Google Scholar]
- Hellige JB (1993): Hemispheric Asymmetry: What's Right and What's Left. Cambridge (MA): Harvard University Press. [Google Scholar]
- Heilman KM ( 1995): Attentional asymmetries In: Davidson RJ, Hugdahl K, editors. Brain Asymmetry. Cambridge (MA): MIT Press. [Google Scholar]
- Hirnstein M, Leask S, Rose J, Hausmann M ( 2010): Disentangling the relationship between hemispheric asymmetry and cognitive performance. Brain Cogn 73: 119–127. [DOI] [PubMed] [Google Scholar]
- Hollander A, Hausmann M, Hamm JP, Corballis MC ( 2005): Sex hormonal modulation of hemispheric asymmetries in the attentional blink. J Int Neuropsychol Soc 11: 263–272. [DOI] [PubMed] [Google Scholar]
- Indefrey P, Levelt WJ ( 2004): The spatial and temporal signatures of word production components. Cognition 92: 101–144. [DOI] [PubMed] [Google Scholar]
- Johannsen P, Jakobsen J, Bruhn P, Hansen SB, Gee A, Stodkilde‐Jorgensen H, Gjedde A ( 1997): Cortical sites of sustained and divided attention in normal elderly humans. Neuroimage 6: 145–155. [DOI] [PubMed] [Google Scholar]
- Jordan K, Heinze HJ, Lutz K, Kanowski M, Jancke L ( 2001): Cortical activations during the mental rotation of different visual objects. Neuroimage 13: 143–152. [DOI] [PubMed] [Google Scholar]
- Jordan K, Wustenberg T, Heinze HJ, Peters M, Jancke L ( 2002): Women and men exhibit different cortical activation patterns during mental rotation tasks. Neuropsychologia 40: 2397–2408. [DOI] [PubMed] [Google Scholar]
- Kansaku K, Kitazawa S ( 2001): Imaging studies on sex differences in the lateralization of language. Neurosci Res 41: 333–337. [DOI] [PubMed] [Google Scholar]
- Kelly AM, Garavan H ( 2005): Human functional neuroimaging of brain changes associated with practice. Cereb Cortex 15: 1089–1102. [DOI] [PubMed] [Google Scholar]
- McGlone J ( 1980): Sex differences in human brain asymmetry: A critical survey. Behav Brain Sci 3: 215–263. [Google Scholar]
- McKeever WF, Seitz KS, Krutsch AJ, Van Eys PL ( 1995): On language laterality in normal dextrals and sinistrals: Results from the bilateral object naming latency task. Neuropsychologia 33: 1627–1635. [DOI] [PubMed] [Google Scholar]
- Michel CM, Kaufman L, Williamson SJ ( 1994): Duration of EEG and MEG suppression increases with angle in a mental rotation task. J Cogn Neurosci 6: 150. [DOI] [PubMed] [Google Scholar]
- Oldfield RC ( 1971): The assessment and analysis of handedness: The Edinburgh inventory. Neuropsychologia 9: 97–113. [DOI] [PubMed] [Google Scholar]
- Pezaris E, Casey MB ( 1991): Girls who use “masculine” problem‐solving strategies on a spatial task: Proposed genetic and environmental factors. Brain Cogn 17: 1–22. [DOI] [PubMed] [Google Scholar]
- Rode C, Wagner M, Güntürkün O ( 1995): Menstrual cycle affects functional cerebral asymmetries. Neuropsychologia 33: 855–865. [DOI] [PubMed] [Google Scholar]
- Schultz K ( 1991): The contribution of solution strategy to spatial performance. Can J Psych 45: 474–491. [Google Scholar]
- Shaywitz BA, Shaywitz SE, Pugh KR, Constable RT, Skudlarski P, Fulbright RK, Bronen RA, Fletcher JM, Shankweiler DP, Katz L ( 1995): Sex differences in the functional organization of the brain for language. Nature 373: 607–609. [DOI] [PubMed] [Google Scholar]
- Slotnick SD, Schacter DL ( 2004): A sensory signature that distinguishes true from false memories. Nat Neurosci 7: 664–672. [DOI] [PubMed] [Google Scholar]
- Slotnick SD, Moo LR, Segal JB, Hart J Jr. ( 2003): Distinct prefrontal cortex activity associated with item memory and source memory for visual shapes. Brain Res Cogn Brain Res 17: 75–82. [DOI] [PubMed] [Google Scholar]
- Sommer IE, Aleman A, Bouma A, Kahn RS ( 2004): Do women really have more bilateral language representation than men? A meta‐analysis of functional imaging studies. Brain 127: 1845–1852. [DOI] [PubMed] [Google Scholar]
- Sturm W, de SA, Krause BJ, Specht K, Hesselmann V, Radermacher I, Herzog H, Tellmann L, Muller‐Gartner HW, Willmes K ( 1999): Functional anatomy of intrinsic alertness: Evidence for a fronto‐parietal‐thalamic‐brainstem network in the right hemisphere. Neuropsychologia 37: 797–805. [DOI] [PubMed] [Google Scholar]
- Sturm W, Longoni F, Fimm B, Dietrich T, Weis S, Kemna S, Herzog H, Willmes K ( 2004a): Network for auditory intrinsic alertness: A PET study. Neuropsychologia 42: 563–568. [DOI] [PubMed] [Google Scholar]
- Sturm W, Longoni F, Weis S, Specht K, Herzog H, Vohn R, Thimm M, Willmes K ( 2004b): Functional reorganisation in patients with right hemisphere stroke after training of alertness: A longitudinal PET and fMRI study in eight cases. Neuropsychologia 42: 434–450. [DOI] [PubMed] [Google Scholar]
- Talairach J, Tournoux P. 1988. Co‐Planar Stereotaxic Atlas of the Human Brain. Stuttgart, Germany: Thieme. [Google Scholar]
- Thomsen T, Hugdahl K, Ersland L, Barndon R, Lundervold A, Smievoll AI, Roscher BE, Sundberg H ( 2000): Functional magnetic resonance imaging (fMRI) study of sex differences in a mental rotation task. Med Sci Monit 6: 1186–1196. [PubMed] [Google Scholar]
- Ungerleider LG, Mishkin M ( 1982): Two cortical visual systems In: Ingle DJ, Goodale MA, Mansfield RJW, editors. Analysis of Visual Behavior. Cambridge (MA): MIT Press; pp 549–586. [Google Scholar]
- Vogel JJ, Bowers CA, Vogel DS ( 2003): Cerebral lateralization of spatial abilities: A meta‐analysis. Brain Cogn 52: 197–204. [DOI] [PubMed] [Google Scholar]
- Weis S, Hausmann M, Stoffers B, Vohn R, Kellermann T, Sturm W ( 2008): Estradiol modulates functional brain organization during the menstrual cycle: An analysis of interhemispheric inhibition. J Neurosci 28: 13401–13410. [DOI] [PMC free article] [PubMed] [Google Scholar]
- Weiss E, Siedentopf CM, Hofer A, Deisenhammer EA, Hoptman MJ, Kremser C, Golaszewski S, Felber S, Fleischhacker WW, Delazer M ( 2003): Sex differences in brain activation pattern during a visuospatial cognitive task: A functional magnetic resonance imaging study in healthy volunteers. Neurosci Lett 344: 169–172. [DOI] [PubMed] [Google Scholar]