

Abstract
The relationship between head motion and diffusion values such as fractional anisotropy (FA) and mean diffusivity (MD) is currently not well understood. Simulation studies suggest that head motion may introduce either a positive or negative bias, but this has not been quantified in clinical studies. Moreover, alternative measures for removing bias as result of head motion, such as the removal of problematic gradients, has been suggested but not carefully evaluated. The current study examined the impact of head motion on FA and MD across three common pipelines (tract‐based spatial statistics, voxelwise, and region of interest analyses) and determined the impact of removing diffusion weighted images. Our findings from a large cohort of healthy controls indicate that while head motion was associated with a positive bias for both FA and MD, the effect was greater for MD. The positive bias was observed across all three analysis pipelines and was present following established protocols for data processing, suggesting that current techniques (i.e., correction of both image and gradient table) for removing motion bias are likely insufficient. However, the removal of images with gross artifacts did not fundamentally change the relationship between motion and DTI scalar values. In addition, Monte Carlo simulations suggested that the random removal of images increases the bias and reduces the precision of both FA and MD. Finally, we provide an example of how head motion can be quantified across different neuropsychiatric populations, which should be implemented as part of any diffusion tensor imaging quality assurance protocol. Hum Brain Mapp, 2012. © 2011 Wiley Periodicals, Inc.
Keywords: mild TBI, DTI, diffusion tensor imaging, gradient sampling schemes, motion, simulations
INTRODUCTION
The use of diffusion tensor imaging (DTI) to investigate white matter integrity in various neuropsychiatric populations has exploded over the past decade [White et al.,2008]. In conditions such as traumatic brain injury [Bazarian et al.,2007; Kraus et al.,2007; Wilde et al.,2008], schizophrenia [Ardekani et al., in press], substance abuse [Yeh et al.,2009], multiple sclerosis [Roosendaal et al.,2009], and affective disorders [Sexton et al.,2009], differences in DTI measurements are typically attributed to white matter pathology in the diagnostic group. However, the quality of DTI data obtained from neuropsychiatric populations may be inherently different from healthy controls (HC) secondary to confounds such as patient motion [Aksoy et al.,2008]. In functional magnetic resonance imaging (FMRI) studies, head motion has been demonstrated to reduce inter‐ and intrasubject reliability [Lund et al.,2005] and increase signal variance [Bullmore et al.,1996,1999; Friston et al.,1996; Hajnal et al.,1994]. In comparison, analogous studies on the impact of head motion in DTI research are relatively sparse despite the fact that groupwise differences in head motion are just as likely to occur as a result of lengthy DTI acquisition times [Aksoy et al.,2008; Andersson and Skare,2002; Rohde et al.,2004; Tijssen et al.,2009].
Water molecules tend to diffuse more anisotropically in white matter compared with both gray matter and cerebral spinal fluid. This diffusion is dependent on the number and integrity of axonal tracts bundled together along similar pathways, the density and integrity of the myelin, and the amount of overall fluid in intra‐ and extracellular space [Beaulieu,2002; Le Bihan,2003]. Although the validity of DTI scalar metrics has recently been questioned [Wheeler‐Kingshott and Cercignani,2009], fractional anisotropy (FA) and mean diffusivity (MD) are increasingly being used as an in vivo measurement of white and grey matter pathology in clinical populations [White et al.,2008].
The physical displacement of parenchymal matter secondary to head motion during scanning influences diffusion measurements including unwanted phase terms and changes in the direction of diffusion [Aksoy et al.,2008; Leemans and Jones,2009; Tijssen et al.,2009]. Simulations have indicated that both trace and FA can be significantly biased by even a relatively small percentage of outliers [Chang et al.,2005]. In both echo‐planar and spiral DTI imaging, small or moderate motion has been shown to increase FA during phantom experiments with simulated motion [Aksoy et al.,2008]. FA bias appears to increase in a complex fashion based on the amount of motion and may affect microstructures differently dependent on fiber orientation [Leemans and Jones,2009]. In in vivo models, FA has been shown to be greatly reduced in white matter when subjects are asked to purposely move their heads [Aksoy et al.,2008]. In regions with low anisotropy, head motion induces a positive bias in FA, which becomes negative for regions with higher anisotropy [Tijssen et al.,2009]. FA also interacts with signal‐to‐noise ratio (SNR), exhibiting a positive bias in regions of low SNR and either a positive or negative bias in regions of high SNR [Landman et al.,2007,2008]. Finally, there is a near linear increase in the uncertainty (standard deviation) of both FA and MD as a result of increased motion [Tijssen et al.,2009].
Head motion in DTI research can be addressed prospectively by fixing head position (e.g., padding) as well as retrospectively by using registration schemes to correct for image distortions secondary to eddy currents and/or patient motion [Rohde et al.,2004; Tijssen et al.,2009]. As the effects of head motion and eddy currents are simultaneously estimated and corrected, differentiating their effects using retrospective algorithms alone is difficult. In the detection phase, an image of interest (i.e., to‐be‐corrected image) is compared with a reference image using either 6 (rigid body) or 12 (affine) parameters [Horsfield,1999]. The reference image typically corresponds to a b = 0 s/mm2 image acquired at the start of the experiment given the higher signal to noise and decreased susceptibility to distortion compared with diffusion weighted (DW) images [Rohde et al.,2004]. An iterative optimization algorithm is then implemented to determine a transformation matrix that minimizes/maximizes the cost function (usually mutual information), followed by interpolation to the new grid. Finally, in single shot echo‐planar imaging data the rotational component of the transformation matrix is typically applied to the gradient table to account for changes in image orientation relative to the original scanner gradient prescription before tensor calculation [Farrell et al.,2007; Landman et al.,2007; Leemans and Jones,2009; Rohde et al.,2004]. Failing to implement retrospective head motion algorithms has been shown to dramatically increase the variability of FA and MD measurements [Tijssen et al.,2009]. However, it is currently unknown how the presence of motion interacts with tract‐based spatial statistics [TBSS; [Smith et al.,2006]], voxelwise, or region of interest (ROI) analyses, the three primary means of comparing DTI data across clinical populations.
Head motion also alters the measurement of diffusion properties [Norris,2001]. Specifically, rigid‐body motion introduces a linear phase shift across the tissue, corresponding to a displacement of the echo in k‐space [Storey et al.,2007]. If the echo displacement is large enough, it results in dramatic signal‐loss artifacts (Fig. 1). These signal‐loss artifacts are exacerbated during partial k‐space sampling [Storey et al.,2007] and are not correctable with standard retrospective algorithms. Such artifacts may warrant the complete removal of the DW images before tensor calculations to decrease the likelihood of bias. Previous data suggest that at least 20 unique sampling directions are needed to estimate FA in a rotational‐invariant manner whereas 30 directions may be required for tensor orientation and MD [Jones,2004]. Although fewer unique sampling directions may increase bias of scalar measurements [Landman et al.,2007], the effects of randomly removing DW images on resultant scalar calculations from a predetermined gradient scheme have not been well characterized in human data [Chang et al.,2005].
Figure 1.
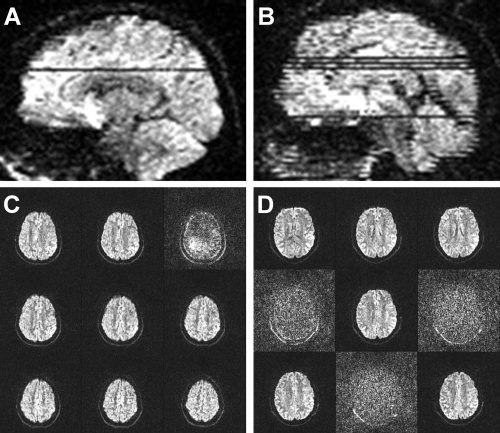
Examples of gross artifacts present in diffusion weighted (DW) images. A depicts a DW image with a single slice with signal loss whereas B depicts a DW image with multiple affected slices. C and D represent nine sequential 2 mm axial slices from an area corresponding to the artifacts displayed in A and B.
The primary aim of the current study was therefore to perform a systematic investigation on the residual effects of head motion on the two scalar values most typically reported in DTI studies (FA and MD) across three different analysis pipelines (TBSS, voxelwise, and ROI). Specifically, we examined whether estimates of motion obtained from retrospective correction algorithms would be associated with the measured magnitude of DTI scalar values in a relatively large sample of healthy controls. We also examined the effects of removing gradient files on the calculation of scalar values as a potential corrective measure, as well as the effects of randomly removing DW images through Monte Carlo simulations with human data. Finally, DTI studies typically do not quantify the differing degrees of head motion that may occur between neuropsychiatric populations and matched controls as has been done in the FMRI literature [Bullmore et al.,1999; Mayer et al.,2007; Yoo et al.,2005]. The current article therefore introduces methods for calculating estimates of head motion in DTI data that can be used as part of a quality assurance protocol, and provides an example of how this can be applied to clinical DTI studies.
METHODS
Participants
Fifty‐two (26 females; 23.73 ± 5.21 years old) healthy controls (HC) and 21 patients with mild traumatic brain injury (mTBI: 13 females; 27.86 ± 7.32 years old) participated in the study. Clinical results and group comparisons on DTI scalar values have been previously reported [Mayer et al.,2010]. Estimates of intelligence were obtained from all subjects and converted to T scores (range from 33 to 77). Three HC exhibited extreme head motion [greater than three standard deviations; see Eqs. (1) and (2)] and were subsequently eliminated from the first part of the study. The study protocols were approved by the Institutional Review Board at the University of New Mexico and all participants provided written informed consent before enrollment.
MR Imaging
All images were collected on a 3 Tesla Siemens Trio scanner. Foam padding and paper tape were used to restrict motion within the scanner. High resolution T1‐weighted anatomic images were acquired with a 5‐echo multiecho MPRAGE sequence [TE = 1.64, 3.5, 5.36, 7.22, 9.08 ms, TR = 2.53 s, TI = 1.2 s, 7° flip angle, NEX = 1, slice thickness = 1 mm, FOV = 256 × 256 mm, voxel resolution = 1 × 1 x 1 mm3]. T1 images were subsequently segmented into gray matter, white matter and cerebral spinal fluid with FSL's FAST (v4.1) algorithm using default parameters [Smith et al.,2004; Zhang et al.,2001]. Two diffusion tensor imaging scans (b = 800 s/mm2) were acquired using a twice‐refocused spin echo sequence with 30 diffusion gradients and the b = 0 experiment repeated five times [72 interleaved slices; TE = 84 ms; TR = 9 s; 90○ flip angle; NEX = 1; slice thickness = 2.0 mm; FOV = 256 × 256 mm; matrix size = 128 × 128; voxel resolution = 2 × 2 x 2 mm3]. A twice‐refocused spin echo sequence was chosen to reduce the effects of eddy currents secondary to gradient switching, to reduce artifacts associated with head movement and to allow increased time for diffusion sensitizing gradients. GRAPPA (2× acceleration and 32 reference lines) was used to reduce susceptibility‐induced image distortions. The gradient directions were selected based on previously published guidelines [Jones et al.,2002a; Skare et al.,2000]. However, the order in which the gradient directions were administered was changed (see Appendix for gradient table) to minimize the effects of subject motion [Cook et al.,2007]. Specifically, we applied five sets of gradients, with each set containing a single b = 0 s/mm2 followed by six b = 800 s/mm2 directions. The six b = 800 s/mm2 directions were chosen so that they were uniformly distributed over the sphere [Cook et al.,2007; Jones et al.,2002b; Skare et al.,2000].
Image Processing and Statistical Analyses
The AFNI software package [Cox,1996] was used to process and analyze the two DTI datasets by first concatenating the raw DTI data and gradient tables from the two runs. Image distortions caused by eddy currents and head motion were next corrected by registering all DW images to the first b = 0 s/mm2 image using a 12 degree‐of‐freedom (DOF) affine correction with mutual information as the cost function. For each DW image, the vector corresponding to the rotation component was then extracted from the resultant transformation matrix and applied to the corresponding gradient from the gradient table. Diffusion tensors and scalar measures were calculated from the resulting images. A nonlinear method was adopted for tensor calculations to decrease tensor estimate errors caused by noise, especially in regions of high anisotropy [Cox and Glen,2006].
Calculation of Motion Indices
Two indices were calculated to assess head‐motion based on previously established methodologies in the FMRI literature [Mayer et al.,2007]. First, the average of the total motion [Eq. (1)] across both DTI runs was calculated for each of the 12 motion parameters by individually summing the absolute displacement estimates for each image n compared with the first b = 0 s/mm2 image across the total number of images N:
| (1) |
where P corresponds to the motion parameter and d is the displacement estimate for each parameter at each image. Based on the algorithm used in the current study, 12 different P estimates were generated corresponding to the rotation, translation, scaling, and shear parameters from the affine transformation.
Second, an index corresponding to relative motion [Eq. (2)] was calculated by averaging the absolute displacement estimate difference between adjacent images:
| (2) |
This index reduces the likelihood of a few large motions biasing the outcome of the motion estimates.
For both estimates of motion, subsequent analyses focused on the P estimates corresponding to translations and rotations around the three principal axes (Fig. 2), which are more likely to be a result of subject head motion compared with stretches and shears.
Figure 2.
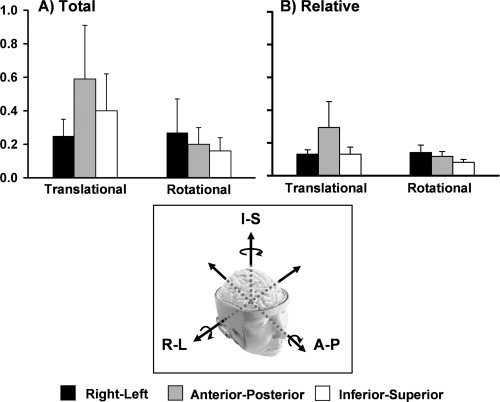
A quantitative representation of both total (A) and relative (B) motion across all healthy control subjects. For both indices, translational and rotational motion are stratified according to whether motion occurred in the right‐left (R‐L, black bars), anterior‐posterior (A‐P, grey bars), or inferior‐superior (I‐S, white bars) directions. Units for the graphs are represented in millimeters for translational motion and degrees for rotational motion. Error bars represent one standard deviation.
Effects of Motion on Group Analyses
In the first set of analyses (HC only), rotational and translational motion estimates were used as independent variables to predict the magnitude of the two most commonly used DTI scalars (FA and MD). Age [Grieve et al.,2007] and estimated intelligence quotient [Grieve et al.,2007; Schmithorst et al.,2005] were used as covariates for all analyses given the established relationship that exists between these variables and DTI scalar measurements. Two different voxelwise analyses of the resulting scalar maps were carried out using TBSS [Smith et al.,2006] and a more traditional voxelwise DTI analysis similar to previous work [Van et al.,2009]. For the TBSS analysis, all subjects' FA data were aligned into a common space (FMRIB58) using the nonlinear registration tool FNIRT from the FSL package. Next, FA images were thinned to create a mean scalar skeleton that represents the centers of all tracts common to the group. Each subject's aligned FA was then projected onto this skeleton. The subject‐specific transformation matrix (native FA to skeleton space) was then applied to MD so that it was in an identical skeleton space.
For the second voxelwise analysis, scalar images (FA and MD) were first registered to the subject's T1 anatomic image using an affine transformation with 12 degrees of freedom and Local Pearson Correlation as the cost function [Saad et al.,2009]. This transformation matrix was then multiplied by the matrix corresponding to T1 stereotaxic normalization, such that each participant's FA map was normalized to Talairach space. Individual FA maps were then averaged to form a study‐specific FA template, which was then blurred with a 6‐mm root mean square Gaussian kernel [Marenco et al.,2006; Tijssen et al.,2009]. Individual subject FA maps were then registered to the study‐specific template using an affine 12 DOF transformation with mutual information as the cost function. The TBSS and more traditional voxelwise analysis pipelines were corrected for false positives at P < 0.05 using cluster‐based statistics [Smith and Nichols,2009]. To reduce the overall number of comparisons, analyses were restricted to voxels where the group template FA was over 0.20.
Region of interest analyses were also conducted given the prevalence of this approach in clinical DTI research. Each subject's skull‐stripped T1 image was segmented to create a white matter mask. The Johns Hopkins (JHU) white matter atlas [Mori and van Zijl,2007] was transformed to the subject's T1 image to facilitate the selection of ROI. The intersection between each subject's white matter mask and the JHU atlas was then used to eliminate partial voluming effects (i.e., nonwhite matter) and generate the final ROI. Finally, the mean scalar was calculated for each ROI and used as the dependent measure for the motion analyses. Similar to our previous work [Mayer et al.,2010], ROI analyses were performed for the genu, splenium, and body of the corpus callosum, as well as the superior longitudinal fasciculus (SLF), the corona radiata (CR), the superior corona radiata (SCR), the uncinate fasciculus (UF), and the internal capsule (IC) for both the right and left hemispheres.
Effects of Eliminating Individual Image Gradients
Two raters (A.P. and F.M.) manually inspected subject data for all HC and mTBI patients (n = 73) to identify images that were associated with artifacts. Images that contained subject motion, single (Fig. 1A,C) or multiple (Fig. 1B,D) slice‐wise signal drop‐outs, or both subject motion and signal‐loss artifacts were identified as having artifacts with a binary rating system (i.e., 0 = no artifact; 1 = artifact). Both raters assessed a subset of the data (50 sets) to obtain estimates of inter‐rater reliability.
A secondary aim of the study was to examine the impact of removing problematic gradients (identified through manual inspection) from the analyses. Specifically, DW images identified as containing artifact (signal‐loss or gross motion) were removed from the dataset and the corresponding motion parameters (for each DW image) were removed from motion estimates. Finally, the associated vector was removed from the gradient table and the diffusion tensor recalculated following the previously outlined steps. The TBSS analysis was then repeated for the data with the gradients removed and contrasted against the results obtained when all gradients remained in the data.
However, removing DW images also likely affects the calculation of DTI scalar values [Chang et al.,2005; Jones,2004], which may become problematic in clinical studies if significantly more DW images need to be removed for one specific group (i.e., differences in the angular resolution across groups). Therefore, the next series of analyses used realistic Monte Carlo simulations to examine the impact of randomly removing an increasing number of DW images (and associated gradients from the table) on a subject‐level (voxelwise) analysis. As the main purpose of this analysis was to determine the impact of removing gradients rather than removing problematic gradients, data from three HC subjects with low total motion estimates and no identified artifacts in their gradient images (manual inspection) were selected. DW images were randomly removed from the first DTI run in multiples of three images up to twenty‐one (i.e., 3, 6, 9, … 21) for each subject. This random process was repeated 30 times at each multiple to determine scalar stability on both a voxelwise basis and across a subject‐specific white matter mask (based on segmentation results).
Contrast of Motion Estimates Across Clinical Groups
The final aim of the study was to examine metrics for quantifying differences in head motion in neuropsychiatric DTI studies as part of a quality assurance protocol. Therefore, 21 patients with mTBI and 21 matched HC were contrasted both in terms of motion estimates (total and relative) as well as the number of images identified with artifacts through manual inspection.
RESULTS
Motion Estimates
Two repeated‐measures ANOVAs were first performed to assess whether relative translational or rotational motion was greater around the three different principal Cartesian axes (Fig. 2). Results from the analyses examining total translational motion (Fig. 2A) in the healthy cohort indicated a significant main effect of axis (F (2,96) = 33.9, P < 0.001), with follow‐up t‐tests demonstrating that motion was greater in the A‐P direction compared with both the R‐L (t 48 = 7.9, P < 0.001) and I‐S (t 48 = 4.0, P < 0.001) directions, with I‐S shifts also greater than R‐L (t 48 = 4.7, P < 0.001) shifts. The main effect from total rotational motion was also significant (F (2,96) = 10.7, P < 0.001), with rotational motion being greater around the R‐L axis compared with both the A‐P (t 48 = 2.7, P < 0.01) and I‐S (t 48 = 3.9, P < 0.001) axes, and greater around the A‐P compared with I‐S (t 48 = 2.3, P < 0.05) axis.
The results for relative motion were similar (Fig. 2B), with a significant main effect for translational shifts (F (2,96) = 59.8, P < 0.001). Follow‐up t‐tests indicated that motion was greater in the A‐P direction compared with both the R‐L (t 48 = 7.8, P < 0.001) and I‐S (t 48 = 7.9, P < 0.001) directions, with no significant difference between R‐L and I‐S (P > 0.10). The main effect for rotational motion was also significant (F (2,96) = 43.3, P < 0.001), with greater rotation around the R‐L axis compared with both the A‐P (t 48 = 3.0, P < 0.005) and I‐S (t 48 = 9.4, P < 0.001) axes, as well as greater around the A‐P compared with I‐S (t 48 = 7.2, P < 0.001) axis.
Relationship between Motion Estimates and DTI measures
TBSS analyses
Table I presents a basic summary of the main motion results across all three analysis pipelines. Results from the TBSS analyses indicated that head motion was significantly associated with both FA and MD values following Threshold‐Free Cluster Enhancement (TFCE) correction for multiple comparisons (Smith and Nichols,2009]. In the current report, we focus on clusters with a volume greater than 20 μl (2.5 native voxels).
Table 1.
A basic summary of the results examining the effects of motion on DTI scalars
| FA | MD | |||
|---|---|---|---|---|
| TBSS | Total | Translation | Positive Bias | Positive bias |
| Rotation | — | — | ||
| Relative | Translation | — | Positive bias | |
| Rotation | — | — | ||
| Voxelwise | Total | Translation | — | Positive bias |
| Rotation | — | — | ||
| Relative | Translation | — | — | |
| Rotation | — | — | ||
| ROI | Total | Translation | — | Positive bias |
| Rotation | — | — | ||
| Relative | Translation | — | Positive bias | |
| Rotation | — | — | ||
Increased total translational motion along the A‐P axis was associated with increased FA within the right SCR, right posterior limb of IC, right fornix, right posterior limb of IC, right retrolenticular IC, right external capsule (EC), right cerebral peduncle, and right sagittal stratum across all subjects (Fig. 3A). For the analyses examining rotational motion, neither the total nor relative rotation around any axis significantly predicted FA.
Figure 3.
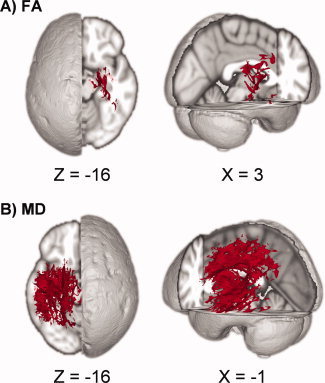
Results from the tract‐based spatial statistics (TBSS) analyses depicting the voxels that exhibited a significant association between motion and DTI scalar values. Data are presented for the analyses involving both fractional anisotropy (FA; A) and mean diffusivity (MD; B) as the dependent measure. Across both analyses, subjects with higher translational motion along the anterior‐posterior axis exhibited higher values of either FA or MD.
The degree of total translational motion along the A‐P axis was positively associated with increased MD within the left posterior CR, left SCR, body of the corpus callosum, splenium of the corpus callosum, left SLF, left posterior limb of IC, left retrolenticular IC, left EC, left cingulum, left sagittal stratum, left cerebral peduncle, and left fornix (Fig. 3B). Similarly, increased relative translational motion in the A‐P axis was associated with increased MD in the left posterior limb of IC, left retrolenticular IC, left EC, left SLF, anterior thalamic radiation, and left fornix. Neither the total nor relative degree of rotational motion significantly predicted MD.
Next we examined the amount of variation predicted by the overall model (R 2) for voxels (FA = 2,422 voxels; MD = 22,679 voxels) identified in the total motion analyses and masked by the respective TBSS skeleton masks. Results indicated that subject motion parameters and associated covariates (age and pre‐morbid IQ) predicted an average of 22.9% of variance for FA (standard deviation = 7.0%; range = 8.8%–54.9%) and an average of 20.7% of variance for MD (standard deviation = 8.1%; range = 4.2%–62.4%) in voxels showing a significant relationship with motion parameters.
Voxelwise analyses
Analyses were also conducted to determine if relative or total motion estimates predicted voxelwise FA or MD following non‐TBSS registration and spatial normalization. TFCE was again used to correct all results for multiple comparisons [Smith and Nichols,2009]. The FA analyses did not result in any statistically significant associations for either total or relative motion estimates. However, the degree of total translational motion along the A‐P axis was again positively associated with MD (Supp. Info., Fig. 1) for clusters within the right posterior CR, right SLF, right EC, right posterior thalamic radiation, right retrolenticular part of the IC, and right anterior thalamic radiation. Relative motion analyses did not result in significant findings for MD.
ROI analyses
MANCOVAs were conducted to determine if translational or rotational motion predicted FA or MD for selected ROI in the corpus callosum, or selected ROI from the right and left hemispheres [see [Mayer et al.,2010] for ROI details) for both total and relative motion metrics using age and estimates of premorbid intelligence as a covariate. A Bonferroni correction was applied to all data to reduce the likelihood of false positives. Results for the MANCOVAs on FA indicated that there were not significant effects for either the total or relative motion parameters following correction for multiple comparisons. In contrast, total motion along the A‐P axis was positively associated with MD for right hemisphere ROI (F (5,39) = 7.4, P < 0.001). For the relative motion indices, shifts in the A‐P axis predicted MD for both left (F (5,39) = 6.1, P < 0.001) and right (F (5,39) = 9.3, P < 0.001) hemisphere ROI. Rotational motion did not result in significant findings for MD.
Relationship Between Motion Artifacts and Fiber Directions
We also examined if translational motion effects along the A‐P axis from the TBSS analysis biased scalar estimates for fibers in certain orientations [Leemans and Jones,2009]. First, the principal eigenvector for each voxel was classified for general direction (R‐L, A‐P or I‐S) by taking the maximum vector component (x, y, or z). Next, the data were masked using significant voxels from TBSS analyses for which A‐P motion predicted FA (Fig. 3A) or MD (Fig. 3B). The total number of significant voxels for each fiber orientation was then summed, normalizing by the total voxels from the skeletal mask for each orientation (i.e., A‐P significant voxels/A‐P total voxels in skeleton). Repeated‐measures ANOVAs with the three directions as a factor were then conducted for both the FA and MD data. Results for FA (Fig. 4A) indicated a significant main effect for direction (F (2,96) = 6094.3, P < 0.001), with a higher percentage of I‐S voxels being affected compared with both R‐L (t 48 = 89.8, P < 0.001) or A‐P (t 48 = 85.2, P < 0.001) voxels. A‐P voxels were also more significantly affected than R‐L voxels (t 48 = 17.1, P < 0.001). A similar effect of axis was also observed for MD (F (2,96) = 108.3, P < 0.001; Fig. 4B), with a higher percentage of I‐S voxels being affected compared with both R‐L (t 48 = 21.2, P < 0.001) and A‐P (t 48 = 6.8, P < 0.001) voxels. An increased percentage of A‐P compared with R‐L voxels were also affected (t 48 = 6.3, P < 0.001) in the MD analyses.
Figure 4.
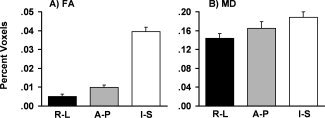
A depiction of how motion in the A‐P axis affected fibers oriented in the right‐left (R‐L, black bars), anterior‐posterior (A‐P, grey bars), or inferior‐superior (I‐S, white bars) direction during the tract‐based spatial statistics analyses. A represents a percentage of significant voxels from the fractional anisotropy analyses (FA) and B represents the voxels from the mean diffusivity (MD) analysis. Error bars represent one standard deviation.
Manual Identification and Removal of Images With Artifacts
Two raters (A.P. and F.M.) manually inspected subject data to identify images that were associated with artifacts. The inter‐rater reliability was moderate for the identification of artifacts ([kappa] coefficient = 0.62), which may have resulted from the relatively small percentage of images for which gross artifacts were present across all 73 subjects (signal‐loss artifacts only = 0.2%; gross motion = 1.4%; motion and signal‐loss = 0.1%).
We then reexamined the relationship between motion estimates and DTI scalar values following the removal of DW images with gross artifacts (identified through manual inspection) and their associated vectors from the gradient table before tensor calculation in the context of the TBSS framework. A direct comparison of the two methods (corrected for multiple comparisons at P < 0.05) indicated that there were few differences between the maps regardless of whether manually identified problematic gradients were discarded (Supp. Info., Fig. 2). Specifically, motion along the A‐P axis still accounted for significant variance in both MD and FA in the TBSS analysis for the majority of voxels regardless of whether gradients were removed or not.
Effects of Random DW Image Removal
Figure 5 presents the effects of randomly removing an increasing number of gradients on two subjects' data (multiples of 3 with 30 repetitions at each multiple) on both a voxelwise and ROI (white matter voxels only) level (see Supp. Info., Fig. 3 for third subject). The voxelwise images demonstrate that the precision of MD and FA calculations across the 30 repetitions decreased as a function of the number of randomly removed gradients. In addition, the mean FA (i.e., bias) for white matter voxels increased for all subjects (Fig. 5 and Supp. Info., Fig. 3A) as a function of randomly removing gradients, although the rate of change was relatively modest (less than 0.01) when up to nine gradients were removed. White matter MD increased for two of the three subjects as a function of gradient removal but remained relatively stable for Subject 2 until 18 of the gradients were randomly removed.
Figure 5.
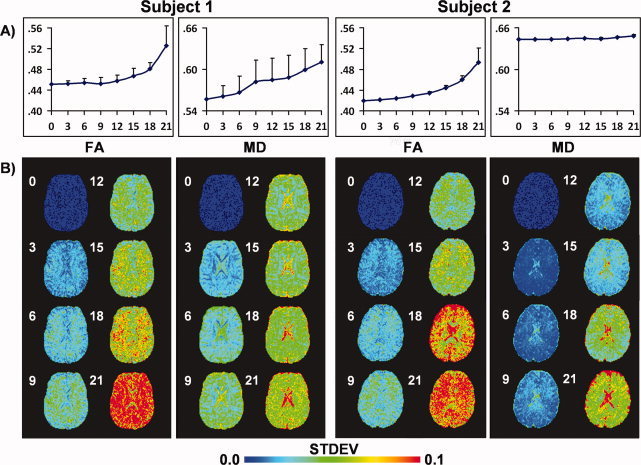
Effects of randomly removing diffusion weighted (DW) images on both fractional anisotropy (FA) and mean diffusivity (MD) across two different subjects (please see Supp. Info., Fig. 3 for third subject). DW images were randomly selected and removed in multiples of 3 (e.g., three DW images, six DW images, etc.) before the calculation of the diffusion tensor, with each step being repeated 30 times. A presents results of a histogram analysis for all white matter voxels. The circles correspond to the mean scalar value and the error bars represent one standard deviation derived from all 30 iterations. The number of gradients removed is indicated along the x‐axis. For both subjects, a positive bias existed in the FA data associated with increasing the number of gradients removed. A positive bias was also present for two of three subjects for MD (see Supp. Info., Fig. 4), with Subject 2 exhibiting a relatively stable mean. B presents the variation in scalar values on a voxelwise basis following the random removal of gradients. For all subjects, voxelwise precision in the calculation of DTI scalar metrics decreased as a function of randomly removing DW images.
Clinical Imaging, Quality Assurance
Four separate MANCOVAs were performed to determine if patients with mTBI exhibited either greater translational or rotational motion for the relative or total motion index. Clinical and group DTI comparisons from this sample have been previously reported [Mayer et al.,2010]. Results (Table II) indicated that the multivariate effect of group was not significant for either total or relative motion, nor were any of the univariate tests significant (P > 0.10). Effect sizes across all six parameters were small (Cohen's d range = 0.03–0.33, suggesting that the null finding was not secondary to power issues.
Table II.
Summary of motion estimates for the three groups of subjects
| Group | Total translational | Total rotational | ||||
|---|---|---|---|---|---|---|
| R‐L | A‐P | I‐S | R‐L | A‐P | I‐S | |
| All healthy controls (N = 49) | 0.25 ± 0.10 | 0.59 ± 0.32 | 0.40 ± 0.22 | 0.27 ± 0.20 | 0.20 ± 0.10 | 0.16 ± 0.08 |
| mTBI patients | 0.33 ± 0.18 | 0.73 ± 0.39 | 0.37 ± 0.22 | 0.28 ± 0.21 | 0.22 ± 0.12 | 0.16 ± 0.09 |
| Matched healthy controls | 0.25 ± 0.10 | 0.62 ± 0.24 | 0.36 ± 0.20 | 0.29 ± 0.19 | 0.19 ± 0.09 | 0.16 ± 0.05 |
| Relative translational | Relative rotational | |||||
| All healthy controls (N = 49) | 0.13 ± 0.03 | 0.30 ± 0.16 | 0.13 ± 0.04 | 0.14 ± 0.04 | 0.12 ± 0.03 | 0.08 ± 0.02 |
| mTBI patients | 0.18 ± 0.15 | 0.37 ± 0.23 | 0.15 ± 0.05 | 0.15 ± 0.04 | 0.13 ± 0.04 | 0.09 ± 0.02 |
| Matched healthy controls | 0.13 ± 0.02 | 0.33 ± 0.15 | 0.14 ± 0.03 | 0.14 ± 0.04 | 0.12 ± 0.04 | 0.09 ± 0.02 |
Finally, the number of artifacts identified through manual inspection was not statistically different across the two groups (P > 0.10) using a non‐parametric two sample test.
DISCUSSION
Although head motion is readily acknowledged as a major confound in FMRI, the effects of head motion on the calculation of DTI scalars remain poorly understood. Previous studies have focused on the implications of not registering DW images [Tijssen et al.,2009] or failing to correct the gradient table [Leemans and Jones,2009; Rohde et al.,2004]. The current study expands on previous work [Tijssen et al.,2009] by exploring the relationship between motion and DTI scalars across three different analytic frameworks. Ultimately, we focused on the residual effects of head motion on DTI scalar data following all recommended corrections (i.e., appropriate image registration and adjusting the gradient table) and the effects of removing DW images. Our primary conclusions suggest that head motion results in a positive bias for the calculation of both FA and MD, but that the bias is more pronounced in MD. Importantly, the potentially confounding effects of head motion are still present following standard methods for DTI data correction. The removal of grossly affected DW images did not correct for this bias in a subset of subjects, and Monte Carlo simulations indicated that gradient removal may further introduce a positive bias into scalar calculations when a significant number of DW images are removed.
Consistent with previous FMRI [Mayer et al.,2007; Yoo et al.,2005] and DTI [Leemans and Jones,2009] studies, rotational head motion was greatest around the R‐L axis, second largest around the A‐P axis, and the least around the I‐S axis in a large sample of healthy controls. Translational head motion was greatest along the A‐P axis, followed by the I‐S and R‐L axes, which was also similar to FMRI results [Mayer et al.,2007; Yoo et al.,2005]. The degree of rotational and translational motion across the axes was consistent regardless of whether data were summed across all images (i.e., total motion index) or calculated as a function of movement from one image to the next (i.e., relative motion index). Collectively the data suggest that similar types of head motion are likely to be observed regardless of data acquisition (DTI versus FMRI). While this finding was not unexpected, it suggests that head motion can have a significant impact on DTI data as has been previously demonstrated with other echo‐planar imaging techniques [Bullmore et al.,1996,1999; Friston et al.,1996; Hajnal et al.,1994].
Previous DTI studies suggested a positive bias between head motion and FA, with a near linear increase in the standard deviation of both FA and MD as a result of increased motion [Tijssen et al.,2009]. Current results replicate this finding, as a positive relationship between translational motion along the A‐P axis and magnitude of FA was present for the TBSS analysis. In addition, translational motion along the A‐P axis was positively correlated with the magnitude of MD across all three analysis pipelines (TBSS, voxelwise and ROI) and to a much greater extent (Fig. 3). Head motion may increase the magnitude of one (i.e., principal, second, or third) or more eigenvalues, all of which would increase MD in the absence of a decrease in magnitude for the remaining eigenvalues. In contrast, a positive bias in FA would have to result from a more complex interaction of an increase in the principal eigenvalue or reductions in the second/third eigenvalues. This may explain why bias appeared to be greater for MD compared with FA across all three pipelines. Importantly, a significant amount of variance for both FA (TBSS average = 22.9% of variance) and MD (TBSS average = 20.7% of variance) could be explained with a few motion parameters and covariates (age and pre‐morbid estimates of intelligence) suggesting that the effect of motion on DTI scalars may not be trivial in affected voxels.
Previous studies examining head motion have primarily focused on rotational rather than translational parameters [Leemans and Jones,2009]. In the current study, neither translational nor rotational motion parameters for the R‐L or I‐S axes predicted DTI scalar values. In contrast, increased translational motion along the A‐P axis was associated with increased MD and FA. The amount and variability of head motion across subjects was greatest along the A‐P axis (Fig. 2), suggesting that decreased subject variability may have been a contributing factor to the negative results for the other five motion parameters. In addition, per convention the current experiment adjusted the gradient tables for rotational motion, which may have corrected for additional bias in the DTI data resulting from rotational motion [Leemans and Jones,2009; Rohde et al.,2004].
Head motion also appeared to affect tracts differently dependent on the principal orientation of fibers [Leemans and Jones,2009]. Specifically, in the TBSS analyses motion affected more fibers running in the I‐S direction for both FA and MD calculations following correction for total number of fibers. Fibers running in orthogonal directions (I‐S and R‐L) to the primary axis of motion (A‐P) may experience more signal loss and partial voluming effects. However, A‐P voxels were more affected than R‐L voxels in both the FA and MD analyses. Therefore, the effects of motion on fiber orientation require further validation through additional modeling and simulation studies [Leemans and Jones,2009].
Although the residual effects of head motion on DTI scalars were similar across all analyses (i.e. increased motion resulted in higher MD), the tracts that were affected were not consistent. For example, the TBSS analysis indicated increased MD in left hemisphere tracts, the voxelwise analyses showed increased MD in right hemisphere tracts, and ROI analyses suggested increased MD in both right and left hemisphere tracts following motion. As intimated by previous work [Zollei et al.,2010], this could be a result of the different registration techniques that were used to analyze the data across TBSS [nonlinear transformation based on spatially distinct skeletal regions of high FA; [Smith et al.,2006]], voxelwise [affine transformation based on broader areas of the group FA template; [Van et al.,2009]] and ROI [inverse of the affine transformation to standard Talairach space; [Mayer et al.,2010]] analyses.
It is notable that the positive bias for head motion was present even after data were corrected based on established methodologies (e.g., 12 DOF affine correction and rotation of the gradient table). Large amounts of motion during data acquisition also result in significant signal‐loss artifacts [Storey et al.,2007] that are readily identifiable through visual inspection (Fig. 1). Therefore, a second aim of the study was to examine whether removing gradients that were identified as having motion or signal‐loss artifacts would reduce or eliminate the positive bias observed in DTI scalar data. For this analysis we focused on MD data using the TBSS pipeline as this method should be less sensitive to registration errors and partial voluming effects [Smith et al.,2006]. However, the positive bias associated with head motion continued to be present in the data even when problematic gradients with gross motion were completely removed (see Supp. Info., Fig. 2) and diffusion tensors recalculated. Similar results have been noted in the FMRI literature [Bullmore et al.,1996,1999; Friston et al.,1996; Hajnal et al.,1994], suggesting that head motion may also influence the measurement of diffusion by altering the signal‐to‐noise ratio, changing phase loss due to spin displacement, changing the specified versus realized gradient scheme, and increasing partial voluming effects [Landman et al.,2007,2008].
Previous work has indicated that positive bias is more prevalent in acquisitions that include a low number of gradients [Landman et al.,2007; Tijssen et al.,2009] and that a minimum of 20 to 30 gradients are needed to reliably estimate DTI scalars [Jones,2004]. However, the effect of removing gradients on DTI scalar values as a possible corrective strategy for head motion has only been briefly explored, and mostly to correct for cardiac pulsation artifacts [Chang et al.,2005]. Therefore, data from three HC that did not contain any gross artifacts (visual inspection) and whose estimates of motion (ranking of parameters) were very low compared with the rest of the cohort were selected for realistic Monte Carlo simulations. The random removal of gradients resulted in both a positive bias in the calculation of white matter FA and a decrease in precision (higher standard deviation) across all three subjects. Results for MD were more variable, although the magnitude and standard deviation of MD increased in a similar fashion for two of the three subjects as a function of gradient removal. The changes in bias and precision appeared to be relatively small if only a few DW images were removed, but increased rapidly following the removal of a significant number (i.e., 12 out of 30 in the current experiment) of DW images (Fig. 5). Importantly, the percentage of artifactual DW images that can be tolerated will be dependent on the number of DW images collected and optimization of the gradient scheme [Chang et al.,2005], such that the number of gradients that can be safely excluded will need to be independently determined for each experiment.
Collectively, these findings suggest that great care must be exercised when removing gradients to correct for gross artifacts that arise from head motion or other problems with data acquisition. The removal of DW images introduces a bias that could potentially obscure or accentuate true differences in underlying white matter pathology across clinical groups when scalars are statistically compared. Importantly, this would be exacerbated if a different number of gradients were removed as a result of artifacts across the comparison groups, which would be expected if one of the groups moved more during data acquisition. A more prudent strategy may therefore be to completely discard and reacquire the data from any participant who exhibits a large number of artifacts on DW images when possible.
To this end, the current study also provides a quality assurance protocol for assessing whether differences in head motion are observable across clinical populations. Current results indicated no differences between a group of mTBI patients and HC on estimates of head motion or the number of gradients that were deemed to contain artifacts through manual inspection. Additionally, the effect sizes for between‐group differences in head motion were small, suggesting that current null effects were not the result of a lack of statistical power. Collectively, these findings suggest that differing degrees of head motion did not likely contribute to differences in DTI scalars that were recently reported across the two groups [Mayer et al.,2010]. However, these conclusions are specific to the current clinical sample. Differences in sample characteristics (i.e., chronicity of injury, presence of acute pain) as well as the neuropsychiatric population being studied (patients with schizophrenia vs. mTBI) are both likely to influence the degree of head motion. Therefore, standardized quality assurance protocols need to be implemented on a routine basis to ensure that differences in subject motion do not confound DTI scalar measurements during neuropsychiatric imaging studies.
The current study had several limitations. Although adequate measures were taken to correct for false positives within each pipeline (e.g., Bonferonni correction in ROI analyses, cluster‐based correction in TBSS, and voxelwise analyses), it is possible that some false positives were present in the current data given that we evaluated three separate pipelines on the same data. However, the primary aim of the current study was to identify how head motion may influence DTI scalar values across a variety of analysis pipelines. As such, current results need to be replicated in an independent sample. Second, the metrics proposed for estimating the degree of head motion based on retrospective motion correction algorithms are limited. These algorithms do not correct for all motion artifacts (i.e., the true motion is often underestimated) and confound eddy current correction and motion correction. In addition, the current experiment did not perform cardiac gating such that results are also likely influenced by cardiac pulsation artifacts [Chang et al.,2005].
Third, the inter‐rater reliability for the manual identification of artifacts in the DTI data was only moderate, indicating the need for the development and verification of automated pipelines that are capable of detecting problematic DW images with a higher degree of reliability. In the current analyses, only a small percentage of gradients with severe artifacts were identified and removed through visual inspection. Sophisticated algorithms that are more sensitive to motion effects may also decrease the positive bias between motion and DTI scalars following gradient removal such as was demonstrated with cardiac gating using the RESTORE algorithm [Chang et al.,2005]. Finally, current results may be limited to single‐shot, double‐refocused EPI sequences. Alternative data acquisition methods include both spiral DTI imaging and multi‐leaved 3D spiral sequences. As a result of the self‐navigating feature of the spiral sequences, motion and eddy current effects are reduced at the expense of other undesired effects such as greater image blurring [Frank et al.,2010; Liu et al.,2004].
In summary, current results indicate that both head motion and the removal of a significant portion of DW images introduce a positive bias in the calculation of DTI scalars (both FA and MD). Head motion accounted for significant portions of overall explained variance for both FA and MD and was observed across multiple pipelines following established protocols for data processing, suggesting that current techniques for removing bias as a result of head motion are likely insufficient. These findings suggest that estimates of motion should be used as covariates if quality assurance protocols fail during clinical studies (i.e., motion parameters significantly different across two groups of subjects), which should potentially mitigate group‐wise differences. The removal of DW images secondary to artifacts should also be approached with caution, as this potentially introduces a positive bias into scalar calculations. In conclusion, varying amounts of head motion across different clinical populations may have profound effects on DTI data and may be extremely difficult to correct. Future studies should investigate the ability of more sophisticated algorithms to detect and remove the effects of data anomalies such as motion artifacts from DTI data.
Supporting information
Additional Supporting Information may be found in the online version of this article.
Supporting Figure 1. Results from the voxelwise analysis depicting the voxels that exhibited a significant association between motion and DTI scalar values. Data is presented for the analyses involving mean diffusivity (MD) as the dependent measure as no relationship was observed for FA. Results indicated that, across several white matter tracts, subjects with higher translational motion along the anterior‐posterior axis exhibited higher values of MD. Slice location for both axial (z) and sagittal (x) prescriptions are provided according to the Talairach atlas.
Supporting Figure 2. Statistical parametric maps depicting voxels that exhibited significant effects of motion regardless of whether problematic gradients were removed. Voxels are color coded according to whether statistically significant effects were present only when all gradient files were analyzed (blue coloring), only when problematic gradients were removed (yellow coloring), or if significant effects were present for both analyses (red coloring). Slice location for both axial (z) and sagittal (x) prescriptions are provided according to the MNI atlas.
Supporting Figure 3. This figure presents the effects of randomly removing diffusion weighted images (DWI) on both fractional anisotropy (FA) and mean diffusivity (MD) for Subject 3. Please see Figure 5 for complete details on the data analyses for each panel.
Acknowledgements
Special thanks to Diana South and Cathy Smith for assistance with data collection.
DTI GRADIENT TABLE LISTING DIRECTIONS USED DURING DATA ACQUISITION
Table .
| 0 | 0 | 0 |
| 1 | 0 | 0 |
| −0.5107 | 0.62663 | −0.5887 |
| 0.262 | 0.43199 | 0.86298 |
| −0.524 | −0.783 | 0.33502 |
| 0.60876 | −0.065 | −0.7907 |
| 0.35685 | −0.9236 | −0.1399 |
| 0 | 0 | 0 |
| 0.08798 | 0.18496 | −0.9788 |
| 0.88705 | −0.089 | −0.453 |
| 0.29396 | −0.9069 | 0.30196 |
| 0.41384 | 0.73671 | 0.53479 |
| 0.88395 | −0.296 | 0.36198 |
| 0.86326 | 0.50415 | −0.025 |
| 0 | 0 | 0 |
| −0.6789 | 0.13899 | −0.7209 |
| 0.22006 | −0.2331 | −0.9472 |
| 0.08599 | 0.86693 | −0.491 |
| 0.90124 | −0.4191 | −0.11 |
| −0.004 | −0.9098 | −0.4149 |
| −0.8147 | −0.3859 | 0.43285 |
| 0 | 0 | 0 |
| −0.33 | −0.013 | −0.9439 |
| 0.54314 | −0.4881 | −0.6832 |
| 0.58224 | 0.80033 | 0.14306 |
| 0.6933 | −0.6983 | 0.17808 |
| −0.5251 | −0.3961 | 0.75321 |
| 0.90019 | 0.25905 | 0.35007 |
| 0 | 0 | 0 |
| 0.16602 | 0.98612 | 0 |
| 0.65604 | 0.36602 | 0.66004 |
| 0.25698 | −0.443 | 0.85892 |
| −0.6392 | 0.68923 | 0.34112 |
| −0.11 | 0.6638 | 0.73978 |
| −0.169 | −0.6011 | 0.78111 |
REFERENCES
- Aksoy M, Liu C, Moseley ME, Bammer R ( 2008): Single‐step nonlinear diffusion tensor estimation in the presence of microscopic and macroscopic motion. Magn Reson Med 59: 1138–1150. [DOI] [PMC free article] [PubMed] [Google Scholar]
- Andersson JL, Skare S ( 2002): A model‐based method for retrospective correction of geometric distortions in diffusion‐weighted EPI. Neuroimage 16: 177–199. [DOI] [PubMed] [Google Scholar]
- Ardekani BA, Tabesh A, Sevy S, Robinson DG, Bilder RM, Szeszko PR ( 2010): Diffusion tensor imaging reliably differentiates patients with schizophrenia from healthy volunteers. Hum Brain Mapp (in press). [Epub ahead of print 2010 Mar 4]. [DOI] [PMC free article] [PubMed]
- Bazarian JJ, Zhong J, Blyth B, Zhu T, Kavcic V, Peterson D ( 2007): Diffusion tensor imaging detects clinically important axonal damage after mild traumatic brain injury: A pilot study. J Neurotrauma 24: 1447–1459. [DOI] [PubMed] [Google Scholar]
- Beaulieu C ( 2002): The basis of anisotropic water diffusion in the nervous system—A technical review. NMR Biomed 15: 435–455. [DOI] [PubMed] [Google Scholar]
- Bullmore E, Brammer M, Williams SC, Rabe‐Hesketh S, Janot N, David A, Mellers J, Howard R, Sham P ( 1996): Statistical methods of estimation and inference for functional MR image analysis. Magn Reson Med 35: 261–277. [DOI] [PubMed] [Google Scholar]
- Bullmore ET, Brammer MJ, Rabe‐Hesketh S, Curtis VA, Morris RG, Williams SC, Sharma T, McGuire PK ( 1999): Methods for diagnosis and treatment of stimulus‐correlated motion in generic brain activation studies using fMRI. Hum Brain Mapp 7: 38–48. [DOI] [PMC free article] [PubMed] [Google Scholar]
- Chang LC, Jones DK, Pierpaoli C ( 2005): RESTORE: Robust estimation of tensors by outlier rejection. Magn Reson Med 53: 1088–1095. [DOI] [PubMed] [Google Scholar]
- Cook PA, Symms M, Boulby PA, Alexander DC ( 2007): Optimal acquisition orders of diffusion‐weighted MRI measurements. J Magn Reson Imaging 25: 1051–1058. [DOI] [PubMed] [Google Scholar]
- Cox R, Glen D ( 2006): Efficient, Robust, Nonlinear, and Guaranteed Positive Definite Diffusion Tensor Estimation. Seattle, WA: International Society for Magnetic Resonance and Medicine, 14th Scientific Meeting. pp 349. [Google Scholar]
- Cox RW ( 1996): AFNI: Software for analysis and visualization of functional magnetic resonance neuroimages. Comput Biomed Res 29: 162–173. [DOI] [PubMed] [Google Scholar]
- Farrell JA, Landman BA, Jones CK, Smith SA, Prince JL, van Zijl PC, Mori S ( 2007): Effects of signal‐to‐noise ratio on the accuracy and reproducibility of diffusion tensor imaging‐derived fractional anisotropy, mean diffusivity, and principal eigenvector measurements at 1.5 T. J Magn Reson Imaging 26: 756–767. [DOI] [PMC free article] [PubMed] [Google Scholar]
- Frank LR, Jung Y, Inati S, Tyszka JM, Wong EC ( 2010): High efficiency, low distortion 3D diffusion tensor imaging with variable density spiral fast spin echoes (3D DW VDS RARE). Neuroimage 49: 1510–1523. [DOI] [PMC free article] [PubMed] [Google Scholar]
- Friston KJ, Williams S, Howard R, Frackowiak RS, Turner R ( 1996): Movement‐related effects in fMRI time‐series. Magn Reson Med 35: 346–355. [DOI] [PubMed] [Google Scholar]
- Grieve SM, Williams LM, Paul RH, Clark CR, Gordon E ( 2007): Cognitive aging, executive function, and fractional anisotropy: a diffusion tensor MR imaging study. AJNR Am J Neuroradiol 28: 226–235. [PMC free article] [PubMed] [Google Scholar]
- Hajnal JV, Myers R, Oatridge A, Schwieso JE, Young IR, Bydder GM ( 1994): Artifacts due to stimulus correlated motion in functional imaging of the brain. Magn Reson Med 31: 283–291. [DOI] [PubMed] [Google Scholar]
- Horsfield MA ( 1999): Mapping eddy current induced fields for the correction of diffusion‐weighted echo planar images. Magn Reson Imaging 17: 1335–1345. [DOI] [PubMed] [Google Scholar]
- Jones DK ( 2004): The effect of gradient sampling schemes on measures derived from diffusion tensor MRI: A Monte Carlo study. Magn Reson Med 51: 807–815. [DOI] [PubMed] [Google Scholar]
- Jones DK, Griffin LD, Alexander DC, Catani M, Horsfield MA, Howard R, Williams SC. ( 2002a): Spatial normalization and averaging of diffusion tensor MRI data sets. Neuroimage 17: 592–617. [PubMed] [Google Scholar]
- Jones DK, Williams SC, Gasston D, Horsfield MA, Simmons A, Howard R ( 2002b): Isotropic resolution diffusion tensor imaging with whole brain acquisition in a clinically acceptable time. Hum Brain Mapp 15: 216–230. [DOI] [PMC free article] [PubMed] [Google Scholar]
- Kraus MF, Susmaras T, Caughlin BP, Walker CJ, Sweeney JA, Little DM ( 2007): White matter integrity and cognition in chronic traumatic brain injury: A diffusion tensor imaging study. Revue Neurologique 130: 2508–2519. [DOI] [PubMed] [Google Scholar]
- Landman BA, Farrell JA, Huang H, Prince JL, Mori S ( 2008): Diffusion tensor imaging at low SNR: Nonmonotonic behaviors of tensor contrasts. Magn Reson Imaging 26: 790–800. [DOI] [PMC free article] [PubMed] [Google Scholar]
- Landman BA, Farrell JA, Jones CK, Smith SA, Prince JL, Mori S ( 2007): Effects of diffusion weighting schemes on the reproducibility of DTI‐derived fractional anisotropy, mean diffusivity, and principal eigenvector measurements at 1.5T. Neuroimage 36: 1123–1138. [DOI] [PMC free article] [PubMed] [Google Scholar]
- Le Bihan D ( 2003): Looking into the functional architecture of the brain with diffusion MRI. Nat Rev Neurosci 4: 469–480. [DOI] [PubMed] [Google Scholar]
- Leemans A, Jones DK ( 2009): The B‐matrix must be rotated when correcting for subject motion in DTI data. Magn Reson Med 61: 1336–1349. [DOI] [PubMed] [Google Scholar]
- Liu C, Bammer R, Kim DH, Moseley ME ( 2004): Self‐navigated interleaved spiral (SNAILS): Application to high‐resolution diffusion tensor imaging. Magn Reson Med 52: 1388–1396. [DOI] [PubMed] [Google Scholar]
- Lund TE, Norgaard MD, Rostrup E, Rowe JB, Paulson OB ( 2005): Motion or activity: their role in intra‐ and inter‐subject variation in fMRI. Neuroimage 26: 960–964. [DOI] [PubMed] [Google Scholar]
- Marenco S, Rawlings R, Rohde GK, Barnett AS, Honea RA, Pierpaoli C, Weinberger DR. ( 2006): Regional distribution of measurement error in diffusion tensor imaging. Psychiatry Res 147: 69–78. [DOI] [PMC free article] [PubMed] [Google Scholar]
- Mayer AR, Franco AR, Ling J, Canive JM ( 2007): Assessment and quantification of head motion in neuropsychiatric functional imaging research as applied to schizophrenia. J Int Neuropsychol Soc 13: 839–845. [DOI] [PubMed] [Google Scholar]
- Mayer AR, Ling J, Mannell MV, Gasparovic C, Phillips JP, Doezema D, Reicherd R, Yeo RA ( 2010): A prospective diffusion tensor imaging study in mild traumatic brain injury. Neurology 74: 643–650. [DOI] [PMC free article] [PubMed] [Google Scholar]
- Mori S, van Zijl PC ( 2007): Human white matter atlas. Am J Psychiatry 164: 1005. [DOI] [PubMed] [Google Scholar]
- Norris DG ( 2001): Implications of bulk motion for diffusion‐weighted imaging experiments: Effects, mechanisms, and solutions. J Magn Reson Imaging 13: 486–495. [DOI] [PubMed] [Google Scholar]
- Rohde GK, Barnett AS, Basser PJ, Marenco S, Pierpaoli C ( 2004): Comprehensive approach for correction of motion and distortion in diffusion‐weighted MRI. Magn Reson Med 51: 103–114. [DOI] [PubMed] [Google Scholar]
- Roosendaal SD, Geurts JJ, Vrenken H, Hulst HE, Cover KS, Castelijns JA, Pouwels PJ, Barkhof F ( 2009): Regional DTI differences in multiple sclerosis patients. Neuroimage 44: 1397–1403. [DOI] [PubMed] [Google Scholar]
- Saad ZS, Glen DR, Chen G, Beauchamp MS, Desai R, Cox RW ( 2009): A new method for improving functional‐to‐structural MRI alignment using local Pearson correlation. Neuroimage 44: 839–848. [DOI] [PMC free article] [PubMed] [Google Scholar]
- Schmithorst VJ, Wilke M, Dardzinski BJ, Holland SK ( 2005): Cognitive functions correlate with white matter architecture in a normal pediatric population: A diffusion tensor MRI study. Hum Brain Mapp 26: 139–147. [DOI] [PMC free article] [PubMed] [Google Scholar]
- Sexton CE, Mackay CE, Ebmeier KP ( 2009): A systematic review of diffusion tensor imaging studies in affective disorders. Biol Psychiatry 66: 814–823. [DOI] [PubMed] [Google Scholar]
- Skare S, Hedehus M, Moseley ME, Li TQ ( 2000): Condition number as a measure of noise performance of diffusion tensor data acquisition schemes with MRI. J Magn Reson 147: 340–352. [DOI] [PubMed] [Google Scholar]
- Smith SM, Jenkinson M, Johansen‐Berg H, Rueckert D, Nichols TE, Mackay CE, Watkins KE, Ciccarelli O, Cader MZ, Matthews PM, Behrens TE. ( 2006): Tract‐based spatial statistics: voxelwise analysis of multi‐subject diffusion data. Neuroimage 31: 1487–1505. [DOI] [PubMed] [Google Scholar]
- Smith SM, Jenkinson M, Woolrich MW, Beckmann CF, Behrens TE, Johansen‐Berg H, Bannister PR, De Luca M, Drobnjak I, Flitney DE, Niazy RK, Saunders J, Vickers J, Zhang Y, De Stefano N, Brady JM, Matthews PM ( 2004): Advances in functional and structural MR image analysis and implementation as FSL. Neuroimage 23 ( Suppl 1): S208–S219. [DOI] [PubMed] [Google Scholar]
- Smith SM, Nichols TE ( 2009): Threshold‐free cluster enhancement: Addressing problems of smoothing, threshold dependence and localisation in cluster inference. Neuroimage 44: 83–98. [DOI] [PubMed] [Google Scholar]
- Storey P, Frigo FJ, Hinks RS, Mock BJ, Collick BD, Baker N, Marmurek J, Graham SJ ( 2007): Partial k‐space reconstruction in single‐shot diffusion‐weighted echo‐planar imaging. Magn Reson Med 57: 614–619. [DOI] [PubMed] [Google Scholar]
- Tijssen RH, Jansen JF, Backes WH ( 2009): Assessing and minimizing the effects of noise and motion in clinical DTI at 3 T. Hum Brain Mapp 30: 2641–2655. [DOI] [PMC free article] [PubMed] [Google Scholar]
- Van HW, Sijbers J, De BS, Poot D, Parizel PM, Leemans A ( 2009): On the construction of a ground truth framework for evaluating voxel‐based diffusion tensor MRI analysis methods. Neuroimage 46: 692–707. [DOI] [PubMed] [Google Scholar]
- Wheeler‐Kingshott CA, Cercignani M ( 2009): About “axial” and “radial” diffusivities. Magn Reson Med 61: 1255–1260. [DOI] [PubMed] [Google Scholar]
- White T, Nelson M, Lim KO ( 2008): Diffusion tensor imaging in psychiatric disorders. Top Magn Reson Imaging 19: 97–109. [DOI] [PubMed] [Google Scholar]
- Wilde EA, McCauley SR, Hunter JV, Bigler ED, Chu Z, Wang ZJ, Hanten GR, Troyanskaya M, Yallampalli R, Li X, Chia J, Levin HS ( 2008): Diffusion tensor imaging of acute mild traumatic brain injury in adolescents. Neurology 70: 948–955. [DOI] [PubMed] [Google Scholar]
- Yeh PH, Simpson K, Durazzo TC, Gazdzinski S, Meyerhoff DJ ( 2009): Tract‐Based Spatial Statistics (TBSS) of diffusion tensor imaging data in alcohol dependence: Abnormalities of the motivational neurocircuitry. Psychiatry Res 173: 22–30. [DOI] [PMC free article] [PubMed] [Google Scholar]
- Yoo SS, Choi BG, Juh R, Pae CU, Lee CU ( 2005): Head motion analysis during cognitive fMRI examination: Application in patients with schizophrenia. Neurosci Res 53: 84–90. [DOI] [PubMed] [Google Scholar]
- Zhang Y, Brady M, Smith S ( 2001): Segmentation of brain MR images through a hidden Markov random field model and the expectation‐maximization algorithm. IEEE Trans Med Imaging 20: 45–57. [DOI] [PubMed] [Google Scholar]
- Zollei L, Stevens A, Huber K, Kakunoori S, Fischl B ( 2010): Improved tractography alignment using combined volumetric and surface registration. Neuroimage 51: 206–213. [DOI] [PMC free article] [PubMed] [Google Scholar]
Associated Data
This section collects any data citations, data availability statements, or supplementary materials included in this article.
Supplementary Materials
Additional Supporting Information may be found in the online version of this article.
Supporting Figure 1. Results from the voxelwise analysis depicting the voxels that exhibited a significant association between motion and DTI scalar values. Data is presented for the analyses involving mean diffusivity (MD) as the dependent measure as no relationship was observed for FA. Results indicated that, across several white matter tracts, subjects with higher translational motion along the anterior‐posterior axis exhibited higher values of MD. Slice location for both axial (z) and sagittal (x) prescriptions are provided according to the Talairach atlas.
Supporting Figure 2. Statistical parametric maps depicting voxels that exhibited significant effects of motion regardless of whether problematic gradients were removed. Voxels are color coded according to whether statistically significant effects were present only when all gradient files were analyzed (blue coloring), only when problematic gradients were removed (yellow coloring), or if significant effects were present for both analyses (red coloring). Slice location for both axial (z) and sagittal (x) prescriptions are provided according to the MNI atlas.
Supporting Figure 3. This figure presents the effects of randomly removing diffusion weighted images (DWI) on both fractional anisotropy (FA) and mean diffusivity (MD) for Subject 3. Please see Figure 5 for complete details on the data analyses for each panel.