

Abstract
In making decisions, people have to balance between the competing demands of speed and accuracy, a balance generally referred to as the speed‐accuracy tradeoff (SAT). In this study, we investigated the role of controlled SAT in a two‐choice task in which manual responses were either validly or invalidly cued. Examining electrophysiological measurements of oscillatory brain activity, theta power in the anterior cingulate cortex (ACC), alpha power in the occipital cortex, and beta power in the motor cortex were found to be related to SAT. Because oscillatory effects of SAT were found to emanate from the SAT baseline interval preceding the two‐choice task, the results indicate that SAT is modulated by a change of visuo‐motor baseline activities rather than a change of response threshold. Moreover, in the two‐choice task, conflict‐induced theta power in the ACC was found to be more pronounced in speed than in accuracy trials, whereas priming‐related beta power dynamics in the motor cortex were unaffected by SAT. These results indicate that conflict processing, but not response priming, depends on SAT. Hum Brain Mapp, 2012. © 2011 Wiley Periodicals, Inc
Keywords: speed‐accuracy tradeoff, anterior cingulate cortex, motor cortex, brain oscillations, conflict, response priming
INTRODUCTION
The official Olympic biathlon which is very popular with European sports fans is a winter sport that combines cross‐country skiing and rifle shooting. Athletes ski for a predetermined distance and stop repeatedly at a rifle range to fire at five distant targets. At each stop, they have five shots, and for each shot that misses a target, they must ski around a penalty loop or are added a penalty time. As in most races, the contestant with the shortest total time wins. Preparing each shot, with cold fingers and a pounding heart, athletes have to balance between the competing demands of speed and accuracy, a balance that is referred to as the speed‐accuracy tradeoff (SAT) in the scientific literature [Schouten and Bekker,1967; Wickelgren,1977]. Though not regarding biathlon, SAT has been investigated extensively in cognitive sciences and also got recent interest in neurosciences.
In the cognitive sciences, SAT has been mostly studied with mathematical models of performance in simple two‐choice tasks [Bogacz et al.,2006]. Most of these models, so‐called accumulator models, assume that, upon presentation of a response cue, activity of an accumulator associated to a particular response gradually increases from a baseline of activation until some threshold is reached and the response is executed [Gold and Shadlen,2007]. In these models, SAT can be accounted for by changing distance between baseline and threshold. Whereas an emphasis on speed decreases distance leading to fast but error‐prone responses, an emphasis on accuracy increases distance leading to accurate but slow responses. Theoretically, SAT can be accounted for both by changing baseline or by changing threshold. However, although most models assume that SAT is controlled by changing threshold, in fact, changing threshold is mathematically equivalent to changing baseline [Bogacz et al.,2010]. Therefore, the models do not distinguish whether SAT is modulated by a change in baseline, threshold, or both.
In the neurosciences, the study of SAT in humans began with traditional electroencephalogram (EEG) measures of event‐related potentials (ERPs) and, in particular, lateralized readiness potentials (LRPs) in manual two‐choice tasks. In contrast to most accumulator models which assume that SAT occurs at the premotor stage, LRP analyses revealed that controlled SAT instructions, i.e., manipulating emphasis on speed or on accuracy, affect both premotor and motor processes [Band et al.,2003; Osman et al.,2000; Rinkenauer et al.,2004; van der Lubbe et al.,2001]. However, it remains unclear from ERP studies whether SAT arises from a change in baseline, threshold, or both, because LRPs were baseline corrected relative to an interval set between SAT instruction and the onset of the response cue, canceling out potential effects of SAT instruction on baseline activity.
In recent neuroscience studies, functional magnetic resonance imaging (fMRI) analysis revealed that, compared with emphasis on accuracy, emphasis on speed leads to sustained increases of blood oxygenation level‐dependent (BOLD) activities in several frontal, parietal, and motor areas, including the presupplementary motor area (pre‐SMA), the striatum, the precuneus, the anterior cingulate cortex (ACC), and the dorsolateral prefrontal cortex (DLPFC) [Forstmann et al.,2008; Ivanoff et al.,2008; van Veen et al.,2008]. Because effects were observed in the interval between SAT instruction and the onset of the response signal, imaging suggests that SAT is modulated by a change in baseline. However, whether SAT is also modulated by a change in threshold is less clear, because with a changing baseline, fMRI can't attribute decision‐related BOLD signals unequivocally to changes in baseline, threshold, or both [for methodological limitations of fMRI, see Bogacz et al.,2010; van Veen et al.,2008].
Motor behavior has been studied intensively by analyzing oscillatory brain activity, particularly in the beta frequency range (15–25 Hz) [Başar et al.,1999]. Event‐related changes in beta power can arise from a decrease or an increase in the synchronous firing of the underlying cell assemblies in motor‐related brain areas [Pfurtscheller and Lopes da Silva,1999]. There is evidence that whereas decreasing beta power is related to response activation, increasing beta power is linked to motor deactivation [e.g., Alegre et al.,2003; Kaiser et al.,2001; Kilner et al.,2005; Pastötter et al.,2008; Tombini et al.,2009; Tzagarakis et al.,2010; Zhang et al.,2008]. When preparing for a response, beta power starts to gradually decrease from baseline activity. This decrease in beta power has been shown to be modulated by response priming, response inhibition, and response uncertainty [Kilner et al.,2005; Pastötter et al.,2008,2010; Tzagarakis et al.,2010]. Having exceeded response threshold, beta activity peaks at a minimum of power and rebounds to baseline activity [Neuper and Pfurtscheller,2001]. In addition to beta oscillations, theta (4–7 Hz) and alpha (8–12 Hz) oscillations have also been linked to motor processing. Whereas theta oscillations localized in the ACC have been related to movement preparation and the selection of appropriate responses [Pastötter et al.,2010; Tombini et al.,2009], alpha oscillations have been suggested to reflect inhibition of visuo‐motor processes [Jensen and Mazaheri,2010; Klimesch et al.,2007]. To date, brain oscillations have not yet been studied with controlled SAT.
In the present EEG study, we examined SAT with measures of oscillatory brain activity in a manual two‐choice task that was recently used in the study of response priming and response conflict [Pastötter et al.,2010]. In this task, targets are (validly or invalidly) cued or not. Response conflict arises when a target triggering a specific response (e.g., a left‐hand response) is preceded by an invalid cue (e.g., a cue that primes a right‐hand response). Recently, we showed that conflict processing as reflected by a theta power increase in the ACC constrains response priming as reflected by a beta power decrease in the motor cortex, slowing response processing and lowering response errors [Pastötter et al.,2010]. In the present experiment, to control for SAT, each single trial of the two‐choice task was preceded by an SAT baseline interval beginning with the instruction to emphasize either speed or accuracy in the current trial. In the EEG analysis, we examined mean power in the theta, alpha, and beta frequency range, separately for the SAT baseline interval and the two‐choice task, and also peak (maximums and minimums) power in the two‐choice task. Comparisons of mean power between speed and accuracy trials in the SAT baseline interval will indicate whether SAT is modulated by a change in baseline activity. On the other hand, peak power analysis will indicate whether SAT is also modulated by a change of response threshold.
METHODS
Subjects
Forty right‐handed subjects (28 females and 12 males) participated in the study. All subjects were right‐handed and reported normal or corrected‐to‐normal vision. Mean age was 23.1 years with a range of 18–29 years (SD = 2.1). No subject reported any history of neurological disease. All subjects gave their written informed consent and received monetary reward for participation. The study was conducted in accordance with the Declaration of Helsinki.
Procedure and Experimental Design
Subjects viewed a computer monitor from a distance of 150 cm and were instructed to maintain fixation on a centrally located grey fixation cross throughout the whole experiment and to not move the eyes. The screen background was black, and displayed two grey square outline boxes centered above and below fixation at all times (see Fig. 1).
Figure 1.
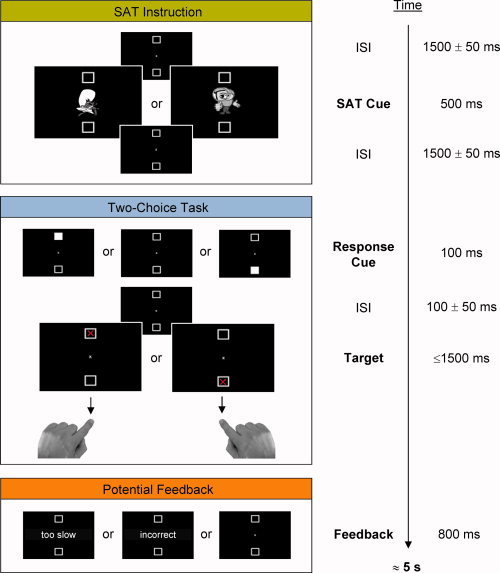
Depiction of the procedure. In the two‐choice task, subjects were instructed to respond to a red cross which was presented in one of the two vertically aligned square boxes with the index finger of their left hand (targets above fixation) and right hand (targets below fixation) while keeping fixation on the centre of the screen. Targets were validly or invalidly cued by brightening of one of the squares or uncued. Prior to the two‐choice task, subjects were instructed to focus on either speed or accuracy in the current trial. In speed trials, subjects saw the message “too slow” whenever they exceeded the response time criterion of 450 ms. In accuracy trials, they saw the message “incorrect” whenever they made an incorrect response. [Color figure can be viewed in the online issue, which is available at wileyonlinelibrary.com.]
After an intertrial interval in which a fixation screen of variable duration (1,450–1,550 ms) was shown, each of the 240 single trials began with the presentation of the SAT cue at fixation for 500 ms. Half of the trials were speed trials in which the SAT cue consisted of a small picture of Speedy Gonzales. In speed trials, subjects should focus on speeding their response and be less concerned about making an error. The other half of the trials were accuracy trials in which the SAT cue consisted of a small picture of a detective with a magnifier in his hand. In accuracy trials, subjects should focus on making an accurate response and be less concerned about speed. The order of speed and accuracy trials was randomized with the constraint that none of them was run more than four times in a row. SAT cuing was followed by a fixation screen of variable duration (1,450–1,550 ms).
Following the SAT interval, in 160 of the 240 trials of the two‐choice task, a response cue was presented for 100 ms. The response cue consisted of a brightening of one of the two square boxes and was equally likely to occur at either location. After a variable delay of 50 ms to 150 ms in which the fixation screen was shown, the target, a red cross, was presented with equal probability within one of the two peripheral boxes with chance coincidence of response cue and target locations. Total onset asynchrony between response cue and target thus ranged from 150 to 250 ms. Eighty trials on which cues and targets were presented at the same location were classified as validly cued trials; 80 trials on which cues and targets occurred at opposite locations were classified as invalidly cued trials. Intermixed with the cued trials, 80 uncued trials were run in which the presentation of the preceding fixation screen was prolongated, respectively. The order of validly cued, invalidly cued, and uncued trials was randomized with the constraint that none of them was run more than four times in a row.
Subjects responded based on targets' spatial location. Two response keys were marked on the computer keyboard, one on the upper left side and one on the upper right side. Subjects were instructed to press the left key with the index finger of their left hand for targets that appeared above fixation and to press the right key with the index finger of their right hand for targets that appeared below fixation, but to ignore response cue presentation. Targets remained on the screen until subjects made a response or 1,500 ms elapsed. At the end of speed trials, subjects saw the message “too slow” whenever they exceeded a response time criterion of 450 ms. At the end of accuracy trials, subjects saw the message “incorrect” whenever they made an incorrect response. Feedback messages were presented for 800 ms. In‐time responses in speed trials and correct responses in accuracy trials were followed by a fixation screen lasting for 800 ms.
Analysis of behavioral data was based on a 2 × 3 design with the within‐subjects factors of SAT (speed, accuracy) and CUING (invalid, valid, no cue). We analyzed reaction time (RT), response errors, and brain oscillations as described below. A‐priori analyses showed that neither reaction time nor response errors differed reliably between left and right hand responses. Therefore, we did not analyze potential behavioral and physiological interactions arising from left versus right hand responses.
Recordings and Preprocessing of EEG Data
EEGs were recorded from 61 equidistant active electrodes mounted in an elastic cap (ActiCAP, Montage 10, Brain Products, Gilching, Germany). ActiCAP with its active electrode system enables fast electrode placement and low electrode‐skin impedances due to amplification circuitry built into the electrodes boosting the signal and reducing the noise. Electrode‐skin impedance was kept below 20 kΩ. Vertical and horizontal eye movements were recorded from two additional channels. Electrode Cz served as common reference. Signals were digitalized with a sampling rate of 500 Hz and amplified between 0.15 and 100 Hz with a notch filter at 50 Hz to remove line noise (BrainAmpMR plus, BrainVision Recorder, Brain Products, Gilching, Germany).
EEG recordings were offline rereferenced against average reference and EOG corrected using calibration data to generate individual artifact coefficients [Ille et al.,2002] as implemented in the software package BESA (Brain Electrical Source Analysis, MEGIS Software v5.2.48, Gräfelfing, Germany). Remaining artifacts were marked by careful visual inspection. Trials outside the range of 100–1,500 ms in reaction time (RT) were excluded from further analyses. Mean number of speed trials remaining for each subject for EEG data analysis was 112.0 (SD = 7.1); mean number of accuracy trials was 112.3 (SD = 6.2).
Processing of EEG Data
To transform EEG data into the time‐frequency domain, a complex demodulation algorithm as implemented in BESA was used [Hoechstetter et al.,2004]. The algorithm consists of a multiplication of the time‐domain signal with a complex periodic exponential function, having a frequency equal to the frequency under analysis, and subsequent low‐pass filtering. The low‐pass filter is a finite impulse response filter of Gaussian shape in the time domain, which is related to the envelope of the moving window in wavelet analysis. The data were filtered in a frequency range from 2 to 30 Hz. Time resolution was set to 78.8 ms (full width at half maximum, FWHM) and frequency resolution was set to 1.42 Hz (FWHM). Time‐frequency data were exported in bins of 50 ms and 1 Hz.
We examined event‐related power [Pfurtscheller and Aranibar,1977] by calculating the percentage of power decrease or increase following SAT cue and target onset in relation to a prestimulus baseline interval which was set from −500 ms to 0 ms prior to SAT cue onset and −2,800 ms to −2,300 ms prior to target onset, respectively. Power data were collapsed from 4 to 7 Hz in the theta frequency range, from 8 to 12 Hz in the alpha frequency range, and from 15 to 25 Hz in the beta frequency range. A‐priori examination of time‐frequency plots showed that these frequency ranges were suitable for all subjects.
In the analysis of theta and beta power, we focused especially on the 2,000‐ms interval following SAT cue onset and the 300‐ms interval following target onset. Analysis of alpha power was restricted to an interval ranging from 500 to 2,000 ms following SAT cue onset, because alpha activities both in the first 500 ms following SAT cue onset and, in particular, in the 300‐ms interval following target onset were superimposed by dominant theta activity. In the peak‐picking analysis, the maximum value for theta power, the minimum value for beta power, and latencies of these values in the time period ranging from 0 to 1,000 ms following target onset were computed. A priori, data were analyzed both for all responses and only for correct responses, both with and without subtracting the evoked signal. As it turned out, the conclusions were the same for all analysis methods. The present results are based on analysis of all responses without subtraction of the evoked signal.
Statistical Analysis of EEG Data
To examine electrophysiological effects of SAT in the SAT baseline interval, we compared mean power between speed and accuracy trials separately for the theta and beta frequency band in the 2,000‐ms interval following SAT cue onset, and for the alpha frequency range from 500 to 2,000 ms following SAT cue onset, at 61 electrode sites. To account for multiple testing, a two‐stage randomization procedure was carried out. At first, Wilcoxon sign‐rank tests were calculated for each electrode in order to investigate which electrodes differed between SAT conditions (P's < 0.05). Thereafter, a randomization test using 5,000 permutations was run in which we shuffled the order of conditions consistently across electrodes [Blair and Karniski,1993]. Similar procedures were already applied in other studies from our lab [Pastötter et al.,2011; Staudigl et al.,2010]. The procedure evaluates whether a given number of electrodes, exhibiting a significant difference between speed and accuracy trials, is expected by chance. If the P‐value (P corr) of this randomization test is below 0.05, less than 5% of the permutation runs exhibited equal or more electrode sites with a significant difference between conditions.
In the two‐choice task, to examine oscillatory effects of response conflict on target processing, we compared mean theta power in the 300‐ms interval following target onset between invalidly and validly cued trials, and, on the other hand, to examine effects of response priming, we examined mean beta power in the same interval between validly cued and uncued trials, respectively, at 61 electrode sites. To account for multiple testing, pair‐wise Wilcoxon sign‐rank tests for all electrode sites were calculated (P's < 0.05) and randomization tests were run. Note that we also run randomization tests on peak‐power data in which we compared conflict‐induced peak theta power and priming‐induced peak beta power. As it turned out, peak theta power was affected by conflict, whereas peak beta power was unaffected by response priming. We do not report on the detailed results from these analyses because they are consistent with the presented results based on analyses of variance (ANOVAs) of peak power and latency of peak power data as described next.
To avoid nonindependent analysis and selection bias, further analyses were not based on scattered electrode sites showing a significant difference between conditions in the randomization procedure [Kriegeskorte et al.,2009]. Instead, ANOVAs were calculated in which, independent of the prior analysis, all electrode sites were combined into nine regions of interest (ROI) based on laterality and caudality of sites [Oken and Chiappa,1986]. For each frequency band, mean power, peak power, and latency of peak power entered into ANOVAs with the within‐subjects factors of LATERALITY (left, middle, right), CAUDALITY (frontal, central, parietal), and SAT (speed, accuracy). Analyses of data in the two‐choice task also included the factor of CUING (invalid, valid, no cue). Greenhouse‐Geisser correction was applied in all ANOVAs. Corrected P‐values are reported with uncorrected degrees of freedom. For significant SAT‐induced effects on brain oscillations, we examined brain‐behavior relationships by calculating nonparametric Spearman correlations. These correlations were restricted to RT, because number of response errors was small and invariant across subjects, especially in uncued and validly cued trials.
Source Localization
To localize the sources of power differences between conditions, (standardized) low‐resolution brain electromagnetic tomography software (LORETA) was used [Pascual‐Marqui et al.,1994; Pascual‐Marqui,2002] computing three‐dimensional intracortical localizations of the brain electric activity measured on the scalp. LORETA solves the “inverse problem” by finding the smoothest of all solutions with no a priori assumptions about the number, location, or orientation of the sources. LORETA uses a three‐shell spherical head model including scalp, skull, and brain compartments, registered to the digitized Montreal Neurological Institute MRI template. LORETA solution space consists of 6,239 voxels at 5‐mm resolution and is restricted to cortical gray matter. Data was analyzed in the theta (4–7 Hz), alpha (8–12 Hz), and beta (15–25 Hz) frequency bands. Time windows of interest were identical to analyses of power effects at electrode space. The localization of differences in activity between conditions in each frequency band was assessed with voxel‐by‐voxel paired t‐tests of the log‐transformed computed current density power [Frei et al.,2001]. As implemented in LORETA, nonparametric statistical analysis was performed using randomization tests to correct for multiple testing [Nichols and Holmes,2002]. The significance threshold of these randomization tests was based on 5,000 permutation runs. Significant voxels were attributed to the corresponding Brodmann areas (BAs), based on their Talairach coordinates.
RESULTS
Behavioral Results
Reaction times
Analyzing mean median RTs of responses (see Fig. 2), a two‐way ANOVA with the within‐subject factors of SAT (speed, accuracy) and CUING (invalid, valid, no cue) revealed a main effect of SAT (F(1,39) = 46.8, P < 0.001) and a main effect of CUING (F(2,78) = 192.8, P < 0.001), but no reliable interaction between the two factors (F(2,78) = 1.8, P = 0.17). Responses were faster in validly cued trials than both in invalidly cued trials (t 39 = 13.8, P < 0.001) and uncued trials (t 39 = 21.6, P < 0.001); invalidly cued and uncued trials did not differ in RT (t 39 < 1). Crucially, responses were faster in speed trials than in accuracy trials, a benefit that was found irrespective of response cuing in the two‐choice task.
Figure 2.
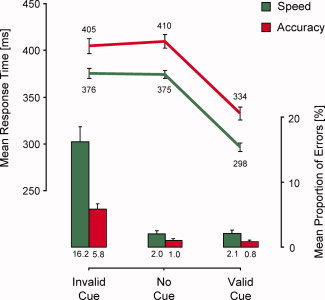
Behavioral data. Main effect of SAT instruction: compared with accuracy trials, in speed trials, responses were faster but more error‐prone. Main effect of response cuing: compared with uncued trials, responses were faster in validly cued trials and more error‐prone in invalidly cued trials. An interaction between SAT and response cuing was observed for response errors, but not for RT. All error bars: standard errors. [Color figure can be viewed in the online issue, which is available at wileyonlinelibrary.com.]
Response errors
Analyzing mean response errors (see Fig. 2), a two‐way ANOVA with the within‐subject factors of SAT (speed, accuracy) and CUING (invalid, valid, no cue) revealed a main effect of SAT (F(1,39) = 21.8, P < 0.001), a main effect of CUING (F(2,78) = 48.9, P < 0.001), and an interaction between the two factors (F(2,78) = 25.1, P < 0.001). Responses were more error‐prone in invalidly cued trials than both in validly cued trials (t 39 = 7.4, P < 0.001) and uncued trials (t 39 = 6.9, P < 0.001); validly cued and uncued trials did not differ in response errors (t 39 < 1). The main effect of SAT indicates that more response errors were committed in speed trials than in accuracy trials. Although an SAT effect was found in invalidly cued trials (t 39 = 5.1, P < 0.001), validly cued trials (t 39 = 2.1, P < 0.05), and, with marginal significance, in uncued trials (t 39 = 1.8, P = 0.08), the interaction indicates that the effect was more pronounced in invalidly cued trials than in validly cued trials (F(1,39) = 26.8, P < 0.001) and uncued trials (F(1,39) = 25.5, P < 0.001), and was the same in validly cued and uncued trials (F(1,39)<1). Correlational analysis showed that individual SAT‐induced RT differences in validly cued trials were negatively related to individual SAT‐induced differences in the number of response errors in invalidly cued trials (r = −0.48, P < 0.01).
Physiological Results: SAT Interval
Topography and localization
In the analysis of electrophysiological data, the first step was to compare SAT‐induced theta and beta power between speed and accuracy trials in the 2,000‐ms SAT interval, and SAT‐induced alpha power from 500 to 2,000 ms following SAT‐cue onset. Randomization tests evaluating whether differences in power are expected by chance (see Methods) revealed significant differences between speed and accuracy trials in the theta, alpha, and beta frequency range. Compared with emphasis on speed, emphasis on accuracy led to an increase of theta power at widespread, but mainly central, electrode sites across the scalp (P corr < 0.001) which was localized to the ACC (BA 24, Fig. 3A). On the other hand, compared with emphasis on accuracy, emphasis on speed led to a decrease of alpha power at central and parietal electrode sites (P corr < 0.001) which was localized to the occipital cortex (BA 18, Fig. 3B) and also to a decrease of beta power at mid‐central sites (P corr < 0.001) which was localized to the motor cortex (BA 4, Fig. 3C).
Figure 3.
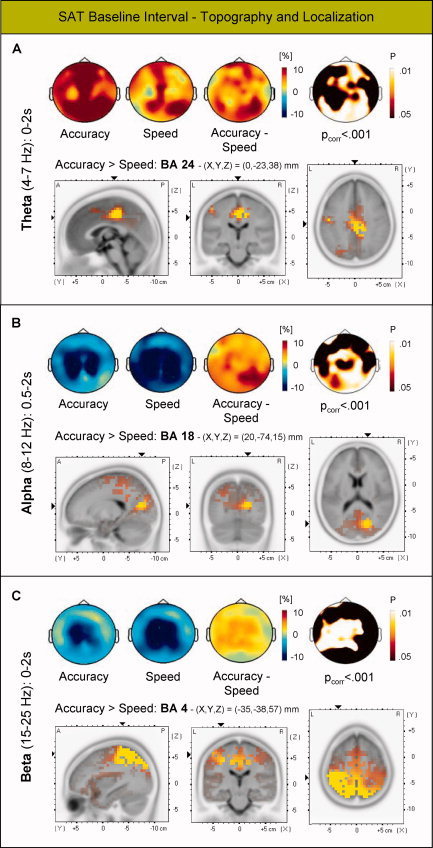
Topography and source localization of differences in oscillatory brain activity between speed and accuracy trials in the SAT baseline interval. A: Differences in mean theta power were localized to the ACC, (B) differences in mean alpha power to the occipital cortex, and (C) differences in mean beta power to the motor cortex. In topographical maps, warm color coding indicates event‐related increases of power and cold color coding indicates event‐related decreases of power. Difference maps between conditions are also expressed by topographical plotting of the P‐levels obtained by nonparametric Wilcoxon sign‐rank tests. Randomization tests (see Methods) revealed that differences in all three frequency bands were reliable (all Pcorr's < 0.001). LORETA significance probability maps are based on P‐values (P's < 0.01, one‐tailed). Coordinates in Talairach space of the maximum‐value voxels are shown. Left: sagittal slices, seen from the left at X; middle: coronal slices, seen from the rear at Y; right: axial slices, seen from above at Z. X, Y, and Z are Talairach coordinates: X from left (“L”) to right (“R”); Y from posterior (“P”) to anterior (“A”); Z from basal to dorsal. [Color figure can be viewed in the online issue, which is available at wileyonlinelibrary.com.]
Effects of SAT on mean power
Mean theta, alpha, and beta power entered into separate three‐way ANOVAs with the within‐subject factors of Laterality (left, middle, right), Caudality (frontal, central, parietal), and SAT (speed, accuracy). For theta power, the analysis revealed main effects of Laterality (F(2,78) = 10.6, P < 0.001), Caudality (F(2,78) = 6.7, P < 0.01), and a Laterality × Caudality interaction (F(4,156) = 10.9, P < 0.001), indicating that event‐related theta power increases were largest at mid‐central electrode sites. Importantly, the ANOVA also showed a main effect of SAT (F(1,39) = 14.3, P < 0.001). Other interactions were nonsignificant (F's < 1.2). Theta power was larger in accuracy than in speed trials, irrespective of electrode sites. Accordingly, in Figure 4A, plotting of the time course of theta power is based on the combination of all sites. It shows that SAT‐induced differences in theta power sustained throughout the SAT baseline interval. Separate analyses of the single ROIs showed that sustained differences in theta power between SAT conditions were found for all ROIs.
Figure 4.

Time courses of oscillatory activities in the SAT baseline interval. Time‐frequency spectrograms and time courses of SAT‐cue‐induced (A) mean theta power combined for all electrode sites, (B) mean alpha power combined for central and parietal sites, and (C) mean beta power combined for central electrode sites. Combination of sites for each frequency band was based on significance of the interaction between SAT and ROIs (see Results). In the right side, point‐to‐point Wilcoxon sign‐rank tests (50 ms bins, P's < 0.05) showed that differences in oscillatory power between SAT conditions sustained throughout the SAT interval in all three frequency bands. [Color figure can be viewed in the online issue, which is available at wileyonlinelibrary.com.]
Regarding alpha power, the ANOVA showed a main effect of Caudality (F(2,78) = 8.2, P < 0.01), indicating that event‐related alpha power decreases were largest at central and parietal sites. Moreover, the analysis also revealed a main effect of SAT (F(1,39) = 11.7, P < 0.01) and a Caudality × SAT interaction (F(2,78) = 5.5, P < 0.01). Neither a main effect of Laterality nor any other interaction was found (F's < 1.6). Alpha power was smaller in speed than in accuracy trials. This SAT effect on alpha power arose primarily from central and parietal sites. Time courses of alpha power combined for these sites are depicted in Figure 4B. They show that SAT‐induced alpha differences sustained throughout the SAT baseline interval.
For beta power, the ANOVA revealed main effects of Laterality (F(2,78) = 21.5, P < 0.001), Caudality (F(2,78) = 26.3, P < 0.01), and a Laterality × Caudality interaction (F(4,156) = 18.1, P < 0.001), indicating that event‐related beta power decreases were largest at central sites with the most pronounced beta power drop in the mid‐central region. More importantly, the ANOVA also revealed a main effect of SAT (F(1,39) = 14.0, P < 0.001) and a Caudality × SAT interaction (F(2,78) = 3.2, P < 0.05). Other interactions were nonsignificant (F's < 1.8). Beta power was smaller in speed than in accuracy trials. This SAT effect on beta power arose primarily from central ROIs. Plotting of the time course of beta power combined for these sites revealed sustained differences in beta power throughout the SAT interval (Fig. 4C). Moreover, post‐hoc comparison of beta power in the left‐central and right‐central ROI showed that, although the SAT‐induced beta power decrease was larger in the left than in the right ROI (F(1,39) = 19.2, P < 0.001), SAT‐induced differences between speed and accuracy trials did not differ between hemispheres (F(1,39)<1).
Correlational analysis revealed that individual SAT‐cue‐induced differences in theta power (combined for all sites) were positively related to differences in beta power at central ROIs (r = 0.53, P < 0.001) and alpha power at central and parietal sites (r = 0.36, P < 0.05). In addition, SAT‐induced differences in beta power were positively related to differences in alpha power (r = 0.67, P < 0.001).
Physiological Results: Two‐Choice Task
Topography and localization
In the analysis of response conflict and response priming, we compared conflict‐induced mean theta power between invalidly and validly cued trials and priming‐induced mean beta power between validly cued and uncued trials in the 300‐ms interval following target onset, irrespective of SAT instruction. Randomization tests revealed a significant conflict‐induced increase of theta power in invalidly compared with validly cued trials at widespread, but mainly central, electrode sites across the scalp (P corr < 0.001) which was localized to the ACC (BA 24, Fig. 5A). On the other hand, a significant priming‐induced decrease of beta power in validly cued trials compared with uncued trials was found at mid‐central electrode sites (P corr < 0.001) which was localized the motor cortex (BA 4, Fig. 5B).
Figure 5.

Topography and source localization of differences in oscillatory brain activities in the 300‐ms interval following target onset in the two‐choice task. A: Differences in mean theta power between invalidly and validly cued trials were localized to the ACC and (B) differences in mean beta power between uncued and validly cued trials were localized to the motor cortex. Warm color coding indicates event‐related increases of power and cold color coding indicates event‐related decreases of power. Difference maps between conditions are also expressed by topographical plotting of the P‐levels obtained by nonparametric Wilcoxon sign‐rank tests. Randomization tests (see Methods) revealed that differences in both frequency bands were reliable (all Pcorr's < 0.001). LORETA significance probability maps are based on P‐values (P's < 0.01, one‐tailed). Coordinates in Talairach space of the maximum‐value voxels are shown. Left: sagittal slices, seen from the left at X; middle: coronal slices, seen from the rear at Y; right: axial slices, seen from above at Z. X, Y, and Z are Talairach coordinates: X from left (“L”) to right (“R”); Y from posterior (“P”) to anterior (“A”); Z from basal to dorsal. [Color figure can be viewed in the online issue, which is available at wileyonlinelibrary.com.]
Effects of cuing and SAT on theta activity
Mean theta power, peak (maximum) theta power, and latency of peak theta power entered into separate four‐way ANOVAs with the within‐subject factors of Laterality (left, middle, right), Caudality (frontal, central, parietal), CUING (invalid, valid, no cue), and SAT (speed, accuracy).
Regarding mean theta power, the ANOVA revealed main effects of Laterality (F(2,78) = 121.4, P < 0.001), Caudality (F(2,78) = 5.0, P < 0.01), and a Laterality × Caudality interaction (F(4,156) = 5.9, P < 0.001), indicating that event‐related theta power increases were largest at mid‐central and mid‐parietal sites. In addition, the analysis showed a main effect of CUING (F(2,78) = 67.3, P < 0.001), a Laterality × CUING (F(4,156) = 26.6, P < 0.001), a Caudality × CUING (F(4,156) = 17.3, P < 0.001), and a Laterality × Caudality × CUING interaction (F(8,312) = 20.2, P < 0.001), arising from strong conflict‐induced theta effects at mid‐central electrode sites as reflected by increasing theta power from uncued trials to validly and invalidly cued trials (all t 39's > 5.8, all P's < 0.001). Importantly, the analysis also revealed a Laterality × SAT (F(2,78) = 2.6, P < 0.05) and a Caudality × SAT interaction (F(2,78) = 4.4, P < 0.05), indicating that theta power at mid‐central electrode sites was smaller in accuracy than in speed trials. Other interactions were nonsignificant (F's < 1.9).
When restricting the analysis to the mid‐central ROI, a two‐way ANOVA with the within‐subject factors of CUING (invalid, valid, no cue) and SAT (speed, accuracy) showed main effects of CUING (F(2,78) = 72.7, P < 0.001) and SAT (F(1,39) = 4.8, P < 0.05), and a CUING × SAT interaction (F(2,78) = 3.6, P < 0.05), indicating that SAT‐induced differences in mean theta power were reliable in invalidly cued trials (t 39 = 2.4, P < 0.05), but not in validly cued trials (t 39 = 1.3, P = 0.21) or uncued trials (t 39 < 1). Plotting of the time course of mean theta power as a function of CUING and SAT for the mid‐central ROI is shown in Figure 6A.
Figure 6.

Time courses of oscillatory activities in the two‐choice task. Time‐frequency spectrograms and time courses of (A) mean theta power and (B) mean beta power, both combined for mid‐central electrode sites, triggered to target onset. Combination of sites for each frequency band was based on significance of the interaction between SAT and ROIs (see Results). In the right side, point‐to‐point Wilcoxon sign‐rank tests (50 ms bins, P's < 0.05) showed (i) a significant theta power increase in the speed condition compared with the accuracy condition in (invalidly) cued trials and (ii) sustained SAT‐induced differences in beta power lasting until about 300 ms after target onset in all three response‐cuing conditions. [Color figure can be viewed in the online issue, which is available at wileyonlinelibrary.com.]
For peak theta power, the four‐way ANOVA revealed the same main effects and interaction as the analysis of mean theta power although with slightly different effect sizes. Consistently, for the mid‐central ROI, a two‐way ANOVA with the within‐subject factors of CUING (invalid, valid, no cue) and SAT (speed, accuracy) showed main effects of CUING (F(2,78) = 53.6, P < 0.001) and SAT (F(1,39) = 6.7, P < 0.05), and a CUING × SAT interaction (F(2,78) = 3.5, P < 0.05), indicating that SAT‐induced differences in peak theta power were reliable in invalidly cued trials (t 39 = 2.3, P < 0.05), but not in validly cued trials (t 39 = 1.6, P = 0.11) and uncued trials (t 39 < 1).
With respect to latency of peak theta power, the analysis showed a main effect of Caudality (F(2,78) = 83.0, P < 0.001), indicating that latency of peak theta power was highest at frontal electrode sites. In addition, the analysis showed a main effect of CUING (F(2,78) = 58.5, P < 0.001) and a Caudality × CUING interaction (F(4,156) = 3.4, P < 0.05), due to a higher latency of peak theta power in uncued trials (398 ms) than in validly (311 ms) and invalidly cued trials (336 ms), mainly at frontal electrode sites (uncued: 452 ms, validly cued: 364 ms, invalidly cued: 374 ms). All other main effects and interactions were nonsignificant (F's < 2.0).
Effects of cuing and SAT on beta activity
Mean beta power, peak (minimum) beta power, and latency of peak beta power also entered into four‐way ANOVAs with the within‐subject factors of Laterality (left, middle, right), Caudality (frontal, central, parietal), CUING (invalid, valid, no cue), and SAT (speed, accuracy).
With regard to mean beta power, the ANOVA revealed main effects of Laterality (F(2,78) = 33.3, P < 0.001), Caudality (F(2,78) = 40.6, P < 0.001), and a Laterality × Caudality interaction (F(4,156) = 20.8, P < 0.001), indicating that event‐related beta power decreases were largest at mid‐central electrode sites. Moreover, the analysis showed a main effect of CUING (F(2,78) = 7.6, P < 0.01) and both a CUING × Laterality (F(4,156) = 3.6, P < 0.05) and a CUING × Caudality interaction (F(4,156) = 3.6, P < 0.05), arising from strong priming effects at mid‐central electrode sites with smaller beta power both in validly and invalidly cued trials than in uncued trials (both t 39's > 5.6, both P's < 0.001). Beta power did not differ between validly and invalidly cued trials (t 39 < 1). Importantly, the analysis also revealed a main effect of SAT (F(1,39) = 5.3, P < 0.05) and a Laterality × Caudality × SAT interaction (F(4,156) = 3.1, P < 0.05). Beta power was smaller in speed than in accuracy trials at mid‐central electrode sites. Other interactions did not reach significance (F's < 1.9).
When restricting the analysis to the mid‐central ROI, a two‐way ANOVA with the within‐subject factors of CUING (invalid, valid, no cue) and SAT (speed, accuracy) showed main effects of CUING (F(2,78) = 16.0, P < 0.001) and SAT (F(1,39) = 5.4, P < 0.05), but no interaction between factors (F(2,78) < 1). Thus, the reduction of beta power in speed trials in comparison to accuracy trials was found for all cuing conditions. Plotting of the time course of beta power as a function of CUING and SAT for the mid‐central ROI is depicted in Figure 6B.
For peak beta power, the ANOVA showed main effects of Laterality (F(2,78) = 50.6, P < 0.001) and Caudality (F(2,78) = 55.2, P < 0.001), and a Laterality × Caudality interaction (F(4,156) = 21.1, P < 0.001), indicating that peak beta power was lowest at mid‐central electrode sites. No other main effect or interaction was found (all F's < 1.4). Thus, neither SAT instruction nor response cuing did affect peak beta power.
Regarding latency of peak beta power, the ANOVA revealed main effects of Laterality (F(2,78) = 5.6, P < 0.01), Caudality (F(2,78) = 5.9, P < 0.01), and a Laterality × Caudality interaction (F(4,156) = 8.8, P < 0.001), indicating that latency of peak beta power was highest at mid‐central electrode sites. Moreover, the analysis showed a main effect of CUING (F(2,78) = 7.6, P < 0.01), a Caudality × CUING (F(4,156) = 4.6, P < 0.01), and a Laterality × Caudality × CUING interaction (F(4,156) = 2.3, P < 0.05), suggesting that latency of peak beta power increased from validly cued trials (402 ms) to invalidly cued trials (423 ms) and uncued trials (444 ms), mainly at mid‐central electrode sites (validly cued: 402 ms, invalidly cued: 450 ms, uncued: 496 ms; all t 39's > 2.8, all P's < 0.01). Finally, the ANOVA also revealed a main effect of SAT (F(1,39) = 4.2, P < 0.05) with a higher latency in accuracy than in speed trials when averaged across all sites (430 ms vs. 416 ms). All other interactions were nonsignificant (F's < 2.0).
Brain–Behavior Correlations
Correlational analyses of brain activity in the SAT interval showed that, across response‐cuing conditions, individual differences in RT were positively related both to individual differences in mean alpha and mean beta power between accuracy and speed trials (alpha: r = 0.37, P < 0.05; beta: r = 0.49, P < 0.001; combined for respective sites as shown in Fig. 4). On the other hand, the relationship of individual differences in mean theta power and RT between SAT conditions was not significant (r = 0.17, P = 0.30). Thus, subjects with a larger difference in alpha and beta power between accuracy and speed trials showed a larger difference in RT.
In the two‐choice task, individual differences in RT and mean beta power between uncued and cued trials (combined for validly and invalidly cued trials) were positively related, both under speed (r = 0.32, P < 0.05) and accuracy emphasis (r = 0.46, P < 0.01). Subjects with a larger difference in beta power between uncued and cued trials showed a larger difference in RT. Moreover, individual differences in RT and mean theta power between invalidly and validly cued trials were negatively related, both in speed (r = −0.50, P < 0.01) and accuracy trials (r = −0.33, P < 0.05). Thus, subjects with a larger difference in theta power between invalidly and validly cued trials showed a smaller difference in RT between cuing conditions. With regard to SAT effects, across response‐cuing conditions, individual differences in RT and mean beta power between accuracy and speed trials (combined for mid‐central sites as shown in Fig. 6B) were positively related (r = 0.52, P < 0.001). On the other hand, individual differences in peak beta power at mid‐central sites between speed and accuracy trials were not found to be related to individual differences in RT (r = 0.04, P = 0.81).
DISCUSSION
The goal of this study was to examine controlled SAT in a two‐choice task with electrophysiological measurements of oscillatory brain activity. Consistent with prior behavioral work, we found response processing to be faster and more error‐prone in speed trials than in accuracy trials. In line with prior imaging work, SAT was found to be modulated by a change of baseline activity in visuo‐motor brain areas in the SAT baseline interval. Analysis of oscillatory brain activities preceding the two‐choice task showed that both alpha power in the occipital cortex and beta power in the motor cortex were affected by SAT instruction and predicted RT. Moreover, both alpha and beta power in the SAT baseline interval were related to SAT‐induced theta power generated in the ACC, indicating that the ACC could be involved in the adjustment of visuo‐motor brain processes. On the other hand, the results did not show an effect of SAT on peak beta power suggesting that response threshold of cortical motor activations may be unaffected by SAT. With regard to oscillatory brain activity in the two‐choice task, the results suggest that conflict processing in the ACC, but not response priming in the motor cortex, is affected by SAT.
Beta power in the SAT baseline interval was found to be affected by SAT instruction, indicating that SAT effects are related to a change of baseline activity in cortical motor areas. More precisely, instructing subjects to focus on speed instead of accuracy led to a decrease of mean beta power at central electrode cites lasting from SAT cue onset to movement execution in the two‐choice task. Source localization showed that SAT baseline differences in beta power were generated in the right and left motor cortex. The results are consistent with fMRI studies showing that emphasis on speed leads to sustained increases of BOLD activity in the SAT baseline interval in motor areas [Forstmann et al.,2008; Ivanoff et al.,2008; van Veen et al.,2008]. In contrast to mean beta power, peak beta power in the two‐choice task was unaffected by SAT instruction. SAT effects thus may have not been modulated by a change in response threshold. Consistent with the present beta power dynamics in SAT, Tzagarakis et al. [2010] recently reported a beta power decrease during response preparation in a reaching task with different degrees of uncertainty about stimulus location. In their task, response uncertainty affected mean beta power during response preparation but did not affect peak beta power at movement execution indicating that motor threshold of cortical activity is unaffected by the complexity of a motor task. The same was found for the present SAT experiment. Having said this, obviously, interpretations based on null effects always should be treated with caution. On the one hand, the present analysis may have lacked statistical power to reveal a difference in cortical motor threshold between SAT conditions. On the other hand, we measured cortical brain oscillations that sample only a subset of the total brain activity and, thus, threshold modulations may have been missed with the present analyses.
Posterior alpha power in the SAT baseline interval was also affected by SAT instruction, indicating that, in addition to motor processes, premotor processes of perception and attention are linked to SAT. In the literature, it has been proposed that increases of parieto‐occipital alpha power reflect functional inhibition that down‐regulates the impact of visual perception on information processing [Jensen and Mazaheri,2010; Klimesch et al.,2007]. Evidence for the inhibitory role of posterior alpha oscillations has been reported, amongst other things, for working memory [Jensen et al.,2002; Jokisch and Jensen,2007] and selective attention [Fu et al.,2001]. For example, visuo‐spatial attention studies have shown that when covert attention is directed to one hemifield, posterior alpha decreases in the contralateral but increases in the ipsilateral hemisphere [Thut et al.,2006; Worden et al.,2000]. Importantly, there is also evidence that posterior alpha power prior to an event affects perceptual processing: high prestimulus alpha power in posterior brain areas has been found to impair visual perception and visual discrimination [Hanslmayr et al.,2007; van Dijk et al.,2008]. Together, these findings point to an inhibitory role of posterior alpha power in perception and visuo‐spatial attention. On the basis of the inhibitory function of alpha oscillations, the present finding of enhanced posterior alpha power in accuracy trials compared with speed trials in the SAT baseline interval then may reflect functional inhibition that down‐regulates the impact of incoming visual information in order to reduce the probability of premature and erroneous responses when cued to be accurate in the task. Alternatively, the decrease of alpha activity in speed trials compared with accuracy trials may also reflect enhanced processing of upcoming stimuli in this condition. Thus, both inhibition of incoming visual information in accuracy trials and enhancement of visual processing in speed trials may account for SAT in the present experiment.
In addition to beta and alpha oscillations, SAT was also found to affect theta activity at mid‐central electrode sites in the SAT baseline interval. In prior studies, mid‐frontal theta activity, generated in the ACC, has been linked to focused attention [Delorme et al.,2007; Gomarus et al.,2006], conflict monitoring [Cavanagh et al.,2009; Hanslmayr et al.,2008], and working memory [Gevins et al.,1997; Jensen and Tesche,2002]. Recent studies also demonstrated that theta oscillations play an important role in visuo‐motor processing and sensori‐motor integration [Pastötter et al.,2010; Tombini et al.,2009; also see Tesche and Karhu,1999]. Sauseng et al. [2007] argued that theta power in the ACC reflects the activation of an attentional system that allocates cognitive resources in visuo‐motor processing and is related to mental effort. This proposal is in line with fMRI evidence for ACC involvement in the adjustment of visuo‐motor processing in response preparation and motor control [Mansouri et al.,2009; Paus,2001; Rushworth et al.,2004]. On the basis of this view, the increase of theta power in the ACC in accuracy trials compared with speed trials throughout the SAT baseline interval may reflect top‐down adjustment of visuo‐motor processing in order to balance between the competing demands of speed and accuracy. Consistently, correlational analysis showed that, in the SAT baseline interval, theta power in the ACC was related both to beta power in the motor cortex and alpha power in the occipital cortex. However, obviously, with the present statistical correlations, we can not infer a causal relationship between ACC activity and visuo‐motor processing in SAT control.
Arguably, due to the low spatial resolution of EEG, theta effects in other prefrontal brain areas than the ACC may have been missed in the present source analysis. In fact, Asada et al. [1999] argued that attentional processes as reflected by mid‐frontal theta power may be due to reciprocal connections between the ACC and other prefrontal regions. According to this, for example, the pre‐SMA, which has been found to show a higher BOLD signal in speed than in accuracy trials [Forstmann et al.,2008] may also account for SAT‐induced variance in theta power. In fact, a negative correlation between theta activity and the BOLD signal has been obsered in several regions [Scheeringa et al.,2009]. Such a contribution of pre‐SMA to SAT‐induced theta dynamics may also explain why, regarding the time courses of theta activity in the SAT interval, theta power goes back to baseline in the accuracy condition and even under the baseline level in the speed condition.
Consistent with recent work [Pastötter et al.,2010], the present results in the two‐choice task indicate that response cuing is related to a beta power decrease in the motor cortex, and conflict processing is linked to a theta power increase in the ACC. Going beyond this work, the present results suggest that conflict processing in the ACC is affected by SAT. Conflict‐induced theta power was found to be larger in speed than in accuracy trials at mid‐central electrode sites. This effect was most pronounced for invalidly cued targets and suggests that emphasis on speed enhances the potential of response conflict in the two‐choice task. Consistently, differences in conflict‐induced response errors between SAT conditions were most pronounced in invalidly cued trials. On the other hand, we did not find an effect of SAT on priming‐induced beta power differences between validly cued and uncued trials, suggesting that response priming is unaffected by SAT.
Together, the present findings indicate that SAT is related to a change in baseline activity of alpha and beta oscillations in parietal and motor areas both being related to SAT‐induced theta oscillations in the ACC. In contrast, they do not provide evidence for a change in response threshold. The results suggest that the ACC is involved in the adjustment of SAT baseline activity in visuo‐motor brain areas. Increased ACC activity indicates adjustment in favor of accuracy, decreased activity indicates adjustment in favor of speed. In addition, the present results show that conflict‐induced theta power in the ACC was more pronounced in speed than in accuracy trials, whereas priming‐related beta power dynamics in the motor cortex were unaffected by SAT. These findings indicate that conflict processing, but not response priming, depends on SAT. In sports science, recent studies examining rifle shooting in professional sportsmen found that high score shots were preceded both by high theta power in the ACC [Doppelmayr et al.,2008] and high alpha power in occipital brain areas [Del Percio et al.,2009]. The present findings suggest that these oscillatory correlates of high scoring in rifle shooting and, to close the circle, of successfully preparing the last and decisive shot in the Olympic biathlon, reflect SAT baseline modulations.
Acknowledgements
The authors thank C. Holterman for his help with data collection and two anonymous reviewers for their helpful suggestions on a previous version of the manuscript.
REFERENCES
- Aarts E, Roelofs A, van Turennout M ( 2008): Anticipatory activity in anterior cingulate cortex can be independent of conflict and error likelihood. J Neurosci 28: 4671–4678. [DOI] [PMC free article] [PubMed] [Google Scholar]
- Alegre M, Gurtubay IG, Labarga A, Iriarte J, Malanda A, Artieda J ( 2003): Alpha and beta oscillatory changes during stimulus‐induced movement paradigms: Effect of stimulus predictability. Neuroreport 14: 381–385. [DOI] [PubMed] [Google Scholar]
- Asada H, Fukuda Y, Tsunoda S, Yamaguchi M, Tonoike M ( 1999): Frontal midline theta rhythms reflect alternative activation of prefrontal cortex and anterior cingulate cortex in humans. Neurosci Lett 274: 29–32. [DOI] [PubMed] [Google Scholar]
- Band GPH, Ridderinkhof KR, van der Molen MW ( 2003): Speed‐accuracy modulation in case of conflict: The roles of activation and inhibition. Psychol Res 67: 266–279. [DOI] [PubMed] [Google Scholar]
- Başar E, Başar‐Eroglu C, Karakas S, Schürmann M ( 1999): Oscillatory brain theory: A new trend in neuroscience. IEEE Eng Med Biol 18: 56–66. [DOI] [PubMed] [Google Scholar]
- Blair RC, Karniski W ( 1993): An alternative method for significance testing of waveform difference potentials. Psychophysiology 30: 518–524. [DOI] [PubMed] [Google Scholar]
- Bogacz R, Brown E, Moehlis J, Holmes P, Cohen JD ( 2006): The physics of optimal decision making: A formal analysis of models of performance in two‐alternative forced‐choice tasks. Psychol Rev 113: 700–765. [DOI] [PubMed] [Google Scholar]
- Bogacz R, Wagenmakers EJ, Forstmann BU, Nieuwenhuis S ( 2010): The neural basis of the speed‐accuracy tradeoff. Trends Neurosci 33: 10–16. [DOI] [PubMed] [Google Scholar]
- Cavanagh JF, Cohen MX, Allen JJ ( 2009): Prelude to and resolution of an error: EEG phase synchrony reveals cognitive control dynamics during action monitoring. J Neurosci 29: 98–105. [DOI] [PMC free article] [PubMed] [Google Scholar]
- Delorme A, Westerfield M, Makeig S ( 2007): Medial prefrontal theta bursts precede rapid motor responses during visual selective attention. J Neurosci 27: 11949–11959. [DOI] [PMC free article] [PubMed] [Google Scholar]
- Del Percio C, Babiloni C, Bertollo M, Marzano N, Iacoboni M, Infarinato F, Lizio R, Stocchi M, Robazza C, Cibelli G, Comani S, Eusebi F ( 2009): Visuo‐attentional and sensorimotor alpha rhythms are related to visuo‐motor performance in athletes. Hum Brain Mapp 30: 3527–3540. [DOI] [PMC free article] [PubMed] [Google Scholar]
- Doppelmayr M, Finkenzeller T, Sauseng P ( 2008): Frontal midline theta in the pre‐shot phase of rifle shooting: Differences between experts and novices. Neuropsychologia 46: 1463–1467. [DOI] [PubMed] [Google Scholar]
- Forstmann BU, Dutilh G, Brown S, Neumann J, von Cramon DY, Ridderinkhof KR, Wagenmakers EJ ( 2008): Striatum and pre‐SMA facilitate decision‐making under time pressure. Proc Natl Acad Sci USA 105: 17538–17542. [DOI] [PMC free article] [PubMed] [Google Scholar]
- Frei E, Gamma A, Pascual‐Marqui RD, Lehmann D, Hell D, Vollenweider FX ( 2001): Localization of MDMA‐induced brain activity in healthy volunteers using low resolution brain electromagnetic tomography (LORETA). Hum Brain Mapp 4: 152–165. [DOI] [PMC free article] [PubMed] [Google Scholar]
- Fu KM, Foxe JJ, Murray MM, Higgins BA, Javitt DC, Schroeder CE ( 2001): Attention‐dependent suppression of distracter visual input can be cross‐modally cued as indexed by anticipatory parieto‐occipital alpha‐band oscillations. Brain Res Cogn Brain Res 12: 145–152. [DOI] [PubMed] [Google Scholar]
- Gevins A, Smith ME, McEvoy L, Yu D ( 1997): High‐resolution EEG mapping of cortical activation related to working memory: Effects of task difficulty, type of processing, and practice. Cereb Cortex 7: 374–385. [DOI] [PubMed] [Google Scholar]
- Gold JI, Shadlen MN ( 2007): The neural basis of decision making. Annu Rev Neurosci 30: 535–574. [DOI] [PubMed] [Google Scholar]
- Gomarus HK, Althaus M, Wijers AA, Minderaa RB ( 2006): The effects of memory load and stimulus relevance on the EEG during a visual selective memory search task: An ERP and ERD/ERS study. Clin Neurophysiol 117: 871–884. [DOI] [PubMed] [Google Scholar]
- Hanslmayr S, Aslan A, Staudigl T, Klimesch W, Herrmann CS, Bäuml KH ( 2007): Prestimulus oscillations predict visual perception performance between and within subjects. Neuroimage 37: 1465–1473. [DOI] [PubMed] [Google Scholar]
- Hanslmayr S, Pastötter B, Bäuml KH, Gruber S, Wimber M, Klimesch W ( 2008): The electrophysiological dynamics of interference during the Stroop task. J Cogn Neurosci 20: 215–225. [DOI] [PubMed] [Google Scholar]
- Hoechstetter K, Bornfleth H, Weckesser D, Ille N, Berg P, Scherg M ( 2004): BESA source coherence: A new method to study cortical oscillatory coupling. Brain Topogr 16: 233–238. [DOI] [PubMed] [Google Scholar]
- Ille N, Berg P, Scherg M ( 2002): Artifact correction of the ongoing EEG using spatial filters based on artifact and brain signal topographies. J Clin Neurophysiol 19: 113–124. [DOI] [PubMed] [Google Scholar]
- Ivanoff J, Branning P, Marois R ( 2008): fMRI evidence for a dual process account of the speed‐accuracy tradeoff in decision‐making. PLoS One 3: e2635. [DOI] [PMC free article] [PubMed] [Google Scholar]
- Jensen O, Gelfand J, Kounios J, Lisman JE ( 2002): Oscillations in the alpha band (9–12 Hz) increase with memory load during retention in a short‐term memory task. Cereb Cortex 73: 213–219. [DOI] [PubMed] [Google Scholar]
- Jensen O, Mazaheri A ( 2010): Shaping functional architecture by oscillatory alpha activity: Gating by inhibition. Front Hum Neurosci 4: 186. [DOI] [PMC free article] [PubMed] [Google Scholar]
- Jensen O, Tesche CD ( 2002): Frontal theta activity in humans increases with memory load in a working memory task. Eur J Neurosci 15: 1395–1399. [DOI] [PubMed] [Google Scholar]
- Jokisch D, Jensen O ( 2007): Modulation of gamma and alpha activity during a working memory task engaging the dorsal or ventral stream. J Neurosci 27: 3244–3251. [DOI] [PMC free article] [PubMed] [Google Scholar]
- Kaiser J, Birbaumer N, Lutzenberger W ( 2001): Event‐related beta desynchronization indicates timing of response selection in a delayed‐response paradigm in humans. Neurosci Lett 312: 149–152. [DOI] [PubMed] [Google Scholar]
- Kilner J, Bott L, Posada A ( 2005): Modulations in the degree of synchronization during ongoing oscillatory activity in the human brain. Eur J Neurosci 21: 2547–2554. [DOI] [PubMed] [Google Scholar]
- Klimesch W, Sauseng P, Hanslmayr S ( 2007): EEG alpha oscillations: The inhibition‐timing hypothesis. Brain Res Rev 53: 63–88. [DOI] [PubMed] [Google Scholar]
- Kriegeskorte N, Simmons WK, Bellgowan PS, Baker CI ( 2009): Circular analysis in systems neuroscience: The dangers of double dipping. Nat Neurosci 12: 535–540. [DOI] [PMC free article] [PubMed] [Google Scholar]
- Mansouri FA, Tanaka K, Buckley MJ ( 2009): Conflict‐induced behavioural adjustment: A clue to the executive functions of the prefrontal cortex. Nat Rev Neurosci 10: 141–152. [DOI] [PubMed] [Google Scholar]
- Neuper C, Pfurtscheller G ( 2001): Event‐related dynamics of cortical rhythms: Frequency‐specific features and functional correlates. Int J Psychophysiol 43: 41–58. [DOI] [PubMed] [Google Scholar]
- Nichols TE, Holmes AP ( 2002): Nonparametric permutation tests for functional neuroimaging: A primer with examples. Hum Brain Mapp 15: 1–25. [DOI] [PMC free article] [PubMed] [Google Scholar]
- Oken BS, Chiappa KH ( 1986): Statistical issues concerning computerized analysis of brainwave topography. Ann Neurol 19: 493–497. [DOI] [PubMed] [Google Scholar]
- Osman A, Lou L, Müller‐Gethmann H, Rinkenauer G, Mattes S, Ulrich R ( 2000): Mechanisms of speed‐accuracy tradeoff: Evidence from covert motor processes. Biol Psychol 51: 173–199. [DOI] [PubMed] [Google Scholar]
- Pascual‐Marqui RD ( 2002): Standardized low‐resolution brain electromagnetic tomography (sLORETA): Technical details. Methods Find Exp Clin 24 ( Suppl D): 5–12. [PubMed] [Google Scholar]
- Pascual‐Marqui RD, Michel CM, Lehmann D ( 1994): Low resolution electromagnetic tomography: A new method for localizing electrical activity in the brain. Int J Psychophysiol 7: 49–65. [DOI] [PubMed] [Google Scholar]
- Pastötter B, Hanslmayr S, Bäuml KH ( 2008): Inhibition of return arises from inhibition of response processes: An analysis of oscillatory beta activity. J Cogn Neurosci 20: 65–75. [DOI] [PubMed] [Google Scholar]
- Pastötter B, Hanslmayr S, Bäuml KHT ( 2010): Conflict processing in the anterior cingulate cortex constrains response priming. Neuroimage 50: 1599–1605. [DOI] [PubMed] [Google Scholar]
- Pastötter B, Schicker S, Niedernhuber J, Bäuml KHT ( 2011): Retrieval during learning facilitates subsequent memory encoding. J Exp Psychol Learn Mem Cogn 37: 287–297. [DOI] [PubMed] [Google Scholar]
- Paus T ( 2001): Primate anterior cingulate cortex: Where motor control, drive and cognition interface. Nat Rev Neurosci 2: 417–424. [DOI] [PubMed] [Google Scholar]
- Pfurtscheller G, Aranibar A ( 1977): Event‐related cortical desynchronization detected by power measurements of scalp EEG. Electroencephalogr Clin Neurophysiol 42: 817–826. [DOI] [PubMed] [Google Scholar]
- Pfurtscheller G, Lopes da Silva FH ( 1999): Event‐related EEG/MEG synchronization and desynchronization: Basic principles. Clin Neurophysiol 110: 1842–1857. [DOI] [PubMed] [Google Scholar]
- Rinkenauer G, Osman A, Ulrich R, Müller‐Gethmann H, Mattes S ( 2004): On the locus of speed‐accuracy trade‐off in reaction time: Inferences from the lateralized readiness potential. J Exp Psychol Gen 133: 261–282. [DOI] [PubMed] [Google Scholar]
- Rushworth MF, Walton ME, Kennerley SW, Bannerman DM ( 2004): Action sets and decisions in the medial frontal cortex. Trends Cogn Sci 8: 410–417. [DOI] [PubMed] [Google Scholar]
- Sauseng P, Hoppe J, Klimesch W, Gerloff C, Hummel FC ( 2007): Dissociation of sustained attention from central executive functions: Local activity and interregional connectivity in the theta range. Eur J Neurosci 25: 587–593. [DOI] [PubMed] [Google Scholar]
- Scheeringa R, Petersson KM, Oostenveld R, Norris DG, Hagoort P, Bastiaansen MC ( 2009): Trial‐by‐trial coupling between EEG and BOLD identifies networks related to alpha and theta EEG power increases during working memory maintenance. Neuroimage 44: 1224–1238. [DOI] [PubMed] [Google Scholar]
- Schouten JF, Bekker JA ( 1967): Reaction time and accuracy. Acta Psychol 27: 143–153. [DOI] [PubMed] [Google Scholar]
- Staudigl T, Hanslmayr S, Bäuml KHT ( 2010): Theta oscillations reflect the dynamics of interference in episodic memory retrieval. J Neurosci 30: 11356–11362. [DOI] [PMC free article] [PubMed] [Google Scholar]
- Tesche CD, Karhu J ( 1999): Interactive processing of sensory input and motor output in the human hippocampus. J Cogn Neurosci 11: 424–436. [DOI] [PubMed] [Google Scholar]
- Thut G, Nietzel A, Brandt SA, Pascual‐Leone A ( 2006): Alpha‐band electroencephalographic activity over occipital cortex indexes visuospatial attention bias and predicts visual target detection. J Neurosci 26: 9494–9502. [DOI] [PMC free article] [PubMed] [Google Scholar]
- Tombini M, Zappasodi F, Zollo L, Pellegrino G, Cavallo G, Tecchio F, Guglielmelli E, Rossini PM ( 2009): Brain activity preceding a 2D manual catching task. Neuroimage 47: 1735–1746. [DOI] [PubMed] [Google Scholar]
- Tzagarakis C, Ince NF, Leuthold AC, Pellizzer G ( 2010): Beta‐band activity during motor planning reflects response uncertainty. J Neurosci 30: 11270–11277. [DOI] [PMC free article] [PubMed] [Google Scholar]
- Van der Lubbe RHJ, Jaskowski P, Wauschkuhn B, Verleger R ( 2001): Influence of time pressure in a simple response task, a choice‐by‐location task, and the simon task. J Psychophysiol 15: 241–255. [Google Scholar]
- van Dijk H, Schoffelen JM, Oostenveld R, Jensen O ( 2008): Prestimulus oscillatory activity in the alpha band predicts visual discrimination ability. J Neurosci 28: 1816–1823. [DOI] [PMC free article] [PubMed] [Google Scholar]
- Van Veen V, Krug MK, Carter CS ( 2008): The neural and computational basis of controlled speed‐accuracy tradeoff during task performance. J Cogn Neurosci 20: 1952–1965. [DOI] [PubMed] [Google Scholar]
- Wickelgren WA ( 1977): Speed‐accuracy tradeoff and information processing dynamics. Acta Psychol 41: 67–85. [Google Scholar]
- Worden MS, Foxe JJ, Wang N, Simpson GV ( 2000): Anticipatory biasing of visuospatial attention indexed by retinotopically specific alpha‐band electroencephalography increases over occipital cortex. J Neurosci 20: RC63. [DOI] [PMC free article] [PubMed] [Google Scholar]
- Zhang Y, Chen Y, Bressler SL, Ding M ( 2008): Response preparation and inhibition: The role of the cortical sensorimotor beta rhythm. Neuroscience 156: 238–246. [DOI] [PMC free article] [PubMed] [Google Scholar]