

Abstract
The conceptual notion of the so‐called resting state of the brain has been recently challenged by studies indicating a continuing effect of cognitive processes on subsequent rest. In particular, activity in posterior parietal and medial prefrontal areas has been found to be modulated by preceding experimental conditions. In this study, we investigated which brain areas show working memory dependent patterns in subsequent baseline periods and how specific they are for the preceding experimental condition. During functional magnetic resonance imaging, 94 subjects performed a letter‐version of the n‐back task with the conditions 0‐back and 2‐back followed by a low‐level baseline in which subjects had to passively observe the letters appearing. In a univariate analysis, 2‐back served as control condition while 0‐back, baseline after 0‐back and baseline after 2‐back were modeled as regressors to test for activity changes between both baseline conditions. Additionally, we tested, using Gaussian process classifiers, the recognition of task condition from functional images acquired during baseline. Besides the expected activity changes in the precuneus and medial prefrontal cortex, we found differential activity in the thalamus, putamen, and postcentral gyrus that were affected by the preceding task. The multivariate analysis revealed that images of the subsequent baseline block contain task related patterns that yield a recognition rate of 70%. The results suggest that the influence of a cognitive task on subsequent baseline is strong and specific for some areas but not restricted to areas of the so‐called default mode network. Hum Brain Mapp 34:3010–3022, 2013. © 2012 Wiley Periodicals, Inc.
Keywords: fMRI, working memory, pattern classification, default mode network, inverse GLM
INTRODUCTION
The authors of this article cannot promise that the article at hand will have a lasting impact on the subsequent thinking of the reader. However, reading is a good example to illustrate that processing of information can last for a period of time that exceeds the pure perception of an article. The reading of a scientific article may cause subsequent judgment of the results, evaluation of the new concepts and ideas introduced in the study and estimation of their impact and contribution to the field. These processes impacting the brain's state are a direct consequence of the previously perceived information. Under this assumption, intrinsic unstimulated brain activity (also referred to as “resting state”) does not represent a stable and unique state in which the human brain remains in a “default mode”. Rather memories and impressions are resonated and processed continuously.
The predominant number of resting state studies focused on brain activity in pure resting periods and on functional networks which are more active during rest than during cognitive demanding tasks [Fransson, 2005; McKiernan et al., 2006; Thomason et al., 2008; Shmuel and Leopold, 2008; van den Heuvel et al., 2009; Shehzad et al., 2009; Meindl et al., 2009]. One prominent network is the default mode network (DMN) comprising medial frontal regions, the ventral anterior and the posterior cingulate cortex, the precuneus and the lateral parietal cortex [Gusnard and Raichle, 2001; Greicius et al., 2003; Beckmann et al., 2005; De Luca et al., 2006]. Consistently across task modalities and experimental designs, the DMN has been found to be more activated during rest periods than during attention demanding tasks [Shulman et al., 1997b; Mazoyer et al., 2001; McKiernan et al., 2003; Tamás Kincses et al., 2008]. Increased activity in this network has been associated with self‐monitoring and episodic memory processes.
The idea that task performance and stimulus selection can have a significant impact on default mode areas in subsequent rest, however, is rather new and has only been addressed by a few studies. In a study reported by Schneider et al. [2008], subjects were exposed to pictures with different emotional intensity and different degrees of self‐relatedness. They found a specific influence of self‐relatedness ratings on hemodynamic activity in subsequent rest, primarily in the ventral medial prefrontal cortex and the medial orbitofrontal cortex that could be distinguished from emotional valence and self‐related effects during observation of the images. Waites et al. [2005] investigated the effect of prior performance of an orthographic lexical retrieval task on resting‐state networks. In a comparison of rest before and after the activation task, widespread changes in functional connectivity were observed in all individuals. However, on the group level, the results point out only to a slightly increased functional connectivity of the posterior cingulate cortex (PCC) and the medial frontal gyrus with frontal lateral areas. A recent study of our own group explored the influence of cognitive load on subsequent rest [Pyka et al., 2009]. Twenty‐five subjects completed a letter‐version of the n‐back task including the conditions 0‐back, 1‐back, and 2‐back, separated by resting state blocks. Using independent component analysis (ICA), we identified a network whose time course was anticorrelated to the task demands with high overlap to the DMN. Activity after 1‐back and 2‐back was significantly higher than after 0‐back. As DMN activity has been associated with self‐referential processes, we hypothesized that demanding working memory tasks lead to increased subsequent cognitive processing of the own recent past in comparison to a the simple 0‐back task. Task‐rest interactions have also been observed outside default mode regions in the context of motor learning and memory consolidation [Albert et al., 2009; Tambini et al., 2010]. Albert and colleagues reported increased activity in a lateral fronto‐parietal and cerebellar resting state network after a 11‐min lasting visuomotor training task. Tambini et al. compared 8 min of resting state data before and after a 21‐min lasting encoding task and found increased functional connectivity between the right fusiform face area and the lateral occipital complex and between the right fusiform face area and the parahippocampal place after the object‐face encoding task. Overall, these studies provide evidence that resting state activity, both during short‐ and long‐term rest, is not only a correlate of intrinsic (default mode) processes in the unstimulated brain, but seems to be directly affected by preceding cognitive information. Thus, the resting state appears to be an obligatory part in the processing of information, which possibly has been underestimated so far.
In our previous study, ICA delivered a decomposition of the fMRI data that revealed a component associated with task‐rest interaction [Pyka et al., 2009]. Due to the nature of the ICA however, task‐related activity in the subsequent rest period could not be directly attributed to specific brain regions. In particular, it remained unclear whether task‐rest interactions are restricted to areas of the DMN or extend those. In this study, we therefore investigated the interaction of cognitive tasks and subsequent baseline periods in terms of its spatial distribution and discriminating power. We analyzed an independent dataset of 94 subjects who performed a similar letter‐version of the n‐back task as in our previous study [Pyka et al., 2009] containing 0‐back and 2‐back tasks with intermediate baseline periods lasting for 30 s. In contrast to our previous study, we did not use a “pure” resting phase but a low‐level baseline (letter fixation) in which subjects passively observed the same letters that occurred during 0‐back and 2‐back. Using a general linear model (GLM), we investigated which brain regions reveal differential activity between the two baseline phases, that is, between baseline after 2‐back (B2‐back) and baseline after 0‐back (B0‐back). Technically, we reversed the classical GLM, using 0‐back, B0‐back, and B2‐back as explanatory variables and 2‐back as unmodeled condition. With this model, we were able to treat both baseline blocks as separate conditions and could specifically address the question, which areas have higher activity during B2‐back compared with B0‐back and vice versa. We expected that regressors for B2‐back and B0‐back would reveal baseline activity modulated by preceding task type. On the basis of our previous findings [Pyka et al., 2009], we hypothesized that DMN areas, such as the precuneus and the medial prefrontal cortex, show significantly increased activity during B2‐back compared with B0‐back. We also assumed that the GLM analysis would indicate which areas beyond the DMN are modulated by cognitive load pointing to alterations in rest that are possibly specific for a working memory task, a question that could not directly be addressed within the previous analysis using ICA.
If the low‐level baseline activity is modulated by the preceding task, baseline data should also contain sufficient information to “forecast” the preceding task type on the level of individual subjects. We used two types of classifiers to assess the recognition of task condition from baseline activity. As several studies highlighted the precuneus as a key region of the DMN [Gusnard and Raichle, 2001; Greicius et al., 2003; Cavanna and Trimble, 2006; Yan et al., 2009], we hypothesized that in particular activity in the precuneus is predictive for the preceding task condition. In a first classification approach, we therefore used the individual beta values of the precuneus during B2‐back and B0‐back, obtained from the above GLM analysis, to classify the preceding task. In a second classification analysis, we additionally estimated the discriminating power of baseline activity using a pattern classification approach. Although in univariate analyses the explanatory power of regressors is estimated voxel‐wise, pattern classifiers such as Gaussian process classifiers take the multivariate pattern of brain responses into account. Therefore, pattern classifiers are supposed to be more sensitive for discriminating information than activity at a single location because areas that are of particular importance for the classification process do not have to reflect necessarily a selective hemodynamic increase or decrease. Rather, they represent a multivariate pattern that leads, in conjunction with other areas, to high predictability. This multivariate nature of machine learning approaches leads to increased sensitivity over univariate methods and allows single‐subject classification rather than group‐wise comparisons [O'Toole et al., 2007]. Although the potential for single‐subject classification has been recognized to be of particular value in biomarker research, pattern classification approaches have already been used to differentiate between experimental conditions. Such studies commonly use a brain activation patterns to infer a subject's cognitive state [Cox and Savoy, 2003; Carlson et al., 2003; Haynes and Rees, 2005; Davatzikos et al., 2005; Mourão‐Miranda et al., 2005; Kriegeskorte et al., 2006; Haynes and Rees, 2006; Marquand et al., 2010]. Although the univariate analysis in the present study reveals areas that are affected by the preceding task type, the multivariate approach is used to provide a quantitative measure for the overall impact of the working memory task on subsequent rest.
METHODS
Subjects
A total of 94 healthy subjects (66 men; mean age 23 years, s.d. ±3) were included in the study. All subjects were right‐handed, as assessed by the Edinburgh Inventory [Oldfield, 1971], and had no psychiatric, neurological or other medical disorders. After a complete description of the experimental procedure subjects provided written informed consent to participate in the study. The protocol was approved by the local ethics committee according to the declaration of Helsinki.
The data was originally collected as part of an ongoing study investigating the genetic basis of schizophrenia and bipolar disorder [see, e.g., Jansen et al., 2009]. Subjects were recruited through advertisements in local newspapers and postings at the campus of the University of Aachen. Inclusion criteria were age (18–55 years), right‐handedness (as assessed by the Edinburgh Inventory), no psychiatric disorders according to ICD‐10, no family history of schizophrenia or bipolar disorder, and Western‐ or Middle European descent. Of note, the sample was randomly drawn from a healthy population without any preselection on genetic features.
fMRI task
Participants performed a working memory task during fMRI data collection. The working memory task was a letter variant of the n‐back task [e.g., Krug et al., 2008; Jansen et al., 2009; Markov et al., 2010] with three different conditions: letter fixation as a high level baseline, 0‐back, and 2‐back, respectively. During the 0‐back condition, subjects were instructed to respond every time the letter “X” appeared. During the 2‐back condition, they were instructed to respond when the letter presented was identical to the second last letter. Responses were made with the right index finger on a response button (LUMItouchTM Lightwave Technologies, Richmond, BC, Canada). In each block and condition (including baseline), 19 red letters were presented on a black background in a pseudo‐randomized order using the Presentation software package (Neurobehavioral Systems Inc., San Francisco, CA). During each nonbaseline block seven targets required a response (target rate = 0.37). Each letter presentation trial consisted of a blank screen which was presented for 500 ms, followed by the letter presentation of 500 ms and a blank screen of 400 ms duration. In all conditions the blocks lasted for 30.5 s including an instruction screen that lasted for 3.5 s. The onset of the instruction was synchronized to the scanner pulse. Four 0‐back blocks (selective attentionlow working memory demands) were alternated with four 2‐back blocks (high working memory demands) with eight baseline blocks (letter fixation) in between the conditions. The whole fMRI task took 8 min and 8 s. As the experimental session ended with 2‐back without a subsequent baseline phase, we decided to omit the last 0‐back and 2‐back blocks for data analysis in order to have an equal number of 0‐back, 2‐back blocks and subsequent baseline blocks. Therefore, three 0‐back, 2‐back and their corresponding baseline blocks were included in this study.
fMRI Data Acquisition
All MRI data were acquired on a 3‐T TIM‐Trio MR scanner (Siemens Medical Systems) at the Forschungszentrum Jülich. Functional images were collected with a T 2 *‐weighted echo planar imaging (EPI) sequence sensitive to BOLD contrast (64 × 64 matrix, FOV = 200 mm, in plane resolution 3.13 mm, 36 slices, slice thickness = 3 mm, TR = 2.25 s, TE = 30 ms, flip angle = 90°). Slices covered the whole brain and were positioned transaxially parallel to the anterior–posterior commissural line (AC‐PC). The initial three images were excluded from analysis in order to remove the influence of T 1 saturation effects.
Data Analyses
The data were analyzed by two different approaches: first by a univariate GLM approach and second by a pattern classification approach.
Univariate analysis
SPM5 (http://www.fil.ion.ucl.ac.uk/spm) standard routines and templates were used for the preprocessing of the fMRI data. Functional images were realigned, normalized (resulting voxel size 2 × 2 × 2 mm3), smoothed with an 8‐mm Gaussian kernel and high‐pass filtered using a cut off period of 256 s. As a previous study indicates that DMN areas show the greatest activity in baseline periods after 2‐back (> baseline after 0‐back > 0‐back > 2‐back) [Pyka et al., 2009], we declared 2‐back as (unmodeled) control condition and included the letter fixation baseline condition after 2‐back, the letter fixation baseline condition after 0‐back and the 0‐back condition as regressors of interest and the instruction as regressor of no interest into the general linear model. On the second level, contrast images for the main effects B0‐back and B2‐back (the regressor of interest is weighted with one, the others with zero) were compared using a paired two‐sample t‐test with test specifically for activation activity differences between both conditions. All results are reported at P < 0.05, corrected for multiple comparisons using the family‐wise error (FWE) implementation in SPM5. Only clusters with a cluster size greater than 20 voxels are reported.
Exploration of potential confounds
The measured hemodynamic response can last over 15 s beyond stimulus presentation. One might therefore argue that the baseline block is contaminated by undershoot or overshoot effects of the previous hemodynamic response. To verify that activity differences between the two baseline periods are not simply associated to differences between the 2‐back and 0‐back condition, we performed post‐hoc two further analyses.
Analysis 1: To exclude the possibility that the B2‐back regressor explains variance of the unmodeled 2‐back block, subject‐wise time‐series of the clusters showing activity differences between B2‐back and B0‐back were reanalyzed by GLMs including 2‐back as regressor. The time series were extracted from a 6‐mm ROI centered at the peak coordinate of the cluster and were corrected, using the appropriate F‐contrast, for movement parameters and low frequency drifts (<0.01 Hz). To avoid over‐specification of the GLM, the instruction regressor was omitted. Beta‐values of B0‐back and B2‐back were compared by a paired two‐sample t‐test.
Analysis 2: Overshoot effects of preceding task conditions would be expected predominantly at the beginning of the baseline periods. In the second analysis, we therefore divided each baseline‐block in two parts lasting about 15 s each and tested whether activity differences between B2‐back and B0‐back were also present in the comparison of the second part of the baseline blocks, that is, in a time‐window that lays 15 s after the preceding n‐back task. If so, this would support the interpretation that activity differences between B2‐back and B0‐back are associated with neural differences between the baseline blocks and not simply with overshoot effects of the preceding task conditions.
Classification analyses
Classification by beta‐values
We conducted several types of classification. First, we performed goodness‐of‐fit analyses on the beta‐values of the precuneus to test the subject‐wise discriminative power between both baseline conditions. Goodness‐of‐fit analyses were performed in the following way. The coordinates of the precuneus were a priori defined as [−5, −54, 32] in the MNI space. These coordinates represent averaged values from previous findings in the precuneus region [Greicius et al., 2003; De Luca et al., 2006; Fransson, 2006; Yan et al., 2009] and were recently computed for another study [Pyka et al., in press]. To fully account for the subject‐wise difference between B0‐back and B2‐back beta‐values, we report how many beta‐values for the B2‐back regressors are greater than the corresponding beta‐value of the B0‐back regressor. This is the simplest measure to determine for each subject whether baseline activity followed 0‐back or 2‐back performance.
We also computed the accuracy for recognizing B0‐back and B2‐back for any possible cut‐off between all beta‐values without incorporating subject wise dependencies. In this type of classification, a high accuracy indicates similar relative signal changes from 2‐back to B0‐back and B2‐back across subjects. We report the threshold that leads to the best classification of both conditions as well as a receiver‐operating characteristic (ROC) curve depicting the general quality of this measure.
Classification through Gaussian process classifiers
Secondly, we used Gaussian Process Classifier (GPC) [Marquand et al., 2010] to find patterns in the data that discriminate between B0‐back and B2‐back. Classifiers such as GPC or Support Vector Machines (SVM) are trained by providing examples of the form 〈x,c〉 where x represents a spatial pattern and c is the class label (e.g., c = +1 for 0‐back and c = −1 for 2‐back). Each spatial pattern (e.g., averaged functional images) corresponds to a point in the input space and each voxel in the brain image represents one dimension of this space. During the training phase, the pattern recognition algorithm finds a decision function that separates the examples in the input space according to the class label. Once the decision function is determined from the training data, it can be used to recognize the class label of a new unseen test sample. The aim of this process is to find a decision function that not only classifies the training data correctly but also does the same for the test data, that is, classifies new samples into the correct categories. As a recent study has shown that GPCs perform at least as good as the more commonly used SVM [Marquand et al., 2010], Gaussian process classification was performed using a customized version of the Gaussian processes for machine learning (GPML) toolbox for Matlab (http://www.gaussianprocess.org/gpml).
For each subject, training/test data for the pattern classifier was generated by averaging the preprocessed images acquired during B0‐back and B2‐back [similar to Fu et al., 2008; Marquand et al., 2010]. To assure that the averaged images do not include hemodynamic increases or decreases that are related to changes of the experimental condition nor signal changes related to the instruction at the beginning of each condition, we included only the last seven scans acquired during the baseline (corresponding to 15.75 s of the baseline block). In the hemodynamic model, the selected images are situated in the middle of the experimental block convolved with the hemodynamic response function (HRF; Fig. 1). In sum, for each subject we created two images describing the mean activity during B0‐back and B2‐back, respectively, resulting in 94 × 2 = 188 samples of mean activity for the baseline block after task performance.
Figure 1.
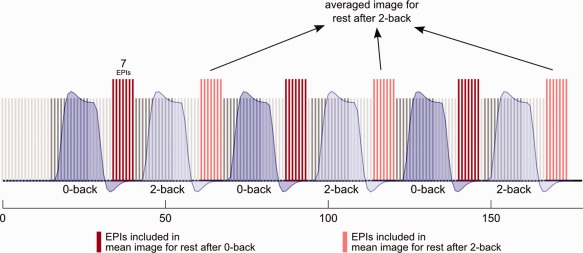
The experimental sequence included three alternating 0‐back and 2‐back blocks separated by baseline periods. Input data for the classifier were generated by averaging all functional images that belong to the same experimental condition. To account for the hemodynamic delay, only seven images that are clearly located behind an experimental block were taken. Red bars symbolize functional image acquired during baseline. [Color figure can be viewed in the online issue, which is available at http://wileyonlinelibrary.com.]
To assure that a high accuracy of classification is not evoked by signal changes at the cortex surface or in ventricles due to movements, we created a conservative EPI‐headmask that was applied on all samples. The EPI‐head mask was built by thresholding the EPI‐template of SPM5 at a manually chosen signal value of >0.1460 to exclude voxel at the border between cortex and skull. Furthermore, ventricles were excluded from the mask through subtracting the ventricle mask (with a dilatation of 1 voxel) provided by the WFU PickAtlas (http://fmri.wfubmc.edu/software/PickAtlas) from the EPI‐head mask. All averaged images that served as samples for the classifier were multiplied with the given EPI mask. For GPC, we used a linear covariance function and estimated hyperparameters controlling bias and regularization using an empirical Bayesian approach (further details can be found in Marquand et al., [2010]). As cross‐validation methods we chose leave‐one‐out cross‐validation, which has become one of the standard methods for training pattern classifiers [Kohavi, 1995; Fu et al., 2008; Pereira et al., 2009; Marquand et al., 2010]. In each leave‐one‐out run, data from all but one sample per group (S‐1 of S subjects) were used to train the classifier. Subsequently, the classifiers estimated for the remaining (and so far unseen) samples their class membership. This procedure was repeated S times, each time leaving out a different pair of samples, yielding to S prediction classifications for each condition. Thus, we obtained the sensitivity and specificity1 of the classifier to assign new samples to the correct class.
Additionally, we applied GPC on the beta‐maps for B0‐back and for B2‐back obtained from the GLM analysis of the univariate analysis (see above).
RESULTS
Univariate Analysis
A paired two‐sample t‐test for B0‐back and B2‐back revealed brain areas which are significantly more activated during baseline after 2‐back compared with baseline after 0‐back (Fig. 2). These areas comprise the precuneus/PCC, the medial prefrontal cortex or anterior cingulate cortex (both areas belong to the DMN) and clusters in the putamen, thalamus, postcentral gyrus/supplementary motor areas (Table 1). The opposite contrast, B0‐back > B2‐back, revealed no significant voxels that survived our correction method and significance level. An explorative depiction of the same contrast (P < 0.001, uncorrected) showed a cluster (k = 82) in the inferior temporal sulcus.
Figure 2.
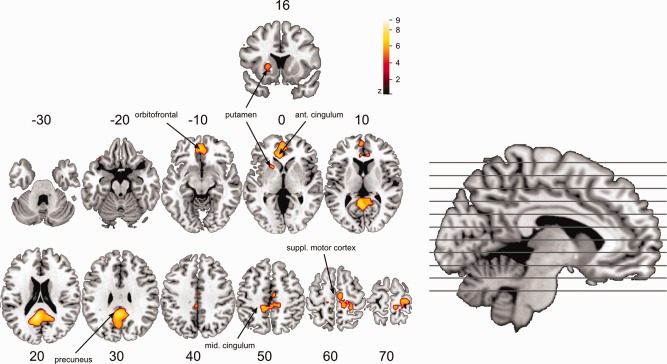
B2‐back versus B0‐back. Areas of increased activity during baseline after 2‐back (B2‐back) compared with baseline after 0‐back (B0‐back; P < 0.05, FWE‐corrected). Numbers above the slices denote the MNI z‐coordinate. [Color figure can be viewed in the online issue, which is available at http://wileyonlinelibrary.com.]
Table 1.
Clusters showing significant more activity during rest after 2‐back compared with rest after 0‐back
| Area | x (mm) | y (mm) | z (mm) | k | T score |
|---|---|---|---|---|---|
| Precuneus and PCC | −6 | −50 | 22 | 1922 | 7.67 |
| Postcentral and SMA | 24 | −36 | 66 | 754 | 6.13 |
| Medial prefrontal cortex | −6 | 34 | 4 | 945 | 6.35 |
| Thalamus | 0 | −12 | 6 | 75 | 5.78 |
| Paracentral lobule | −14 | −24 | 64 | 51 | 5.52 |
| Putamen | −20 | 16 | 4 | 71 | 5.46 |
| Orbitoinferior gyrus | −34 | 38 | 14 | 22 | 5.13 |
PCC, posterior cingulate cortex; SMA, supplementary motor area.
In order to understand how the differential activity in the reported clusters came off, we plotted the parameter estimates for the B0‐back, the B2‐back, and the 0‐back condition (Fig. 3). The plots reveal, as hypothesized, higher activity in DMN areas such as the precuneus/PCC and the medial prefrontal cortex or anterior cingulate cortex. Areas in the thalamus and putamen, however, showed a significant decrease in B0‐back but only little decrease during B2‐back. As these contrast estimates originate from 2‐back as baseline condition, activity is maintained after 2‐back on a similar level while during 0‐back those regions showed less activity. Clusters in the left and right postcentral gyrus or supplementary motor area were also stronger in B2‐back compared with B0‐back. The activity profile appears to be much more coherent with the precuneus/PCC and medial prefrontal cortex than the cluster found in the thalamus and putamen.
Figure 3.
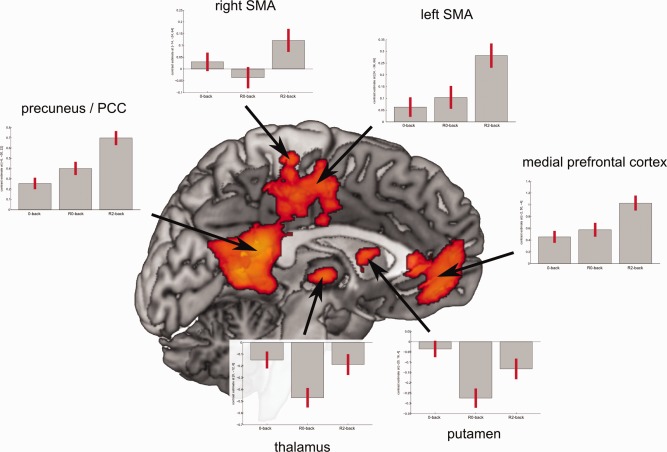
Parameter estimates for areas significantly more activated in the baseline period after 2‐back (B2‐back) compared with the baseline period after 0‐back (B0‐back). Gray bars represent average parameter estimate for the given regressor, red lines depict 90% confidence interval. [Color figure can be viewed in the online issue, which is available at http://wileyonlinelibrary.com.]
Exploration of potential confounds
As baseline activity is modulated by the preceding working memory condition, the hemodynamic changes of the previous task might have a confounding influence on the subsequent baseline block. In order to exclude these confounds as potential explanation, we performed post‐hoc two analyses.
Analysis 1: We extracted for each subject the time course of each cluster showing differences between B2‐back and B0‐back and calculated a GLM in which the instruction served as baseline, and 2‐back, 0‐back, B0‐back and B2‐back as regressors of interest. Paired t‐tests for the beta‐values of B0‐back and B2‐back for each subject yielded again significant differences towards the direction, depicted in Figure 3 (Table 2). This speaks against the argument that activity differences between B2‐back and B0‐back are purely an artifact of the GLM analysis strategy used.
Table 2.
Estimated differences between baseline after 2‐back (B2) and baseline after 0‐back (B0) for a general linear model with regressors for 0‐back, 2‐back, B0‐back, and B2‐back
| Area | B2‐B0 | P |
|---|---|---|
| Precuneus and PCC | 0.1775 (±0.0454) | <0.0001* |
| Postcentral and SMA | 0.0892 (±0.0173) | <0.0001* |
| Medial prefrontal cortex | 0.1183 (±0.0181) | <0.0001* |
| Thalamus | 0.1350 (±0.0489) | <0.0001* |
| Paracentral lobule | 0.0694 (±0.0139) | <0.0001* |
| Putamen | 0.0568 (±0.0135) | <0.0001* |
| Orbitoinferior gyrus | ‐0.0834 (±0.0215) | <0.0001* |
The instruction phase served as unmodeled control condition. All estimated differences reached a significance level of P < 0.05 corrected for multiple testing (P < 0.00714).
Analysis 2: In the second analysis, we divided the baseline‐regressors B0‐back and B2‐back in two parts which allowed us to test for baseline activation differences 15 s after task performance. Post hoc GLMs for the time courses of the reported clusters showed that even in a time frame of 15–30 s after the task signal increases after 2‐back performance were still present, supporting the interpretation that activity differences between B2‐back and B0‐back are associated with neural differences between the baseline blocks, not simply with overshoot effects of the preceding task conditions (Fig. 4 and Table 3) (for a whole‐brain analysis of the contrasts see the Supporting Information)
Figure 4.
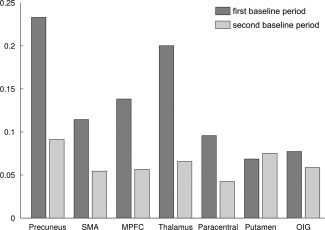
Parameter estimates for the first and second part of the baseline periods. Bar plots depict the increase of activity for the denoted regions from baseline after 0‐back to baseline after 2‐back. The first baseline period comprises the time window of 2–15 s of the baseline condition, the second baseline period comprises the time window of 16–28 s. All differential contrasts were significant except activity increases in the thalamus in the second baseline period (see Table 3).
Table 3.
Time‐series of the reported cluster were re‐analyzed by dividing the baseline regressors into two parts
| Area | B21‐B01 | P | B22‐B02 | P |
|---|---|---|---|---|
| Precuneus and PCC | 0.237 (±0.082) | <0.0001* | 0.088 (±0.078) | 0.0014* |
| Postcentral and SMA | 0.117 (±0.036) | <0.0001* | 0.052 (±0.038) | 0.0056* |
| Medial prefrontal cortex | 0.143 (±0.039) | <0.0001* | 0.053 (±0.036) | 0.0039* |
| Thalamus | 0.200 (±0.106) | <0.0001* | 0.065 (±0.104) | 0.0281 |
| Paracentral lobule | 0.095 (±0.027) | <0.0001* | 0.041(±0.019) | 0.0022* |
| Putamen | 0.061 (±0.031) | 0.0005* | 0.079 (±0.029) | <0.0001* |
| Orbitoinferior gyrus | 0.079 (±0.055) | 0.0006* | 0.057 (±0.036) | 0.0021* |
B21‐B01: averaged increase and variance from baseline after 0‐back to baseline after 2‐back for the first 15 s after task performance. B22‐B02: averaged increase and variance from baseline after 0‐back to baseline after 2‐back for the second part of the baseline period. The increase is given in differences of beta‐values. P‐values denote the probability of a significant difference for P < 0.05 corrected for multiple testing.
A third potential confound, the influence of the aftershoot effect of the HRF on the subsequent baseline phase, was investigated but could also be excluded (see Supporting Information). Numerous studies reported stronger deactivation of default mode areas with increasing working memory demands [e.g., Shulman et al. 1997; Mazoyer et al. 2001; McKiernan et al., 2006; Pyka et al., 2009]. In an additional analysis, we confirmed that task‐dependent deactivation can be observed in our study using a conventional analysis, which just includes 0‐back, 2‐back and baseline as unmodeled condition (see Supporting Information).
Classification Analyses
Given the assumption that a classifier is not able to recognize the correct class (real accuracy = 50%), in the present study the probability for a measured accuracy of more than 56% is P < 0.05. Thus, we regard everything beyond 56% as significant.2
On a pairwise inspection, beta‐values of the precuneus obtained from the B2‐back regressors of the 94 subjects were in 70.2% of the cases greater than the corresponding beta‐values of the B0‐back regressors. Relative increases of the precuneus during B0‐back and B2‐back in relation to 2‐back were also consistent enough to discriminate between both baseline conditions. The best cut‐off value that distinguishes B0‐back beta‐maps from B2‐back beta‐maps was 0.4977, yielding an accuracy of 67.6% (sensitivity: 57.5%, specificity: 77.7%, area under the curve (AUC): 0.71, P < 0.0001) (Fig. 5). Note that this type of classification takes not into account the pairwise difference between beta‐values. Differences in scaling and variance were not corrected here.
Figure 5.
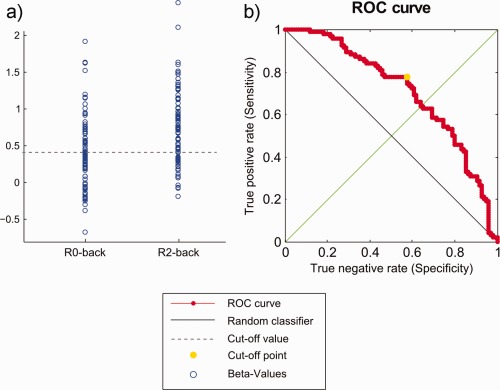
(a) Distribution of beta‐values for B0‐back and B2‐back for the precuneus at [−5, −54, 32]. (b) Receiver‐operating characteristic (ROC) curve for any cut‐off point between the minimum and maximum value. The yellow dot indicates the optimum cut‐off value for discriminating between B0‐back and B2‐back. [Color figure can be viewed in the online issue, which is available at http://wileyonlinelibrary.com.]
Classification of whole brain beta‐images from B0‐back and B2‐back using Gaussian processes revealed a specificity of 64.9% and a sensitivity of 80.9%. Overall, the classifier is able to recognize preceding task condition with an accuracy of 72.8%. From averaged preprocessed baseline data, the preceding task condition can be detected with a sensitivity of 67.0% and a specificity of 73.4%, leading to an accuracy of 70.2% (Table 4). The w‐maps obtained from the classification do not indicate that this prediction rate comes off by artefacts, such as motion (see Supporting Information).
Table 4.
Accuracy values for all types of classification conducted in this study
| Specificity (%) | Sensitivity (%) | Accuracy | |
|---|---|---|---|
| Beta‐maps | |||
| Goodness‐of–fit: paired | 70.2 | 70.2 | 70.2% (P < 0.0001) |
| Goodness‐of‐fit: unpaired | 57.5 | 77.7 | 67.6% (P = 0.0003) |
| GPC | 64.9 | 80.9 | 72.8% (P < 0.0001) |
| Averaged data | |||
| GPC | 67.0 | 73.4 | 70.2% (P < 0.0001) |
Goodness‐of‐fit analyses have been used on beta‐values at [−5, −54, 32]. GPC, Gaussian process classifier.
DISCUSSION
Numerous fMRI studies investigated the direct relation between experimental setups and increases and decreases of the hemodynamic response in specific brain areas. However, the extent to which cognitive tasks influence subsequent baseline activity remains unexplored so far. In this study, we investigated the influence of cognitive load in a working memory task on a subsequent low‐level baseline, using both univariate and multivariate analyses. As hypothesized, default mode areas, such as the precuneus and medial prefrontal cortex, were significantly more activated in the baseline period after 2‐back compared with baseline after 0‐back. The inversed GLM used in this study revealed additionally activity differences between both baseline conditions in smaller clusters in the thalamus, putamen and postcentral gyrus. No significant decreases in activity were found in the opposite contrast. The multivariate analysis revealed that the averaged fMRI images acquired during baseline after task performance discriminated with an accuracy of more than 70% whether subject performed a 0‐back or a 2‐back task in the preceding task block. The results indicate that baseline activity includes traits that are highly specific for the experimental condition of the immediate past and were, in a univariate sense, specific for certain brain regions. As this study included a low‐level baseline with letters occurring during rest, visual alterations can be excluded as potential confounds.
Only two studies indicated so far that both cognitive load [Pyka et al., 2009] as well as the degree of self‐relatedness of the presented stimuli [Schneider et al., 2008] might be modulating factors of DMN activity in subsequent short‐term rest. Long‐term rest (15 min) before and after a language task revealed on the group level only slight changes, possibly due to heterogeneous differences on the subject‐level [Waites et al., 2005]. The clusters in the precuneus and medial prefrontal cortex, that are stronger activated after 2‐back, are in good accordance with results from our previous study [Pyka et al., 2009]. Particularly, the precuneus has been denoted as the key region of the DMN as connectivity analyses of this region unfold the DMN best [Greicius et al., 2003; Waites et al., 2005]. In our study, this region had the highest z‐score and the largest cluster in the contrast B2‐back > B0‐back. Parameter estimates of the precuneus and the medial prefrontal cortex clearly support our previous finding that resting state activity in DMN areas parametrically increases from 2‐back over 0‐back and B0‐back to B2‐back. Interestingly, the contrast B2‐back versus B0‐back revealed further clusters, which are not typically seen as part of the DMN. Areas in the thalamus and putamen appear to be on a similar activity level during 2‐back, 0‐back, and B2‐back and showed only significantly less activity during B0‐back. Thus, both areas behave differently from the DMN but are also greatly affected in baseline periods by the preceding task condition. Furthermore, a cluster comprising the dorsal posterior cingulate cortex, the right postcentral gyrus and supplementary motor area was significantly more activated during B2‐back compared with B0‐back. The latter cluster touches also the representation level of the left index finger in the primary motor cortex (subjects responded with the right index finger). However, the cluster in the dorsal part of the brain is quite diffuse which makes it difficult to determine a local source for the hemodynamic increase in this area and therefore to distinguish between physiological effects induced by neural activity and offshoots of this source. For example, the cluster in the right SMA shows only increased activity during B2‐back, while activity during 2‐back, 0‐back, and B0‐back is approximately on the same level. The differential activity between B0‐back and B2‐back in this cluster could represent a sagging coupling effect with the contralateral homologue region, which shows a great activity increase after 2‐back. Similar analyses in independent samples would help here to determine the significance and the functional meaning of activity differences in these areas.
The strength of the task‐rest interaction is underlined by classification analyses in which we demonstrated that baseline activity can discriminate between preceding task conditions. Depending on the modality, classification accuracies between 67 and 72% have been reached. As expected, the precuneus itself showed enough reactivity during baseline to recognize preceding working memory load. The coordinates we chose to extract the beta‐values have been computed for a previous study [Pyka et al., in press] and were therefore not biased by the results of this study. However, they were also part of the cluster that showed significant more activity during B2‐back compared with B0‐back. Without incorporating pairwise dependencies, beta‐values of this region could be assigned to B0‐back and B2‐back with a significant accuracy of 67.6%. High values in this type of test indicate, that besides subject wise effects, relative signal changes in the precuneus (the parameter estimates, respectively) were stable enough across subjects to differentiate between both states. Gaussian process classifiers were able to predict classify B0‐back and B2‐back as well, based on beta‐maps (72.8%) and even on the averaged fMRI data (70.2%). Originally, we had expected that the classification based on GPCs would yield even better results than the classification based on beta‐values of the precuneus. One explanation for this relatively low performance of the GPCs would be that the input data simply does not contain more generalizable information. Another, more likely explanation is that the high dimensionality of the input data leads to overfitting in the learning stage which weakens the accuracy in the cross‐validation stage. If this holds true, the given accuracy rates of the GPCs would just represent a lower bound.
Given the strong influence that the 2‐back task exerts on the whole brain, one might suspect that the reported task‐rest‐interaction could be contaminated by the preceding task type itself. For the following reasons we believe that this is not the case: (1) In two post‐hoc analyses, we found that the observed increase of DMN activity after task performance cannot be explained by any aftereffects of the hemodynamic model and is also present 15 s after the task. (2) The observed changes have been found in specific brain areas implicated also in resting state processes, replicating previous findings [Pyka et al., 2009]. (3) Any pure vascular effects reflecting signal changes induced by 2‐back should also affect regions involved in working memory performance.
It is important to keep in mind, that subjects had no specific instruction for the intermediate baseline blocks except passively looking at the screen and waiting for the next instruction. Therefore, we hypothesize that task specific activity during subsequent interruptions originates from subconscious or at least automatic processes occurring after conscious task performance. Following this idea, we assume that these processes are possibly more triggered by the 2‐back task than by the 0‐back task. Although this study cannot clarify which activation level represents a natural, unstimulated baseline as the experimental design lacks of a somehow neutral baseline, we would favor the theory that baseline activity after 2‐back is increased compared with a “normal” baseline state. Previous studies have implicated DMN activity in self‐referential processing and episodic memory retrieval [Gusnard and Raichle, 2001; Buckner et al., 2008]. Recent results studies have focused on both processes and suggest that both domains activate overlapping but also separate regions [Cavanna and Trimble, 2006; Sajonz et al., 2010]. Self‐referential processes caused more pronounced activity in the anterior part of the precuneus for example, while memory processes lead to increased activity in the posterior and inferior part of the precuneus. According to these findings, peak activation coordinates of the clusters we found appear to be closer to those areas that have been associated with self‐referential processes. However, these areas are relatively large and comprise different anatomical areas in the medial frontal and parietal areas, making a location dependent interpretation of the data difficult. Furthermore, the differential effects observed in the DMN, putamen, thalamus and postcentral gyrus raise the question whether activity in these areas contribute to one specific kind of subsequent processing or whether we observed activity serving distinct processes that work parallel and independent from each other.
The different methodological approaches used in Pyka et al. [2009] and the present study have different implications in the interpretation of the results and should therefore be delineated from each other. In Pyka et al. [2009], we used ICA to decompose the brain voxels into statistically independent spatio‐temporal components and analyzed the component with the highest accordance to a DMN template. Thus, we selected the component according to a priori knowledge of its spatial distribution and reported the time course we found. In the present analysis, we had a priori assumptions about the time course and reported the brain areas which are correlated with it. The high overlap in medial posterior and frontal regions, which have higher activity after 2‐back, underlines the strong influence that cognitive load exerts on well‐known default mode areas. However, the critical question is: how to judge the meaning of regions that are either part of an independent component and/or significant in a GLM analysis? In ICA, the measured brain activity is assumed to be the sum of statistically independent networks. The result of an ICA represents therefore an optimal decomposition into statistically independent components where the explained variance is maximal. As one single brain area can be part of several independent components, the interpretation of the temporal dimension of an independent component can only be related to the whole spatial distribution of the component but not to an intrinsic property of a single anatomical brain area. In this regard, our previous analysis demonstrated that an optimal decomposition of the fMRI data contains an independent component that reveals lower activity in B2‐back than in B0‐back. The univariate analysis of this study relates differences between B2‐back and B0‐back activity directly to certain brain areas. In contrast to ICA, we disregard the assumption that lower activity of certain areas could be compensated by higher activity of overlapping functional networks but evaluate the observable modulatory effect of task on subsequent rest.
Some methodological considerations have to be noted. At first glance, it might appear counterintuitive to declare 2‐back as baseline condition and 0‐back, B0‐back, and B2‐back as experimental conditions in the GLM. However, besides the fact that it accounts, as demonstrated, pretty well for variability in baseline conditions, it might be a useful setup for other reasons. As noted by others [Waites et al., 2005; McKiernan et al., 2006], rest passive states are a much more heterogeneous state across subjects compared with periods in which attention has to be directed on a specific task. Therefore, 2‐back represents possibly a baseline condition which is much more stable compared with a low‐level baseline due to the specific task the subjects are asked to perform. Contrasts that are usually of interest, such as 2‐back versus 0‐back, can be displayed by weighting the 0‐back regressor with −1.
LIMITATIONS
The present study has some limitations. First, it is conceivable that after the less‐demanding 0‐back task subjects continued doing the task in the subsequent baseline phase while after 2‐back performance recovery processes would cause a more pronounced resting phase. In this case, DMN activity would be more diminished after 0‐back due to the additional attentional demands for the detection task. Second, the study is limited by the fact that cognitive meaningful patterns cannot be delineated from vascular effects. For example, local increases in the brain could cause the so‐called “vascular steal” effect [Buckner et al., 2008; Shmuel et al., 2001] of adjacent areas which would lead to a local decrease of hemodynamic activity in neighboring regions, and therefore, generating valuable information for the classifier. As the vascular reserve can accommodate changes in blood flow induced by cognitive functions [Heistad and Kontos, 1983] it has been argued that this effect is possibly of little relevance in functional neuroimaging [Gusnard and Raichle, 2001; McKiernan et al., 2003]. However, as breathing and cardiac rhythm were not measured during fMRI acquisition, they cannot be excluded as confounding factor for hemodynamic activity induced by task type, which remains a general concern for any working memory study.
Third, we used a fixed order of 2‐back and 0‐back conditions. The activation differences between the two baseline conditions (B2 and B0, respectively) could therefore be driven both by the preceding task conditions as well as by the anticipation of the next condition. However, we think that there are several reasons to favor our interpretation that the activation differences between the two baseline periods are mainly driven by the preceding task condition. First, the subjects did not know the task order of the experiment. The experimental design included only three 0‐back and three 2‐back blocks. The detection of a regular sequence of 0‐back and 2‐back blocks could therefore only be detected in later parts of the experiment. This should have significantly weakened the influence of anticipation effects. Second, we investigated the first and the second half of the rest sequence separately. Although we found in both parts of the rest block differential activity between B0 and B2, the effects were less pronounced in the second part of the resting phase. If resting state activity is primarily driven by the anticipation of the next task bock, we would have expected that the second part of the resting phase shows stronger differences than the resting phase immediately following the task. In sum, we cannot exclude the possibility that activation differences between B0 and B2 are also driven by anticipation effects. Future studies investigating task‐rest interactions should therefore use a task design in which task conditions are randomly presented. Our data however strongly suggest that the influence of the preceding task condition on brain activity in the resting phases is stronger than anticipation effects.
CONCLUSION
In conclusion, this study demonstrated that working memory demands exert a strong influence on subsequent baseline periods in specific brain regions. These areas comprise the precuneus or posterior cingulate cortex and the medial prefrontal cortex, which represent the key areas of the DMN, as well as the thalamus, putamen and dorsal cingulate cortex or postcentral gyrus. Furthermore, the multivariate analysis demonstrated that the preceding task condition can be recognized from subsequent baseline periods lasting as long as 30 s with an accuracy of at least 70%. Overall, these results suggest treating low‐level baseline periods, depending on the preceding task type, as separate experimental conditions. The differential activity in some areas between baseline after 0‐back and baseline after 2‐back raise the question whether functional correlates of the task in subsequent rest depend on the redistribution of attention resources or on specific self‐reflective or memory processes induced by working memory load. When analyzing the resting state in fMRI studies with a cognitive task it is important to keep in mind that resting state patterns are possibly a direct result of preceding task performance. Analyses of baseline states after different cognitive tasks could be a mean to resolve the modulating factors of these after effects.
Supporting information
Supporting Information
Footnotes
Sensitivity = TP/(TP+FN), Specificity = TN/(TN+FP), TP: true positives, FP: false positives, TN: true negatives, FN: false negatives
The value was obtained by estimating k, that the probability P(X ≥ k) ≤ 0.05, where X is a random variable with a binomial distribution for 2 × 94 = 188 trials and a dichotomic probability of 0.5 (two class) (Pereira et al., 2009).
REFERENCES
- Albert NB, Robertson EM, Miall RC (2009): The resting human brain and motor learning. Curr Biol 19:1023–1027. [DOI] [PMC free article] [PubMed] [Google Scholar]
- Beckmann CF, DeLuca M, Devlin JT, Smith SM (2005): Investigations into resting‐state connectivity using independent component analysis. Philos Trans R Soc London Ser B Biol Sci 360:1001–1013. [DOI] [PMC free article] [PubMed] [Google Scholar]
- Buckner RL, Andrews‐Hanna JR, Schacter DL (2008): The brain's default network: Anatomy, function, and relevance to disease. Ann NY Acad Sci 1124:1–38. [DOI] [PubMed] [Google Scholar]
- Carlson TA, Schrater P, He S (2003): Patterns of activity in the categorical representations of objects. J Cognitive Neurosci 15:704–717. [DOI] [PubMed] [Google Scholar]
- Cavanna AE, Trimble MR (2006): The precuneus: A review of its functional anatomy and behavioural correlates. Brain: J Neurol 129:564–583. [DOI] [PubMed] [Google Scholar]
- Cox DD, Savoy RL (2003): Functional magnetic resonance imaging (fMRI) “brain reading”: Detecting and classifying distributed patterns of fMRI activity in human visual cortex. NeuroImage 19:261–270. [DOI] [PubMed] [Google Scholar]
- Davatzikos C, Ruparel K, Fan Y, Shen DG, Acharyya M, Loughead JW, Gur RC, Langleben DD (2005): Classifying spatial patterns of brain activity with machine learning methods: Application to lie detection. NeuroImage 28:663–668. [DOI] [PubMed] [Google Scholar]
- De Luca M, Beckmann CF, De Stefano N, Matthews PM, Smith SM (2006): fMRI resting state networks define distinct modes of long‐distance interactions in the human brain. NeuroImage 29:1359–1367. [DOI] [PubMed] [Google Scholar]
- Fransson P (2005): Spontaneous low‐frequency BOLD signal fluctuations: An fMRI Investigation of the Resting‐state default mode of brain function hypothesis. Imaging 29:15–29. [DOI] [PMC free article] [PubMed] [Google Scholar]
- Fransson P (2006): How default is the default mode of brain function? Further evidence from intrinsic BOLD signal fluctuations. Neuropsychologia 44:2836–2845. [DOI] [PubMed] [Google Scholar]
- Fu CHY, Mourao‐miranda J, Costafreda SG, Khanna A, Marquand AF, Williams SCR, Brammer MJ (2008): Pattern classification of sad facial processing: Toward the development of neurobiological markers in depression. Biol Psychiatr 63:656–662. [DOI] [PubMed] [Google Scholar]
- Greicius MD, Krasnow B, Reiss AL, Menon V (2003): Functional connectivity in the resting brain: A network analysis of the default mode hypothesis. Proc Natl Acad Sci USA 100:253–258. [DOI] [PMC free article] [PubMed] [Google Scholar]
- Gusnard D, Raichle M (2001): Searching for a baseline: Functional imaging and the resting human brain. Nat Rev Neurosci 2:685–694. [DOI] [PubMed] [Google Scholar]
- Haynes JD, Rees G (2005): Predicting the orientation of invisible stimuli from activity in human primary visual cortex. Nat Neurosci 8:686–691. [DOI] [PubMed] [Google Scholar]
- Haynes JD, Rees G (2006): Decoding mental states from brain activity in humans. Nat Rev Neurosci 7:523–534. [DOI] [PubMed] [Google Scholar]
- Heistad D, Kontos H (1983): The cardiovascular system In: Sheppard J, Abboud F, editors.Handbook of Physiology. Maryland:American Physiological Society,137–182. [Google Scholar]
- Jansen A, Krach S, Krug A, Markov V, Eggermann T, Zerres K, Stöcker T, Shah NJ, Nöthen MM, Treutlein J, Rietschel M, Kircher T (2009): A putative high risk diplotype of the G72 gene is in healthy individuals associated with better performance in working memory functions and altered brain activity in the medial temporal lobe. NeuroImage 45:1002–1008. [DOI] [PubMed] [Google Scholar]
- Kohavi R (1995): A Study of Cross‐Validation and Bootstrap for Accuracy Estimation and Model Selection. In: Proceedings of the Fourteenth International Joint Conference on Artificial Intelligence, IJCAI 95, Montréal, Québec, Canada, August 20–25 1995. San Francisco, CA, USA: Morgan Kaufmann Publishers Inc.1137–1143.
- Kriegeskorte N, Goebel R, Bandettini P (2006): Information‐based functional brain mapping. Proc Natl Acad Sci USA 103:3863–3868. [DOI] [PMC free article] [PubMed] [Google Scholar]
- Krug A, Markov V, Eggermann T, Krach S, Zerres K, Stöcker T, Shah NJ, Schneider F, Nöthen MM, Treutlein J, Rietschel M, Kircher T (2008): Genetic variation in the schizophrenia‐risk gene neuregulin1 correlates with differences in frontal brain activation in a working memory task in healthy individuals. NeuroImage 42:1569–1576. [DOI] [PubMed] [Google Scholar]
- Markov V, Krug A, Krach S, Jansen A, Eggermann T, Zerres K, Stöcker T, Shah NJ, Nöthen MM, Treutlein J, Rietschel M, Kircher T (2010): Impact of schizophrenia‐risk gene dysbindin 1 on brain activation in bilateral middle frontal gyrus during a working memory task in healthy individuals. Human Brain Mapping 31:266–275. [DOI] [PMC free article] [PubMed] [Google Scholar]
- Marquand A, Howard M, Brammer M, Chu C, Coen S, Mourão‐Miranda J (2010): Quantitative prediction of subjective pain intensity from whole‐brain fMRI data using Gaussian processes. NeuroImage 49:2178–2189. [DOI] [PubMed] [Google Scholar]
- Mazoyer B, Zago L, Mellet E, Bricogne S, Etard O, Houde O, Crivello F, Joliot M, Petit L (2001): Cortical networks for working memory and executive functions sustain the conscious resting state in man. Brain Res 54:287–298. [DOI] [PubMed] [Google Scholar]
- McKiernan KA, Kaufman JN, Kucera‐Thompson J, Binder JR (2003): A parametric manipulation of factors affecting task‐induced deactivation in functional neuroimaging. J Cognitive Neurosci 15:394–408. [DOI] [PubMed] [Google Scholar]
- McKiernan K, D'Angelo B, Kaufman J, Jeffrey R (2006): Interrupting the “stream of consciousness”: An fMRI investigation. Neuroimage 29:1185–1191. [DOI] [PMC free article] [PubMed] [Google Scholar]
- Meindl T, Teipel S, Elmouden R, Mueller S, Koch W, Dietrich O, Coates U, Reiser M, Glaser C (2009): Test‐retest reproducibility of the default‐mode network in healthy individuals. Human Brain Mapping 31:237–246. [DOI] [PMC free article] [PubMed] [Google Scholar]
- Mourão‐Miranda J, Bokde ALW, Born C, Hampel H, Stetter M (2005): Classifying brain states and determining the discriminating activation patterns: Support Vector Machine on functional MRI data. NeuroImage 28:980–995. [DOI] [PubMed] [Google Scholar]
- Oldfield RC (1971): The assessment and analysis of handedness: The Edinburgh inventory. Neuropsychologia 9:97–113. [DOI] [PubMed] [Google Scholar]
- O'Toole AJ, Jiang F, Abdi H, Pénard N, Dunlop JP, Parent MA (2007): Theoretical, statistical, and practical perspectives on pattern‐based classification approaches to the analysis of functional neuroimaging data. J Cognitive Neurosci 19:1735–1752. [DOI] [PubMed] [Google Scholar]
- Pereira F, Mitchell T, Botvinick M (2009): Machine learning classifiers and fMRI: A tutorial overview. NeuroImage 45:S199–S209. [DOI] [PMC free article] [PubMed] [Google Scholar]
- Pyka M, Beckmann CF, Schöning S, Hauke S, Heider D, Kugel H, Arolt V, Konrad C (2009): Impact of working memory load on FMRI resting state pattern in subsequent resting phases. PloS One 4:e7198. [DOI] [PMC free article] [PubMed] [Google Scholar]
- Pyka M, Burgmer M, Lenzen T, Pioch R, Dannlowski U, Pfleiderer B, Ewert AW, Heuft G, Arolt V, Konrad C (2011): Brain correlates of hypnotic paralysis — A resting‐state fMRI study. NeuroImage 56:2173–2182. [DOI] [PubMed] [Google Scholar]
- Sajonz B, Kahnt T, Margulies DS, Park SQ, Wittmann A, Stoy M, Ströhle A, Heinz A, Northoff G, Bermpohl F (2010): Delineating self‐referential processing from episodic memory retrieval: Common and dissociable networks. NeuroImage 50:1606–1617. [DOI] [PubMed] [Google Scholar]
- Schneider F, Bermpohl F, Heinzel a, Rotte M, Walter M, Tempelmann C, Wiebking C, Dobrowolny H, Heinze HJ, Northoff G (2008): The resting brain and our self: Self‐relatedness modulates resting state neural activity in cortical midline structures. Neuroscience 157:120–131. [DOI] [PubMed] [Google Scholar]
- Shehzad Z, Kelly AMC, Reiss PT, Gee G, Gotimer K, Uddin LQ, Lee SH, Petkova E, Castellanos FX, Milham MP (2009): The resting brain: Unconstrained yet reliable. Cerebral Cortex 19:2209–2229. [DOI] [PMC free article] [PubMed] [Google Scholar]
- Shmuel A, Leopold DA (2008): Neuronal correlates of spontaneous fluctuations in fMRI signals in monkey visual cortex: Implications for functional connectivity at rest. Human Brain Mapping 761:751–761. [DOI] [PMC free article] [PubMed] [Google Scholar]
- Shmuel A, Yacoub E, Pfeuffer J, Van De Moortele PF, Adriany G, Ugurbil K, Hu X (2001): Negative BOLD response and its coupling to the positive response in the human brain. Neuroimage 13:S1005. [DOI] [PubMed] [Google Scholar]
- Shulman GL, Fiez J, Corbetta M, Buckner RL, Miezin F, Raichle ME, Petersen SE (1997a): Common blood flow changes across visual tasks: Decreases in cerebral cortex. J Cognitive Neurosci 9:648–663. [DOI] [PubMed] [Google Scholar]
- Tamás Kincses Z, Johansen‐Berg H, Tomassini V, Bosnell R, Matthews PM, Beckmann CF (2008): Model‐free characterization of brain functional networks for motor sequence learning using fMRI. NeuroImage 39:1950–1958. [DOI] [PubMed] [Google Scholar]
- Tambini A, Ketz N, Davachi L (2010): Enhanced brain correlations during rest are related to memory for recent experiences. Neuron 65:280–290. [DOI] [PMC free article] [PubMed] [Google Scholar]
- Thomason ME, Chang CE, Glover GH, Gabrieli JD, Greicius MD, Gotlib IH (2008): Default‐mode function and task‐induced deactivation have overlapping brain substrates in children. Magn Reson Imag 41:1493–1503. [DOI] [PMC free article] [PubMed] [Google Scholar]
- van den Heuvel MP, Mandl RCW, Kahn RS, Hulshoff Pol HE (2009): Functionally linked resting‐state networks reflect the underlying structural connectivity architecture of the human brain. Human Brain Mapping 30:3127–3141. [DOI] [PMC free article] [PubMed] [Google Scholar]
- Waites AB, Stanislavsky A, Abbott DF, Jackson GD (2005): Effect of prior cognitive state on resting state networks measured with functional connectivity. Human Brain Mapping 24:59–68. [DOI] [PMC free article] [PubMed] [Google Scholar]
- Yan C, Liu D, He Y, Zou Q, Zhu C, Zuo X, Long X, Zang Y (2009): Spontaneous brain activity in the default mode network is sensitive to different resting‐state conditions with limited cognitive load. PloS One 4:e5743. [DOI] [PMC free article] [PubMed] [Google Scholar]
Associated Data
This section collects any data citations, data availability statements, or supplementary materials included in this article.
Supplementary Materials
Supporting Information