

Abstract
Prader‐Willi syndrome (PWS) is a genetically determined neurodevelopmental disorder presenting with behavioral symptoms including hyperphagia, disinhibition, and compulsive behavior. The behavioral problems in individuals with PWS are strikingly similar to those in patients with frontal pathologies, particularly those affecting the orbitofrontal cortex (OFC). However, neuroanatomical abnormalities in the frontal lobe have not been established in PWS. The aim of this study was to look, using volumetric analysis, for morphological changes in the frontal lobe, especially the OFC, of the brains of individuals with PWS. Twelve adults with PWS and 13 age‐ and gender‐matched control subjects participated in structural magnetic resonance imaging (MRI) scans. The whole‐brain images were segmented and normalized to a standard stereotactic space. Regional gray matter volumes were compared between the PWS group and the control group using voxel‐based morphometry. The PWS subjects showed small gray‐matter volume in several regions, including the OFC, caudate nucleus, inferior temporal gyrus, precentral gyrus, supplementary motor area, postcentral gyrus, and cerebellum. The small gray‐matter volume in the OFC remained significant in a separate analysis that included total gray matter volume as a covariate. These preliminary findings suggest that the neurobehavioral symptoms in individuals with PWS are related to structural brain abnormalities in these areas. Hum Brain Mapp, 2011. © 2010 Wiley‐Liss, Inc.
Keywords: Prader‐Willi syndrome, neurodevelopmental disorder, abnormal eating behavior, compulsive behavior, voxel‐based morphometry, orbitofrontal cortex
INTRODUCTION
Prader‐Willi syndrome (PWS) is a neurodevelopmental disorder characterized by muscular hypotonia, hyperphagia, childhood‐onset obesity, hypogonadism, and mild to moderate growth and mental retardation [Holm et al.,1993]. Its prevalence is estimated at approximately one in 29,000 live births [Whittington et al.,2001]. PWS, which affects males and females equally, is known to be caused by a lack of paternal genetic information at 15q11‐q13 due to a microdeletion on the paternal chromosome (70%), maternal uniparental disomy (25%), or imprinting defects [Glenn et al.,1997].
A higher prevalence of behavioral problems, as well as impaired intellectual development, has been reported in individuals with PWS in comparison with those with other genetic syndromes [Dykens and Kasari,1997]. The most common behavioral symptoms are food‐related problems, i.e., hyperphagia with progressive obesity, intense preoccupation with food, and incessant food seeking [Holm et al.,1993; Ogura et al.,2008]. Individuals with PWS also tend to have outbursts of temper, rigid thinking, repetitive speech, compulsive behavior, and collecting behavior [Holm et al.,1993; Ogura et al.,2008]. These behavioral problems in individuals with PWS are strikingly similar to those observed in patients with frontal pathologies affecting the orbitofrontal cortex (OFC) [Anderson et al.,2005; Kim and Lee,2002; Uher and Treasure,2005; Woolley et al.,2007].
Despite the serious neurobehavioral symptoms associated with PWS, little is known about the neurobiology and brain development of these subjects. Autopsy studies of PWS individuals have reported neuropathologic changes, including cortical atrophy, ventriculomegaly, abnormalities in cerebellar dentate nucleus, disorganization of the neuronal cell layer, neuronal cellular loss, and neuronal heterotopia in cerebral white matter and brain stem [Hayashi et al.,1992; Stevenson et al.,2004]. Magnetic resonance imaging (MRI) studies have also revealed non‐specific morphological abnormalities similar to those reported in postmortem studies of PWS [Hashimoto et al.,1998; Leonard et al.,1993; Miller et al.,2007a; Titomanlio et al.,2006; Yoshii et al.,2002].
Recently, some neuroimaging studies have shown that subjects with PWS had changes in regional activity in some brain regions. In a functional MRI (fMRI) study, Shapira et al. [2005] reported that, after glucose administration, three individuals with PWS showed delayed signal reduction in the OFC, hypothalamus, and nucleus accumbens, along with signal increases in the dorsolateral prefrontal cortex and insula. Two other fMRI studies comparing subjects with PWS and normal controls demonstrated increased activity in the ventromedial prefrontal cortex (near the OFC) [Miller et al., 2007b] and OFC [Holsen et al.,2006] in response to food stimuli after eating. A positron emission tomography (PET) study showed the absence of normal changes in the OFC in PWS subjects during a task requiring the subjects to choose food items after a meal [Hinton et al.,2006]. Another PET study reported that cerebral glucose metabolism at rest increased in the OFC and in some regions in the frontal and temporal lobes in PWS subjects [Kim et al.,2006]. Although the findings of these neuroimaging studies suggest that there may be a specific relationship between neurobehavioral symptoms and functional abnormality in the OFC in subjects with PWS, no studies published to date have provided evidence for neuroanatomical changes in this area in these subjects.
In this study, we compared the brain structures of adults with genetically determined PWS with those of control subjects matched for age and gender, using voxel‐based morphometry (VBM), a fully automated, whole‐brain, unbiased, MRI‐based technique capable of detecting regionally specific differences in brain tissue composition [Ashburner and Friston,2000]. On the basis of the findings of the studies cited above, we hypothesized that subjects with PWS have morphological changes in the frontal lobe, especially in the OFC.
METHODS
Subjects
The study was approved by the Institutional Review Board of Tohoku University. Written informed consent was obtained from all subjects and from all parents of PWS individuals after the study procedure had been fully explained. The study was done in line with the Declaration of Helsinki. Fifteen adults with PWS were recruited through the Japan PWS Society (Takenoko No Kai), which consists of individuals who have been clinically diagnosed as having PWS, their families, and supporting members. All subjects with PWS were diagnosed on the basis of clinical criteria for PWS [Holm et al.,1993]. The criteria are based on a weighted scoring system consisting of major criteria, minor criteria, and supportive findings. For instance, the major criteria include infantile hypotonia, failure to thrive, hypogonadism, developmental delay, mental retardation (33% have an IQ of 50–70), childhood‐onset (after the age of 12 months but before the age of six years) hyperphagia and morbid obesity, characteristic facial features, and chromosome 15 deletion. We confirmed the genetic diagnosis of PWS by fluorescence in‐situ hybridization using the SNURF‐SNURPN probe and proximal (D15Z1) and distal (PML) chromosome‐15 control probes [Glenn et al.,1997]. Fourteen subjects exhibited deletion on chromosome 15q11‐q13. One subject had a Robertsonian translocation on chromosome 15 and was excluded from the study due to the possibility of clinical symptoms that differed from those of subjects with deletion [Holland et al.,2003]. One subject with a deletion on chromosome 15q11‐q13 was also excluded because he was unable to complete the study procedure due to a panic attack during MRI scanning. Another subject was excluded because of excessive motion artifacts on MRI scanning. Consequently, 12 individuals with PWS due to 15q11‐q13 deletion were the subjects of the present study. All subjects received detailed physical examinations and semistructured interviews to document their past medical histories. Two subjects were receiving antipsychotics (haloperidol, bromazepam, and ethyl loflazepate), three were on sex‐hormone replacement therapy, and three had a previous history of growth‐hormone treatment. In addition, 13 normally developed volunteers were recruited from the community as controls. Two groups were approximately matched for age and sex.
All of the subjects were right‐handed on the Edinburgh Handedness Inventory [Oldfield,1971]. The body mass index (BMI, weight in kilograms divided by height in meters squared) of each subject was calculated. No subject had a history of head injury or identifiable neurological focal signs.
The following neuropsychological tests were carried out by a trained behavioral neurologist. General intelligence was assessed with the Wechsler Adult Intelligence Scale‐Revised‐Short Forms (WAIS‐R‐S) [Misawa,1993], the Raven's Colored Progressive Matrices (RCPM) [Sugishita and Yamazaki,1993], and the Mini‐Mental State Examination (MMSE) [Folstein et al.,1975]. Attention and executive function were assessed by the Forward and Backward Digit Span subtests of the WAIS‐R, the Verbal Fluency tests (Category and Literal Fluency), and the Frontal Assessment Battery (FAB) [Dubois et al.,2000]. The neuropsychological tests, except the WAIS‐R‐S and the RCPM, were also administered to control subjects.
To assess behavioral symptoms in the PWS subjects, we used a questionnaire proven to be useful for Japanese PWS individuals, in accordance with the method applied in a previous study [Ogura et al.,2008]. The questionnaire consisted of 35 questions on three categories of behavior: eating behavior (with four domains: appetite, food preference, eating habits, and other oral behavior), stereotyped behavior (with four domains: roaming, speaking, movements, and daily rhythm), and collecting behavior. We asked the parents of the individuals with PWS if the child had these symptoms. If the caregiver indicated the presence of the abnormal behavior, we asked her/him to rate its frequency and severity on a 1–3 (where 1 is occasionally and 3 is frequently) or 1–5 (where 1 is slight and 5 is very marked) scale. Then the severity score was derived as the product of the frequency and the severity.
Image Acquisition
MRI was performed using a 1.5 T Signa General Electric scanner at the Tohoku University Hospital, Sendai, Japan. Whole‐head three‐dimensional spoiled gradient acquisition in the steady state (SPGR) images (TR = 20 ms, TE = 4.1 ms, NEX = 1, flip angle = 30°, matrix size = 256 × 256, slice thickness = 1.2 mm, and field of view = 25 cm) were obtained from all subjects. In addition, a conventional MRI examination (T2 and FLAIR sequences) was performed for each subject. The experienced neuroradiologist who evaluated the MRI scans of each subject detected no gross anatomical abnormality.
Image Processing and Measurement
Prior to VBM preprocessing, nonbrain tissues surrounding the entire brain in each image were manually removed using the Analyze 8.1 software (Mayo Foundation, Rochester, MN) to maximize sensitivity in data analysis [Acosta‐Cabronero et al.,2008]. The MRI data were analyzed using VBM implemented in SPM5 (Wellcome Department of Imaging Neuroscience, London, UK), where the preprocessing steps of segmentation, bias correction, and spatial normalization are incorporated into a single generative model. The MRIs were segmented into gray matter (GM), white matter (WM), and cerebrospinal fluid (CSF) images using SPM5 prior probability templates. The intensity nonuniformity bias correction was applied to aid segmentation by correcting for scanner‐induced smooth intensity differences that varied in space. The GM images were normalized to the templates in the standard space of the Montreal Neurological Institute (MNI) using a set of nonlinear functions. A modulation step was also incorporated into the preprocessing model. Notably, spatial normalization expands and contracts some brain regions. The required modulation was performed by multiplying the warped tissue probability maps by the Jacobian determinant of the warp on a voxel‐by‐voxel basis, which represents the relative volume ratio before and after warping, thus allowing voxel intensities in the segmented GM map, together with the size of the voxels, to reflect regional volume and preserve total GM volume from before the warp. As a final preprocessing step, all normalized, segmented, modulated images were smoothed with a 12‐mm full‐width half‐maximum Gaussian kernel.
Additionally, the global volumes of GM, WM, and CSF for each scan were calculated from the segmentation maps of the raw (non‐normalized) MRI. The volume of each tissue class was estimated as the total number of voxels multiplied by the voxel size. Whole‐brain tissue volume was calculated by summing the GM, WM, and CSF volumes for each subject.
Statistical Analysis
Because of the small sample size in each group, as well as ceiling effects or low standard deviation in several measures, non‐parametric Mann‐Whitney U‐tests were employed to assess between‐group differences in age, BMI, and the results of the neuropsychological tests. Differences in global volume of GM, WM, CSF, and whole‐brain tissue were also assessed using Mann‐Whitney U‐tests. Statistical significance was set at 0.05 for two‐tailed tests. SPSS11.5J for Windows (SPSS, Inc.) was used for the computations.
The preprocessed GM data were analyzed in SPM5 within the framework of the general linear model. Regional differences in segmented GM volume between the PWS and control groups were assessed statistically using an independent t‐test. To avoid possible edge effects around the border between GM and WM and to include only relatively homogeneous voxels, all voxels with a GM value of <0.1 (of a maximum value of 1) were excluded. The threshold of significance was set at P < 0.001 at the voxel level (uncorrected), with a significance of P < 0.05 at the cluster level (corrected). Nonstationary cluster extent correction, which corrects for nonisotropic smoothness of VBM data, was also applied [Hayasaka et al.,2004]. The peak voxels of clusters that exhibited reliable effects are reported in MNI coordinates. The results for VBM analysis of WM are not reported in this article.
Unlike in the typical VBM analyses for adult neurodegenerative diseases, we did not include total GM volume as a covariate in order to remove any variance due to differences in head size from our first analysis. This was done because the PWS individuals showed smaller congenital brain volume compared with the normal volunteers, possibly owing to deletion on chromosome 15q11‐q13. Thus, if we include the total GM volume as a covariate, such an analysis is likely to underestimate the difference between the two groups derived from this disease. However, the interpretation related to the regions identified in this analysis requires caution; it is unclear whether the regions are “proportionally” smaller in the PWS group relative to the normal controls. Therefore, to explore the regional specificity for the regions identified in our first analysis, we included total GM volume as a covariate to account for overall size differences in a separate analysis. In addition, we covaried age, sex, BMI, and scores on the MMSE, all of which are possible confounding factors for GM volume, by entering these variables into the model in separate analyses.
RESULTS
Subject Characteristics
The demographic data, including the BMI, the PWS clinical criteria score [Holm et al.,1993], and the results of the neuropsychological tests, are shown in Table I. PWS subjects ranged in age from 19 to 31 and control subjects ranged from 19 to 29. The ranges in BMI score were 23.3–48.6 for the PWS subjects and 17.2–22.9 for the control subjects. On the WAIS‐R‐S, nine subjects with PWS performed too poorly to yield an intelligence quotient (IQ), and the other three scored IQs of 40, 41, and 43. The scores on the RCPM in the PWS subjects were also very low compared with the normative reference population [Sugishita and Yamazaki,1993]. Performance on the neuropsychological tests administered to both groups was significantly worse in the PWS group than in the control group. All of the differences that were significant using Mann‐Whitney U‐tests were also significant when we employed parametric t‐tests.
Table I.
Demographic data and results of neuropsychological tests
| P‐value | |||
|---|---|---|---|
| PWS Mean (SD) | Control Mean (SD) | P‐value | |
| Age (years) | 25.4 (4.1) | 23.7 (3.2) | 0.205 |
| Sex (female : male) | 6 : 6 | 7 : 6 | |
| Body mass index | 33.9 (8.8) | 20.1 (1.7) | <0.0001 |
| PWS clinical criteria score | 11.3 (0.8) | NA | (Cut‐off score: 7) |
| Neuropsychological test | |||
| RCPM | 20.4 (5.2) | NA | |
| MMSE (of 30) | *19.2 (5.3) | 29.9 (0.3) | <0.0001 |
| Digit span: forward | 3.8 (0.8) | 6.8 (0.9) | <0.0001 |
| Digit span: backward | 2.5 (0.8) | 5.9 (1.2) | <0.0001 |
| FAB (of 18) | 11.3 (3.8) | 17.0 (0.7) | <0.0001 |
| Category fluency (animal) | 11.6 (3.1) | 19.6 (3.7) | <0.0001 |
| Literal fluency ('fu', 'a', 'ni') | 12.9 (5.0) | 26.0 (8.3) | <0.0001 |
One PWS subject was not assessed (n = 11).
PWS, Prader‐Willi syndrome; RCPM, Raven's Colored Progressive Matrices; MMSE, Mini‐Mental State Examination; FAB, Frontal Assessment Battery; NA, not assessed.
The prevalence of each abnormal behavior was high. The results were consistent with the findings of our previous nationwide survey [Ogura et al.,2008]. Frequency, severity, and severity score (i.e., frequency × severity) in the PWS subjects in this study were lower than values obtained in the previous survey (Table II) [Ogura et al.,2008].
Table II.
Behavioral symptoms in subjects with PWS
| Behavioral components (*maximum score) | Mean (SD) | |
|---|---|---|
| Prevalence ratio | Abnormal eating behavior | 100% |
| Stereotypy | 83% | |
| Collecting behavior | 50% | |
| Frequency | Abnormal eating behavior (57) | 14 (10) |
| Stereotypy (42) | 8 (7) | |
| Collecting behavior (6) | 2 (1) | |
| Severity | Abnormal eating behavior (95) | 11 (11) |
| Stereotypy (70) | 5 (7) | |
| Collecting behavior (10) | 1 (1) | |
| Severity score (frequency × severity) | Abnormal eating behavior (285) | 26 (28) |
| Stereotypy (210) | 13 (20) | |
| Collecting behavior (30) | 1 (2) |
Maximum score indicates the highest possible score achievable on the questionnaire.
PWS, Prader‐Willi syndrome.
Differences in Tissue Volume
The global volumes of GM, WM, and whole brain in the PWS group were significantly smaller than those in the control group (P < 0.05), but there were no group differences in CSF volume (Table III). All of the differences that were significant using Mann‐Whitney U‐tests were also significant when we employed parametric t‐tests.
Table III.
Global volume differences between PWS subjects and controls
| Tissue | Mean volume, ×103 mm3 (SD) | P‐value | |
|---|---|---|---|
| PWS | Controls | ||
| GM | 656 (89) | 727 (63) | 0.040* |
| WM | 395 (55) | 466 (59) | 0.005* |
| CSF | 274 (61) | 291 (64) | 0.728 |
| Total (GM + WM + CSF) | 1,326 (156) | 1,484 (167) | 0.046* |
P < 0.05.
PWS, Prader‐Willi syndrome; GM, gray matter; WM, white matter; CSF, cerebrospinal fluid.
Voxel‐Based Analysis of GM Volume
The individuals with PWS showed small GM volume in regions of the OFC, the caudate nucleus, the inferior temporal gyrus, and regions related mainly to motor and sensory functions, including the precentral gyrus, the supplementary motor area, the postcentral gyrus, and the cerebellum (Table IV, Fig. 1A,B). GM volume was not significantly larger in the PWS individuals compared with the normal controls.
Table IV.
Brain regions showing the small volume of gray matter in PWS subjects compared with controls
| Brain region (Brodmann's area) | Number of voxels in cluster | Z value at local maximum | Coordinates | ||
|---|---|---|---|---|---|
| x | y | z | |||
| Right orbitofrontal cortex (47) | 1,491 | 4.83 | 46 | 40 | −20 |
| *Right orbitofrontal cortex (11/47) | 4.28 | 32 | 38 | −24 | |
| *Right orbitofrontal cortex (47) | 3.75 | 52 | 48 | −4 | |
| Right precentral gyrus (6) | 3,379 | 4.42 | 34 | −20 | 70 |
| *Right supplementary motor area (6) | 4.36 | 2 | 16 | 68 | |
| *Left postcentral gyrus (3) | 4.41 | −12 | −38 | 76 | |
| Right inferior temporal gyrus (20) | 882 | 4.43 | 70 | −40 | −18 |
| *Right inferior temporal gyrus (37) | 3.85 | 66 | −54 | −16 | |
| *Right middle temporal gyrus (21) | 3.72 | 70 | −10 | −22 | |
| Right postcentral gyrus (1) | 662 | 4.20 | 12 | −44 | 76 |
| *Right precuneus (5) | 3.91 | 4 | −58 | 70 | |
| *Right paracentral lobule (4) | 3.68 | 10 | −32 | 78 | |
| Right cerebellum (hemisphere) | 2,997 | 4.61 | 18 | −88 | −26 |
| *Cerebellar vermis | 4.14 | −4 | −42 | −10 | |
| *Left cerebellum (hemisphere) | 3.99 | −14 | −86 | −22 | |
| Left caudate nucleus | 2,385 | 4.15 | −12 | −10 | 20 |
| *Left thalamus/caudate nucleus | 4.02 | −10 | −18 | 26 | |
| *Right thalamus/caudate nucleus | 3.79 | 12 | −22 | 24 | |
| Controlling for total gray matter volume | |||||
| Right orbitofrontal cortex (47) | 600 | 4.37 | 44 | 40 | −20 |
| *Right orbitofrontal cortex (11/47) | 3.49 | 28 | 34 | −26 | |
| *Right orbitofrontal cortex (47) | 3.35 | 52 | 48 | −2 | |
PWS, Prader‐Willi syndrome.
Subpeaks
Figure 1.
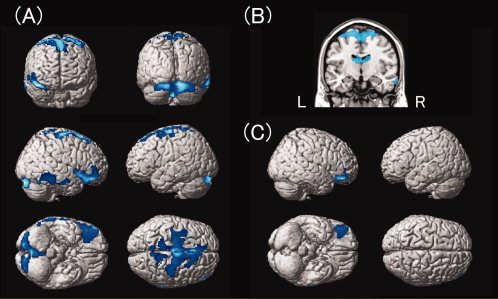
A: Cortical regions show small gray matter volume in the PWS group compared with the control group. The regions are displayed on a surface‐rendered standard brain. B: Subcortical regions show small gray matter volume in the PWS group compared with the control group. The regions are superimposed onto the standard brain using MRIcroN software [Rorden et al.,2007]. C: The orbitofrontal cortex shows regionally specific small gray matter volume in the PWS group compared with the control group. This statistical parametric map was obtained by analysis including the total GM volume as a covariate. PWS, Prader‐Willi syndrome.
To determine whether these findings were regionally specific, we performed a separate analysis including total GM volume as a covariate. This analysis showed that only the results for the right OFC remained significant (Table IV and Fig. 1C), indicating that GM volume in the right OFC is proportionally smaller in the PWS group compared to the normal controls, while the GM volume differences in the other regions identified in our first analysis can be ascribed to the difference in total GM volume between the two groups.
Following the analysis including total GM volume as a covariate, we also performed a separate analysis including age and total GM volume as covariates. This analysis showed that the results for the right OFC remained significant (coordinates, 44, 40, −20; Z value = 4.34; cluster size = 570). We also performed a separate analysis including sex and total GM volume as covariates. This analysis also showed that the results for the right OFC remained significant (coordinates, 44, 40, −18; Z value = 4.17; cluster size = 448). These results indicate that age and sex do not confound the findings for the right OFC. Next, we performed a separate analysis including BMI and total GM volume as covariates. The results for the right OFC did not surpass the cluster‐level threshold (coordinates, 36, 46, −22; Z value = 4.09; cluster size = 137), but remained significant at the voxel level (P < 0.001, uncorrected), suggesting that the main findings of this study cannot simply be explained in terms of BMI. Finally, we performed a separate analysis including MMSE scores and total GM volume as covariates to control for general cognitive impairment (n = 11 for the PWS group, because of missing data for one subject). The results for the right OFC did not survive cluster‐level threshold analysis (coordinates, 46, 36, −16; Z value = 4.01; cluster size = 162), but remained significant at the voxel level (P < 0.001, uncorrected), suggesting that the main findings of this study cannot simply be explained by the severity of general cognitive deficits.
Last, to determine whether the identified small volume of GM in the OFC was correlated with scores of behavioral symptoms, we extracted the normalized voxel values of significant clusters in the right OFC and performed a correlation analysis. No correlation was observed between the scores on behavioral assessment and GM volume in the PWS subjects.
DISCUSSION
We found that the individuals with PWS had small global volumes of GM, WM, and whole‐brain tissue, consistent with the findings of previous reports on neuropathology or MRI examinations [Hashimoto et al.,1998; Stevenson et al.,2004]. More importantly, and consistent with our prediction, using a voxel‐based analysis we found that the PWS subjects had significantly reduced GM volume in the OFC. This finding regarding the OFC remained significant in the separate analysis including total GM volume as a covariate and even in the analysis including total GM volume and age as covariates or in the analysis including total GM volume and sex as covariates.
The OFC is thought to have a crucial role in several functional networks, one of which is related to the integration of food‐related sensory, visceral, and reinforcing information [Rolls,2005]. Patients with damage to the OFC showed changes in eating habits and escalating desires for sweet food coupled with reduced satiety [Uher and Treasure,2005]. In patients with frontotemporal dementia, hyperphagia and sweet tooth were associated with atrophy of the OFC region [Woolley et al.,2007]. With regard to food‐related behavior in PWS subjects, recent neuroimaging studies have demonstrated that PWS subjects had dysfunction of the satiety system in prefrontal areas, especially in the OFC [Hinton et al.,2006; Holsen et al.,2006; Miller et al.,2007b; Shapira et al.,2005]. Thus, the small GM volume in the OFC found in our PWS subjects may be associated with both overeating and a propensity for detrimental food preferences such as overindulgence in sweet foods.
Another important role of the OFC is linked to compulsive behavior, such as stereotypy and collecting behavior. Kim and Lee [2002] reported that a patient with an infarction restricted to the OFC showed obsessive‐compulsive symptoms. Another study showed that patients with damage to ventromedial frontal regions including the OFC showed pathological collecting behavior, i.e., excessive collecting and collection of useless items [Anderson et al.,2005]. Saxena et al. [1998] reviewed functional neuroimaging studies extensively and suggested that dysfunction of an orbitofrontal‐subcortical network is responsible for compulsive symptoms. Reduced volume in the OFC region may disrupt normal function that modulates subcortically driven predispositions to compulsive behavior.
In addition to the OFC, several other brain areas exhibited reduced GM volume. The small GM volume in the cerebellum, as well as in the motor and sensory cortices, may be related to a central hypotonia in PWS [Holm et al.,1993]. Indeed, all of the PWS subjects in the present study had a history of neonatal hypotonia. Although not regionally specific, the trend toward reduced gray matter volume in the caudate nucleus observed in PWS was also found in this study. The caudate nucleus has a close connection with the OFC, and evidence from patients with damage to the caudate nucleus indicates that they show neurobehavioral abnormalities similar to that resulting from frontal pathology [Royall et al.,2002]. Bokura and Robinson [1997] showed that vascular lesions damaging the caudate nucleus gave rise to disinhibition and a variety of affective disorders. Therefore, the small volume of this nucleus may also play a role in behavioral symptoms in PWS. Wang et al. [2006] examined obese individuals with PET to identify the brain circuits responsible for decreasing food intake by stomach expansion, which was induced by electrical stimulation of the vagus nerve. During stomach expansion metabolism increased in the anterior cerebellum and striatum, as well as in the OFC, suggesting that these regions are associated with modulating eating behavior.
This study has some important limitations. First, the number of individuals with PWS was small in this study. This small sample size might have skewed the results. Second, some of the individuals with PWS were on antipsychotics or sex‐hormone replacement and others had a history of growth‐hormone treatment; these factors might alter brain development and thus influence brain‐tissue volume [Konradi and Heckers,2001]. This lack of homogeneity in the PWS population might also have skewed the results and caused null findings in our analyses of the correlation between behavioral assessment scores and GM volume in the PWS subjects. Third, scores of behavioral assessment in the individuals with PWS were lower than those found in the previous survey, although the prevalence ratio was consistent with previous reports [Ogura et al.,2008]. The PWS population included in this study may not be representative of individuals with this disorder. The participants in this study were recruited from all over our country, and this procedure may bias toward the selection of a PWS population with relatively minor behavioral symptoms. Finally, the PWS population included in this study may not be representative of individuals with this disorder in terms of IQ; all of the participants with PWS had moderate to severe mental retardation. This mental retardation might have affected the present findings, although additional analysis including the scores of MMSE as a covariate still showed small GM volume in the OFC at the voxel level. Furthermore, in terms of chromosome deletion and the type of deficits that patients endure, the PWS population included in the study may not be representative of individuals with this disorder; all of the patients studied exhibited 15q11‐q13 chromosomal deletion. The present findings therefore may not be true of the other subtypes (maternal uniparental disomy and imprinting defects). To address the issues mentioned above and establish the present findings, further studies with larger sample size, which will allow us to analyze the neuroanatomical changes in PWS in more detail, are needed.
Acknowledgements
The authors thank Yoichi Sawada for helping them recruit the control subjects and Makoto Saito for his assistance with data collection. This work was partly supported by a Grant‐in‐Aid for Scientific Research on Priority Areas – System study on higher‐order brain functions – from the Ministry of Education, Culture, Sports, Science and Technology of Japan (20020004 to E.M.) from the Japan Society for the Promotion of Science. This work was also partially supported by the Global COE Program (Basic & Translational Research Center for Global Brain Science), MEXT, Japan.
REFERENCES
- Acosta‐Cabronero J,Williams GB,Pereira JM,Pengas G,Nestor PJ( 2008): The impact of skull‐stripping and radio‐frequency bias correction on grey‐matter segmentation for voxel‐based morphometry. Neuroimage 39: 1654–1665. [DOI] [PubMed] [Google Scholar]
- Anderson SW,Damasio H,Damasio AR( 2005): A neural basis for collecting behaviour in humans. Brain 128: 201–212. [DOI] [PubMed] [Google Scholar]
- Ashburner J,Friston KJ( 2000): Voxel‐based morphometry—The methods. Neuroimage 11: 805–821. [DOI] [PubMed] [Google Scholar]
- Bokura H,Robinson RG( 1997): Long‐term cognitive impairment associated with caudate stroke. Stroke 28: 970–975. [DOI] [PubMed] [Google Scholar]
- Clarke DJ,Boer H,Whittington J,Holland A,Butler J,Webb T( 2002): Prader‐Willi syndrome, compulsive and ritualistic behaviours: The first population‐based survey. Br J Psychiatry 180: 358–362. [DOI] [PubMed] [Google Scholar]
- Dubois B,Slachevsky A,Litvan I,Pillon B( 2000): The FAB: A Frontal Assessment Battery at bedside. Neurology 55: 1621–1626. [DOI] [PubMed] [Google Scholar]
- Dykens EM,Kasari C( 1997): Maladaptive behavior in children with Prader‐Willi syndrome, Down syndrome, and nonspecific mental retardation. Am J Ment Retard 102: 228–237. [DOI] [PubMed] [Google Scholar]
- Folstein MF,Folstein SE,McHugh PR( 1975): “Mini‐mental state”: A practical method for grading the cognitive state of patients for the clinician. J Psychiatr Res 12: 189–198. [DOI] [PubMed] [Google Scholar]
- Glenn CC,Driscoll DJ,Yang TP,Nicholls RD( 1997): Genomic imprinting: Potential function and mechanisms revealed by the Prader‐Willi and Angelman syndromes. Mol Hum Reprod 3: 321–332. [DOI] [PubMed] [Google Scholar]
- Hashimoto T,Kawano N,Fukuda K,Endo S,Mori K,Yoneda Y,Yamaue T,Harada M,Miyoshi K( 1998): Proton magnetic resonance spectroscopy of the brain in patients with Prader‐Willi syndrome. Pediatr Neurol 18: 30–35. [DOI] [PubMed] [Google Scholar]
- Hayasaka S,Phan KL,Liberzon I,Worsley KJ,Nichols TE( 2004): Nonstationary cluster‐size inference with random field and permutation methods. Neuroimage 22: 676–687. [DOI] [PubMed] [Google Scholar]
- Hayashi M,Itoh M,Kabasawa Y,Hayashi H,Satoh J,Morimatsu Y( 1992): A neuropathological study of a case of the Prader‐Willi syndrome with an interstitial deletion of the proximal long arm of chromosome 15. Brain Dev 14: 58–62. [DOI] [PubMed] [Google Scholar]
- Hinton EC,Holland AJ,Gellatly MS,Soni S,Patterson M,Ghatei MA,Owen AM( 2006): Neural representations of hunger and satiety in Prader‐Willi syndrome. Int J Obes 30: 313–321. [DOI] [PubMed] [Google Scholar]
- Holland AJ,Whittington JE,Butler J,Webb T,Boer H,Clarke D( 2003): Behavioural phenotypes associated with specific genetic disorders: Evidence from a population‐based study of people with Prader‐Willi syndrome. Psychol Med 33: 141–153. [DOI] [PubMed] [Google Scholar]
- Holm VA,Cassidy SB,Butler MG,Hanchett JM,Greenswag LR,Whitman BY,Greenberg F( 1993): Prader‐Willi syndrome: Consensus diagnostic criteria. Pediatrics 91: 398–402. [PMC free article] [PubMed] [Google Scholar]
- Holsen LM,Zarcone JR,Brooks WM,Butler MG,Thompson TI,Ahluwalia JS,Nollen NL,Savage CR( 2006): Neural mechanisms underlying hyperphagia in Prader‐Willi syndrome. Obesity 14: 1028–1037. [DOI] [PMC free article] [PubMed] [Google Scholar]
- Kim KW,Lee DY( 2002): Obsessive‐compulsive disorder associated with a left orbitofrontal infarct. J Neuropsychiatry Clin Neurosci 14: 88–89. [DOI] [PubMed] [Google Scholar]
- Kim SE,Jin DK,Cho SS,Kim JH,Hong SD,Paik KH,Oh YJ,Kim AH,Kwon EK,Choe YH( 2006): Regional cerebral glucose metabolic abnormality in Prader‐Willi syndrome: A 18F‐FDG PET study under sedation. J Nucl Med 47: 1088–1092. [PubMed] [Google Scholar]
- Konradi C,Heckers S( 2001): Antipsychotic drugs and neuroplasticity: Insights into the treatment and neurobiology of schizophrenia. Biol Psychiatry 50: 729–742. [DOI] [PMC free article] [PubMed] [Google Scholar]
- Leonard CM,Williams CA,Nicholls RD,Agee OF,Voeller KK,Honeyman JC,Staab EV( 1993): Angelman and Prader‐Willi syndrome: A magnetic resonance imaging study of differences in cerebral structure. Am J Med Genet 46: 26–33. [DOI] [PubMed] [Google Scholar]
- Miller JL,Couch JA,Schmalfuss I,He G,Liu Y,Driscoll DJ( 2007a) Intracranial abnormalities detected by three‐dimensional magnetic resonance imaging in Prader‐Willi syndrome. Am J Med Genet A 143: 476–483. [DOI] [PubMed] [Google Scholar]
- Miller JL,James GA,Goldstone AP,Couch JA,He G,Driscoll DJ,Liu Y( 2007b) Enhanced activation of reward mediating prefrontal regions in response to food stimuli in Prader‐Willi syndrome. J Neurol Neurosurg Psychiatry 78: 615–619. [DOI] [PMC free article] [PubMed] [Google Scholar]
- Misawa G ( 1993): Japanese Wechsler Adult Intelligence Scale‐Revised‐Short Forms. Tokyo: Nihon‐bunnka‐kagaku‐sya. [Google Scholar]
- Ogura K,Shinohara M,Ohno K,Mori E( 2008): Frontal behavioural syndromes in Prader‐Willi syndrome. Brain Dev 30: 469–476. [DOI] [PubMed] [Google Scholar]
- Oldfield RC( 1971): The assessment and analysis of handedness: The Edinburgh Inventory. Neuropsychologia 9: 97–113. [DOI] [PubMed] [Google Scholar]
- Rolls ET( 2005): Taste olfactory, and food texture processing in the brain, and the control of food intake. Physiol Behav 85: 45–56. [DOI] [PubMed] [Google Scholar]
- Rorden C,Karnath HO,Bonilha L( 2007): Improving lesion‐symptom mapping. J Cogn Neurosci 19: 1081–1088. [DOI] [PubMed] [Google Scholar]
- Royall DR,Lauterbach EC,Cummings JL,Reeve A,Rummans TA,Kaufer DI,LaFrance WC Jr,Coffey CE( 2002): Executive control function: A review of its promise and challenges for clinical research. A report from the Committee on Research of the American Neuropsychiatric Association. J Neuropsychiatry Clin Neurosci 14: 377–405. [DOI] [PubMed] [Google Scholar]
- Saxena S,Brody AL,Schwartz JM,Baxter LR( 1998): Neuroimaging and frontal‐subcortical circuitry in obsessive‐compulsive disorder. Br J Psychiatry Suppl 35: 26–37. [PubMed] [Google Scholar]
- Shapira NA,Lessig MC,He AG,James GA,Driscoll DJ,Liu Y( 2005): Satiety dysfunction in Prader‐Willi syndrome demonstrated by fMRI. J Neurol Neurosurg Psychiatry 76: 260–262. [DOI] [PMC free article] [PubMed] [Google Scholar]
- Stevenson DA,Anaya TM,Clayton‐Smith J,Hall BD,Van Allen MI,Zori RT,Zackai EH,Frank G,Clericuzio CL( 2004): Unexpected death and critical illness in Prader‐Willi syndrome: Report of ten individuals. Am J Med Genet A 124: 158–164. [DOI] [PubMed] [Google Scholar]
- Sugishita M,Yamazaki K ( 1993): Japanese Raven's Colored Progressive Matrices. Tokyo: Nihon‐bunnka‐kagaku‐sya. [Google Scholar]
- Titomanlio L,De Brasi D,Romano A,Genesio R,Diano AA,Del Giudice E( 2006): Partial cerebellar hypoplasia in a patient with Prader‐Willi syndrome. Acta Paediatr 95: 861–863. [DOI] [PubMed] [Google Scholar]
- Uher R,Treasure J( 2005): Brain lesions and eating disorders. J Neurol Neurosurg Psychiatry 76: 852–857. [DOI] [PMC free article] [PubMed] [Google Scholar]
- Wang GJ,Yang J,Volkow ND,Telang F,Ma Y,Zhu W,Wong CT,Tomasi D,Thanos PK,Fowler JS( 2006): Gastric stimulation in obese subjects activates the hippocampus and other regions involved in brain reward circuitry. Proc Natl Acad Sci USA 103: 15641–15645. [DOI] [PMC free article] [PubMed] [Google Scholar]
- Whittington JE,Holland AJ,Webb T,Butler J,Clarke D,Boer H( 2001): Population prevalence and estimated birth incidence and mortality rate for people with Prader‐Willi syndrome in one UK Health Region. J Med Genet 38: 792–798. [DOI] [PMC free article] [PubMed] [Google Scholar]
- Woolley JD,Gorno‐Tempini ML,Seeley WW,Rankin K,Lee SS,Matthews BR,Miller BL( 2007): Binge eating is associated with right orbitofrontal‐insular‐striatal atrophy in frontotemporal dementia. Neurology 69: 1424–1433. [DOI] [PubMed] [Google Scholar]
- Yoshii A,Krishnamoorthy KS,Grant PE( 2002): Abnormal cortical development shown by 3D MRI in Prader‐Willi syndrome. Neurology 59: 644–645. [DOI] [PubMed] [Google Scholar]