

Abstract
Impulsivity is a trait shared by many psychiatric disorders and therefore a suitable intermediate phenotype for their underlying biological mechanisms. One of the molecular determinants involved is the NOS1 ex1f‐VNTR, whose short variants are associated with a variety of impulsive behaviors. Fifty‐six healthy controls were stratified into homozygous long (LL) (30 probands) and short (SS) (26 probands) allele groups. Subjects completed a combined stop‐signal go/nogo task, while the oxygenation in the prefrontal cortex was measured with functional near‐infrared spectroscopy. Electromyography was recorded to control for differences in muscle activity in the two inhibition tasks. Two questionnaires on impulsive traits were completed. Differences between the two tasks are shown by distinct activation patterns within the prefrontal cortex. The nogo task resulted mainly in the activation of the dorsolateral prefrontal cortex (dlPFC), whereas successful and unsuccessful inhibition in the stop‐signal task elicited the predicted activity in the inferior frontal cortex (IFC). Although significant differences were found in neither the scores obtained on impulsivity‐related questionnaires nor the behavioral data, the LL group displayed increased dlPFC activity during nogo trials and the predicted activation in the IFC during successful inhibition in the stop‐signal task, while no significant activation was found in the SS group. Our data confirm an influence of NOS1 ex1f‐VNTR on impulsivity, as carriers of the short risk allele exhibited diminished activity of (pre‐)frontal brain regions during the inhibition in a stop‐signal task. Impairment of prefrontal control with consecutive failure of inhibitory processes might underlie association findings reported previously. Hum Brain Mapp, 2012. © 2011 Wiley Periodicals, Inc.
Keywords: NOS1, stop signal, near‐infrared spectroscopy, nogo, polymorphism, inferior frontal cortex, electromyography
INTRODUCTION
In recent years the focus of psychiatric research is more and more shifting from thinking in categorical entities of classification systems that neglect etiology toward the identification and consideration of intermediate phenotypes. These consist for example of more etiologically oriented measures of brain function, which are thought to more closely reflect neurobiological mechanisms and the corresponding underlying biological correlates. In the last decade, there have been important breakthroughs in this area, both in studies focusing on genetics and studies using brain imaging methods. The decoding of the human genome by the Human Genome Project in 2003 gave rise to an entirely new perspective when looking for the basis of human behavior. Consequently, evidence has been accumulated for an influence of genes on human brain function that delineates the path for a new way of defining healthy against dysfunctional behaviour.
Impulsive behavior is a complex and multidimensional trait [Congdon and Canli, 2008], that does not only affect healthy behavior, but has also been found to be dysfunctional in many psychiatric disorders, such as attention deficit/hyperactivity disorder (ADHD), borderline personality disorder, and aggressive behaviors [Avila et al., 2004; Fossati et al., 2004]. Impulsivity is usually expressed through extrovert, risk‐taking and incautious behavior without the consideration of possible long term consequences. It consists of at least two major dimensions, one that reflects disinhibition, or impulsive action, and another that reflects impulsive decision making, or impulsive choices [Avila et al., 2004; Congdon and Canli, 2008]. Twin studies have shown that impulsivity is highly heritable, suggesting a genetic basis [Seroczynski et al., 1999]. Only few genes have hitherto been suggested to play a role in impulsive behavior, one of them being the NOS1 gene [Reif, 2009], which codes for the neuronal isoform of nitric oxide synthase I (NOS‐I). The enzymatic product, nitric oxide (NO), is a gaseous molecule that inter alia acts as a second messenger downstream of the N‐methyl‐d‐aspartate (NMDA) receptor and interacts both with the dopaminergic and the serotonergic systems, both of which having been suggested to influence impulsive behavior [Congdon and Canli, 2008]. The NOS1 gene is located on chromosome 12 and has a fairly complex structure, containing 28 protein‐coding exons and a variable region with at least 11 distinct first exons that are transcribed into mRNA but later are removed by splicing. The transcription of those alternate first exons is driven by alternative promoters resulting in a tissue‐specific expression pattern [Bros et al., 2006]. A variable number of tandem repeats (VNTR) polymorphism in the promoter region of the alternative exon 1f, termed NOS1 ex1f‐VNTR, conveys functional consequences in that long variants enhance gene expression and influence the neural transcriptome [Reif et al., 2009]. The repeat is highly polymorphic and has therefore been dichotomized in long (L) and short (S) alleles to facilitate genetic studies. The SS genotype has been identified as a providing a risk factor for various psychiatric disorders [Galimberti et al., 2008; Reif, 2009] and has been associated with various brain functions and dysfunctions, e.g., it has been linked with deficient striatal function [Reif et al., 2011] and prefrontal dysfunction in schizophrenia [Reif et al., 2006].
In a study investigating a population‐based cohort, we intended to explore the link between NOS1 ex1f‐VNTR and impulsive behavior in healthy controls and could show significant differences in performance between the two genotype groups in an inhibition task [Reif et al., 2011]. Given the link between NOS1, psychiatric disorders displaying impulsivity and altered brain function, the aim of the current study was therefore to further investigate the respective neural correlates of disinhibition, especially prefrontal cortex (PFC) function, an area that has been pointed out as a playing a major role in motor inhibition [Aron et al., 2007b; Congdon and Canli, 2008; Fallgatter and Herrmann, 2001; Herrmann et al., 2005]. Disinhibition is closely linked to impulsivity and can be measured by the go/nogo or stop‐signal tasks. The go/nogo and the stop‐signal tasks are well established paradigms to measure behavioral inhibition, with the core aim to inhibit a prepotent motor response [Fallgatter et al., 1997; Logan and Cowan, 1984]. In the present study subjects performed a combined version of these two tasks and PFC function was recorded online by means of functional near‐infrared spectroscopy (fNIRS). The two tasks have been shown to have different neural and physiological correlates: (1) A global inhibition mechanism upstream of the primary motor cortex (M1) located in the prefrontal cortex, which is reliably activated when non‐selective inhibitory actions are required, and (2) a downstream selective inhibitory mechanism located in M1. Aron and Verbruggen [ 2008] could show that the stop signal task requires selective inhibition (i.e. when the subjects already know the movement direction of the action that needs to be stopped), whereas the nogo task, in which it is known before stimulus presentation that no response is required, can be seen as measuring global inhibition. In addition to fNIRS, we measured muscle activity with electromyography (EMG) in order to test whether or not the NOS1 ex1f‐VNTR has an influence in the stopping mechanism selected.
FMRI studies in healthy adults using behavioral inhibition tasks have consistently shown activation in a right‐hemisphere lateralized neural circuit [Aron et al., 2003; Boehler et al., 2010; Congdon and Canli, 2005]. These imaging studies are further supported by data from lesion studies [Aron et al., 2003; Rieger et al., 2003]. Within this circuit, the two critical regions are the right inferior frontal cortex (IFC) where increased activity can be seen both in the successful as well as in the unsuccessful inhibition, but far more pronounced in the successful inhibition condition [Aron and Poldrack, 2006; Boehler et al., 2010], and the subthalamic nucleus (STN).The IFC plays a central role in controlling behavioral inhibition [Aron et al., 2003; Congdon and Canli, 2008]. We therefore expect that successful inhibition is accompanied by significant activation of the IFC and that both, behavioral performance is worse and activation is lower in the S allele group as compared to the L allele group.
MATERIALS AND METHODS
Subjects
Fifty‐six healthy volunteers participated in the study. The subjects were chosen from a large pool of previously genotyped volunteers and were stratified according to the NOS1 ex1f‐VNTR into a homozygous short allele group (SS) and a homozygous long allele group (LL) matched for sex and age. The sample consisted of 30 women (15 in each the SS and LL groups) and 26 men (11 in the SS, and 15 in the LL group); mean age of the subjects was 24.3 ± 3.7 years. All participants were right handed. To ensure comparable intelligence levels we conducted a subtest (subtest 3) of the Leistungspruefsystem (LPS) by Horn [ 1983], and part B of the Mehrfachwahl‐Wortschatz‐Test (MWT‐B; Lehrl [ 2005]). The LPS had a mean score of 32.8 ± 3.1; the MWT‐B yielded a mean score of 30.7 ± 3.7. Furthermore, all subjects completed the Impulsiveness‐Venturesomeness‐Empathy questionnaire I7 [Eysenck and Eysenck, 1977] and the UPPS Impulsive Behavior Scale [Schmidt et al., 2008; Whiteside et al., 2005] as paper and pencil tests. For further details on the demographic statistics, see Table I. All participants were screened for the absence of past and present psychiatric axis I disorders with the MINI interview [Sheehan et al., 1998]. The study was reviewed and approved by the Ethics Committee of the University of Wuerzburg, and all procedures involved were in accordance with the latest version of the Declaration of Helsinki. All participants gave written informed consent after comprehensive explanation of the experimental procedures.
Table I.
List of the demographic statistics and behavioral results
| NOS‐genotype | N | Mean | Standard deviation | T | df | P | |
|---|---|---|---|---|---|---|---|
| Sex | LL | 30 | 1.50 | 0.50 | −0.567 | 54 | 0.573 |
| SS | 26 | 1.57 | 0.50 | ||||
| Age | LL | 30 | 23.80 | 2.55 | −1.084 | 54 | 0.283 |
| SS | 26 | 24.88 | 4.75 | ||||
| LPS | LL | 30 | 32.86 | 3.09 | 0.025 | 54 | 0.980 |
| SS | 26 | 32.84 | 3.09 | ||||
| MWT B | LL | 30 | 30.33 | 4.41 | −0.757 | 54 | 0.453 |
| SS | 26 | 31.07 | 2.54 | ||||
| RT | LL | 30 | 504.92 | 77.13 | −0.231 | 54 | 0.818 |
| SS | 26 | 509.93 | 84.71 | ||||
| SSRT | LL | 30 | 250.75 | 40.46 | −1.056 | 54 | 0.296 |
| SS | 26 | 262.37 | 41.70 | ||||
| SOA | LL | 30 | 248.17 | 56.52 | 0.335 | 54 | 0.739 |
| SS | 26 | 242.76 | 64.33 | ||||
| Ommission_errors | LL | 30 | 4.46 | 5.20 | −0.798 | 54 | 0.428 |
| SS | 26 | 6.50 | 12.79 | ||||
| I7_overall | LL | 30 | 6.50 | 2.40 | 0.190 | 54 | 0.850 |
| SS | 26 | 6.38 | 2.08 | 0.192 | 53.999 | 0.848 | |
| UPPS_overall | LL | 30 | 30.64 | 4.85 | 0.082 | 54 | 0.935 |
| SS | 26 | 30.54 | 3.47 | 0.084 | 52.239 | 0.934 |
LL = long allele of the NOS1ex1f‐VNTR group, SS = short allele of the NOS1ex1f‐VNTR group, LPS = Lernpruefsystem (measure of intelligence), MWT‐B = Merhfachwahl‐Wortschatz‐test (measure of intelligence), RT = mean reaction time, SSRT = stop signal reaction time, SOA = stimulus onset asynchrony, I7 = Impulsiveness‐Venturesomeness‐Empathy‐Questionnaire, UPPS = UPPS Impulsive behavior scale.
Genotyping
The NOS1 Ex1f‐VNTR was determined as described previously (see Reif et al., 2006]. One of the primers was labeled with a fluorescent dye (cy‐5; TIB MolBiol, Berlin, Germany), enabling detection of the polymerase chain reaction (PCR) product. Electrophoretic separation of the PCR products was performed with a DNA sequencer (CEQ8000; Beckman‐Coulter, Krefeld, Germany). Primers and PCR conditions are available on request. The resulting genotypes were converted to short (S) and long (L) alleles as described.
Stop‐Signal Task
In the stop‐signal task, two kinds of stimulus conditions were presented, a frequent go and an infrequent stop condition. There were two go stimuli that require a choice reaction between two different buttons. The stop stimuli are the same as for the go condition accompanied by a stop signal, in this case a visual signal. This stop signal requires withholding a response that probably was already planned and in progress. The dynamics of the underlying neural processes have been explained with the “Horse Race Model” [De Jong et al., 1990; Logan and Cowan, 1984; Logan et al., 1997a], in which the go and the stop processes are occurring independently from one another and “race” each other. Depending on whether the stop process can be implemented sufficiently before the go process reaches a certain threshold, inhibition will either be successful or not. Via systematic variation of stimulus onset asynchrony (SOA) for the stop signal stimulus the mean SOA for a 50% chance of a successful stop signal can be determined. The difference between the mean SOA and the mean reaction time during go stimuli represent the stop signal reaction time which in turn represents inhibitory efficiency. The stop signal task can be viewed as a refinement of the go/nogo task, because in the go/nogo task the SOA is always zero. We used a combined stop‐signal‐go/nogo‐task to investigate inhibition. Subjects were presented with a fixation cross for 500 ms, followed by a blank screen for another 500 ms. Consecutively, they an arrow appeared, pointing either to the right or the left side for 500 ms and they were required to press either the right or the left arrow on a standard keyboard with their right index finger. The arrow was white (go‐signal), red (nogo‐signal), turned red after a certain amount of time (stop‐signal) or turned green after 475 ms (oddball). When the arrow was red or turned red, the subjects were instructed to inhibit their reactions.
Go‐trials accounted for 70% of all trials, 15% were stop‐trials; 7.5% of the trials were nogo‐trials, and 7.5% of the trials were oddball‐trials. The oddball trials were introduced to control for the differences in the frequency of the trials. Go trials are presented significantly more often than nogo or stop trials, and this could evoke probability effects [Dimoska and Johnstone, 2008].
According to the “Horse Race Model” [Logan et al., 1997b], we used a variable stimulus onset time (SOA) to divide the stop trials into 50% successful inhibitions and 50% unsuccessful inhibitions. The initial stimulus onset for the stop signal was 250 ms after the presentation of the white arrow. Following a successful stop trial, the SOA was decreased by 25 ms, and increased by 25 ms following an unsuccessful stop trial, to yield approximately the same number of successful and unsuccessful stop trials. We then calculated the stop‐signal response time (SSRT) by subtracting the mean go‐stop SOA from the average go‐trial response time [Logan et al., 1997a]. In other words, the SOA characterizes the time at which the stop‐process triggered by the stop‐stimulus will manage in half of the trials to catch up with the go‐process soon enough to cancel the response. A schema of the task can be seen in Figure 1.
Figure 1.
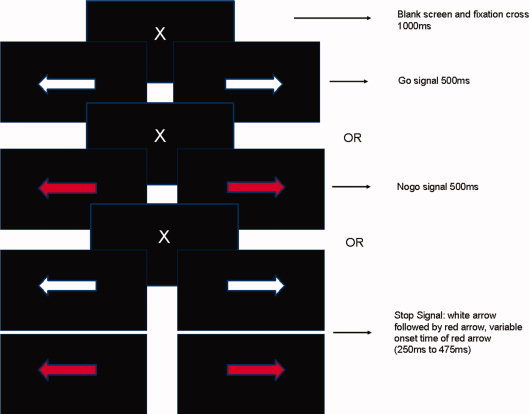
Schema of the stopsignal/nogo task. [Color figure can be viewed in the online issue, which is available at wileyonlinelibrary.com.]
To control for confounds between behavioral inhibition and attentional processes we introduced an oddball condition, in which the stimulus was followed by an additional 500 ms blank screen, summing up to a trial length of 2,000 ms. The stimulus interval was followed by a blank screen (500–1,500 ms) that functioned as a jitter. The trials were randomized with the constraint that no two stop stimuli, nogo stimuli, or green stimuli would succeed each other, in order to account for the length of the BOLD response that followed each trial [Wager and Nichols, 2003].According to Wager and Nichols, those rapid event related designs are possible as long as trials of the same condition are at least 4 s apart. Since the go trials could not be used for further analysis due to their insufficient inter‐trial distance, oddball trials were used instead of the go trials within the imaging analyses, after controlling for contrasts between the go trials and the oddball trials, which did not reveal any differences.
Electromyography
After preparation of the skin and application of the conductive paste, the electromyography (EMG) was applied to the musculus extensor digitorum, with the reference electrode placed on the epicondylus lateralis. The EMG was recorded with a 32‐channel QuickAmp amplifier (Brain Products, Munich, Germany) and the Vision Recorder data acquisition software (version 2.0, Brain Products, Munich, Germany).
Functional Near‐Infrared Spectroscopy
FNIRS employs near‐infrared light to noninvasively measure changes in the concentration of oxygenated (O2Hb) and deoxygenated hemoglobin (HHb) in the brain, readily penetrating the skull and reaching cortical tissue [Chance, 1991; Firbank et al., 1998; Hirth et al., 1997; Hock et al., 1997]. Increases of O2Hb and a decrease of HHb as a consequence of neuronal activity in certain brain regions is described as neurovascular coupling and is the underlying principle in fMRI measurements investigating the blood oxygenation level dependent (BOLD) signal [Logothetis and Wandell, 2004].
The basics of fNIRS are described elsewhere in detail [Hoshi, 2007; Obrig and Villringer, 2003]. We used a continuous wave system (ETG‐4000 Optical Topography system; Hitachi Medical Co., Japan) with a 52‐channel array of optodes that covered an area of 30 × 6 cm of the frontal region of the head (interoptode distance = 3 cm). This array consisted of 17 light emitters (semiconductor laser) and 16 photo‐detectors (Avalanche photodiodes), each of which detected the reflected near‐infrared light of the surrounding emitters. A measuring point of activation (channel) was defined as the region between one emitter and one detector. The array was fastened to the head by elastic straps. The probe set was placed on the head with regard to the standard positions of Fpz (for detector optode 26) and T3/T4 (for emitter optodes 28 and 23) according to the international 10‐20 system for EEG electrode placement [Jasper, 1958; Okamoto et al., 2004].
Data Analysis
Behavioral data
We conducted three univariate analyses of variance (ANOVA) with the dependent variables reaction time, stop‐signal reaction time, omission and commission errors. The NOS1 ex1f‐VNTR was entered as the independent variable. As NOS1 genotype can only take two discrete values, this ANOVA corresponds to an independent sample t‐test, which was used to contrast the two groups according to our a priori hypothesis.
Results of the I7 and the UPPS were also contrasted regarding the genotype.
EMG data
EMG data were filtered with a 250‐Hz low‐pass filter and a 50‐Hz high‐pass filter. Consecutively, the data were filtered with an IIR filter and rectified. After separation of the signal into segments that accounted for the nogo condition, segments that accounted for the successful inhibition condition and segments that accounted for the unsuccessful inhibition condition, all segments from one condition were averaged and the resulting means were entered in a multivariate ANOVA with the within‐subject factor condition and the between‐subject factor height of means. Follow‐up post hoc t‐tests for dependent samples were performed to further investigate potential differences between the two genotype groups.
Functional imaging data
Before statistical analysis of the functional data using the general linear model (GLM), the high frequency portion of the signal was removed by applying the system built‐in moving average filter with a time window of 5 s. A nine‐element discrete cosine transform basis set was used to account for slow drifts in the measurement. Thereafter, a GLM analysis was conducted modeling the hemodynamic response function (HRF) using a Gaussian with peak time at 7.0 s. The HRF was convolved with a delta function (stick function) indicating the onset of the trials, resulting in beta weights indicating the relative signal change in each channel. For details of the analysis of NIRS data, the reader is referred to Plichta et al. [ 2006a]. We controlled for multiple testing by applying the Dubey/Armitage‐Parmar (DAP) alpha boundary [Sankoh et al., 1997] for all channels. Generally, DAP corrects for multiple comparisons considering the correlations between the data. If the correlation between the channels is zero, DAP is equivalent to Bonferroni's correction. The higher the correlations, the more liberal the corrected [alpha]‐level becomes. At a correlation of 0.5, DAP corresponds to the correction procedure suggested by Tukey et al. [1985], for details, see Sankoh et al. [ 1997].
After performing the GLM analysis, separate ANOVAs were applied to the resulting beta weights, with the independent factor genotype group and the dependent factor task condition. For validation of the paradigm, a one sample t‐test was calculated for each task condition. Subsequently, ANOVAs were performed for each genotype group separately, in order to further investigate the differences between the groups. HHb was analyzed but yielded no additional information, and therefore is not discussed further.
RESULTS
Behavioral Data
On the behavioral level, three were no significant differences between the SS and LL groups (for details see Table I).
EMG Data
The multivariate ANOVA yielded significant differences for the different task conditions (1) nogo, (2) successful inhibition, and (3) unsuccessful inhibition [F (1, 28) = 92,63, P < 0.001].
Consecutively performed post hoc t‐tests, yielded a significant difference between (a) the nogo condition, in which subjects were required not to respond and the successful inhibition condition [t (1, 29) = −2.836, P = 0.008]; (b) the unsuccessful and the successful inhibition condition [t (1, 29) = −3.609, P = 0.001]; and (c) the unsuccessful inhibition condition and the nogo condition [t (1, 29) = 5.844, P = 0.000]. The muscle activity is shown in Figure 2.
Figure 2.

EMG activity for the different conditions. [Color figure can be viewed in the online issue, which is available at wileyonlinelibrary.com.]
When calculating a multivariate ANOVA to control for differences between the genotypes, we did not find any significant differences [F (1, 28) = 0.914, P = 0.448].
Imaging Data
As evidenced by one‐sample t‐tests, a significant activation in eight channels for the nogo condition, corresponding to the dorsolateral prefrontal cortex (dlPFC), three channels in the successful inhibition condition, and 17 channels in the unsuccessful inhibition condition, which correspond to the IFC, were found (see Table II and Figs. 3 and 4). After DAP‐correction, the go condition yielded no significant activation in any channel (P > 0.20).
Table II.
Significant channels at the nogo condition, the unsuccessful inhibition condition, and the successful inhibition condition, after correction with DAP
| O2Hb Nogo | Unsuccessful inhibition | Successful inhibition | ||||||
|---|---|---|---|---|---|---|---|---|
| Channel | t df = 54 | P | Channel | t df = 54 | P | Channel | t df = 54 | P |
| 1 | 3.98 | 0.0002 | 1 | −2.92 | 0.0049 | 11 | 3.55 | 0.0008 |
| 2 | 3.04 | 0.0036 | 3 | −2.91 | 0.0051 | 32 | 2.93 | 0.0049 |
| 3 | 3.29 | 0.0017 | 4 | −3.96 | 0.0002 | 34 | 3.10 | 0.0030 |
| 4 | 2.98 | 0.0042 | 5 | −5.29 | 0.0000 | |||
| 8 | 3.07 | 0.0032 | 6 | −6.03 | 0.0000 | |||
| 11 | 3.67 | 0.0005 | 7 | −5.17 | 0.0000 | |||
| 14 | 3.07 | 0.0033 | 8 | −3.22 | 0.0022 | |||
| 25 | 2.98 | 0.0042 | 10 | −4.26 | 0.0001 | |||
| 15 | −3.29 | 0.0017 | ||||||
| 16 | −5.76 | 0.0000 | ||||||
| 17 | −4.68 | 0.0000 | ||||||
| 26 | −3.18 | 0.0024 | ||||||
| 27 | −4.21 | 0.0001 | ||||||
| 28 | −2.87 | 0.0058 | ||||||
| 34 | 3.21 | 0.0022 | ||||||
| 37 | −3.59 | 0.0007 | ||||||
| 38 | −2.99 | 0.0041 | ||||||
| 44 | 2.92 | 0.0050 | ||||||
Figure 3.

Optode placements for the frontal probe set on the head. [Color figure can be viewed in the online issue, which is available at wileyonlinelibrary.com.]
Figure 4.

Significant channels for the three task conditions, t‐values corrected with DAP. [Color figure can be viewed in the online issue, which is available at wileyonlinelibrary.com.]
The second level analyses for O2Hb revealed a significant main effect of NOS1 Ex1f‐VNTR for channel 37 in the nogo condition[F (1, 54) = 9.0257, P = 0.004], and channels 45 [F (1, 54) = 8.2902, P = 0.0057], 46 [F (1, 54) = 13.8383, P = 0.0005], and 49 [F (1, 54) = 8.4562, P = 0.0053], in the successful inhibition condition. The corresponding t‐maps are displayed in Figure 5. The unsuccessful inhibition condition showed no significant differences between the genotype groups after correction with the DAP boundary.
Figure 5.

A, Significantly differing channels in a) nogo‐ and b) successful inhibition condition, between the SS and the LL genotype, t‐values corrected with DAP. B, Significantly activated channels for the nogo condition between the SS and the LL genotype, t‐values corrected with DAP. C, Significantly activated channels for the successful inhibition condition, t‐values corrected with DAP. [Color figure can be viewed in the online issue, which is available at wileyonlinelibrary.com.]
When analyzing the two groups separately using separate ANOVAs for each channel, the activation pattern for the main effect condition differed for both groups, as can be seen in Table III and Figures 5 and 6. The ANOVAs were corrected with the DAP boundary.
Table III.
Significant channels for both groups separately, corrected with DAP
| LL | SS | |||
|---|---|---|---|---|
| Channel | T df = 28 | P | T df = 24 | P |
| NoGo O2Hb | ||||
| 1 | 3.66 | 0.0010 | n.s. | |
| 3 | 3.68 | 0.0009 | n.s. | |
| 4 | 3.93 | 0.0005 | n.s. | |
| 5 | 3.60 | 0.0012 | n.s. | |
| 6 | 3.40 | 0.0020 | n.s. | |
| 8 | 3.27 | 0.0028 | n.s. | |
| 11 | 3.04 | 0.0049 | n.s. | |
| 14 | 3.72 | 0.0008 | n.s. | |
| 15 | 4.04 | 0.0004 | n.s. | |
| 17 | 3.31 | 0.0025 | n.s. | |
| 18 | 3.43 | 0.0018 | n.s. | |
| 25 | 3.42 | 0.0019 | n.s. | |
| 28 | 3.77 | 0.0007 | n.s. | |
| Unsuccessful inhibition condition | ||||
| 4 | n.s. | −2.92 | 0.0072 | |
| 5 | −3.76 | 0.0007 | −3.65 | 0.0012 |
| 6 | −4.72 | 0.0001 | −3.77 | 0.0009 |
| 7 | −3.52 | 0.0014 | −3.75 | 0.0009 |
| 10 | n.s. | −3.06 | 0.0052 | |
| 16 | −4.02 | 0.0004 | −4.08 | 0.0004 |
| 17 | −3.07 | 0.0046 | −3.53 | 0.0016 |
| 27 | n.s. | −3.12 | 0.0045 | |
| 28 | n.s. | −2.97 | 0.0064 | |
| 34 | n.s. | 3.12 | 0.0044 | |
| 37 | n.s. | −2.96 | 0.0065 | |
| Successful inhibition condition | ||||
| 11 | 2.99 | 0.0055 | n.s. | |
| 32 | 3.00 | 0.0055 | n.s. | |
| 35 | 2.82 | 0.0085 | n.s. | |
| 37 | n.s. | −3.27 | 0.0031 | |
| 45 | 3.93 | 0.0005 | n.s. | |
| 46 | 3.31 | 0.0025 | n.s. | |
Figure 6.
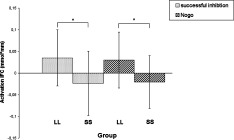
Differences in optodes 15 and 45 for the nogo and the successful inhibition condition, respectively, for both groups.
DISCUSSION
We investigated the effect of the NOS1 ex1f‐VNTR on impulsive measures and prefrontal brain activation in healthy adults. In this context, the subjects performed a combined go/nogo‐stop signal task, while prefrontal activation was measured using fNIRS. On the behavioral level, we could not find any differences between carriers of the long variant and carriers of the short variant of the NOS1 ex‐1f‐VNTR. This contradicts earlier finding from our group [Reif et al., 2011], where we also employed a stop signal paradigm and found differences in the omission error rates. However, the present sample was rather small compared with the previous one, where over 500 subjects were investigated. It is thus likely that the present study was underpowered to detect small genetic effects on behavior.
The same is true for questionnaire data, as we also administered subjective measurements of impulsivity in the form of the I7 and the UPPS. Both did not yield significant differences between the supposedly less impulsive long allele group and the supposedly more impulsive short allele group. Again that could be due to the small sample size, and/or the administered questionnaires might not be sensitive enough to detect small differences in behavior.
To our best knowledge, this is the first report on a combined go/nogo‐stop signal paradigm investigated with fNIRS. Different fMRI studies [Congdon and Canli, 2008] provided an informed guess regarding the region of interest of activation, namely the IFC. In the present study we could replicate earlier findings from fMRI data in both the successful and the unsuccessful inhibition condition, in which the IFC was found to be activated using fNIRS. However, there was a difference regarding the activated region for the nogo task. This task does not require the inhibition of previously initiated movements, but implies that no action is to be taken right from the start. It therefore differs from the stop‐signal task, which might explain the differential activation pattern that indicated neural responses in the dorsolateral prefrontal cortex (dlPFC) in response to the nogo task. The dlPFC has been suggested to be involved in sustained attention and self control [Corbetta and Shulman, 2002], both of which are crucial to the successful performance on an inhibition task. Accordingly, Chevrier et al. [ 2007] suggested that the right dlPFC areas are responsible for the withholding of a response right from the start. Thus, it appears reasonable to assume that the nogo and the stop‐signal task involve different brain regions, with the former demanding control on overall motor behavior, while the latter requires inhibition of an already initiated action. In line with these assumptions we found EMG differences in M. extensor digitorum activity for the different inhibition conditions, where significantly higher muscle activation took place in the stop signal task as compared with the nogo task, even when the outcome was successful inhibition in both tasks (Fig. 6). This might also be explained by the different nature of inhibition. While the stop signal task triggers selective inhibition [Aron and Verbruggen, 2008; Coxon et al., 2007], the nogo task can be inhibited upstream of M1 by the prefrontal cortex.
Both the nogo and the successful inhibition condition produce significantly lower activity in the brains of SS allele subjects. This extends previous findings from our group [Reif et al., 2009], which showed an effect of NOS1 ex1f‐VNTR on prefrontal functioning in the anterior cingulate cortex (ACC) during a go/nogo task, where the short allele carriers showed diminished ACC activation. Our findings are also in line with even earlier work from our group [Reif et al., 2006] which could show significantly decreased P300 Nogo amplitudes for the SS carriers, which has been linked to a defective response control. Rodent studies [Wultsch et al., 2007] have also hinted at the role of NOS1 as a regulator of impulsive behavior, and a recent study [Reif et al., 2011] produced further evidence for the role of NOS1 in impulsivity. Therefore it can be assumed that the lack in prefrontal activation in short allele carriers, as compared with long allele carriers, resulting in compromised inhibition processes probably as a consequence of decreased NOS1 gene expression. When considering the processes involved in the stop signal response inhibition, one should disentangle the processes involved. According to Aron et al. [2007], the go signal is likely generated by premotor areas, which in turn project to the basal ganglia and the striatum. From there, the signal returns to the motor cortex and a signal to the relevant effector is created [Aron et al., 2007a]. The stop process then needs to interfere with the go process at some point. Assuming that the stop command is being generated in the frontal cortex, the signal could be rapidly conveyed to the basal ganglia via the so called “hyperdirect pathway,” intercepting the go process in the final stages of the “horse race” [Aron et al., 2007b]. The weaker signal in the prefrontal cortex for the stop task in short allele carriers might be due to diminished NO production in the prefrontal cortex as a consequence of decreased gene expression; however, at present it is unclear whether NOS1 exon 1f is expressed at all in this brain region. Alternatively, altered striatal output which can be assumed in the SS group due to the regulation of firing patterns by NO, could have modified prefrontal brain areas indirectly. Further studies on the expressional patterns of NOS and direct determination of neuronal firing patterns as well as studies using methods other than fNIRS, such as fMRI or PET, which allow for the measurement of activation in subcortical structures, like the striatum, are needed to address these issues. While we could not demonstrate changes on the behavioral level in the subjects studied in our sample (which most likely is due to the relatively small sample size), impaired prefrontal control as a direct or indirect consequence of nitrinergic dysfunction might explain our previous finding of impaired performance in a stop signal task in short allele carriers in a much larger sample [Reif et al., 2011]. Other dimensions of inhibition, such as the cognitive processes related to motivational inhibition and impulsive behaviors, have not been taken into account in this study. In‐depth experiments are necessary studying the effects of the NOS1 ex1f‐VNTR on reward processes and motivational aspects of impulsivity, especially to elucidate the precise neural mechanisms which are involved in the mechanism of action of NOS1 ex1f‐VNTR.
Further limitations of this study are inherent to the method of choice, since fNIRS is a measure of the BOLD signal, it is rather slow and can not detect differences between processes that differ in the timing dimension only. Moreover, the lacking depth of the infrared light prohibits any measures of deeper brain regions, allowing only a limited view on brain functionality.
Summarizing our results, we could demonstrate in a relatively small sample that NOS1 ex1f‐VNTR SS carriers, which are at risk to be more impulsive, exhibit significant differences in brain activation during motor inhibition processes relative to LL carriers which might explain the association data. The precise neural correlates and molecular mechanisms, however, are far from being understood and subject to further research.
Acknowledgements
T. Töpner, M. Harder, and R. Täglich are credited for excellent technical assistance. T. Dresler and A. Post are credited for assistance in the review process.
REFERENCES
- Aron AR, Behrens TE, Smith S, Frank MJ, Poldrack RA ( 2007a) Triangulating a cognitive control network using diffusion‐weighted magnetic resonance imaging (MRI) and functional MRI. J Neurosci 27: 3743–3752. [DOI] [PMC free article] [PubMed] [Google Scholar]
- Aron AR, Durston S, Eagle DM, Logan GD, Stinear CM, Stuphorn V ( 2007b) Converging evidence for a fronto‐basal‐ganglia network for inhibitory control of action and cognition. J Neurosci 27: 11860–11864. [DOI] [PMC free article] [PubMed] [Google Scholar]
- Aron AR, Fletcher PC, Bullmore ET, Sahakian BJ, Robbins TW ( 2003): Stop‐signal inhibition disrupted by damage to right inferior frontal gyrus in humans. Nat Neurosci 6: 115–116. [DOI] [PubMed] [Google Scholar]
- Aron AR, Verbruggen F ( 2008): Stop the presses: Dissociating a selective from a global mechanism for stopping. Psychol Sci 19: 1146–1153. [DOI] [PubMed] [Google Scholar]
- Avila C, Cuenca I, Felix V, Parcet M‐A, Miranda A ( 2004): Measuring impulsivity in school‐aged boys and examining its relationship with ADHD and ODD ratings. J Abnorm Child Psychol 32: 295–304. [DOI] [PubMed] [Google Scholar]
- Boehler CN, Appelbaum LG, Krebs RM, Hopf JM, Woldorff MG ( 2010): Pinning down response inhibition in the brain—Conjunction analyses of the stop‐signal task. Neuroimage 52: 1621–1632. [DOI] [PMC free article] [PubMed] [Google Scholar]
- Bros M, Boissel J‐P, Gödtel‐Armbrust U, Förstermann U ( 2006): Transcription of human neuronal nitric oxide synthase mRNAs derived from different first exons is partly controlled by exon 1‐specific promoter sequences. Genomics 87: 463–473. [DOI] [PubMed] [Google Scholar]
- Chance B ( 1991): Optical method. Annu Rev Biophys Biophys Chem 20: 1–28. [DOI] [PubMed] [Google Scholar]
- Chevrier AD, Noseworthy MD, Schachar R ( 2007): Dissociation of response inhibition and performance monitoring in the stop signal task using event‐related fMRI. Hum Brain Mapp 28: 1347–1358. [DOI] [PMC free article] [PubMed] [Google Scholar]
- Congdon E, Canli T ( 2005): The endophenotype of impulsivity: Reaching consilience through behavioral, genetic, and neuroimaging approaches. Behav Cogn Neurosci Rev 4: 262–281. [DOI] [PubMed] [Google Scholar]
- Congdon E, Canli T ( 2008): A neurogenetic approach to impulsivity. J Pers 76: 1447–1484. [DOI] [PMC free article] [PubMed] [Google Scholar]
- Corbetta M, Shulman GL ( 2002): Control of goal‐directed and stimulus‐driven attention in the brain. Nat Rev Neurosci 3: 201–215. [DOI] [PubMed] [Google Scholar]
- Coxon JP, Stinear CM, Byblow WD ( 2007): Selective inhibition of movement. J Neurophysiol 97: 2480–2489. [DOI] [PubMed] [Google Scholar]
- De Jong R, Coles MG, Logan GD, Gratton G ( 1990): In search of the point of no return: The control of response processes. J Exp Psychol Hum Percept Perform 16: 164–182. [DOI] [PubMed] [Google Scholar]
- Eysenck SB, Eysenck HJ ( 1977): The place of impulsiveness in a dimensional system of personality description. Br J Soc Clin Psychol 16: 57–68. [DOI] [PubMed] [Google Scholar]
- Fallgatter AJ, Brandeis D, Strik WK ( 1997): A robust assessment of the NoGo‐anteriorisation of P300 microstates in a cued Continuous Performance Test. Brain Topogr 9: 295–302. [DOI] [PubMed] [Google Scholar]
- Fallgatter AJ, Herrmann MJ ( 2001): Electrophysiological assessment of impulsive behavior in healthy subjects. Neuropsychologia 39: 328–333. [DOI] [PubMed] [Google Scholar]
- Firbank M, Okada E, Delpy DT ( 1998): A theoretical study of the signal contribution of regions of the adult head to near‐infrared spectroscopy studies of visual evoked responses. Neuroimage 8: 69–78. [DOI] [PubMed] [Google Scholar]
- Fossati A, Barratt ES, Carretta I, Leonardi B, Grazioli F, Maffei C ( 2004): Predicting borderline and antisocial personality disorder features in nonclinical subjects using measures of impulsivity and aggressiveness. Psychiatry Res 125: 161–170. [DOI] [PubMed] [Google Scholar]
- Galimberti D, Scarpini E, Venturelli E, Strobel A, Herterich S, Fenoglio C, Guidi I, Scalabrini D, Cortini F, Bresolin N, Lesch K‐P, Reif A. ( 2008): Association of a NOS1 promoter repeat with Alzheimer's disease. Neurobiol Aging 29: 1359–1365. [DOI] [PubMed] [Google Scholar]
- Herrmann MJ, Plichta MM, Ehlis A‐C, Fallgatter AJ ( 2005): Optical topography during a Go‐NoGo task assessed with multi‐channel near‐infrared spectroscopy. Behav Brain Res 160: 135–140. [DOI] [PubMed] [Google Scholar]
- Hirth C, Villringer K, Thiel A, Bernarding J, Muhlnickl W, Obrig H, Dirnagl U, Villringer A ( 1997): Towards brain mapping combining near‐infrared spectroscopy and high resolution 3D MRI. Adv Exp Med Biol 413: 139–147. [DOI] [PubMed] [Google Scholar]
- Hock C, Villringer K, Muller‐Spahn F, Wenzel R, Heekeren H, Schuh‐Hofer S, Hofmann M, Minoshima S, Schwaiger M, Dirnagl U, Villringer A. ( 1997): Decrease in parietal cerebral hemoglobin oxygenation during performance of a verbal fluency task in patients with Alzheimer's disease monitored by means of near‐infrared spectroscopy (NIRS)—Correlation with simultaneous rCBF‐PET measurements. Brain Res 755: 293–303. [DOI] [PubMed] [Google Scholar]
- Horn W ( 1983): LPS Leistungsprüfsystem. Göttingen: Hogrefe Verlag für Psychologie. [Google Scholar]
- Hoshi Y ( 2007): Functional near‐infrared spectroscopy: Current status and future prospects. J Biomed Opt 12: 062106. [DOI] [PubMed] [Google Scholar]
- Jasper HH ( 1958): The ten‐twenty electrode system of the International Federation. Electroencephalogr Clin Neurophysiol 10: 371–375. [PubMed] [Google Scholar]
- Lehrl S ( 2005): MWT‐B Mehrfachwahl. Wortschatz‐Intelligenztest. Balingen: Spitta‐Verlag. [Google Scholar]
- Logan GD, Cowan WB ( 1984): On the ability to inhibit thought and action: A theory of an act of control. Psychol Rev 91: 295–327. [DOI] [PubMed] [Google Scholar]
- Logan GD, Schachar RJ, Tannock R ( 1997a) Impulsivity and inhibitory control. Psychol Sci 8: 60–64. [Google Scholar]
- Logan GD, Schachar RJ, Tannock R ( 1997b): Impulsivity and inhibitory control. Psychol Sci 8: 60–64. [Google Scholar]
- Logothetis NK, Wandell BA ( 2004): Interpreting the BOLD signal. Annu Rev Physiol 66: 735–769. [DOI] [PubMed] [Google Scholar]
- Obrig H, Villringer A ( 2003): Beyond the visible—Imaging the human brain with light. J Cereb Blood Flow Metab 23: 1–18. [DOI] [PubMed] [Google Scholar]
- Okamoto M, Dan H, Sakamoto K, Takeo K, Shimizu K, Kohno S, Oda I, Isobe S, Suzuki T, Kohyama K, Dan I. ( 2004): Three‐dimensional probabilistic anatomical cranio‐cerebral correlation via the international 10–20 system oriented for transcranial functional brain mapping. Neuroimage 21: 99–111. [DOI] [PubMed] [Google Scholar]
- Plichta MM, Herrmann MJ, Baehne CG, Ehlis AC, Richter MM, Pauli P, Fallgatter AJ ( 2006a): Event‐related functional near‐infrared spectroscopy (fNIRS): Are the measurements reliable? Neuroimage 31: 116–124. [DOI] [PubMed] [Google Scholar]
- Reif A ( 2009): Die Bedeutung Stickstoffmonoxid‐Vermittelter Neurotransmission für psychische Erkrankungen. Würzburg: Julius‐Maximilians‐Universität Würzburg; pp 116. [Google Scholar]
- Reif A, Herterich S, Strobel A, Ehlis AC, Saur D, Jacob CP, Wienker T, Topner T, Fritzen S, Walter U, Schmitt A, Fallgatter AJ, Lesch K‐P. ( 2006): A neuronal nitric oxide synthase (NOS‐I) haplotype associated with schizophrenia modifies prefrontal cortex function. Mol Psychiatry 11: 286–300. [DOI] [PubMed] [Google Scholar]
- Reif A, Jacob CP, Rujescu D, Herterich S, Lang S, Gutknecht L, Baehne CG, Strobel A, Freitag CM, Giegling I, Romanos M, Hartmann A, Rosler M, Renner TJ, Fallgatter AJ, Retz W, Ehlis AC, Lesch K‐P. ( 2009): Influence of functional variant of neuronal nitric oxide synthase on impulsive behaviors in humans. Arch Gen Psychiatry 66: 41–50. [DOI] [PubMed] [Google Scholar]
- Reif A, Kiive E, Kurrikoff T, Paaver M, Herterich S, Konstabel K, Tulviste T, Lesch KP, Harro J ( 2011): A functional NOS1 promoter polymorphism interacts with adverse environment on functional and dysfunctional impulsivity. Psychopharmacology (Berl) 214: 239–248. [DOI] [PubMed] [Google Scholar]
- Rieger M, Gauggel S, Burmeister K ( 2003): Inhibition of ongoing responses following frontal, nonfrontal, and basal ganglia lesions. Neuropsychology 17: 272–282. [DOI] [PubMed] [Google Scholar]
- Sankoh AJ, Huque MF, Dubey SD ( 1997): Some comments on frequently used multiple endpoint adjustment methods in clinical trials. Stat Med 16: 2529–2542. [DOI] [PubMed] [Google Scholar]
- Schmidt RE, Gay P, d'Acremont M, Van der Linden M ( 2008): A German adaptation of the UPPS Impulsive Behavior Scale: Psychometric properties and factor structure. Swiss J Psychol 67: 107–112. [Google Scholar]
- Seroczynski AD, Bergeman CS, Coccaro EF ( 1999): Etiology of the impulsivity/aggression relationship: Genes or environment? Psychiatry Res 86: 41–57. [DOI] [PubMed] [Google Scholar]
- Sheehan DV, Lecrubier Y, Sheehan KH, Amorim P, Janavs J, Weiller E, Hergueta T, Baker R, Dunbar GC ( 1998): The Mini‐International Neuropsychiatric Interview (M.I.N.I.): The development and validation of a structured diagnostic psychiatric interview for DSM‐IV and ICD‐10. J Clin Psychiatry 59: 34–57. [PubMed] [Google Scholar]
- Wager TD, Nichols TE ( 2003): Optimization of experimental design in fMRI: A general framework using a genetic algorithm. Neuroimage 18: 293–309. [DOI] [PubMed] [Google Scholar]
- Whiteside SP, Lynam DR, Miller JD, Reynolds SK ( 2005): Validation of the UPPS impulsive behaviour scale: A four‐factor model of impulsivity. Eur J Pers 19: 559–574. [Google Scholar]
- Wultsch T, Chourbaji S, Fritzen S, Kittel S, Grunblatt E, Gerlach M, Gutknecht L, Chizat F, Golfier G, Schmitt A, Gass P, Lesch K‐P, Reif A. ( 2007): Behavioural and expressional phenotyping of nitric oxide synthase‐I knockdown animals. J Neural Transm Suppl 72: 69–85. [DOI] [PubMed] [Google Scholar]