

Abstract
Familial risk for attention‐deficit hyperactivity disorder (ADHD) has been associated with changes in brain activity related to cognitive control. However, it is not clear whether changes in activation are the primary deficit or whether they are related to impaired communication between regions involved in this ability. We investigated whether (1) functional connectivity between regions involved in cognitive control was affected by familial risk and (2) changes were specific to these regions. Correlational seed analyses were used to investigate temporal covariance between cognitive control and motor regions in two independent samples of typically developing controls, subjects with ADHD and their unaffected siblings. In both samples, correlation coefficients between cognitive control regions were greater for typically developing controls than for subjects with ADHD, with intermediate values for unaffected siblings. Within the motor network, unaffected siblings showed correlations similar to typically developing children. There were no differences in activity between the brain regions involved. These data show that functional connectivity between cognitive control regions is sensitive to familial risk for ADHD. Results suggest that changes in connectivity associated with cognitive control may be suitable as an intermediate phenotype for future studies. Hum Brain Mapp, 2010. © 2010 Wiley‐Liss, Inc.
Keywords: attention deficit hyperactivity disorder, correlational seed analyses, endophenotype, fMRI
INTRODUCTION
Attention deficit hyperactivity disorder (ADHD) is a developmental disorder characterized by poor behavioral control and impairments in attention. Symptoms associated with ADHD are heterogeneous, both at the behavioral level (e.g., in some individuals inattentive symptoms are most prominent, while in others it may be impulsive and hyperactive symptoms that are most impairing) and the cognitive level (cognitive deficits are only present in a subset of individuals diagnosed with ADHD). This may be because various biological changes can lead to the ADHD phenotype [Castellanos and Tannock,2002; Gottesman and Gould,2003]. However, ADHD is often conceptualized as being related to changes in cognitive control. Although only a subset of affected individuals may have established impairments in this domain, it has proven to be a useful construct in ADHD research [Aron and Poldrack,2005; Durston et al.,2009]. Functional magnetic resonance imaging (fMRI) studies have shown reduced brain activity during tasks that tap cognitive control [Bush et al.,2005; Castellanos and Tannock,2002; Dickstein et al.,2006; Durston et al.,2009]. Furthermore, these measures have been shown to be useful as intermediate phenotypes in ADHD‐research: measures of brain function are likely to be closer to causative agents (e.g., genetic variations) than behavior and as such form a more homogeneous phenotype for research. As such, they can help to identify biological pathways to ADHD [Castellanos and Tannock,2002; Durston et al.,2009; Gottesman and Gould,2003; Gould and Gottesman,2006].
Recent findings have suggested that neural connectivity is affected in ADHD, both during tasks and when the brain is at rest [Casey et al.,2007; Castellanos et al.,2008; Fassbender et al.,2009; Murias et al.,2007; Tian et al.,2006; Uddin et al.,2008; Wang et al.,2009; Wolf et al.,2009; Zang et al.,2007]. This raises the question whether well‐established changes in brain activity in ADHD are related to changes in connectivity between brain regions.
Studies of typically developing children, subjects with ADHD and their unaffected siblings have shown that changes in activity related to cognitive control are sensitive to familial risk for the disorder [Durston et al.,2006; Mulder et al.,2008]. However, it is not clear whether it is the level of activity per se that is under familial influences, or whether changes in connectivity in cognitive control circuits may be driving these findings. We set out to address this by investigating familial effects on connectivity between regions of the cognitive control network: We identified regions that temporally covaried during a cognitive control paradigm and investigated differences in the strength of these task‐dependent connections between typically developing children and adolescents, subjects with ADHD and their unaffected siblings. We hypothesized that task‐dependent functional connectivity of cognitive control networks would be decreased for subjects with ADHD compared with typically developing controls. Furthermore, we hypothesized that connectivity in these networks would be sensitive to familial risk (i.e., correlation coefficients for unaffected siblings would be intermediate between subjects with ADHD and controls). To ensure that changes in connectivity were not related to changes in activity levels in the brain regions involved, we selected seed regions where the BOLD‐signal did not differ between groups. Furthermore, we tested whether findings were specific to regions of the cognitive control network by investigating temporal covariation within the motor network during the same task. Finally, to lend confidence to our findings, we sought to replicate our results in an independent sample.
MATERIALS AND METHODS
Subjects
FMRI‐data from two independent samples from previously published fMRI‐studies were reanalyzed for the purpose of this article. All analyses were initially run on the first sample and the second sample was included exclusively for purposes of replication. Sample 1 included 33 male subjects (11 sibling pairs discordant for ADHD and 11 typically developing, matched controls), between the ages of 8 and 20 years [Durston et al.,2006]. Sample 2 included 36 male subjects (12 sibling pairs discordant for ADHD and 12 typically developing, matched controls), between the ages of 9 and 19 years [Mulder et al.,2008]. Subjects with ADHD were required to have received a clinical ADHD diagnosis from our department and to meet DSM‐IV criteria for ADHD, as assessed by DISC interview. No other comorbidities than oppositional defiant disorder and conduct disorder were permitted. Siblings and control subjects were excluded if they met DSM‐IV criteria for any psychiatric diagnosis, as assessed by DISC interview. In addition, Child Behavior Checklist scores were obtained to ascertain the presence of ADHD‐related symptoms in siblings and control subjects (for details see Table I). In sample 1, seven subjects with ADHD were on stimulant medication at the time they were approached for the study. In sample 2, there were six subjects with ADHD on stimulant medication. All discontinued medication for at least 24 h prior to the scan.
Table I.
Descriptive variables for controls, unaffected siblings, and siblings with ADHD
| Sample 1 | Sample 2 | |||||
|---|---|---|---|---|---|---|
| Controls (N = 11) | Siblings (N = 11) | ADHD (N = 11) | Controls (N = 12) | Siblings (N = 12) | ADHD (N = 12) | |
| Age | ||||||
| Mean | 15.27 (1.92) | 14.45 (2.58) | 13.97 (3.14) | 15.0 (2.1) | 14.1 (2.7) | 14.9 (2.3) |
| IQ | ||||||
| Mean | 106 (14) | 107 (15) | 100 (10) | 107 (20) | 115 (20) | 108 (22) |
| Hand preference | ||||||
| (L/R) | 0/11 | 0/11 | 2/9 | 3/9 | 1/11 | 3/9 |
| ADHD (N on DISC) | ||||||
| Combined | 0 | 0 | 10 | 0 | 0 | 9 |
| Hyperactive | 0 | 0 | 1 | 0 | 0 | 3 |
| ODD | 0 | 0 | 3 | 0 | 0 | 4 |
| CBCL | ||||||
| ADHD | 51.6 (1.8) | 52.7 (3.7) | 62.1 (6.7)** | 52.2 (3.3) | 54.3 (5.8) | 60.9 (10.0)** |
| ODD | 52.2 (3.0) | 53.3 (5.2) | 60.3 (6.1)** | 50.9 (1.6) | 51.3 (2.3) | 60.6 (9.2)* |
| CD | 50.7 (1.2) | 53.7 (5.0) | 59.7 (6.9)** | 50.4 (0.5) | 51.9 (3.1) | 59.8 (7.9)* |
| Affective problems | 52.5 (4.9) | 52.5 (3.8) | 59.5 (9.2)* | 52.5 (3.6) | 55.3 (6.6) | 58.3 (9.6) |
| Anxiety problem | 51.1 (1.5) | 52.8 (3.7) | 56.7 (6.3)* | 55.3 (7.3) | 52.8 (4.8) | 53.9 (5.8) |
| Somatic problems | 51.6 (2.8) | 53.5 (3.6) | 56.9 (6.3)* | 54.6 (4.1) | 54.3 (5.0) | 55.2 (6.1) |
| Anxious/depressed | 50.5 (1.2) | 52.1 (4.2) | 56.7 (7.2)** | 52.9 (4.9) | 52.8 (5.4) | 53.3 (8.3) |
| Withdrawn/depressed | 53.2 (4.5) | 55.7 (6.2) | 57.4 (8.5) | 52.6 (3.8) | 59.2 (8.9) | 58.3 (8.5) |
| Somatic Complaints | 51.5 (2.7) | 53.5 (3.2) | 57.5 (7.8)** | 53.3 (3.6) | 55.8 (4.1) | 55.2 (5.0) |
| Social problems | 50.8 (1.6) | 52.2 (5.0) | 58.6 (8.6)** | 52.8 (5.6) | 52.7 (4.0) | 58.8 (9.8) |
| Thought problems | 50.7 (1.5) | 51.7 (2.9) | 60.8 (8.1)** | 53.5 (5.1) | 52.8 (5.3) | 57.7 (8.3) |
| Attention problems | 52.1 (2.3) | 52.5 (4.1) | 59.2 (5.9)** | 52.6 (3.6) | 54.8 (5.6) | 59.3 (8.3)** |
| Rule‐breaking behavior | 50.8 (0.8) | 54.8 (5.3) | 59.5 (5.7)** | 50.4 (0.7) | 52.2 (3.0) | 58.4 (5.6)* |
| Aggressive behavior | 51.0 (2.4) | 52.8 (5.0) | 60.9 (7.8)** | 50.5 (1.5) | 51.8 (3.9) | 62.3 (10.7)* |
| SES | ||||||
| Mothers's education (years) | 11.8 | 11.3 | 11.3 | 13.2 | 13.5 | 13.5 |
| Father's education (years) | 10.9 | 12.2 | 12.2 | 14.0 | 14.1 | 14.1 |
| On stimulant medication | 0 | 0 | 6 | 0 | 0 | 7 |
ADHD, attention deficit hyperactivity disorder; ODD, oppositional defiant disorder; CD, Conduct Disorder; SES, socio‐economic status; DISC, Diagnostic Interview Schedule for Children; CBCL, Child Behavior Checklist.
P < 0.05;
P < 0.01.
Paradigms
All subjects performed a variation of a go/nogo paradigm, which are described in detail elsewhere [Durston et al.,2006; Mulder et al.,2008]. For sample 1, the subjects' task was to press a button in response to visually presented stimuli, but to avoid responding to a rare nontarget. The task consisted of five runs, which lasted 3 min and 56 s each. Each run contained a total of 57 trials, with 75% go trials, resulting in a total of 70 nogo trials, including 20 of each type (with 1, 3, or 5 preceding go trials) per subject. Foil trials (nogo trials after 2 or 4 go trials) were also included, to prevent subjects learning the pattern. The order of presentation of the different types of nogo trials was pseudorandomized. To make the task more interesting for children, characters from the Pokemon cartoon series were used as stimuli. Stimuli were projected using a through‐projection screen and slide projector. Responses were collected using an MRI compatible air pressure button box.
In sample 2, subjects were asked to perform a variation of this go/nogo paradigm, where they were to press a single response button whenever a target stimulus was presented [Davidson et al.,2004; Durston et al.,2007]. Here, the temporal predictability of events was manipulated, in addition to the predictability of the type of the stimulus (i.e., nogo versus go‐stimuli). The task was designed to build up the expectancy of an event occurring (the frequent and predictable go‐trial). Subjects were required to adjust their behavior when that prediction was violated (i.e., inhibit a prepotent button press on nogo trials or press the button at an unexpected time on unpredictable go trials). The task was presented in the context of a computer game, where subjects were asked to help feed a hungry little mouse as much cheese as possible. The target stimulus was a cartoon drawing of a piece of cheese, whereas the unexpected stimulus was a cartoon drawing of a cat. During the interstimulus interval, a mouse hole remained on the screen, briefly opening to reveal one of the experimental stimuli in a continuous stream of trials.
MRI Scan Acquisition and Preprocessing
All subjects participated in a practice session prior to scanning, using an MRI simulator at the Department of Child and Adolescent Psychiatry, University Medical Center Utrecht, the Netherlands. For sample 1, MRI images were acquired on a 1.5‐T Philips Gyroscan (Philips Medical Systems, Best, the Netherlands), housed at the Department of Radiology in the same hospital. Functional MRI scans consisted of a navigated three‐dimensional PRESTO pulse sequence (time to echo [TE] 11 msec, repetition time [TR] 21.74 ms, flip angle 9.0°, matrix 64 × 64 × 24, field of view [FOV] 256 × 256 × 96 mm3, voxel size 4 mm isotropic, and scan duration 2.0 sec per 24‐slice volume), covering the whole brain. For sample 2, MR images were acquired on a 1.5‐T Philips Allegra MR scanner (Philips Medical Systems, Best, the Netherlands). Functional MRI scans consisted of a navigated three‐dimensional PRESTO pulse sequence (TE = 11 ms, TR = 21.74 ms, flip angle 9.0°, matrix 64 × 64 × 36, FOV: 256 × 256 × 144 mm3, voxel size 4 mm isotropic, and scan duration 2.0 s per 36‐slice volume), covering the whole brain. Anatomical T1‐weighted three‐dimensional fast field echo scans with 170 1.2‐mm contiguous coronal slices of the whole head (TE = 4.6 ms, TR = 30 ms, flip angle 30 degrees, FOV 256 mm, in‐plane voxel size 1 × 1 mm2) were also acquired.
MR images were preprocessed using Statistical Parametric Mapping software (SPM5, Wellcome Department of Imaging Neuroscience, London). First, functional time‐series were realigned to the first image to correct for motion artifacts using a 6‐parameter (rigid body) spatial transformation [Friston et al.,1995]. In addition, the T1‐weighted anatomical image was coregistered to the functional time‐series by using Mutual Information [Collignon et al.,1995; Wells et al.,1996]. Time‐series were normalized to standard stereotactic space (Montreal Neurological Institute template) and resliced with a voxelsize of 4 × 4 × 4 (same as raw voxelsize). Finally, functional images were smoothed with an 8 × 8 × 8 kernel FWHM. Global effects were removed using a voxel‐level linear model of the global signal [LMGS; Macey et al.,2004]. This method accounts for both high and low frequencies that are identified as global across all scans throughout the whole brain. After removal of these effects, we further used a high‐pass filter (128 s) during first‐level analyses of the seed‐correlational analyses to remove nonglobal low‐frequency noise.
Seed Definitions From Task‐Related Data
All first level analyses were run for each sample separately and are described in detail elsewhere [Durston et al.,2006; Mulder et al.,2008]. In short, each GLM included at least two effects of interest (go trials, nogo trials). The event types were time‐locked to stimulus by a canonical synthetic haemodynamic response function (HRF) and its first‐order temporal derivative. For each subject, contrast‐images were obtained by contrasting go and nogo regressors, and taken to the second‐level analyses.
Seed regions were selected using a whole‐brain second‐level one‐sampled t‐test over all subjects to avoid selection bias toward a specific group (P = 0.0001, extent 10 voxels; corresponding to P = 0.05 corrected at the cluster level). Three seed regions were chosen. Two regions associated with cognitive control were taken from the nogo>go contrast: anterior cingulate gyrus (ACG; talairach coordinates for sample 1 and 2 resp.: 4, 40, 16 and 12, 40, 20) and right inferior frontal gyrus (rIFG; talairach coordinates for sample 1 and 2 resp.: 32, 22, −8 and 40, 23, −8). One region associated with motor responses was taken from the go>nogo contrast: motor cortex (MTC; talairach coordinates: −55, −24, 49). The two cognitive control regions were chosen as they have frequently been shown to be involved in this ability in neuroimaging studies [e.g., Aron et al.,2003; Badre et al.,2005; Botvinick,2004,2007; Carter,1998; Casey et al.,2002; Konishi et al.,1999; Pessoa and Ungerleider,2004; Ullsperger and Cramon,2001] as they have been implicated in ADHD [Bush et al.,2005; Castellanos et al.,2008; Chamberlain et al.,2009; Durston et al.,2006; Durston et al.,2007; Konrad et al.,2006; Mulder et al.,2008; Wolf et al.,2009]. The region in motor cortex was selected as a control region, to allow us to investigate whether changes in connectivity were specific to cognitive control regions.
For each seed region, the peak of activity was used to define 10 mm spheres (see Fig. 1). For each seed, a one‐way ANOVA was run to check whether there were any differences between groups in blood oxygenation level‐dependent (BOLD) signal in the seed regions: There was no difference between groups (controls; unaffected siblings; siblings with ADHD) in BOLD level in the seed regions for either sample (F < 2.5, P > 0.1).
Figure 1.
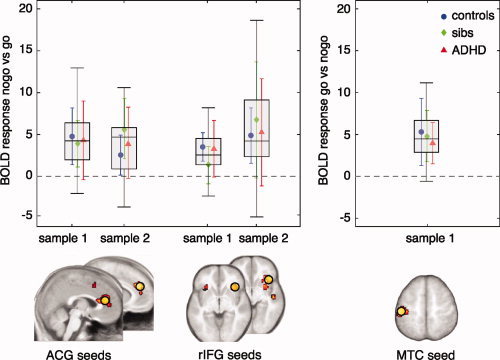
Seed points selected from whole group analyses. Seed regions were taken from a whole group one‐sample t‐test at P = 0.0001, extent 10 voxels (corresponding to P = 0.05 corrected at the cluster level) for each sample. For each seed region, the peak activity was used to define 10 mm spheres (yellow circles). The graphs show BOLD activity level in the seed regions from individual subjects (healthy controls—blue; unaffected siblings—green; and subjects with ADHD—red). Boxes represent the interquartile range (difference between first and third quartiles. Legend: ACG, anterior cingulate gyrus; BOLD, blood oxygenation level dependent; rIFG, right inferior frontal gyrus; MTC, motor cortex.
Correlational Seed Analyses
Correlational seed analyses were done for each sample separately. For each sphere, averaged individual time series were extracted from the task‐related fMRI data and entered in a general linear model (GLM) with the six motion parameters for each subject. Individual T‐maps were created for the covariate of interest from these individual GLM analyses and converted to R‐maps, using the Volumes toolbox for SPM. These R‐maps reflect individual maps of the correlation strength (correlation coefficient r) with the seed region per voxel. To allow for second level analyses of correlations, individual R‐maps were converted to z‐maps using Fisher's R to Z transformation. Two sampled t‐tests were run to test for differences in correlation patterns between typically developing controls and subjects with ADHD at P = 0.001, extent 10 voxels. For replication in the second sample, a more lenient threshold of P = 0.005, extent 5 voxels was allowed. Regions of interest (ROI) were identified as clusters exceeding these statistical thresholds. These ROIs represent the regions where connectivity with the seed region differs between groups. Individual values were extracted from each ROI and entered in a general linear model (univariate) analysis of variance (UNIANOVA). Dummy variables coding for ADHD or sibling status were used to compare groups. To control for possible developmental effects, we reran the analyses with age included as covariate [Lee et al.,2009]. Furthermore, for each ROI, beta values from the nogo>go and go>nogo contrasts were extracted to explore whether there were between‐group differences in the task‐related BOLD signal.
RESULTS
ACG‐Seed
Differences in correlations with ACG between typically developing individuals and subjects with ADHD were found for cerebellum (CB) (P < 0.001; k = 24, Fig. 2A). This was replicated in sample 2 (P = 0.002; k = 5, see Fig. 2A,B). In sample 1, the mean correlation coefficient for unaffected siblings was intermediate between that of controls and subjects with ADHD (F 1,30 = 4.97; P < 0.05 controls > unaffected siblings). In sample 2, the difference in correlation coefficient for siblings compared to controls and boys with ADHD was not significant (P = 0.4). Results did not change when age was controlled for. There were no differences between groups in the BOLD response in the region in cerebellum (P > 0.44). For sample 1, the results held after exclusion of the one subject with a diagnosis of ADHD‐HI (F 1,30 = 22.2; P < 0.001). For sample 2, the results held after exclusion of the three subjects with an ADHD‐HI diagnosis (F 1,30 = 7.5; P = 0.01).
Figure 2.
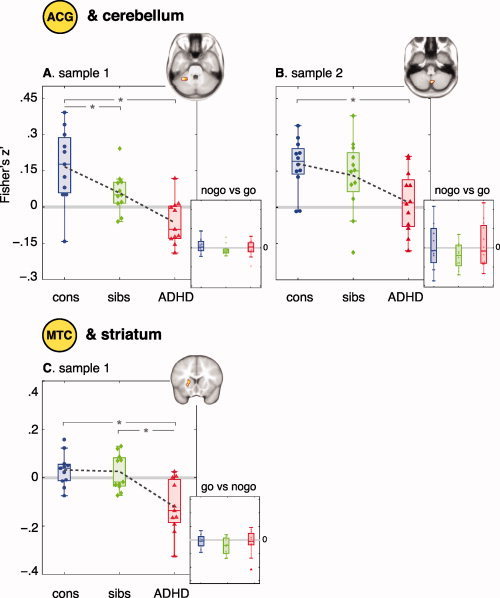
Group differences in functional connectivity. Functional connectivity between ACG and CB is decreased for subjects with ADHD (red) compared with typically developing controls (blue). Correlation coefficients for unaffected siblings (green) are intermediate (A and B). Functional connectivity between motor cortex and striatum is decreased for subjects with ADHD (red), but not for their unaffected siblings (green) (C). There are no differences between groups in the BOLD response in any of the regions (small graphs). Boxes represent the interquartile range, dashed lines connect means. * P < 0.05.
rIFG‐Seed
Differences between typically developing children and subjects with ADHD in correlations between rIFG and left inferior frontal gyrus (lIFG) did not exceed the statistical threshold of P = 0.001; k > 10.
MTC‐Seed
Differences between typically developing children and subjects with ADHD in correlations with motor cortex were found in striatum (P < 0.001; k = 12). The mean correlation coefficient for unaffected siblings was similar to that of the control group (P > 0.7), and differed from that of subjects with ADHD (t = 3.5; P < 0.01; see Fig. 2C). Results did not change significantly when age was controlled for. The results held after exclusion of the one subject with a diagnosis of ADHD‐HI (F 1,30 = 17.2; P < 0.001).
DISCUSSION
We found that functional connectivity between ACG and cerebellum was sensitive to familial risk for ADHD: both subjects with ADHD and their unaffected siblings showed lower correlation coefficients than typical controls, while the correlation coefficients for unaffected siblings were intermediate between those of subjects with ADHD and controls. No such effect was found for task‐related activity in these regions. Furthermore, there was no effect of familial risk on connectivity between regions of the motor network during the same task, suggesting that familial effects were specific to functional connectivity between regions involved in cognitive control, and not merely a consequence of differences in task‐related activity. Replication in a second sample lends confidence to these results.
The familial finding of reduced connectivity between ACG and cerebellum was not as strong in sample 2: Here, the intermediate correlation coefficient for unaffected siblings did not differ significantly from that of control subjects or subjects with ADHD. This may be related to the more complicated task‐design used with sample 2 (see Methods). This design resulted in fewer trials where simultaneous activation of ACG and cerebellum might be expected for sample 2 than sample 1. As such, lower statistical power to detect the familial effect might be expected. Furthermore, this is in line with the observation that there was more variance in the connectivity data from sample 2.
Our findings of changes in connectivity between ACG and cerebellum tie in with recent similar findings during a working memory task in ADHD [Wolf et al.,2009]. Findings of changes in connectivity in ADHD in two such different tasks suggest that this may be an integral part of the ADHD‐phenotype. Further support comes from studies of the brain's resting state in ADHD: These have suggested that moment‐to‐moment fluctuations in the low‐frequency range (representing the brain's resting state or default mode) may interfere with high‐frequency, task‐specific processes, thereby contributing to variability in task performance and interruption of goal‐directed activity [Sonuga‐Barke and Castellanos,2007]. Indeed, subjects with ADHD appear to have difficulty to suppress default network activity [Fassbender et al.,2009] and have been shown to have increased connectivity between regions in this network [Tian et al.,2006]. Here, cerebellum shows higher functional connectivity with dorsal ACG during rest. Although our results of task‐related decreases in connectivity between these regions initially appear contrary to this finding, they support suggestions that subjects with ADHD may be impaired in switching between task‐positive and task‐negative processes.
In our data, we found that subjects with ADHD showed negative correlation coefficients for functional connectivity between ACG and cerebellum, whereas correlation coefficients were positive for typical controls and unaffected siblings. However, this should be interpreted with caution, as the tasks were rapid‐event related paradigms without an explicitly modeled baseline. As such, the meaning of the direction of the correlation coefficients is hard to interpret. Nevertheless, one could speculate that differences are due to the fact that the cerebellum BOLD signal is delayed in subjects with ADHD: The more delay between the signal of both regions, the more regions respond asynchronously (see Fig. 3). This could even lead to negative correlation coefficients, when the delay is large (Fig. 3C).
Figure 3.
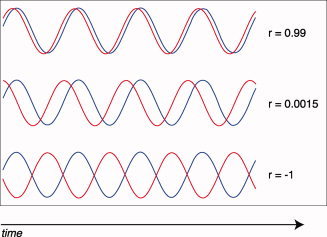
When connectivity between regions is disturbed, one consequence could be delay in the simultaneous activation of regions. As the delay becomes greater, the correlation coefficient decreases (B) and large shift could even lead to negative correlation coefficients (C). r = correlation coefficient.
Although functional connectivity has been shown to be sensitive to development, we did not find an effect of age in this study. This may be related to the relatively restricted age range included (12–19 yrs). Studies reporting a shift from a local to more distributed architecture and from more subcortical to cortico‐cortical organization with age have typically included younger and wider ranges [7–31 yrs, Fair et al.,2009; 7–22 yrs, Supekar et al.,2009].
There are some limitations to our study. First, we operationalized functional connectivity as statistical dependence (correlations) between remote neurophysiological events. As such, no causal inferences can be drawn from these analyses [Friston,2005].
Second, our seed regions were selected to not be biased towards any group; both subjects with ADHD and their unaffected siblings had BOLD activity levels similar to controls, in both the seed regions and the regions found to correlate with them. As such, it is unlikely that the group differences in connectivity between regions found here were driven by differences in task‐related BOLD signal. However, other studies have shown differences in activity between subjects with ADHD and controls in similar regions [for review see Bush et al.,2005; Dickstein et al.,2006; Durston,2003; Durston et al.,2009]. Furthermore, we have shown familial effects on BOLD activity in the same data [Durston et al.,2006; Mulder et al.,2008]. As such, although the changes in connectivity reported here appear not to be secondary to changes in brain activity, we cannot be sure that the reverse is not true: Established changes in activity in cognitive control regions could be related to changes in connectivity between them.
In sum, we show that functional connectivity between cognitive control regions is sensitive to familial risk for ADHD, in two independent samples. These results suggest that changes in cognitive control in ADHD are at least in part related to changes in connectivity of this network. Furthermore, they suggest that changes in connectivity associated with cognitive control may be suitable as an intermediate phenotype for future studies.
Acknowledgements
The authors gratefully acknowledge all the families that participated in this study.
REFERENCES
- Aron A, Fletcher P, Bullmore E, Sahakian B, Robbins T ( 2003): Stop‐signal inhibition disrupted by damage to right inferior frontal gyrus in humans. Nat Neurosci 6: 115–116. [DOI] [PubMed] [Google Scholar]
- Aron A, Poldrack RA ( 2005): The cognitive neuroscience of response inhibition: Relevance for genetic research in attention‐deficit/hyperactivity disorder. Biol Psychiatry 57: 1285–1292. [DOI] [PubMed] [Google Scholar]
- Badre D, Poldrack RA, Paré‐Blagoev EJ, Insler RZ, Wagner AD ( 2005): Dissociable controlled retrieval and generalized selection mechanisms in ventrolateral prefrontal cortex. Neuron 47: 907–18. [DOI] [PubMed] [Google Scholar]
- Botvinick MM ( 2007): Conflict monitoring and decision making: reconciling two perspectives on anterior cingulate function. Cognitive, affective & behavioral neuroscience 7: 356–66. [DOI] [PubMed] [Google Scholar]
- Botvinick MM, Cohen JD, Carter CS ( 2004): Conflict monitoring and anterior cingulate cortex: an update. Trends Cogn Sci (Regul Ed) 8: 539–46. [DOI] [PubMed] [Google Scholar]
- Bush G, Valera EM, Seidman LJ ( 2005): Functional neuroimaging of attention‐deficit/hyperactivity disorder: A review and suggested future directions. Biol Psychiatry 57: 1273–1284. [DOI] [PubMed] [Google Scholar]
- Carter CS, Braver TS, Barch DM, Botvinick MM, Noll D, Cohen JD ( 1998): Anterior cingulate cortex, error detection, and the online monitoring of performance. Science 280: 747–749. [DOI] [PubMed] [Google Scholar]
- Casey BJ, Epstein JN, Buhle J, Liston C, Davidson MC, Tonev ST, Spicer J, Niogi S, Millner AJ, Reiss A, Garrett A, Hinshaw SP, Greenhill LL, Shafritz KM, Vitolo A, Kotler LA, Jarrett MA, Glover G ( 2007): Frontostriatal connectivity and its role in cognitive control in parent‐child dyads with ADHD. Am J Psychiatry 164: 1729–1736. [DOI] [PubMed] [Google Scholar]
- Casey BJ, Thomas KM, Davidson MC, Kunz K, Franzen PL ( 2002): Dissociating striatal and hippocampal function developmentally with a stimulus‐response compatibility task. J Neurosci 22: 8647–8452. [DOI] [PMC free article] [PubMed] [Google Scholar]
- Castellanos FX, Tannock R ( 2002): Neuroscience of attention‐deficit/hyperactivity disorder: The search for endophenotypes. Nat Rev Neurosci 3: 617–628. [DOI] [PubMed] [Google Scholar]
- Castellanos FX, Margulies DS, Kelly C, Uddin LQ, Ghaffari M, Kirsch A, Shaw D, Shehzad Z, Di Martino A, Biswal B, Sonuga‐Barke EJ, Rotrosen J, Adler LA, Milham MP ( 2008): Cingulate‐precuneus interactions: A new locus of dysfunction in adult attention‐deficit/hyperactivity disorder. Biol Psychiatry 63: 332–337. [DOI] [PMC free article] [PubMed] [Google Scholar]
- Chamberlain SR, Hampshire A, Müller U, Rubia K, Del Campo N, Craig K, Regenthal R, Suckling J, Roiser JP, Grant JE, Bullmore ET, Robbins T, Sahakian B ( 2009): Atomoxetine modulates right inferior frontal activation during inhibitory control: A pharmacological functional magnetic resonance imaging study. Biol Psychiatry 65: 550–555. [DOI] [PubMed] [Google Scholar]
- Collignon A, Maes F, Delaere D, Vandermeulen D ( 1995): Automated multi‐modality image registration based on information theory. Comput Imaging Vis 3: 263–274. [Google Scholar]
- Davidson MC, Horvitz JC, Tottenham N, Fossella JA, Watts R, Uluğ AM, Casey BJ ( 2004): Differential cingulate and caudate activation following unexpected nonrewarding stimuli. Neuroimage 23: 1039–1045. [DOI] [PubMed] [Google Scholar]
- Dickstein SG, Bannon K, Castellanos FX, Milham MP ( 2006): The neural correlates of attention deficit hyperactivity disorder: An ALE meta‐analysis. J Child Psychol Psychiatry 47: 1051–1062. [DOI] [PubMed] [Google Scholar]
- Durston S ( 2003): A review of the biological bases of ADHD: What have we learned from imaging studies? Ment Retard Dev Disabil Res Rev 9: 184–195. [DOI] [PubMed] [Google Scholar]
- Durston S, Davidson MC, Mulder MJ, Spicer JA, Galvan A, Tottenham N, Scheres A, Castellanos FX, van Engeland H, Casey BJ ( 2007): Neural and behavioral correlates of expectancy violations in attention‐deficit hyperactivity disorder. J Child Psychol Psychiatry 48: 881–889. [DOI] [PubMed] [Google Scholar]
- Durston S, de Zeeuw P, Staal WG ( 2009): Imaging genetics in ADHD: A focus on cognitive control. Neurosci Biobehav Rev 33: 674–689. [DOI] [PubMed] [Google Scholar]
- Durston S, Mulder MJ, Casey BJ, Ziermans TB, van Engeland H ( 2006): Activation in ventral prefrontal cortex is sensitive to genetic vulnerability for attention‐deficit hyperactivity disorder. Biol Psychiatry 60: 1062–1070. [DOI] [PubMed] [Google Scholar]
- Fair DA, Cohen AL, Power JD, Dosenbach NU, Church JA, Miezin FM, Schlaggar BL, Petersen SE ( 2009): Functional brain networks develop from a “local to distributed” organization. PLoS Comput Biol 5: e1000381. [DOI] [PMC free article] [PubMed] [Google Scholar]
- Fassbender C, Zhang H, Buzy WM, Cortes CR, Mizuiri D, Beckett L, Schweitzer JB ( 2009): A lack of default network suppression is linked to increased distractibility in ADHD. Brain Res 1273: 114–128. [DOI] [PMC free article] [PubMed] [Google Scholar]
- Friston KJ ( 2005): Models of brain function in neuroimaging. Annu Rev Psychol 56: 57–87. [DOI] [PubMed] [Google Scholar]
- Friston KJ, Ashburner J, Frith CD, Poline JB ( 1995): Spatial registration and normalization of images. Hum Brain Mapp 3: 161–256. [Google Scholar]
- Gottesman II, Gould TD ( 2003): The endophenotype concept in psychiatry: Etymology and strategic intentions. Am J Psychiatry 160: 636–645. [DOI] [PubMed] [Google Scholar]
- Gould TD, Gottesman II ( 2006): Psychiatric endophenotypes and the development of valid animal models. Genes Brain Behav 5: 113–119. [DOI] [PubMed] [Google Scholar]
- Konishi S, Nakajima K, Uchida I, Kikyo H, Kameyama M, Miyashita Y ( 1999): Common inhibitory mechanism in human inferior prefrontal cortex revealed by event‐related functional MRI. Brain 122: 981–991. [DOI] [PubMed] [Google Scholar]
- Konrad K, Neufang S, Hanisch C, Fink GR, Herpertz‐Dahlmann B ( 2006): Dysfunctional attentional networks in children with attention deficit/hyperactivity disorder: Evidence from an event‐related functional magnetic resonance imaging study. Biol Psychiatry 59: 643–651. [DOI] [PubMed] [Google Scholar]
- Lee PS, Yerys BE, Della Rosa A, Foss‐Feig J, Barnes KA, James JD, VanMeter J, Vaidya CJ, Gaillard WD, Kenworthy LE ( 2009): Functional connectivity of the inferior frontal cortex changes with age in children with autism spectrum disorders: A fcMRI study of response inhibition. Cereb Cortex 19: 1787–1794. [DOI] [PMC free article] [PubMed] [Google Scholar]
- Macey PM, Macey KE, Kumar R, Harper RM ( 2004): A method for removal of global effects from fMRI time series. Neuroimage 22: 360–366. [DOI] [PubMed] [Google Scholar]
- Mulder MJ, Baeyens D, Davidson MC, Casey BJ, van den Ban E, van Engeland H, Durston S ( 2008): Familial vulnerability to ADHD affects activity in the cerebellum in addition to the prefrontal systems. J Am Acad Child Adolesc Psychiatry 47: 68–75. [DOI] [PubMed] [Google Scholar]
- Murias M, Swanson JM, Srinivasan R ( 2007): Functional connectivity of frontal cortex in healthy and ADHD children reflected in EEG coherence. Cereb Cortex 17: 1788–1799. [DOI] [PMC free article] [PubMed] [Google Scholar]
- Pessoa L, Ungerleider LG ( 2004): Neural correlates of change detection and change blindness in a working memory task. Cereb Cortex 14: 511–520. [DOI] [PubMed] [Google Scholar]
- Sonuga‐Barke EJ, Castellanos FX ( 2007): Spontaneous attentional fluctuations in impaired states and pathological conditions: A neurobiological hypothesis. Neurosci Biobehav Rev 31: 977–986. [DOI] [PubMed] [Google Scholar]
- Supekar K, Musen M, Menon V ( 2009): Development of large‐scale functional brain networks in children. PloS Biol, 7: e1000158. [DOI] [PMC free article] [PubMed] [Google Scholar]
- Tian L, Jiang T, Wang Y, Zang Y, He Y, Liang M, Sui M, Cao Q, Hu S, Peng M, Zhuo Y ( 2006): Altered resting‐state functional connectivity patterns of anterior cingulate cortex in adolescents with attention deficit hyperactivity disorder. Neurosci Lett 400: 39–43. [DOI] [PubMed] [Google Scholar]
- Uddin LQ, Kelly AM, Biswal BB, Margulies DS, Shehzad Z, Shaw D, Ghaffari M, Rotrosen J, Adler LA, Castellanos FX, Milham MP ( 2008): Network homogeneity reveals decreased integrity of default‐mode network in ADHD. J Neurosci Methods 169: 249–254. [DOI] [PubMed] [Google Scholar]
- Ullsperger M, von Cramon DY ( 2001): Subprocesses of performance monitoring: a dissociation of error processing and response competition revealed by event‐related fMRI and ERPs. Neuroimage 14: 1387–1401. [DOI] [PubMed] [Google Scholar]
- Wang Z, He Y, Zang Y, Cao Q, Zhang Z, Wang Y ( 2009): Altered small‐world brain functional networks in children with attention‐deficit/hyperactivity disorder. Hum Brain Mapp 30: 638–649. [DOI] [PMC free article] [PubMed] [Google Scholar]
- Wells WM, Viola P, Atsumi H, Nakajima S, Kikinis R ( 1996): Multi‐modal volume registration by maximization of mutual information. Med Image Anal 1: 35–51. [DOI] [PubMed] [Google Scholar]
- Wolf RC, Plichta MM, Sambataro F, Fallgatter AJ, Jacob C, Lesch KP, Herrmann MJ, Schönfeldt, Lecuona C, Connemann BJ, Grön G, Vasic N ( 2009): Regional brain activation changes and abnormal functional connectivity of the ventrolateral prefrontal cortex during working memory processing in adults with attention‐deficit/hyperactivity disorder. Hum Brain Mapp 30: 2252–2266. [DOI] [PMC free article] [PubMed] [Google Scholar]
- Zang YF, He Y, Zhu CZ, Cao QJ, Sui MQ, Liang M, Tian LX, Jiang TZ, Wang YF ( 2007): Altered baseline brain activity in children with ADHD revealed by resting‐state functional MRI. Brain Dev 29: 83–91. [DOI] [PubMed] [Google Scholar]