

Abstract
Few researchers agree about the relationship between fronto–temporo–parietal white matter microstructure and reading skills. Unlike many previous reports, which only measured fractional anisotropy, we have also measured macroscopic volume (regional white matter tract volume) and three microstructural indices (axial, radial, and mean diffusivity) to increase interpretability of our findings. We examined the reading‐related skills and white matter structure in 10 adolescents and adults with a history of poor reading and 20 age‐matched typical readers. We applied a diffusion tensor imaging atlas‐based algorithm to major white matter pathways. The relation of white matter structural indices to reading group, hemisphere, and reading‐related skill was analyzed using linear models. White matter microstructural indices were related to performance on a sublexical decoding task, but the relations between particular microstructural indices and sublexical decoding ability and reading group were different for association (i.e., cortical–cortical) and projection (i.e., subcortical–cortical) white matter pathways. Changes in projection pathways were consistent with alterations in white matter organization and axonal size, whereas changes in association pathways were consistent with alternations in pathway complexity. Changes in macrostructure paralleled changes in microstructure. We conclude that the relations between several microstructural indices and factors related to reading ability are different for association and projection pathways. Hum Brain Mapp, 2011. © 2010 Wiley‐Liss, Inc.
Keywords: white matter microstructure, white matter volume, dyslexia, reading
INTRODUCTION
Dyslexia is the most common learning disorder in America, affecting both children and adults with a prevalence ranging from 5 to 17.5% [Shaywitz,1998]. Dyslexia is not specific to English and affects languages with both shallow and deep orthographies [Paulesu et al.,2001]. These statistics have led the National Institute of Child Health and Human Development to classify reading failure as a true public health problem [Lyon,1998]. Dyslexia is a lifelong disorder and treatment is limited. Some individuals with dyslexia slowly develop adequate phonological word decoding skills by young adulthood, whereas others never achieve these skills [Miller‐Shaul,2005; Svensson and Jacobson,2006]. However, even college students who are considered “recovered” continue to manifest suboptimal performance in reading‐related skills. These young adults are proof that early detection and treatment do not guarantee abiding recovery [Snowling et al.,2003; Snowling, 2008]. To identify better interventions for dyslexia, the neural mechanisms of reading and reading failure need to be better understood.
Animal, genetic, and imaging studies support the notion that abnormal brain connectivity underlies reading failure. Galaburda [1993] first discovered on autopsy that the thalamic magnocellular neurons were disproportionately small in the brains of individuals with a diagnosis of dyslexia as compared with those without a diagnosis of dyslexia. Galaburda [1993] also revealed that these individuals demonstrated dysgenetic cortex. Animal models of dyslexia have shown that white matter disorganization is associated with cortical dysgenesis [Jenner et al.,2000]. Genes associated with developmental dyslexia appear to be linked to neural migration and axonal guidance [Galaburda et al.,2006]. Both functional and anatomical neuroimaging studies suggest that connectivity between brain regions is related to reading ability and is disrupted in poor readers [PRs; Beaulieu et al.,2005; Deutsch et al.,2005; Dougherty et al.,2007; Frye et al. ,2008a; Klingberg et al.,2000; Niogi and McCandliss,2006; Odegard et al.,2009; Paulesu et al.,1996; Pugh et al.,2000]. This evidence has led to the examination of anatomic connectivity in relation to reading ability in both PRs and dyslexic readers (DRs).
To examine the relationship between anatomic connectivity and reading, researchers have utilized diffusion tensor imaging (DTI) to examine the microstructure of white matter pathways. Table I demonstrates that these studies vary widely in terms of age groups, populations, and DTI methodology. Only 9 of the 13 studies reviewed explicitly included PRs and only four included adults. The assessments used to measure reading‐related skills varied widely and no two studies defined PRs in the same manner. DTI methodology varied from voxel‐based, to volume‐based, to whole brain analysis using tract‐based spatial statistics. Six of the thirteen studies only measured fractional anisotropy (FA) without any additional DTI indices such as axial diffusivity (AD) [e.g., Frye et al.,2008a] or radial diffusivity (RD) [e.g., Rollins et al.,2009].
Table I.
Diffusion tensor imaging studies examining the brain‐behavior correlation with reading
| Participants | Reading group criteria/tests | DTI technique, index and ROI | Results | |
|---|---|---|---|---|
| Correlations | Group differences | |||
| Studies with Dyslexic or Poor Readers | ||||
| Klingberg et al.,2000 | ||||
| 5M and 1F PRs6M and 5F GRsAge: 26.1 yrs | PRs: >1 SD below sample M on WRMT‐R‐‐WITests: WRMT‐R–WA, WI | Tech: Voxel‐basedIndex: FA | 1) Positive: FA with WRMT‐R–(WA, WI) (in L TPR) | 1) FA: PRs < GRs (in bilateral TPR) |
| Deutsch et al.,2005 | ||||
| 6M and 1F PRs6M and 1F GRsAge: 10.7 yrs | PRs: ≤30th percentile on WJ‐BRCTests: CTOPP‐PA, PM, RN; WJ‐BRC, PC, RF, SP, WA, LWID | Tech: Voxel‐basedIndex: FA, CI, PDDROI: TPR | 1) Positive: FA with WJ‐(BRC, SP, WA, LWID) and CTOPP‐RN (in L TPR) 2) Positive: CI with WJ‐(BRC, SP, WA, LWID) and CTOPP‐RN (in L TPR) | 1) FA and CI: Good > poor readers in the L TPR2) PDD: GRs > PRs in sup‐inf direction; PRs > GRs in ant‐post direction |
| Niogi and McCandliss,2006 | ||||
| 8M and 3F DRs7M and 13F TRsAge: 8.1 yrs | DRs: 1 SD below sample M on WJ‐LWIDTests: WJ‐LWID, WA; WAIS; CTOPP‐DR | Tech: ROQS with manual elliptical validity checkIndex: FA, LATROI: CS, sup CR, sup LF, post IC, ant CR | 1) Positive: FA with WJ‐(WA, LWID) (in L sup CR)2) Positive: FA with WJ‐LWID (in L CS)3) Positive: FA with CTOPP‐DR (bilateral ant CR)4) Negative: FA with WJ‐LWID (LAT sup CR) | 1) FA: TRs > DRs (lat sup CR)2) FA: TRs > DRs (lat CS)3) FA: TRs > DRs (L sup CR, L CS) |
| Frye et al.,2008a | ||||
| 6M and 3F DRs12M and 6F TRsAge: 23.9 yrs | DRs history of RD diagnosisTests: CTONI; TOVA; CTOPP‐PA, APA, RN, ARN; WJ‐LWID, WA | Tech: Volume‐basedIndex: FA, ADROI: Splenium | 1) Negative: FA and AD with WJ‐LWID within each reading group2) Positive: FA with FA, RN; AD with PA, APA, ARN in TRs only | 1) FA and AD: DRs > TRs |
| Richards et al.,2008 | ||||
| Fathers with DR child;4 PRs7 GRsAge 30–5 yrs | PRs: 1 SD < WAIS‐R‐VIQTests: TOWRE; GORT‐RA, RR; RAN‐L, N;WIAT‐II‐SP, WM; WRAT 3‐SP; WRMT‐R–WA, WI | Tech: Voxel‐basedIndex: FA | 1) FA: TRs > DRs in bilateral precentral, inf F orb, sup OCC, fusiform, postcentral, inf P, inf T, in right sup F, mid F, inf F oper, inf F tri, supp motor area, cuneus, mid OCC, and in left lingual, sub P, pre‐cuneus, putamen, sup T | |
| Rollins et al.,2009 | ||||
| 16M and 3F DRs13M and 5F TRsM age = 10 yrs; | DRs: referral from a dyslexia remediation programTests: WJ‐ WA, LWID | Tech: Volume‐basedIndex: FA, AD, ADC, RDROI: SLF, IFO‐ILFPost IC | 1) Positive: FA and AD with age (in TRs, in IFO‐ILF, post IC)2) Positive: FA with age (in DRs in SLF Negative: RD with age (in TRs in SLF, IFO‐ILF, post IC)3) Negative RD with age (in DRs in SLF)4) Negative: RD with age (in TRs in SLF, IFO‐ILF, post IC)5) Negative: ADC with age (in TRs and DRs for all 3 ROIs)6) Negative: AD and age (in DRs in post IC) | 1) FA: TRs > DRs in IFO‐ILF and post IC until age 11 yrs. |
| Odegard et al.,2009 | ||||
| 5M and 5F DRs4M and 3F TRsAge = 12.3 yrs | DRs: referral by hospitalTests: DST‐PD; WIAT‐II‐BRC | Tech: Whole‐brain analysis using TBSSIndex: FA | 1) Positive: FA with DST‐PD (in L sup CR, L and R UF, and R IFO‐IFL)2) Negative: FA with DST‐PD (in L post CC)3) Positive: FA with WIAT‐II‐BRC (in L and R sup CR, L corticopontine tract, sup thalamic radiation, and R post IC)4) Negative: FA with WIAT‐II‐BRC (in L post CC) | |
| Rimrodt et al.,2009 | ||||
| 7M and 7F DRs9M and 8F TRsAge: 11 yrs | DRs: WJ‐WA or LWID < 25th percentile, WJ basic skills < 40th percentileTests: WJ‐WA, LWID; TOWRE; WIAT‐II | Tech: Voxel‐based, tractographyIndex: FAROIs: Limited to perisylvian network | 1) Positive: FA with TOWRE (in L IFG, precentral gyrus, FG, middle T gyrus) | 1) FA: TRs > DRs (IFG, left TPR), DRs > TRs (L insula,; R: FG, sup T G |
| Keller and Just2009 | ||||
| 35 DRs with treatment12 DRs no treatment25 TRs no treatmentAge: 8–12 yrs | DRs: recruited from Power4Kids Reading Initiative, TOWRE ≤ 30%, PPVT ≥ 5%Tests: WRMT‐R‐WA, WI; WJ‐PC; TOWRE‐PDE, SWE | Tech: Voxel‐basedIndex: FA, AD, RD | 1) Positive: FA across PRs and GRs with WRMT‐R WA2) Negative: RD across PRs and DRs with WRMT‐R WA3) Negative: RD with PDE in pre‐ vs. post‐remediated PRs4) Positive: FA and RD at L ant CS across PRs and GRs with PDE5) Negative: FA and RD at L ant CS across PRs and GRs with SWE | 1) FA: post‐remediated PRs > pre‐remediated PRs (peak in L ant and CS)2) RD: post‐remediated PRs < pre‐remediated DRs (peak in L ant and CS)3) FA: Pre‐remediated PRs < GRs |
| Studies without Dyslexic or Poor Readers | ||||
| Beaulieu et al.,2005 | ||||
| 14M and 18FAge = 11.1 yrs | Tests: WRMT‐R–WI | Tech: Voxel‐based, tractographyIndex: FA | 1) Positive: FA with WRMT‐R–WI (in L TPR) (cluster in post IC) | |
| Nagy et al.,2004 | ||||
| 14M and 9FAge = 11.9 yrs | Tests: Speed of reading aloud 20 Swedish words | Tech: Voxel‐basedIndex: FA | 1) Negative: FA with reading time (in single cluster of L T) | |
| Dougherty et al.,2007 | ||||
| 21 M, 28 FM age = 9.8 yrs | Tests: CTOPP‐PA, PM, RN; GORT IV‐RQ; WJ‐ PC, WA, LWID | Tech: Volume‐basedIndex: FA, RDROI: Parts of CC | 1) Negative: FA with CTOPP‐PA (in temporal‐callosal segment)2) Positive: RD with CTOPP‐PA (in temporal‐callosal segment) | |
| Qiu et al.,2008 | ||||
| 13M and 11F 1st grade, age 7.416M and 11F 4th grade, age 10.211M and 13F adult, age 22.8 yrs | Tests: Reading 200 Chinese characters and 200 English words | Tech: TBSS whole brain FA map with clusters where age groups differedIndex: FA, MD, RD, AD | After controlling for age:1) Negative: FA and RD with Chinese reading (in L ant IC)2) Negative: MD with English reading (in L and R CR) | 1) MD: 4th < 1st graders (clusters in EC, sup CR, C, T, OCC, and sup F)2) MD: Adults < 4th graders (in F, R ant T, CP, ant and post IC, and clusters in splenium)3) FA: 4th > 1st graders (clusters in L genu of IC, L CP)4) FA: Adults > 4th graders (in C, CP, mid and R post T, ant, post, and genu IC, ant EC, sup CR, cingulum and parts of F and P)5) RD: 4th < 1st graders (in L genu IC, L CP, and F)6) RD: Adults < 4th graders (in C, CP; R ant, mid, and post T; ant, genu, and post IC; ant EC; sup CR; cingulum; many parts of F)7) AD: 4th > 1st graders (clusters in CR and F)8) AD: adults < 4th graders (ant, mid, and post R T; L and R post IC; clusters in splenium; and many areas of F)9) AD: 4th < 1st graders (clusters in L C; L and R OCC; and L CR (AD: 4th < 1st graders (clusters in CR and F) |
Brain directions: ant, anterior; inf, inferior; L, left; post, posterior; R, right; sup, superior. Regions of interest (ROIs): CC, corpus callosum; CP, cerebral peduncles; CR, corona radiata; CS, centrum semiovale; EC, entorhinal cortex; F, frontal; FG, fusiform gyrus; hem, hemisphere; IC, internal capsule; IFG, inferior frontal gyrus; IFO‐ILF, inferior fronto‐occipital–inferior longitudinal fasciculus; LF, longitudinal fasciculusl; LG, lingual gyrus; OCC, occipital; orb, orbital; P, parietal lobe; SLF, superior longitudinal fasciculus; SFG, superior frontal gyrus; T, temporal lobe; TPR, temporo‐parietal region; UF, uncinate fasciculus. DTI measures: AD, axial diffusivity; CI, coherence index; FA, fractional anisotropy; PDD, principal diffusion direction; RD, radial diffusivity; ROQS, reproducible objective quantification scheme; TBSS, tract‐based spatial statistics. Participants (Ps): DRs, dyslexic readers; GRs, good readers; PRs, poor readers; TRs, typical readers. Reading tests: ARN, alternative rapid naming; BRC, basic reading comprehension; CTONI, comprehensive tests of nonverbal intelligence; CTOPP, comprehensive test of phonological processing; DR, digit recall; DST‐PD, decoding skills test‐phonological decoding; GORT, gray oral reading test third edition; IV‐RQ, fourth edition‐reading quotient; L, letters; LWID, letter word identification; N, numbers; PA, phonological awareness; APA, alternative phonological awareness; PC, passage comprehension; PDE, phonetic decoding efficiency; PM, phonological memory; RA, reading accuracy; RAN, rapid automatized naming; RF, reading fluency; RN, rapid naming; RR, reading rate; SP, spelling; SWE, sight word efficiency; TOVA, tests of variables of attention; TOWRE, test of word reading efficiency; WA, word attack; WAIS‐FSIQ, Wechsler abbreviated intelligence scale‐full scale IQ; WI, word identification; WIAT‐II, Wechsler individual achievement test‐second edition; WJ, Woodcock‐Johnson‐III‐tests of achievement; WM, working memory; WRAT 3‐SP, wide range achievement test‐third edition‐spelling; WRMT‐R‐, Woodcock reading mastery test‐revised. Statistical terms: M, mean; LAT, lateralization index; SD, standard deviation.
Abbreviations.
- ACR
Greater anterior
- AD
axial diffusivity
- ANCOVA
analysis‐of‐covariance
- DRs
dyslexic readers
- DTI
diffusion tensor imaging
- EPI
echo‐planar imaging
- FA
fractional anisotropy
- ICBM
International Consortium for Brain Mapping
- PR
poor readers
- RD
radial diffusivity
- SCR
superior corona radiata
- SNR
signal‐to‐noise ratio
- TR
typical readers
The Relationship Between Reading and Reading‐Related Abilities and Microstructure can Differ Across Reading Groups
The methodology used to analyze microstructural data may affect the interpretation of the reported findings. For example, instead of studying the relationship between white matter microstructure and reading‐related skills or reading group separately, Frye et al. [2008a] studied the relationship between white matter microstructure and reading‐related skills and reading group together using linear modeling. Frye et al. [2008a] demonstrated that the relation between corpus callosum splenium white matter microstructure and reading‐related skills was different across reading groups for some reading‐related skills. This highlights the complex relation between white matter microstructure and behavior and the fact that white matter pathways may be organized differently in typical readers (TRs) and PRs.
With the exception of Frye et al. [2008a], all of the studies in Table I have analyzed one effect at a time (i.e., group differences between PRs and TRs or correlations with reading‐related skills) rather than examining whether multiple potentially interdependent factors affect white matter microstructure simultaneously. Although such simple approaches have the advantage of being easy and straightforward to interpret, complex relationships between multiple reading‐related factors and microstructure cannot be examined or taken into account with such analyses. In addition, using multiple simple analyses increases the likelihood of Type I error.
In this study, we use an approach similar to Frye et al. [2008a] to examine whether two separate effects, history of poor reading and performance on reading‐related skills, simultaneously influence white matter microstructure. Microstructure of some white matter pathways may be simply related to reading‐ability, independent of whether or not the individual has a history of poor reading. For example, several studies which examined only TRs demonstrate that white matter microstructure varies with reading skills in individuals without a history of poor reading. Alternatively, the microstructure in other pathways may be related primarily to whether or not the individual has a history of poor reading, independent of reading‐ability. For example, several studies demonstrate differences in microstructure across reading groups that are not necessarily related to reading skill (Table I). In addition, some white matter pathways may be influenced by both of these factors or the relationship between reading‐skill and white matter microstructure may not be the same for both reading groups, as Frye et al. [2008a] has demonstrated.
This is an important issue since understanding these differences may allow us to determine which white matter pathways are primarily disrupted in those individuals who were PRs as children and which white matter pathways may be acting in a compensatory manner. Recently, Frye et al. [2010] have demonstrated that changes in cortical surface area are related to poor development of reading skills during childhood and performance on reading‐related tasks. Given the fact that brain surface area develops primarily before birth and is linked to white matter development, such evidence supports the animal and pathological data indicating that alterations in prenatal white and gray matter are related to the development of reading disabilities. However, changes in both brain function and structure have been related to remediation, suggesting that the development of compensatory pathways and greater engagement of traditional reading pathways are associated with improvement in reading skills [Keller and Just,2009; Shaywitz et al.,2003; Simos et al.,2006; Temple et al.,2003].
We endeavored to identify the relationship between a history of poor reading and/or reading‐related skills with white matter structure. To allow the differentiation of these two interrelated factors, we recruited adults with and without a history of poor reading who varied widely in their current reading‐related skills. Selecting individuals with a wide range of reading skills has allowed us to examine the relationship between the reading‐related skills and microstructure for each group. Obtaining a wide variety of reading skills among adults with a history of poor reading is possible since some PRs develop adequate phonological word decoding skills by adolescence or adulthood whereas others never achieve normal phonological word decoding skills [Miller‐Shaul,2005; Svensson and Jacobson,2006]. Thus, the natural history of developmental phonological dyslexia and our selection of PRs have facilitated our ability to examine variations in the development of language skills in PRs. In addition, including both factors within the same statistical model will prevent inadvertently attributing differences in the mean performance on a reading‐related task across groups to group differences in microstructure, if such changes are simply because of the relationship between reading‐related task performance and microstructure.
Measures of White Matter Microstructure: Beyond FA
Although FA is commonly reported to reflect white matter organization [Beaulieu et al.,2005; Deutsch et al.,2005; Keller and Just,2009, Klingberg et al.,2000; Niogi and McCandliss,2006; Rimrodt et al.,2009], FA is a relative measure that could change for other reasons [Dougherty et al.,2007; Frye et al.,2008a; Odegard et al.,2009]. For example, changes in FA have been suggested to be related to axonal size [Dougherty et al.,2007] and white matter pathway complexity [Ben‐Shacher et al.,2007]. Yet 6 of the 13 DTI studies reviewed examined only FA without looking at other measures of white matter microstructure that might have helped to support the interpretation of FA values [Beaulieu et al.,2005; Klingberg et al.,2000; Nagy et al.,2004; Odegard et al.,2009; Richards et al.,2008].
To understand the interrelations between FA and other common DTI indexes, we consider AD and RD measurements [Hasan and Narayana,2006, 1]. Table II provides a definition of AD and RD and their relation to FA and mean diffusivity (D av). Alteration in AD and/or RD can result in a change in FA, and these complementary measures can be used to understand changes in FA and support the interpretation of changes in FA. Table III indicates how different aspects of microstructural indices are associated with decreased white matter pathway organization, increased neuronal size, or increased pathway complexity. All three of these alterations in white matter property have been proposed to be reflected by changes in FA. The following sections explain the changes in indices outlined in Table III.
Table II.
Definitions of white matter microstructure measurements
| Measurement | Definition | Formula |
|---|---|---|
| Axial diffusivity (AD) | Magnitude of the microstructure oriented in the direction of the principal axis; first eigenvalue | λ1 |
| Radial diffusivity (RD) | Magnitude of the microstructure oriented in the direction perpendicular (i.e., orthogonal) to the principal axis; Average of the second and third eigenvalue |

|
| Fractional anisotropy (FA) | Normalized difference between axial diffusivity and radial diffusivity |

|
| Mean diffusivity (D av) | Weighted average of axial and radial diffusivity |

|
These formulas assume that the diffusion tensors are diagonalized to yield three eigenvalues: λ1, the eigenvalue representing the magnitude of the principal axis, and two eigenvalues (axis λ2 and λ3) which represent the magnitude of the two axes perpendicular to the principal axis.
Table III.
Aspects of white matter microstructure and macrostructure which are affected by reduced white matter organization, increased axonal size, and increased complexity
| White matter property | Fractional anisotropy | Mean diffusivity | Axial diffusivity | Radial diffusivity | Volume |
|---|---|---|---|---|---|
| Reduced organization | Decrease | Increase | No change | Increase | No change |
| Increased axonal size | Decrease | Increase | No change | Increase | Increase |
| Increased complexity | Decrease | Increase | Decrease | No change | Increase |
Organization
Axonal bundles in well‐organized white matter would be expected to be tightly coordinated and oriented in the same direction resulting in a high AD and FA with a low RD. Axonal bundles in disorganized white matter would not be expected to be tightly coordinated and the axons would be expected to waver in and out of the principal direction. This would be expected to increase RD with an associated decrease in FA and increase in D av. AD would not be expected to change significantly as the general direction of the axonal bundles would be the same.
Axonal size
Larger axons allow diffusion of water in the direction perpendicular to the principal direction of the axons. Thus, an increase in axonal size should result in an increase in RD and D av and a reduction in FA. AD would not be expected to change, since the general direction of the axonal bundles would be the same.
Complexity
A complex white matter pathway contains crossing fibers traveling in various different directions. Thus, an increase in pathway complexity would result in a decrease in AD since the axonal bundles would be less oriented in the same direction. This change in AD would result in a decrease in FA and D av.
Macrostructure
Changes in macrostructure can parallel changes in microstructure [Hasan et al.,2007]. We propose that examining macrostructural changes in the context of microstructural changes can further constrain the interpretation of microstructural changes. For example, a white matter pathway with larger axons (assuming a constant number of axons) would be expected to be larger in volume, whereas, a disorganized white matter pathway, as compared to an organized pathway, would not be expected to change substantially in volume. Additionally, more complex white matter pathways with more crossing fibers would be expected to be larger than a simpler white matter pathway since crossing fibers would prevent axonal bundles from being arranged compactly. These relationships between macrostructural changes and white matter property have also been outlined in Table III.
Examining Fronto‐Temporo‐Parietal (FTP) White Matter Structure
Despite the variation in technique, previous studies have converged on reading group differences and/or correlations between white matter microstructure and reading‐related skills for two different classes of white matter pathways: association pathways (cortical–cortical pathways) and projection pathways (subcortical–cortical pathways). Thus, we focused on FTP white matter regions that have previously been implicated in reading.
Association pathways
Superior longitudinal, superior frontal–occipital, and inferior frontal–occipital fasciculi.
Projection pathways
The anterior, superior, and posterior corona radiata and anterior, superior, and posterior internal capsule.
Hypotheses
Hypothesis 1
Changes in FA related to reading‐related factors will be driven by different components of diffusivity in association and projection white matter pathways.
Hypothesis 1a
Changes in microstructure will be driven by relative changes in AD, not RD, for association pathways. This is because association fasciculi are more apt than projection pathways to reflect changes in white matter complexity since they are essentially a collection of many cortical–cortical pathways combined to create a complex white matter pathway.
Hypothesis 1b
For projection pathways, changes in microstructure will be driven by relative changes in RD, and not AD, since the former is sensitive to both axonal size and axonal disorganization. For example, pathological studies point to a reduction in the size of thalamic magnocellular neuron in PRs as compared with TRs [Galaburda et al.,2006; Jenner et al.,2000].
Hypothesis 2
By using linear‐modeling to simultaneously examine multiple factors effecting white matter structure, we will be able to understand which changes occur in white matter structure because of reading group difference and which are because of performance on reading‐related tasks. We believe that there will be cases where the relationship between microstructure and reading‐related skill will seem to contradict differences between reading groups on that measure. For example, we believe that larger axonal size will be related to reading‐related skills, but PRs will demonstrate greater white matter disorganization. In such a case, a lower FA will be related to better reading‐related skills performance, but PRs, as a group, will manifest a lower FA. The linear‐models that we have used in this study will allow us to separate these seemingly contradictory factors.
METHODS
Participants
Ten individuals (age range 16–33 years) with a history of being diagnosed with phonological dyslexia (from here on referred to as PRs) performed several reading‐related skill tests and underwent a structural MRI scan (adolescents represented 10% of the population). Twenty age‐matched (within 2 years of age; age range 16–31 years) TRs were recruited and also underwent the same protocol. Half of each cohort was female. Phone interviews eliminated non‐native English speakers, individuals with a history of attention deficit disorder, psychiatric and neurological illness, prematurity, birth complications, psychoactive medication use, abnormal hearing or vision, implanted ferromagnetic metal or device, claustrophobia, or pregnancy. Upon arrival to the laboratory, the study protocol was described to the participant. Once the participant's questions were answered adequately, written informed consent was obtained in accordance with our Institutional Review Board regulations for the protection of human subjects. Right‐handedness was confirmed by a laterality index as assessed by the Edinburgh Handedness Inventory [Oldfield,1971] score greater than 50 [Dragovic,2004].
All PRs had a history of phonological dyslexia during grade school, defined as below expected reading ability with normal intelligence with a deficit in the ability to phonologically decode words. Since academic records during childhood were not available for some adult participants, we verified that participants manifested the typical residual deficits in fluency and spelling skills seen in adults with a history of reading disability in childhood [Brosnan et al.,2002; Kemp et al.,2008; Shaywitz et al.,2003]. Scores on the Gray Oral Reading Test Fluency [Wiederhoft and Bryant,2001] were 8 or less for PRs and 12 or greater for TRs, whereas WJ3 Spelling [McGrew et al.,2007] scores were 91 or less for adult PRs and 102 or greater for adult TRs (adolescents were not tested on WJ3 spelling but documentation of poor reading performance during elementary school was available). The Test of Variables of Attention and the Comprehensive Test of Nonverbal Intelligence ruled out attention and intelligence deficits in all participants. As seen in Table IV, nonverbal intelligence was slightly higher for the adult TRs as compared with the adult PRs.
Table IV.
Participant characteristics
| Mean (SE) | t‐test | |||
|---|---|---|---|---|
| Typical readers | Poor readers | |||
| Age, mean (years) | 23.75 (0.7) | 23.9 (1.6) | 0.87 | |
| Test of variables of attention: commissions | 105.7 (2.8) | 104.0 (3.8) | 0.36 | |
| Test of variables of attention: omissions | 98.6 (4.1) | 95.3 (5.0) | 0.53 | |
| Comprehensive test of non‐verbal intelligence (std) | 111.2 (2.5) | 100.6 (3.3) | 2.60* | |
| Reading‐related skills | ||||
| Letter‐word identification (std) | LWID | 104.3 (1.5) | 80.7 (5.1) | 3.76‡ |
| Word attack (std) | WA | 102.8 (2.2) | 79.2 (2.5) | 6.72‡ |
| Phoneme awareness composite (std) | PA | 104.3 (1.5) | 80.7 (5.1) | 3.70‡ |
| Alternate phoneme awareness composite (std) | APA | 111.9 (0.9) | 87.7 (3.5) | 4.55‡ |
| Rapid naming composite (std) | RNC | 105.4 (4.5) | 77.5 (5.1) | 4.10‡ |
| Gray oral reading test: fluency (std) | 14.9 (0.2) | 6.0 (0.7) | 7.29‡ | |
| Spelling (std) | 112.4 (1.8) | 68.7 (5.3) | 5.50‡ | |
P < 0.05;
P < 0.001.
Adolescents and young adults were tested on carefully selected reading‐related skills (Table IV). Orthographic lexical and sublexical decoding was measured with WJ3 Letter‐Word identification and Word Attack, respectively [McGrew et al.,2007]. Auditory phonological awareness was assessed using the CTOPP Phonological Awareness Composite and Alternate Phonological Awareness Composite [Wagner et al.,1999]. Additionally, retrieval speed was assessed using the CTOPP Rapid Naming Composite [Wagner et al.,1999]. All scores are standardized. Performance on reading‐related skills varied from normal to subnormal values in PRs and varied throughout the normal range for TRs. This prevented linear correlations arising simply due to large inter group differences.
Diffusion Tensor Acquisition
The diffusion‐weighted data were acquired using a single‐shot spin echo diffusion sensitized echo‐planar imaging (EPI) sequence with the balanced Icosa21 encoding scheme [Hasan and Narayana,2003], a diffusion sensitization of b = 1000 s/mm2, and a repetition and echo times of TR = 6.1 s and TE = 84 ms, respectively, on a 3.0T Phillips Achieva scanner with Dual Quasar gradients (62 mT/m) and all‐digital radio frequency acquisition system. EPI image distortion artifacts were reduced by using a SENSE acceleration factor or k‐space undersampling of two [Hasan et al.,2008]. The slice thickness was 3 mm with 44 axial slices covering the whole‐brain (foramen magnum to vertex), a square field‐of‐view = 240 mm × 240 mm, and an image matrix of 256 × 256. The number of nondiffusion weighted or b ∼ 0 magnitude image averages was 8. Each encoding was repeated twice and magnitude‐averaged to enhance the signal‐to‐noise ratio (SNR); thus, effectively 50 images were acquired for each of the 44 axial sections to cover the whole‐brain. The total DTI acquisition time was ∼7 min and resulted in SNR‐independent DTI‐metric estimation [Hasan,2007].
DTI Processing and Segmentation
After data preprocessing, which included distortion correction, masking, and isotropic voxel interpolation, the diffusion tensors were constructed and diagonalized as described elsewhere [Hasan et al.,2001]. The tensor eigen values were used to obtain the mean FA, AD, RD, and D av for each segmented white matter volume. Gray and white matter were segmented using a DTI‐based algorithm [Hasan et al.,2007]. White matter tracts were automatically segmented using the International Consortium for Brain Mapping (ICBM) [Mori et al.,2008 ] atlas, as described recently [Hasan and Frye, in press] (Fig. 1). In brief, the method uses the contrast between CSF, gray, and white matter provided by DTI [Hasan et al.,2007] to segment tissue using an atlas. The DTI‐based method was implemented in statistical parametric mapping toolbox (http://www.fil.ion.ucl.ac.uk/spm) [Good et al.,2001 ]. These areas were visually inspected to assure that they only included white matter. The corresponding DTI metrics were verified to be void of contamination from gray matter and cerebrospinal fluid. The volume of the segmented white matter pathways was calculated and divided by the whole brain white matter volume to obtain a percentage value.
Figure 1.
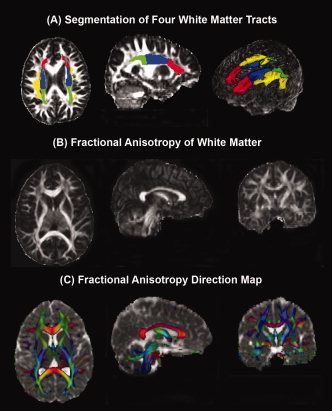
White matter tract segmentation and fractional anisotropy (FA) quality (A) Axial and sagittal magnetic resonance images showing the segmentation of four white matter tracts [red = Anterior Corona Radiata; green = Posterior Corona Radiata; blue = SCR; yellow = Superior Longitudinal Fasciculus] and a three dimensional transparent head image with segmented white matter tracts. B: White matter FA shown in axial, coronal, and sagittal planes. C: White matter FA direction, depicted in color [red = commissural (left‐right) pathways; cyan = association (Anterior‐Posterior) pathways; purple = projection (Inferior‐Superior) pathways], fused with mean diffusivity axial, coronal, and sagittal images. FA is modulated by the principal eigenvector to produce the color map and this color map is fused with the mean diffusivity. This fused map provides a clear depiction of gray matter, white matter, and cerebrospinal fluid.
Statistical Analysis
Analysis‐of‐covariance (ANCOVA) using the mixed procedure of SAS 9.1 (SAS Institute Inc., Cary, NC), was used to investigate the relationships between the fixed‐effects of reading group, hemisphere, reading‐related skills, and the white matter indices. In addition, age, gender, and nonverbal IQ were included in the initial models but none of these factors were significant in any of the analyses. The intercept was modeled as a random‐effect. An ANCOVA was computed using the linear model represented in Eq. (1) for each reading‐related skill, separately.
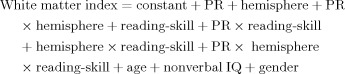 |
(1) |
For each analysis, all effects and interactions were examined for significance. The model was simplified by removing the highest order nonsignificant interaction, or effect if no interaction existed, and the model was recomputed. This simplification procedure was repeated until all effects and interactions were significant, with the exception that nonsignificant effects remained in the model if they were a dependent effect of a significant interaction [Frye et al.,2007,2008a,b,2009a,b, 2010; Landry et al.,2001]. Since we conducted five analyses with the same dependent measure, the α was set to 0.01. Consistent with our plan to use complementary microstructural and macrostructural indices to help interpret changes in FA, we performed analyses on these complementary measures only if significant effects were identified in FA.
To ensure accurate characterization of the significance of the effects of our analyses, we conducted a power analysis of our linear model. To calculate the power of the final mixed‐models, we calculated the R 2 of the simplified linear model using least squares linear regression. The lowest R 2 was 0.18 with one predictor variable and the highest R 2 was 0.40 with three predictor variables. These R 2 values provide effect sizes of 0.22 and 0.64, which are medium–large and very large effects, respectively [Cohen,1988]. With an α of 0.01, these effect sizes correspond to respective powers of 92% and >99.9% [Cohen,1988].
RESULTS
Fractional Anisotropy
Association pathways
Lower FA was associated with better word attack performance for the superior longitudinal fasciculus [F(1,30) = 8.71, P < 0.01, Fig. 2A]. The relationship between FA and word attack interacted with hemisphere for the superior frontal–occipital fasciculus [F(1,28) = 16.65, P < 0.001, Fig. 2E]. Higher left hemisphere FA and lower right hemisphere FA were associated with better word attack performance. FA in the inferior frontal–occipital fasciculus was not related to reading group or reading‐related skills. Reading group differences in FA were not found for the association fasciculi.
Figure 2.
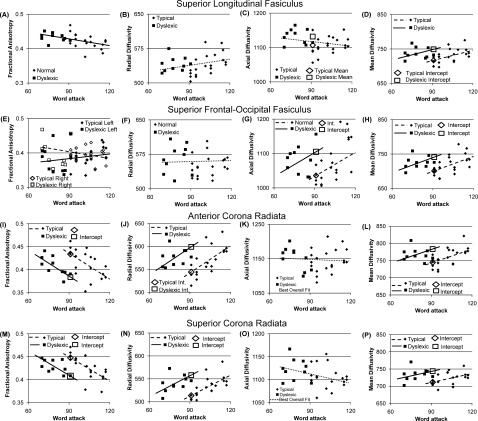
Relations between performance on reading‐related tasks, history of dyslexia, and white matter microstructure indices of (A,E,I,M) fractional anisotropy, (B,F,J,N) Radial Diffusivity, (C,G,K,O) Axial Diffusivity, and (D,H,L,P) Mean Diffusivity for the (A‐D) superior longitudinal fasciculus, (E‐H) superior frontal‐occipital fasiculus, (I‐L) anterior corona radiata and (M‐P) superior corona radiata. The microstructure values are averaged across hemispheres for all graphs except (E). Reading group differences are depicted by intercept differences which are shown as an open diamond and open square for typical and poor readers respectively. Diffusivity units are μm2/sec × 10−3.
Projection pathways
Lower FA was associated with better word attack performance for both the anterior [F(1,29) = 15.98, P < 0.001, Fig. 2I] and superior [F(1,29) = 24.15, P < 0.0001, Fig. 2M] corona radiata. FA was higher in TRs as compared with PRs for both the anterior [F(1,29) = 12.48, P = 0.001, Fig. 3I] and superior [F(1,29) = 14.41, P < 0.001, Fig. 2M] corona radiata. FA in the posterior corona radiate and internal capsule was not related to reading group or reading‐related skills.
Figure 3.
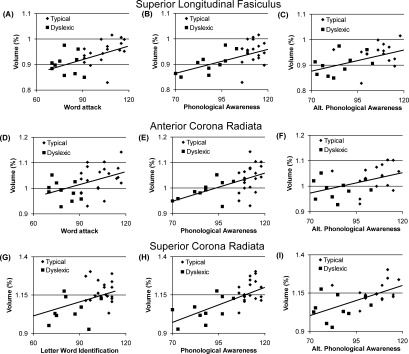
Relations between performance on reading‐related tasks and white matter macrostructure of the (A–C) superior longitudinal fasciculus, (D–F) anterior corona radiata, and (G–I) superior corona radiata. Reading‐related tasks include (A,D) Word Attack, (G) letter‐word identification, (B,E,H) phonological awareness, and (C,F,I) alternative phonological awareness. The macrostructure values are averaged across hemispheres for all graphs.
Microstructural Indices Complementary to FA
Association pathways
Lower D av was related to better word attack performance for the superior longitudinal fasciculus [D av: F(1,29) = 7.15, P = 0.01, Fig. 2D], whereas greater AD and D av were related to better word attack performance for the superior frontal–occipital fasciculus [AD: F(1,30) = 8.10, P < 0.01, Fig. 2C; D av: F(1,29) = 9.78, P < 0.01, Fig. 2H]. AD and D av were lower for TRs as compared with PRs for both the superior longitudinal [AD: F(1,30) = 7.23, P = 0.01, Fig. 2C; D av: F(1,29) = 8.27, P < 0.01, Fig. 2D] and superior frontal–occipital [AD: F(1,30) = 8.03, P < 0.01, Fig. 2G; D av: F(1,29) = 8.26, P < 0.01, Fig. 2H] fasciculi.
Projection pathways
Greater RD and D av were related to better word attack performance for the anterior [RD : F(1,29) = 17.62, P < 0.001, Fig. 2J; D av: F(1,29) = 8.52, P < 0.01, Fig. 2L] and superior [RD: F(1,29) = 18.90, P = 0.0001, Fig. 2N; D av: F(1,29) = 6.88, P = 0.01, Fig. 2P] corona radiata. RD and D av were lower in TRs as compared with PRs for the anterior [RD: F(1,29) = 15.40, P < 0.001, Fig. 2J; D av: F(1,29) = 8.37, P < 0.01, Fig. 2L] and superior [RD: F(1,29) = 18.01, P < 0.001, Fig. 2N; D av: F(1,29) = 9.70, P < 0.01, Fig. 2P] corona radiata.
Macrostructural Indices
Association pathways
Greater superior longitudinal fasciculus volume was related to better performance on word attack [F(1,30) = 6.98, P = 0.01, Fig. 3A], phonological awareness composite [F(1,30) = 6.91, P = 0.01, Fig. 3B], and alternate phonological awareness composite [F(1,30) = 7.84, P < 0.01, Fig. 3C], but it was not related to reading group. Superior frontal–occipital fasciculus volume was not found to be related to reading group or reading‐related skills performance.
Projection pathways
Greater anterior corona radiata (ACR) volume was related to better word attack performance [F(1,30) = 6.96, P = 0.01, Fig. 3D] and greater superior corona radiata (SCR) volume was related to better letter–word identification performance [F(1,30) = 7.02, P = 0.01, Fig. 3G]. ACR and SCR volume was related to better phonological awareness composite [ACR: F(1,30) = 12.17, P < 0.01, Fig. 3E; SCR: F(1,30) = 15.36, P < 0.001, Fig. 3H] and alternative phonological awareness composite [ACR: F(1,30) = 8.15, P < 0.01, Fig. 3F; SCR: F(1,30) = 16.83, P < 0.001, Fig. 3I]. ACR and SCR were not found to be related to reading group.
DISCUSSION
Many studies have identified white matter microstructural changes in PRs using a variety of DTI methods for both association and projection pathways within the FTP region [Beaulieu et al.,2005; Deutsch et al.,2005; Klingberg et al.,2000; Niogi and McCandliss,2006; Rollins et al.,2009]. We examined the relation of specific pathways within the FTP region (three association and six projection pathways) with two important reading‐related factors, a history of poor reading and performance on reading‐related skills. We first examined the association of FA with these reading‐related factors and then used complementary microstructural and macrostructural measurements to help interpret the changes identified in FA. By using multiple measures of microstructural change alongside a macrostructural measure, we have identified several interesting patterns of relationships between white matter structure and reading‐related tasks.
The Relation Between Microstructure and Reading‐Related Tasks Is Driven by AD for Association Pathways and RD for Projection Pathways
Hypothesis 1a was partially confirmed. It predicted that changes in association pathway microstructure would be driven by relative changes in AD but not RD. For two of the three association pathways, the superior longitudinal and the superior frontal–occipital fasciculi, AD was higher in individuals with a history of poor reading as compared with those without such a history. However, in terms of the relations between AD and reading‐related skills, the hypothesis was partially confirmed, since greater AD was associated with better word attack performance only in the superior frontal–occipital fasciculus. Changes in AD were not associated with changes in any reading‐related skill in any other association pathway. In addition, the results for the superior longitudinal fasciculus were more complex in that neither AD nor RD was systematically related to performance on word attack. Across reading groups, lower FA and D av and greater volume were associated with better word attack performance in the superior longitudinal fasciculus. This suggests that better reading‐related skills are associated with a more complex pathway in the superior longitudinal fasciculus. The lack of changes in RD could have resulted from nonconsistent changes across the two axes perpendicular to the principal axis that RD represents. Such changes could have averaged out to minimize the effect RD and may have only been detected when RD was analyzed in relation to AD.
Hypothesis 1b was confirmed. It predicted that changes in the projection pathway microstructure would be driven by relative changes in RD, and not AD, since RD is sensitive to both axonal size and disorganization. RD was a key variable for two of the six projection pathways in terms of both history of poor reading and performance on word attack. For the ACR and SCR, RD was higher in individuals with a history of poor reading compared with those without such a history. In terms of the relations between reading‐related skills and microstructure, RD was once again dominant. For the ACR better reading‐related skill performance was associated with a lower FA and greater RD, D av, and volume. A similar pattern of results was found for the SCR.
The Significance of Changes in Association and Projection Pathways and White Matter Structure With Reference to Reading
Clearly, this and other studies implicate the critical importance of projection pathways in reading. The corona radiata is a complex collection of fibers that is easily divided into three segments by DTI. However, there has been no analysis of which of these ascending and descending constituent projections are critical. Fiber tracking studies may be helpful to ascertain which inputs and outputs are critical for reading skill. Nonetheless, the involvement of projection pathways in reading is consistent with visual, auditory, and motor deficits reported in DRs [Nandakumar and Leat,2008; Ramus,2003,2004]. These pathways are also critical for reading since they are responsible for the accurate transmission of bottom‐up information, the integration of top‐down control of incoming information, and for controlling eye stability and saccadic control during reading [Schuett et al.,2008]. The fact that both microstructure and macrostructure changes in the ACR were consistently related to reading‐related skills implicates the importance of frontal processes in the performance of reading‐related skills [Niogi et al.,2008; Pavuluri et al.,2009].
To further identify which neuropathological processes (e.g., axonal size, pathway organization, and pathway complexity) are associated with differences in reading‐related characteristics, several neuroimaging techniques will probably be needed to be combined. For example, tractography may be useful for determining the relative complexity of white matter pathways by quantifying the number of inputs and outputs at each pathway segment, whereas neurophysiological tools, such as magnetoencephalography, electroencephalography, and evoked potential studies, could measure surrogate measures of axonal size and organization, such as peak latency and variability, respectively.
Both Reading Group and Reading‐Related Skills Are Related to White Matter Microstructure and Macrostructure, Sometimes in Opposing Directions
Our second goal was to establish if differences in white matter microstructure and macrostructure were associated with: (a) presence or absence of a history of poor reading, and/or (b) performance on reading‐related tasks. By controlling for a history of poor reading, many microstructural indices were related to sublexical phonological decoding skill, as measured by word attack performance. This is unlike previous studies that have primarily linked lexical skills to white matter microstructural changes in the FTP area. In the current study, lexical skills, as measured by letter–word identification skills, were found to be related to projection white matter macrostructure, rather than microstructure. We found cases of coexisting, but opposing, effects of reading group and reading‐related skill on microstructure. For example, in the ACR and SCR, PRs had lower FA than the TRs, but, nonetheless, lower FA was associated with better word attack performance. Below, we summarize, first, the microstructural and macrostructural differences between reading groups, and second, the relations between white matter microstructure and macrostructure and three reading‐related skills: word attack, phonological awareness, and letter–word identification.
Reading group differences in microstructure and macrostructure
For two of the three association fasciculi, the superior longitudinal and the superior frontal–occipital fasciculi, AD and D av, but not FA, were higher in individuals with a history of poor reading compared with those without such a history. A higher AD would suggest greater coherence of the fibers traveling in the direction of the principal axis of the white matter pathway. However, a higher FA with a concomitant reduced RD would be expected with such an explanation. This effect could also be the result of a subtle increase in the number of entering and exiting axons from these fasciculi, although we would predict that changes in volume, which are not seen in this case, would also occur with such a phenomenon.
In contrast, for two of the six projection pathways, the ACR and SCR, FA was lower and RD and D av were higher in individuals with a history of poor reading compared with those without such a history. This is consistent with the notion that a higher RD, given stable AD, will result in a lower FA. Coupled with the fact that macrostructural volume of the ACR and SCR was not related to a history of poor reading, this effect is likely because of white matter disorganization in PRs as compared with TRs.
The relation between reading‐related skills and microstructure and macrostructure
Word attack and association pathways
The superior longitudinal fasciculus manifested microstructural and macrostructural variations that were associated with word attack. Across reading groups, lower FA, D av, and greater macrostructural volume were associated with better word attack performance. We suggest that it is more likely that the complexity of the fasciculus, not the size of the neurons, was the dimension relevant to word attack skills.
In contrast, for the superior frontal–occipital fasciculus, the relation between word attack and various microstructural indices was harder to interpret because there was a crossover interaction with hemisphere. Examination of the trend lines suggests that the difference between the left and right hemisphere may be driven by participants with poor reading ability.
Word attack skills and projection pathways
For two of the six projection pathways, the ACR and SCR, lower FA and higher RD and D av was associated with better word attack performance. ACR volume was associated with better word attack performance, whereas, SCR volume was not related to word attack. This suggests that the relationship with word attack performance for the ACR was mediated by changes in axonal size, potentially related to a relatively greater number of large magnocellular neurons. Although the lack of the relation between the SCR volume and word attack may suggest that this relation was linked to white matter disorganization, the strong relation between SCR volume and three other reading‐related skills suggests that this relation is indeed related to axonal size, and that the relation between volume and word attack simply did not reach statistical significance.
Phonological awareness skills and association and projection pathways
There were no microstructural correlates of auditory phonological awareness skills in either the association or projection pathways. Instead, the relation between auditory phonological awareness skills and macrostructural findings were similar in the association and projection pathways. For the superior longitudinal fasciculus, as well as the anterior and SCR, better performance on both phonological awareness composites of the CTOPP was related to greater pathway volume. In the projection pathways, volume differences may be secondary to a magnocellular neuron deficiency potentially disrupting auditory phonological awareness, although microstructural changes were only consistent with this notion in the ACR. This does not follow for the association pathways since there are no magnocellular neurons, per se, in the cortex. For the association pathways, changes in volume may be secondary to changes in complexity of the pathway as such a notion would be consistent with the microstructural changes. These data may also suggest that both the superior longitudinal fasciculus and the corona radiata are critical for learning to segment and reassemble sounds in words.
Letter–word identification skills are only related to projection pathways
There were no microstructural correlates of letter–word identification skills. However, increased volume in the SCR was associated with improvements on letter–word identification tasks.
The Advantage of Controlling for Multiple Effects Simultaneously Within a Single Analysis
The current paper demonstrates the advantage of examining whether multiple, potentially interdependent factors, affect white matter microstructure simultaneously. By using reading group and reading‐related skills as factors in a single analysis, we established that these factors can sometimes have opposite effects. Both reading group and reading‐related skills were influenced by FA in two projection white matter tracts (ACR and SCR) with the effects in opposite directions: PRs, as a group, demonstrated lower FA values than TRs; yet, better performance on word attack was associated with lower FA in a similar manner in both groups. Due to the opposite direction in these effects, they could negate each other if not properly taken into account.
CONCLUSIONS
This paper demonstrates that there are at least two factors related to reading that are associated with the microstructure and macrostructure of multiple FTP white matter pathways: (a) having a history of poor reading during childhood and (b) performance on reading‐related tasks. We have shown that it is critical to account for both factors simultaneously to accurately determine their respective association with microstructure. This is supported by our finding that there are instances when microstructural measures can relate in opposite directions with respect to group membership and reading ability. In addition, by accounting for reading group membership, we show that most microstructure and macrostructural changes relate to the level of sublexical skills, as opposed to lexical skills (which has dominated early reports). We have also provided examples where changes in white matter microstructure become more interpretable when considered along with changes in macrostructure. We have, however, used unequal numbers of PRs and TRs participants. This could have caused an over‐representation of the relationship between reading‐related tasks and white matter structure for the TRs in the statistical models. In addition, some differences between PRs and TRs may have been missed because of the lower number of PRs participants.
Perhaps, most importantly, we have shown that although a history of poor reading and reading‐related skills are associated with changes in both association and projection pathway microstructure, these changes are likely to be consequences of different underlying neurobiological mechanisms that are represented by changes in various microstructural indices. Subcortical variation with respect to reading reveals itself mostly through RD whereas cortical variation reveals itself mostly through AD. We suggest that, together, these factors may permit us to differentiate microstructural changes that are due to changes in axonal type and/or size vs. complexity and/or organization of white matter pathways.
This study used a volumetric‐based approach to measure white matter microstructure. This method provides an average measure of microstructure across an entire white matter pathway. Such a method minimizes microstructure variations across pathways. However, understanding location and magnitude of variations within a white matter pathway could also be of great interest. Indeed other DTI methodology have and can be useful for understanding the underlying changes in white matter associated with poor reading, especially if, like this study, multiple aspects of microstructure and macrostructure are analyzed in concert and the influence of multiple reading‐related effects on white matter characteristics are appreciated.
This study has not been presented or published previously.
Footnotes
1Note that Hasan and Narayana (2006) refer to axial and radial diffusivity as longitudinal and transverse diffusivity, respectively.
REFERENCES
- Beaulieu C, Plewes C, Paulson LA, Roy D, Snook L, Concha L, Phillips L ( 2005): Imaging brain connectivity in children with diverse reading ability. Neuroimage 25: 1266–1271. [DOI] [PubMed] [Google Scholar]
- Ben‐Shacher M, Dougherty RF, Wandell B ( 2007): White matter pathways in reading. Curr Opin Neurobiol 17: 258–270. [DOI] [PubMed] [Google Scholar]
- Brosnan M, Demetre J, Hamill S, Robson K, Shepherd H, Cody G ( 2002): Executive functioning in adults and children with developmental dyslexia. Neuropsychologia 40: 2144–2155. [DOI] [PubMed] [Google Scholar]
- Cohen J ( 1988): Statistical Power Analysis for the Behavioral Sciences: Erlbaum, Lawrence & Associates; 567 p. [Google Scholar]
- Deutsch GK, Dougherty RF, Bammer R, Siok WT, Gabrieli JDE, Wandell B ( 2005): Children's reading performance is correlated with white matter structure measured by diffusion tensor imaging. Cortex 41: 354–363. [DOI] [PubMed] [Google Scholar]
- Dougherty RF, Ben‐Shacher M, Deutsch GK, Hernandez A, Fox GR, Wandell B ( 2007): Temporal‐callosal pathway diffusivity predicts phonological skills in children. Proc Natl Acad Sci USA 104: 8556–8561. [DOI] [PMC free article] [PubMed] [Google Scholar]
- Dragovic M ( 2004): Categorization and validation of handedness using latent class analysis. Acta Neuropsychiatry 16: 212–218. [DOI] [PubMed] [Google Scholar]
- Frye RE, McGraw‐Fisher J, Coty A, Zarella M, Liederman J ( 2007): Linear coding of voice onset time. J Cogn Neurosci 19: 1476–1487. [DOI] [PMC free article] [PubMed] [Google Scholar]
- Frye RE, Hasan K, Xue L, Strickland D, Malmberg B, Liederman J, Papanicolaou A ( 2008a): Splenium microstructure is related to two dimensions of reading skill. Neuroreport 19: 1627–1631. [DOI] [PMC free article] [PubMed] [Google Scholar]
- Frye RE, McGraw‐Fisher J, Witzel T, Ahlfors SP, Swank P, Liederman J, Halgren E ( 2008b): Objective phonological and subjective perceptual characteristics of syllables modulate spatiotemporal patterns of superior temporal gyrus activity. Neuroimage 40: 1888–1901. [DOI] [PMC free article] [PubMed] [Google Scholar]
- Frye RE, Landry SH, Swank P, Smith KE ( 2009a): Executive dysfunction in poor readers born prematurely at high risk. Dev Neuropsychol 34: 254–271. [DOI] [PMC free article] [PubMed] [Google Scholar]
- Frye RE, Rezaie R, Papanicolaou A ( 2009b): Functional neuroimaging of language using magnetoencephalography. Phys Life Rev 6: 1–10. [DOI] [PMC free article] [PubMed] [Google Scholar]
- Frye RE, Liederman J, Malmberg B, McLean J, Strickland D, Beauchamp MS: Surface area accounts for the relation of gray matter volume to reading‐related skills and history of dyslexia. Cereb Cortex (in press). [DOI] [PMC free article] [PubMed] [Google Scholar]
- Galaburda AM ( 1993): Neuroanatomic basis of developmental dyslexia. Neurol Clin 11: 161–173. [PubMed] [Google Scholar]
- Galaburda AM, LoTurco JJ, Ramus F, Fitch RH, Rosen GD ( 2006): From genes to behavior in developmental dyslexia. Nat Neurosci 9: 1213–1217. [DOI] [PubMed] [Google Scholar]
- Good CD, Johnsrude I, Ashburner J, Henson RN, Friston KJ, Frackowiak RS ( 2001): Cerebral asymmetry and the effects of sex and handedness on brain structure: A voxel‐based morphometric analysis of 465 normal adult human brains. Neuroimage 14: 685–700. [DOI] [PubMed] [Google Scholar]
- Hasan K ( 2007): A framework for quality control and parameter optimization in diffusion tensor imaging: Theoretical analysis and validation. Magn Reson Imaging 25: 1196–1202. [DOI] [PMC free article] [PubMed] [Google Scholar]
- Hasan KM, Narayana PA ( 2003): Computation of the fractional anisotropy and mean diffusivity maps without tensor decoding and diagonalization: Theoretical analysis and validation. Magn Reson Med 50: 589–598. [DOI] [PubMed] [Google Scholar]
- Hasan K, Narayana PA ( 2006): Retrospective measurement of the diffusion tensor eigenvalues from diffusion anisotropy and mean diffusivity in DTI. Magn Reson Med 56: 130–137. [DOI] [PubMed] [Google Scholar]
- Hasan K, Basser PJ, Parker DL, Alexander AL ( 2001): Analytical computation of the eigenvalues and eigenvectors in DT‐MRI. J Magn Reson 152: 41–47. [DOI] [PubMed] [Google Scholar]
- Hasan K, Halphen C, Sankar A, Eluvathingal TJ, Kramer L, Stuebing KK, Ewing‐Cobbs L, Fletcher JM ( 2007): Diffusion tensor imaging‐based tissue segmentation: Validation and application to the developing child and adolescent brain. Neuroimage 34: 1497–1505. [DOI] [PMC free article] [PubMed] [Google Scholar]
- Hasan K, Halphen C, Boska MD, Narayana PA ( 2008): Diffusion tensor metrics, T2 relaxation, and volumetry of the naturally aging human caudate nuclei in healthy young and middle‐aged adults: Possible implications for the neurobiology of human brain aging and disease. Magn Reson Med 59: 7–13. [DOI] [PubMed] [Google Scholar]
- Hasan KM, Frye R: 2000. Diffusion tensor based regional gray matter tissue segmentation using the international consortium for brain mapping atlases. Hum Brain Mapp (in press). [DOI] [PMC free article] [PubMed] [Google Scholar]
- Jenner AR, Galaburda AM, Sherman GF ( 2000): Connectivity of ectopic neurons in the molecular layer of the somatosensory cortex in autoimmune mice. Cereb Cortex 10: 1005–1013. [DOI] [PubMed] [Google Scholar]
- Keller TA, Just MA ( 2009): Altering cortical connectivity: Remediation‐induced changes in the white matter of poor readers. Neuron 64: 624–631. [DOI] [PMC free article] [PubMed] [Google Scholar]
- Kemp N, Parrila RK, Kirby JR ( 2008): Phonological and orthographic spelling in high‐functioning adult dyslexics. Dyslexia 15: 105–128. [DOI] [PubMed] [Google Scholar]
- Klingberg T, Hedehus M, Temple E, Salz T, Gabrieli JDE, Moseley ME, Poldrack RA ( 2000): Microstructure of temporo‐parietal white matter as a basis for reading ability: Evidence from diffusion tensor magnetic resonance imaging. Neuron 25: 493–500. [DOI] [PubMed] [Google Scholar]
- Landry SH, Smith KE, Swank P, Assel MA, Vellet S ( 2001): Does early responsive parenting have a special importance for children's development or is consistency across early childhood necessary? Dev Psych 37: 387–403. [DOI] [PubMed] [Google Scholar]
- Lyon GR ( 1998): Overview of Reading and Literacy Initiatives. Bethesda, MD: National Institute of Child Health and Human Development (NIH). [Google Scholar]
- McGrew KS, Schrank FA, Woodcock RW ( 2007): Technical Manual. Woodcock‐Johnson III Normative Update. Rolling Meadows, IL: Riverside Publishing. [Google Scholar]
- Miller‐Shaul S ( 2005): The characteristics of young and adult dyslexic readers on reading and reading related cognitive tasks as compared to normal readers. Dyslexia 11: 132–151. [DOI] [PubMed] [Google Scholar]
- Mori S, Oishi K, Jiang H, Jiang L, Li X, Akhter K, Hua K, Faria AV, Mahmood A, Woods R, Toga AW, Pike G, Neto P, Evans A, Zhang J, Huang H, Miller M, van Zijl P, and Mazziotta J ( 2008): Stereotaxic white matter atlas based on diffusion tensor imaging in an ICBM template. Neuroimage 40: 570–582. [DOI] [PMC free article] [PubMed] [Google Scholar]
- Nagy Z, Westerberg H, Klingberg T ( 2004): Maturation of white matter is associated with the development of cognitive functions during childhood. J Cogn Neurosci 16: 1227–1233. [DOI] [PubMed] [Google Scholar]
- Nandakumar K, Leat SJ ( 2008): Dyslexia: A review of two theories. Clin Exp Optom 91: 333–340. [DOI] [PubMed] [Google Scholar]
- Niogi SN, McCandliss BD ( 2006): Left lateralized white matter microstructure accounts for individual differences in reading ability and disability. Neuropsychologia 44: 2178–2188. [DOI] [PubMed] [Google Scholar]
- Niogi SN, Mukherjee P, Ghajar J, Johnson CE, Kolster R, Lee H, Suh M, Zimmerman RD, Manley GT, McCandliss BD ( 2008): Structural dissociation of attentional control and memory in adults with and without mild traumatic brain injury. Brain 131: 3209–3221. [DOI] [PubMed] [Google Scholar]
- Odegard TN, Farris EA, Ring J, McColl R, Black J ( 2009): Brain connectivity in non‐reading impaired children and children diagnosed with developmental dyslexia. Neuropsychologia 47: 1972–1977. [DOI] [PubMed] [Google Scholar]
- Oldfield RC ( 1971): The assessment and analysis of handedness: The Edinburgh inventory. Neuropsychologia 9: 97–113. [DOI] [PubMed] [Google Scholar]
- Paulesu E, Frith U, Snowling MJ, Gallagher A, Morton J, Frackowiak RSJ, Frith CD ( 1996): Is developmental dyslexia a disconnection syndrome: Evidence from PET scanning. Brain 19: 143–157. [DOI] [PubMed] [Google Scholar]
- Paulesu E, Démonet JF, Fazio F, McCrory E, Chanoine V, Brunswick N, Cappa SF, Cossu G, Habib M, Frith CD, Frith U ( 2001): Dyslexia: Cultural diversity and biological unity. Science 29: 2165–2167. [DOI] [PubMed] [Google Scholar]
- Pavuluri MN, Yang S, Kamineni K, Passarotti AM, Srinivasan G, Harral EM, Sweeney JA, Zhou XJ ( 2009): Diffusion tensor imaging study of white matter fiber tracts in pediatric bipolar disorder and attention‐deficit/hyperactivity disorder. Biol Psychiatry 65: 586–593. [DOI] [PMC free article] [PubMed] [Google Scholar]
- Pugh KR, Mencl WE, Shaywitz BA, Shaywitz SE, Fulbright RK, Constable RT, Skudlarksi P, Marchione K, Jenner AR, Fletcher JM, Liberman AM, Shankweiler DP, Katz L, Lacadie C, Gore JC ( 2000): The angular gyrus in developmental dyslexia: Task‐specific differences in functional connectivity within posterior cortex. Psychol Sci 11: 51–56. [DOI] [PubMed] [Google Scholar]
- Qiu D, Tan LH, Zhou K, Khong PL ( 2008): Diffusion tensor imaging of normal white matter maturation from late childhood to young adulthood: Voxel‐wise evaluation of mean diffusivity, fractional anisotropy, radial and axial diffusivities, and correlation with reading development. Neuroimage 41: 223–232. [DOI] [PubMed] [Google Scholar]
- Ramus F ( 2003): Developmental dyslexia: Specific phonological deficit or general sensorimotor dysfunction? Curr Opin Neurobiol 13: 212–218. [DOI] [PubMed] [Google Scholar]
- Ramus F ( 2004): Neurobiology of dyslexia: A reinterpretation of the data. Trends Neurosci 27: 720–726. [DOI] [PubMed] [Google Scholar]
- Richards T, Stevenson J, Crouch J, Johnson LC, Maravilla K, Stock P, Abbott R, Berninger V ( 2008): Tract‐based spatial statistics of diffusion tensor imaging in adults with dyslexia. Am J Neuroradiol 29: 1134–1139. [DOI] [PMC free article] [PubMed] [Google Scholar]
- Rimrodt SL, Peterson DJ, Denckla MB, Kaufmann WE, Cutting LE ( 2009): White matter microstructural differences linked to left perisylvian language network in children with dyslexia. Cortex 46: 739–749. [DOI] [PMC free article] [PubMed] [Google Scholar]
- Rollins NK, Vachha B, Srinivasan P, Chia J, Pickering J, Hughes CW, Gimi B ( 2009): Simple developmental dyslexia in children: Alterations in diffusion‐tensor metrics of white matter tracts at 3 T1 . Radiology 251: 882–891. [DOI] [PubMed] [Google Scholar]
- Schuett S, Heywood CA, Kentridge RW, Zihl J ( 2008): The significance of visual information processing in reading: Insights from hemianopic dyslexia. Neuropsychologia 46: 2445–2462. [DOI] [PubMed] [Google Scholar]
- Shaywitz SE ( 1998): Current concepts: Dyslexia. New Engl J Med 338: 307–312. [DOI] [PubMed] [Google Scholar]
- Shaywitz SE, Shaywitz BA, Fulbright RK, Skudlarksi P, Mencl WE, Constable RT, Pugh KR, Holahan JM, Marchione K, Fletcher JM, Lyon GR, Gore JC ( 2003): Neural systems for compensation and persistence: Young adult outcome of childhood reading disability. Biol Psychiatry 54: 25–33. [DOI] [PubMed] [Google Scholar]
- Simos PG, Fletcher JM, Denton C, Sarkari S, Billingsley‐Marshall R, Papanicolaou AC ( 2006): Magnetic source imaging studies of dyslexia interventions. Dev Neuropsychol 30: 591–611. [DOI] [PubMed] [Google Scholar]
- Snowling MJ ( 2008): Specific disorders and broader phenotypes: The case of dyslexia. Q J Exp Psychol 61: 142–156. [DOI] [PubMed] [Google Scholar]
- Snowling MJ, Gallagher A, Frith U ( 2003): Family risk of dyslexia is continuous: Individual differences in the precursors of reading skill. Child Dev 74: 358–373. [DOI] [PubMed] [Google Scholar]
- Svensson I, Jacobson C ( 2006): How persistent are phonological difficulties? A longitudinal study of reading retarded children. Dyslexia 12: 3–20. [DOI] [PubMed] [Google Scholar]
- Temple E, Deutsch GK, Poldrack RA, Miller SL, Tallal P, Merzenich MM, Gabrieli JD ( 2003): Neural deficits in children with dyslexia ameliorated by behavioral remediation: Evidence from functional MRI. Proc Natl Acad Sci USA 100: 2860–2865. [DOI] [PMC free article] [PubMed] [Google Scholar]
- Wagner RK, Torgesen JK, Rashotte CA ( 1999): Comprehensive Test of Phonological Processing. Austin, TX: PRO‐ED. [Google Scholar]
- Wiederhoft JL, Bryant BR ( 2001): GORT4 Gray Oral Reading Tests Examiner's Manual. Austin, TX: PRO‐ED. [Google Scholar]