

Abstract
Obsessive‐compulsive disorder (OCD) emerges during childhood through young adulthood coinciding with the late phases of postnatal brain development when fine remodeling of brain anatomy takes place. Previous research has suggested the existence of subtle anatomical alterations in OCD involving focal volume variations in different brain regions including the frontal lobes and basal ganglia. We investigated whether anatomical changes might also involve variations in the shape of the frontobasal region. A total of 101 OCD patients and 101 control subjects were examined using magnetic resonance imaging. A cross‐sectional image highly representative of frontal‐basal ganglia anatomy was selected in each individual and 25 reliable anatomical landmarks were identified to assess shape changes. A pixel‐wise morphing approach was also used to dynamically illustrate the findings. We found significant group differences for overall landmark position and for most individual landmarks delimiting the defined frontobasal region. OCD patients showed a deformation pattern involving shortening of the anterior‐posterior dimension of the frontal lobes and basal ganglia, and enlargement of cerebrospinal fluid spaces around the frontal opercula. In addition, we observed significant correlation of brain tissue shape variation with frontal sinus size. Identification of a global change in the shape of the frontobasal region may further contribute to characterizing the nature of brain alterations in OCD. The coincidence of brain shape variations with morphological changes in the frontal sinus indicates a potential association of OCD to late development disturbances, as the frontal sinus macroscopically emerges during the transition between childhood and adulthood. Hum Brain Mapp, 2011. © 2010 Wiley‐Liss, Inc.
Keywords: brain, MRI, anatomy, shape, frontal cortex, OCD
INTRODUCTION
Maturation of the brain is accelerated in the early years of life [Casey et al.,2005; Herschkowitz,2000; Pujol et al.,2006], but developmental changes in brain function and structure occur up to adulthood and may account for increasing effectiveness in cognition and skills that characterizes the late stages of human development [Pujol et al.,1993; Toga et al.,2006]. During the entire development, however, individuals are at risk of deviating from normal maturational processes and may be more vulnerable to develop specific neuropsychiatric disorders [Pantelis et al.,2005; Paus et al.,2008; Waddington et al.,1999]. Obsessive‐compulsive disorder (OCD) characteristically emerges during childhood through young adulthood [Geller et al.,1998; Pauls et al.,1995; Stewart et al.,2004; Valleni‐Basile et al.,1996] coinciding with the late phases of postnatal brain development when fine remodeling of brain anatomy takes place.
OCD is clinically characterized by the presence of intrusive thoughts and ritualistic behaviors which have been related to functional disturbances in different brain systems, including the frontostriatal circuits [Chamberlain et al.,2008; Evans et al.,2004; Harrison et al.,2009; Marsh et al.,2009; Menzies et al.,2008a; Stein,2000]. In OCD, however, there is also evidence for anatomical alterations affecting white matter integrity, gray matter concentration, and gray matter volume in the frontal lobes, basal ganglia, and connected brain systems [Cardoner et al.,2007; Kim et al.,2001; Menzies et al.,2008a,b; Pujol et al.,2004; Radua and Mataix‐Cols,2009; Rotge et al.,2009; Soriano‐Mas et al.,2007; Szeszko et al.,2005 ]. Interestingly, some anatomical changes are related to patients' age and disease duration, suggesting a dynamic nature for part of the abnormality observed [Marsh et al.,2009; Pujol et al.,2004]. Relatives of OCD patients may also show structural brain alterations suggesting the existence of a familial endophenotype for this psychiatric disorder [Menzies et al.,2007,2008b].
Together with volume changes in maturating structures, brain development involves changes in the shape of the organ and its anatomical components [Hilgetag and Barbas,2005; Van Essen,1997]. In the context of OCD, structural alterations arising from the concurrence of genetic and environmental factors could arguably also be expressed as measurable changes in the shape of developing regions, and particularly the regions more directly related to OCD pathophysiology. A research group addressing this issue has recently demonstrated shape alterations in the corpus striatum, the thalamus, and the hippocampus in OCD patients [Choi et al.,2007; Hong et al.,2007; Kang et al.,2008].
We investigated possible variation in the shape of the frontobasal region in patients with OCD. This part of the brain contains critical functional circuits with respect to OCD pathophysiology [Harrison et al.,2009] and shows a long‐lasting maturation process that is considerably active beyond childhood, when the OCD becomes clinically evident in most patients [Paus et al.,2001; Toga et al.,2006; Yakovlev and Lecours,1967]. We used a straightforward two‐dimensional morphometric approach to assess a large sample of OCD patients and matched control subjects. We selected one magnetic resonance imaging slice highly representative of the frontal‐basal ganglia anatomy and defined reliable anatomical landmarks to assess morphometric differences between both study groups.
METHODS AND MATERIALS
Subjects
A total of 202 subjects participated in this study including 101 OCD patients and 101 control subjects matched by age, sex, and education level. OCD participants were outpatients with a mean age ± SD of 30.72 ± 10.2 years, age range 18 to 63 years, education level 12.7 ± 3.25 years and included 45 women and 13 left‐handed individuals. Patient recruitment was consecutive in follow‐up visits and inclusion was performed according to DSM‐IV criteria for OCD and the absence of relevant medical, neurological, and other major psychiatric conditions. Specifically, no patient met the criteria for Tourette syndrome or showed psychoactive substance abuse. Comorbidity with depression or other anxiety disorders was not considered an exclusion criterion provided that OCD was the primary clinical process. Diagnosis was independently assigned by two psychiatrists who separately interviewed patients using the Structured Clinical Interview for DSM‐IV Axis I Disorders‐Clinician Version [First et al.,1997]. Patients were eligible for the study when both research examiners agreed on all criteria. Table I summarizes the primary clinical features of OCD patients.
Table I.
Clinical characteristics of OCD sample
| Age at onset of OCD, yr, mean ± SD (range) | 17.90 ± 6.10 (6–40) | ||
| Duration of illness, yr, mean ± SD (range) | 12.42 ± 9.93 (1–51) | ||
| Global Y‐BOCS score, mean ± SD (range) | 27.46 ± 6.55 (7–38) | ||
| Y‐BOCS obsessions score, mean ± SD (range) | 14.09 ± 3.00 (6–19) | ||
| Y‐BOCS compulsions score, mean ± SD (range) | 13.34 ± 4.26 (0–19) | ||
| OCD symptoms (Mataix‐Cols et al.'s dimensions [1999])a | 0 (absent) | 1 (mild) | 2 (prominent) |
| Symmetry and ordering, N (%) | 72 (71.29) | 11 (10.89) | 18 (17.82) |
| Hoarding, N (%) | 70 (69.31) | 22 (21.78) | 9 (8.91) |
| Contamination and cleaning, N (%) | 56 (55.44) | 20 (19.80) | 25 (24.75) |
| Aggressive and checking, N (%) | 29 (28.71) | 26 (25.74) | 46 (45.54) |
| Sexual and religious obsessions, N (%) | 79 (78.21) | 7 (6.93) | 15 (14.85) |
| Comorbid diagnoses | |||
| Significant history of depression, N (%) | 35 (34.65) | ||
| HAM‐D score at inclusion, mean ± SD (range) | 14.14 ± 5.73 (4–29) | ||
| Significant history of anxiety, N (%) | 26 (25.74) | ||
| HAM‐A score at inclusion, mean ± SD (range) | 15.19 ± 6.97 (0–33) | ||
| Treatment status | |||
| Never treated, N (%) | 6 (5.94) | ||
| One previous SRIs trial completed, N (%) | 25 (24.75) | ||
| Two previous SRIs trials completed, N (%) | 29 (28.71) | ||
| Three or more previous SRIs trials completed, N (%) | 41 (40.59) | ||
| Cumulative SRIs, mo, mean ± SD (range, median) | 35.00 ± 54.65 (0–396, 18.0) | ||
| Stable medication at time of the MRI | |||
| Medication‐free (>4 wk) | 22 (21.78) | ||
| Clomipramine hydrochloride | 33 (32.67) | ||
| Fluoxetine or Fluvoxamine maleate | 20 (19.80) | ||
| Phenelzine sulfate | 3 (2.97) | ||
| Clomipramine with fluoxetine | 23 (22.77) | ||
A score of 2 (prominent) was allowed for more than one dimension.
Y‐BOCS, Yale‐Brown Obsessive Compulsive Scale; HAM‐D, Hamilton Rating Scale for Depression; HAM‐A, Hamilton Rating Scale for Anxiety; SRIs, serotonin reuptake inhibitors.
The control group involved healthy subjects selected from the same sociodemographic environment and showed a mean age of 30.79 ± 10.4 years, age range 18 to 63 years, level of education of 13.6 ± 3.25 years and included 45 women and 14 left‐handed individuals. All patients and control subjects gave written informed consent after receiving a complete description of the study, which was approved by the institutional review board (Hospital of Bellvitge). The investigation was carried out in accordance with the Declaration of Helsinki.
Magnetic Resonance Imaging Acquisition
All imaging studies were acquired using a 1.5T magnet (Signa; GE Medical Systems, Milwaukee, WI). A 60‐slice, three‐dimensional, spoiled gradient‐recalled acquisition sequence was performed. Acquisition parameters were repetition time, 40 ms; echo time, 4 ms; flip angle, 30°; field of view, 26 cm; matrix size, 256 × 192 pixels; and slice thickness, 2.5 mm.
Slice and Landmark Selection
An axial plane following the orientation of the bicommissural (anterior commissure‐posterior commissure) line, as displayed in the Talairach atlas [Talairach and Tournoux,1988], was selected from the three‐dimensional data set in each individual. This plane was selected on the grounds of its proven homology across subjects [Talairach et al.,1952] and because it includes the most relevant frontostriatal structures classically related to OCD pathophysiology. In our procedure, the head position was first corrected on a coronal view by 3D rotation of the acquired volume and the location of the anterior and posterior commissures were easily identified in the sagittal view. A two‐dimensional cross‐section of the brain was selected through this line for each study subject that was coded and stored in digital format without the subject's identification data. The whole procedure was performed on an auxiliary workstation (Ultra 60; Sun Microsystems, Mountain View, CA), using commercially available software (Advantage Windows, version 4.0; GE Medical Systems).
Twenty‐five anatomical landmarks were identified in this bicommissural plane (Fig. 1). Eighteen landmarks were placed in the cortical contour: bilateral landmarks included the most anterior and medial point of the frontal lobe, the anterior‐lateral frontal vertex, the most caudal aspect of the frontal operculum, the most rostral point of the insula, the most caudal point of the insula, the most rostral point of the temporal lobe, the most lateral point of the temporal lobe, the occipital pole, and the midpoint between these last two landmarks. Also, a medial landmark was selected on the interhemispheric fissure between the two lingual gyri (immediately caudal to the cerebellar vermis). The remaining six landmarks were located in subcortical structures, such as the anterior and posterior commissures, and bilaterally in the most rostral aspect of the caudate nucleus and in the most lateral aspect of the temporal horn of the lateral ventricle. A digitizing software (tpsDig; written by F.J. Rohlf; available from the SUNY at Stony Brook morphometrics; available at: http://life.bio.sunysb.edu/morph) was used for digitizing and obtaining coordinate data (pixel position). Transformation of pixel distances into millimeters was directly estimated from pixel size.
Figure 1.
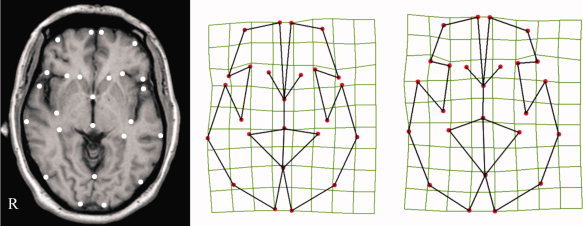
Landmark position. On the left, the selected bicommissural anatomical plane with the 25 landmarks identified for each individual. The schematic deformation fields illustrate landmark configurations representative of mean control subject (central figure) and OCD patient (right figure) morphology. R indicates right hemisphere. [Color figure can be viewed in the online issue, which is available at wileyonlinelibrary.com.]
Data Analysis
Landmark‐based multivariate analysis
Processing of landmark data followed procedures previously described [Free et al.,2001; Gharaibeh et al.,2000]. Individual landmark configurations were aligned to each other by translation, rotation, and scaling to a unit centroid size by Generalized Procrustes Analysis (GPA), a least squares fitting of all 2D configurations to the average. The mean landmark configuration of all study subjects was used as the reference for alignment. This analysis removes variation due to the subject's head position, orientation, and size. Subsequently, the variability in the GPA residuals was decomposed into the uniform (affine) and nonuniform components of shape change using thin‐plate spline (TPS) interpolating functions. The TPS deformation grids represent the warpings with the lowest bending energy in mapping the landmark configuration of each brain onto the average configuration. A weight matrix W′ of partial warp scores of the TPS functions was then computed, including the uniform and nonuniform components. Canonical Variates Analysis (CVA) was performed on the weight matrix W′ to obtain the axis representing the largest between‐group variation in shape. The statistical significance of the deformation pattern was assessed with MANOVA. GPA superimposition, calculation of W′ matrix, and visualization of deformation splines was made using tpsRelw and tpsRegr software (F.J. Rohlf;//http://life.bio.sunysb.edu/morph).
Direct measurements on original brain images
A separate analysis was conducted to identify those landmarks showing larger individual position differences between both study groups. The measurements were carried out in native space on the original brain cross‐sectional images. Brain length (fronto‐occipital distance) and brain width (temporotemporal distance) were obtained as global measurements. The position of the landmarks was then estimated using the anterior commissure as a reference. Primary measurements involved the distance from each landmark to the transverse line (perpendicular to the anterior‐posterior brain axis) passing through the anterior commissure (“anterior commissure line”). Composite measurements involved the average distance from the four anterior frontal landmarks (“anterior frontal line”) to the anterior commissure line, and the average distance from the caudate and anterior insula landmarks (“subcortical line”) to the anterior commissure line. In addition, the area of the frontal region was measured as the tissue delimited by the frontal landmarks. All measurements were made by an expert observer who was blind to any subject identification including the study group. The reproducibility of the measurements was blindly tested in a random subsample of 55 subjects. The right anterior‐medial landmark and left anterior‐lateral landmark were identified twice in these subjects in different sessions and the distance to the anterior commissure line was recalculated. The intraclass correlation coefficient obtained for the 55 pairs of measurements was 0.96 for the right anterior‐medial landmark and 0.95 for the left anterior‐lateral landmark. Student's t test was used to compare distance measurements between both study groups.
A separate analysis was also conducted to investigate the correlations between the above composite measurements (distance from the “anterior frontal line” to the anterior commissure line and distance from the “subcortical line” to the anterior commissure line) and relevant clinical variables including age, age at onset, illness duration, illness severity (Y‐BOCS scores). and OCD symptom dimension scores, according to Mataix‐Cols et al. [1999]. Pearson's correlations were used in this analysis.
Upon inspection on the selected brain cross‐sectional images, we appreciated a large variability of the frontal sinus size, which appears on this slice as an air space expanding frontal bone thickness (Fig. 1). We estimated the anterior‐posterior dimension of the frontal sinus using a simple linear measurement (distance between subcutaneous tissue and frontal pole at the medial aspect of the right hemisphere). Student's t test and Levine's test for equality of variances were used to compare frontal bone measurements between both study groups, and Pearson's correlation served to assess the relationship with frontal lobe measurements. An ANCOVA was also conducted to test the effect of frontal bone measurements on between‐group frontal lobe measurement differences.
Dynamic Illustration of Shape Variations
A method was developed to illustrate the findings using a movie sequence showing pixel‐wise morphing from control subject to patient anatomy at the bicommissural plane. We used linear discriminant analysis (LDA) on the warping fields from each individual two‐dimensional image to a template. LDA is a multivariate analysis technique that identifies the combination of features (e.g., warping field) that best discriminates between labeled study groups [Duda et al.,2000]. In a two‐group approach, LDA provides the equation (one‐dimensional space) that best separates the two groups. As the number of variables (pixels) was much larger than the number of subjects, principal component analysis (PCA) was used before LDA to reduce data dimensionality. The anatomical features entered into the analyses were the spatial transformations that warped each individual to the template. Nonrigid registration was performed with diffeomorphic mapping allowing large deformations while preserving topology [Hernandez et al.,2009]. The brain template was estimated from the 101 control group images using the method described in Bossa et al. [2007].
To visualize the warping that best discriminates both study groups, the calculated deformation field was applied to the template image, generating a movie sequence showing the morphological transformation of control subjects into OCD patients.
RESULTS
The landmark‐based multivariate analysis assessing anatomical deformation in the frontobasal plane showed global significant differences for landmark position between OCD patients and control subjects. MANOVA, including 25 landmark coordinates from the 202 study subjects, showed Wilks′ λ = 0.68, F = 1.6 (df 46,155), P = 0.016. Figure 1 provides a deformation map showing relative landmark position variation for OCD and control subjects. This graphic representation highlights the general effect for frontal and basal ganglia structures showing a relative shortening in their anterior‐posterior dimension in OCD.
In the analysis of direct measurements performed on original brain images, we did not find between‐group differences for overall brain length (P = 0.381) and brain width (P = 0.549). By contrast, the distance between each anterior frontal landmark and the anterior commissure line was significantly reduced in the OCD group (Table II), with the largest change corresponding to the left anterior‐lateral frontal landmark showing a mean between‐group difference of 2 mm. The “anterior frontal line” (defined by the four frontal landmarks) was 1.5 mm closer to the anterior commissure in OCD patients than in control subjects (t = 3.5; P = 0.001). Differences between both study groups were also significant using relative measurements. Relative anterior‐posterior dimension of frontal lobes (“distance between anterior frontal line and anterior commissure” × 100/brain length) was 36.2 ± 1.2% in control subjects and 35.4 ± 1.5% in OCD patients, showing t = 4.1 and P = 0.00006. Despite statistical significance, the magnitude of change was small (0.8% difference).
Table II.
Group comparison of landmark distance to anterior commissure line
| Landmark | Mean ± SD (mm) | t | P | |
|---|---|---|---|---|
| Controls | OCD | |||
| R Medial frontal | 57.5 ± 2.8 | 56.3 ± 3.1 | −3.0 | 0.003 |
| L Medial frontal | 57.3 ± 3.1 | 56.1 ± 3.2 | −2.8 | 0.005 |
| R Anterior‐lateral frontal | 51.6 ± 3.3 | 50.1 ± 4.1 | −2.3 | 0.020 |
| L Anterior‐lateral frontal | 49.7 ± 3.2 | 47.8 ± 4.0 | −3.8 | 0.0001 |
| R Caudate nucleus | 18.2 ± 2.4 | 17.4 ± 2.5 | −2.6 | 0.010 |
| L Caudate nucleus | 17.2 ± 1.8 | 16.5 ± 2.2 | −2.4 | 0.015 |
| R Anterior insula | 21.4 ± 3.2 | 20.1 ± 3.1 | −2.8 | 0.005 |
| L Anterior insula | 20.7 ± 2.7 | 19.7 ± 2.6 | −2.6 | 0.009 |
In subcortical structures we observed a similar effect (Table II). The right and left caudate and anterior insula landmarks were significantly closer to the anterior commissure line in the OCD group. The “subcortical line” defined by these four landmarks was 0.8 mm closer to the anterior commissure in OCD patients than in control subjects (t = 2.8, P = 0.006). The ratio of the distance between subcortical line and anterior commissure line to brain length was 15.0 ± 1.3% in control subjects and 14.6 ± 1.2% in OCD patients (t = 2.6, P = 0.011).
It is relevant to note that the landmarks identifying the frontal opercular pole in both hemispheres (Fig. 1) did not follow the pattern of posterior displacement observed for the subcortical line. Instead, this effect coincided with a significant increase in the distance between frontal and temporal opercular poles in OCD patients in both hemispheres (1.2 ± 0.5 mm larger in patients in the right hemisphere showing t = 2.4 and P = 0.019; and 1.1 ± 0.5 mm larger in the left hemisphere showing t = 2.3 and P = 0.024). Such an increase in the distance between frontal and temporal opercula reflects an enlargement of cerebrospinal fluid (CSF) spaces in the anterior part of the Sylvian fissure region.
All in all, direct measurements showed a deformation pattern involving relative shortening of the basal aspect of the frontal lobes and basal ganglia, together with Sylvian fissure CSF space enlargement. Such changes in shape, however, were not associated with significant reduction of the frontal lobe area as measured in the selected slice (bilateral frontal area in OCD patients was 29.4 ± 2.8 mm2 and in controls 29.9 ± 2.9 mm2; t = −1.1 and P = 0.289).
The correlation analysis between composite brain measurements and relevant clinical variables showed that the distance from the “anterior frontal line” to the anterior commissure line was negatively correlated with age in both study groups (controls, r = −0.31 and P = 0.002; patients, r = −0.38 and P = 0.00008) and with disease duration in OCD patients (r = −0.39, P = 0.00007). Age at onset, disease severity, and symptom dimension scores showed no significant correlation with this measurement.
The distance from the “subcortical line” to the anterior commissure line was negatively correlated with age only in the patient group (r = −0.25, P = 0.011). Disease duration in OCD patients was also negatively correlated with this measurement (r = −0.27, P = 0.007), which showed no significant relationship with the other clinical variables (age at onset, disease severity, and symptom dimension scores).
We observed a large variability for the skull measurement estimating the anterior‐posterior dimension of the frontal sinus ranging from 11.3 to 26.3 mm in the entire study sample. Nevertheless, variance for this measurement was significantly larger in the OCD group (Levine's test for equality of variances F = 8.9 and P = 0.003). Frontal bone measurements were larger in OCD patients also in terms of average (OCD mean ± SD, 17.6 ± 3.5 mm; controls, 16.7 ± 2.5 mm; t = 2.2; P = 0.03; equal variances not assumed). The frontal bone measurement had a negative correlation with frontal lobe measurements. For example, it correlated with the relative anterior‐posterior dimension of frontal lobes showing r = −0.30, P = 0.00002 (n = 202). The observed differences between OCD patients and control subjects in relative shortening of frontal lobes (as explained earlier, t = 4.1 and P = 0.00006) were tested again using ANCOVA controlling for the frontal bone measurement. Group differences remained significant in this analysis (t = 3.6 and P = 0.0004), indicating that frontal sinus size minimally accounted for differences in the shape of the frontobasal brain region.
Shape variations in the frontobasal region were both corroborated and dynamically illustrated using LDA on the warpings between the subjects and a defined template (Supporting Information, Movie 1). The movie display shows dominant frontal lobe and basal ganglia anterior‐posterior deformation, with additional frontal lobe lateral‐medial displacement. CSF space enlargement of the anterior Sylvian fissure region is also evident. The movie additionally shows changes in structures not delimited by the selected landmarks. Specifically, OCD patients compared with control subjects show displacement of the posterior extent of the left lateral ventricle, and changes in the shape of gray matter located within both right and left frontal lobes corresponding to the depth of the main orbital sulcus.
DISCUSSION
Clinical observations and behavioral data suggest the presence of functional disturbances in the frontal lobes and basal ganglia in OCD [Evans et al.,2004; Marsh et al.,2009; Menzies et al.,2008a]. Functional imaging studies have indeed revealed abnormal activity and altered metabolism in frontostriatal circuits [Harrison et al.,2009; Menzies et al.,2008a; Pujol et al.,1999; Yücel et al.,2007]. The alteration is also expressed in the anatomy, with regional volume increases and decreases that may vary during the course of the disorder [Marsh et al.,2009; Pujol et al.,2004; Rotge et al.,2009]. In the current study, we have identified variations in the shape of the frontobasal region in OCD that may further contribute to characterizing the nature of brain alteration in this disorder.
We conducted a landmark‐based deformation analysis in the bicommissural plane, which is a major anatomic reference in neuroimaging research [Talairach and Tournoux,1988] and is highly representative of the frontal‐basal ganglia anatomy. We found significant group differences for overall landmark position and for most individual landmarks delimiting the selected frontobasal region. The deformation pattern involved shortening of the anterior‐posterior dimension of the frontal lobes and basal ganglia. In addition, the frontal opercula were displaced in the opposite direction, together with a consequent enlargement of sylvian CSF spaces. The presented data would suggest a global pattern of deformity in the frontobasal region, rather than being the result of focal volume changes that may coexist in OCD. Indeed, the patients included in the present study were previously analyzed using whole‐brain voxel‐based morphometry (VBM) tools to identify possible regional volume alterations [Pujol et al.,2004; Soriano‐Mas et al.,2007]. The data indicated the presence of volume reduction in the most ventral and medial aspect of the orbitofrontal cortex, which was focal and distant from the bicommissural plane selected in the current. Also, no volume alterations for the lateral ventricles were observed in OCD patients in this VBM analysis, which can rule out that our current findings reflect anatomical distortions secondary to subcortical atrophy.
Another research group investigated shape alterations for specific brain structures in OCD and demonstrated significant changes in the corpus striatum [Choi et al.,2007], thalamus [Kang et al.,2008], and hippocampus [Hong et al.,2007]. Specific findings involved “outward deformity” for the anterior‐superior aspect of the caudate nuclei bilaterally [Choi et al.,2007]. Although the data obtained in this latter study may not be directly compared with our measurements, the superior protrusion of the caudate nucleus head is compatible with the anterior‐posterior shortening of basal ganglia observed in our study. It is worth noting that the alteration in the shape of basal ganglia was not accompanied by changes in volume [Choi et al.,2007], which would further suggest the existence of shape changes in OCD that are not consequence of underlying changes in the volume of the deformed structures.
A number of arguments based on disorder onset, abnormal behavioral maturation, and focal neuroimaging findings suggest the contribution of developmental factors to the origin of OCD with primary disturbances in frontostriatal circuits [Evans et al.,2004; Geller et al.,1998; Marsh et al.,2009; Rosenberg et al.,1998]. As structural brain development essentially refers to the shape‐changing process of its anatomic elements [Bruner,2007; Hilgetag and Barbas, 2005; O'Rahilly and Müller,2006; Van Essen,1997], the identified shape alterations in our study further support the notion that OCD is to some extent coupled with abnormal brain development involving frontobasal structures. However, it is relevant to emphasize that the alteration in shape we report may only account for a small part of the OCD condition. More comprehensive assessments of brain deformation in OCD patients are required to better establish the role of developmental factors in this disorder.
We found a subtle but global shape change in the brain tissue that occupies the anterior cranial fossa. The development of the anterior part of the brain is closely coupled with craniofacial growth, with forces arising from surrounding non‐neural structures affecting brain shape at this location [Bastir et al.,2006; Bruner,2007; Waddington et al.,1999]. We found an association between frontal sinus expansion and basal frontal tissue “retraction” that may reflect reciprocal interactions between skull and brain shaping during development. Despite this association, frontal sinus enlargement did not largely explain frontal lobe shape alteration in OCD because group differences for the frontal measurements remained significant after removing the effect of frontal sinus size. Frontal bone and frontal tissue alterations, therefore, may coincide in OCD, rather than being causally related.
A coincidence of both bone and brain tissue changes in OCD patients may potentially inform us as to when brain shape alterations take place during late development, as the temporal evolution of postnatal frontal sinus growth is well known [Brown et al.,1984; Fatu et al.,2006; Pohunek,2004; Ruf and Pancherz,1996; Scuderi et al.,1993; Shah et al.,2003; Spaeth et al.,1997; Weiglein et al.,1992]. The frontal sinus is part of the paranasal sinuses and originates from the anterior ethmoidal cells that migrate into the frontal bone during postnatal life. With increasing pneumatization, the frontal sinus becomes macroscopically evident around the age of 8 years, when it projects above the orbital rim [Fatu et al.,2006; Pohunek,2004; Ruf and Pancherz,1996; Scuderi et al.,1993; Weiglein et al.,1992]. Analogous to height gain at puberty, the enlargement of the frontal sinus exhibits a similar pattern with a well‐defined peak that occurs on average 1.4 years after the height peak [Ruf and Pancherz,1996]. The development of the frontal sinus continues at lowest velocity after puberty and is completed during the final period of adolescence, around the age of 18 [Pohunek,2004; Spaeth et al.,1997]. The chronological features of frontal sinus expansion may therefore provide interesting clues as to when frontal lobe shape alterations develop, which may be at the transition between childhood and adulthood. OCD emerges during this period in most patients [Pauls et al.,1995] when morphogenesis is highly active for both the frontal sinus and the frontal lobe [Paus et al.,2008; Ruf and Pancherz,1996; Toga et al.,2006]. The specific assessment of age‐related changes in the anatomy of the frontal region around adolescence could be useful to test such a notion.
The association between craniofacial and brain morphological alterations has also been proposed to estimate the chronology of developmental deviations in schizophrenia [Waddington et al.,1999]. In this psychiatric illness, cerebrocraniofacial dysmorphogenesis may occur earlier during the intrauterine life (late embryonic‐early fetal period). Craniofacial alterations implicate palatal and skull base morphology with more prominent narrowing and vertical elongation of the anterior midface, which may be associated with primary anomalies in the anterior (frontal‐temporal) aspects of the brain, the corpus callosum, septum pellucidum, and hippocampus. Nevertheless, it is not excluded that other cortical abnormalities might have a later genesis (particularly postpubertal), as indicated by evidence for accelerated loss of gray matter and aberrant connectivity particularly in prefrontal regions during the clinical onset of psychosis [Pantelis et al.,2005].
Our study was limited in that it was not a comprehensive assessment of brain shape alterations. Instead, we used a landmark‐based multivariate analysis focused on a single brain cross‐section to specifically test whether shape variations exist in the frontobasal brain region. Although this hypothesis‐driven approach was useful for the purposes of our study, most of the brain remained unexplored. We developed a movie display using pixel‐wise morphometry tools and LDA that indeed suggested that shape changes are not limited to the hypothesized alteration (i.e., deformation of the left lateral ventricle and the depth of the orbital sulci were also evident). Nevertheless, as presented, our pixel‐wise data‐driven approach does not allow formal statistical inference, but instead served to illustrate the findings obtained with the other methods. Further studies focusing on different reference planes or using the more complex three‐dimensional analyses are likely to meaningfully extend the characterization of brain shape alterations in OCD. The study may be also limited in that most of patients were on active treatment or treated previously. We cannot totally exclude the use of psychoactive drugs (mainly serotonin reuptake inhibitors) as a potential contributor to frontobasal shape variations. Future studies with specific control of treatment effects may be necessary to rule out this potential factor.
In conclusion, previous research has established that the frontobasal brain region in OCD patients is metabolically hyperactive, functionally hyperconnected, and anatomically anomalous showing a combination of both regional volume expansions and reductions [Harrison et al.,2009; Menzies et al.,2008a; Pujol et al.,2004; Rotge et al.,2009]. In our study we identified subtle shape alteration in this part of the brain that may reflect disturbances during late brain development at ages when young people are particularly vulnerable to developing psychiatric illness.
Supporting information
Additional Supporting Information may be found in the online version of this article.
Supporting Movie 1: The movie shows the morphological transformation that best discriminates OCD patients from control subjects in the Linear Discriminant Analysis. The graphic plots the frequency of subjects (vertical axis) showing a specific deformation coefficient (horizontal axis) from OCD patients (blue) to control subjects (red). The anterior commissure was a priori fixed in this analysis. Variations in the shape of frontobasal structures are best appreciated via a continuous loop of the movie sequence.
Supporting Information
REFERENCES
- Bastir M, Rosas A, O'higgins P ( 2006): Craniofacial levels and the morphological maturation of the human skull. J Anat 209: 637–654. [DOI] [PMC free article] [PubMed] [Google Scholar]
- Bossa M, Hernandez M, Olmos S ( 2007): Contributions to 3D diffeomorphic atlas estimation: Application to brain images. Med Image Comput Comput Assist Interv 10: 667–674. [DOI] [PubMed] [Google Scholar]
- Brown WA, Molleson TI, Chinn S ( 1984): Enlargement of the frontal sinus. Ann Hum Biol 11: 221–226. [DOI] [PubMed] [Google Scholar]
- Bruner E ( 2007): Cranial shape and size variation in human evolution: Structural and functional perspectives. Childs Nerv Syst 23: 1357–1365. [DOI] [PubMed] [Google Scholar]
- Cardoner N, Soriano‐Mas C, Pujol J, Alonso P, Harrison BJ, Deus J, Hernández‐Ribas R, Menchón JM, Vallejo J ( 2007): Brain structural correlates of depressive comorbidity in obsessive‐compulsive disorder. Neuroimage 38: 413–421. [DOI] [PubMed] [Google Scholar]
- Casey BJ, Tottenham N, Liston C, Durston S ( 2005): Imaging the developing brain: What have we learned about cognitive development? Trends Cogn Sci 9: 104–110. [DOI] [PubMed] [Google Scholar]
- Chamberlain SR, Menzies L, Hampshire A, Suckling J, Fineberg NA, del Campo N, et al. ( 2008): Orbitofrontal dysfunction in patients with obsessive‐compulsive disorder and their unaffected relatives. Science 321: 421–422. [DOI] [PubMed] [Google Scholar]
- Choi JS, Kim SH, Yoo SY, Kang DH, Kim CW, Lee JM, et al. ( 2007): Shape deformity of the corpus striatum in obsessive‐compulsive disorder. Psychiatry Res 155: 257–264. [DOI] [PubMed] [Google Scholar]
- Duda R, Hart P, Stork D ( 2000): Pattern Classification, 2nd ed. New York: Wiley‐Interscience. [Google Scholar]
- Evans DW, Lewis MD, Iobst E ( 2004): The role of the orbitofrontal cortex in normally developing compulsive‐like behaviors and obsessive‐compulsive disorder. Brain Cogn 55: 220–234. [DOI] [PubMed] [Google Scholar]
- Fatu C, Puisoru M, Rotaru M, Truta AM ( 2006): Morphometric evaluation of the frontal sinus in relation to age. Ann Anat 188: 275–280. [DOI] [PubMed] [Google Scholar]
- First MB, Spitzer RL, Gibbon M, Williams JBW ( 1997): Structured Clinical Interview for DSM‐IV Axis I Disorders—Clinician Version (SCID‐CV). Washington, DC: American Psychiatric Press. [Google Scholar]
- Free SL, O'Higgins P, Maudgil DD, Dryden IL, Lemieux L, Fish DR, Shorvon SD ( 2001): Landmark‐based morphometrics of the normal adult brain using MRI. Neuroimage 13: 801–813. [DOI] [PubMed] [Google Scholar]
- Geller D, Biederman J, Jones J, Park K, Schwartz S, Shapiro S, Coffey B ( 1998): Is juvenile obsessive‐compulsive disorder a developmental subtype of the disorder? A review of the pediatric literature. J Am Acad Child Adolesc Psychiatry 37: 420–427. [DOI] [PubMed] [Google Scholar]
- Gharaibeh WS, Rohlf FJ, Slice DE, DeLisi LE ( 2000): A geometric morphometric assessment of change in midline brain structural shape following a first episode of schizophrenia. Biol Psychiatry 48: 398–405. [DOI] [PubMed] [Google Scholar]
- Harrison BJ, Soriano‐Mas C, Pujol J, Ortiz H, López‐Solà M, Hernández‐Ribas R, et al. ( 2009): Altered cortico‐striatal functional connectivity in obsessive‐compulsive disorder. Arch Gen Psychiatry 66: 1189–1200. [DOI] [PubMed] [Google Scholar]
- Hernandez M, Bossa, Olmos S ( 2009): Registration of anatomical images using paths of diffeomorphisms parameterized with stationary vector field flows. Int J Comput Vis 85: 291–306. [Google Scholar]
- Herschkowitz N ( 2000): Neurological bases of behavioral development in infancy. Brain Dev 22: 411–416. [DOI] [PubMed] [Google Scholar]
- Hilgetag CC, Barbas H ( 2005): Developmental mechanics of the primate cerebral cortex. Anat Embryol 210: 411–417. [DOI] [PubMed] [Google Scholar]
- Hong SB, Shin YW, Kim SH, Yoo SY, Lee JM, Kim IY, et al. ( 2007): Hippocampal shape deformity analysis in obsessive‐compulsive disorder. Eur Arch Psychiatry Clin Neurosci 257: 185–190. [DOI] [PubMed] [Google Scholar]
- Kang DH, Kim SH, Kim CW, Choi JS, Jang JH, Jung MH, et al. ( 2008): Thalamus surface shape deformity in obsessive‐compulsive disorder and schizophrenia. Neuroreport 19: 609–613. [DOI] [PubMed] [Google Scholar]
- Kim JJ, Lee MC, Kim J, Kim IY, Kim SI, Han MH, et al. ( 2001): Grey matter abnormalities in obsessive‐compulsive disorder: Statistical parametric mapping of segmented magnetic resonance images. Br J Psychiatry 179: 330–334. [DOI] [PubMed] [Google Scholar]
- Marsh R, Maia TV, Peterson BS ( 2009): Functional disturbances within frontostriatal circuits across multiple childhood psychopathologies. Am J Psychiatry 166: 664–674. [DOI] [PMC free article] [PubMed] [Google Scholar]
- Mataix‐Cols D, Rauch SL, Manzo PA, Jenike MA, Baer L ( 1999): Use of factor‐analyzed symptom dimensions to predict outcome with serotonin reuptake inhibitors and placebo in the treatment of obsessive‐compulsive disorder. Am J Psychiatry 156: 1409–1416. [DOI] [PubMed] [Google Scholar]
- Menzies L, Achard S, Chamberlain SR, Fineberg N, Chen CH, del Campo N, et al. ( 2007): Neurocognitive endophenotypes of obsessive‐compulsive disorder. Brain 130: 3223–3236. [DOI] [PubMed] [Google Scholar]
- Menzies L, Chamberlain SR, Laird AR, Thelen SM, Sahakian BJ, Bullmore ET ( 2008a): Integrating evidence from neuroimaging and neuropsychological studies of obsessive‐compulsive disorder: The orbitofronto‐striatal model revisited. Neurosci Biobehav Rev 32: 525–549. [DOI] [PMC free article] [PubMed] [Google Scholar]
- Menzies L, Williams GB, Chamberlain SR, Ooi C, Fineberg N, Suckling J, et al. ( 2008b): White matter abnormalities in patients with obsessive‐compulsive disorder and their first‐degree relatives. Am J Psychiatry 165: 1308–1315. [DOI] [PubMed] [Google Scholar]
- O'Rahilly RR, Müller F ( 2006): The Embryonic Human Brain: An Atlas of Developmental Stages, 3rd ed. New York: John Wiley and Sons Ltd. [Google Scholar]
- Pantelis C, Yücel M, Wood SJ, Velakoulis D, Sun D, Berger G, et al. ( 2005): Structural brain imaging evidence for multiple pathological processes at different stages of brain development in schizophrenia. Schizophr Bull 31: 672–696. [DOI] [PubMed] [Google Scholar]
- Pauls DL, Alsobrook JP II, Goodman W, Rasmussen S, Leckman JF ( 1995): A family study of obsessive‐compulsive disorder. Am J Psychiatry 152: 76–84. [DOI] [PubMed] [Google Scholar]
- Paus T, Collins DL, Evans AC, Leonard G, Pike B, Zijdenbos A ( 2001): Maturation of white matter in the human brain: A review of magnetic resonance studies. Brain Res Bull 54: 255–266. [DOI] [PubMed] [Google Scholar]
- Paus T, Keshavan M, Giedd JN ( 2008): Why do many psychiatric disorders emerge during adolescence? Nat Rev Neurosci 9: 947–957. [DOI] [PMC free article] [PubMed] [Google Scholar]
- Pohunek P ( 2004): Development, structure and function of the upper airways. Paediatr Respir Rev 5: 2–8. [DOI] [PubMed] [Google Scholar]
- Pujol J, Soriano‐Mas C, Alonso P, Cardoner N, Menchón JM, Deus J, Vallejo J ( 2004): Mapping structural brain alterations in obsessive‐compulsive disorder. Arch Gen Psychiatry 61: 720–730. [DOI] [PubMed] [Google Scholar]
- Pujol J, Soriano‐Mas C, Ortiz H, Sebastián‐Gallés N, Losilla JM, Deus J ( 2006): Myelination of language‐related areas in the developing brain. Neurology 66: 339–343. [DOI] [PubMed] [Google Scholar]
- Pujol J, Torres L, Deus J, Cardoner N, Pifarré J, Capdevila A, Vallejo J ( 1999): Functional magnetic resonance imaging study of frontal lobe activation during word generation in obsessive‐compulsive disorder. Biol Psychiatry 45: 891–897. [DOI] [PubMed] [Google Scholar]
- Pujol J, Vendrell P, Junqué C, Martí‐Vilalta JL, Capdevila A ( 1993): When does human brain development end? Evidence of corpus callosum growth up to adulthood. Ann Neurol 34: 71–75. [DOI] [PubMed] [Google Scholar]
- Radua J, Mataix‐Cols D ( 2009): Voxel‐wise meta‐analysis of grey matter changes in obsessive‐compulsive disorder. Brit J Psychiatry 195: 393–402. [DOI] [PubMed] [Google Scholar]
- Rosenberg DR, Keshavan MS. A.E ( 1998): Bennett Research Award . Toward a neurodevelopmental model of obsessive‐compulsive disorder. Biol Psychiatry 43: 623–640. [DOI] [PubMed] [Google Scholar]
- Rotge JY, Guehl D, Dilharreguy B, Tignol J, Bioulac B, Allard M, et al. ( 2009): Meta‐analysis of brain volume changes in obsessive‐compulsive disorder. Biol Psychiatry 65: 75–83. [DOI] [PubMed] [Google Scholar]
- Ruf S, Pancherz H ( 1996): Development of the frontal sinus in relation to somatic and skeletal maturity. A cephalometric roentgenographic study at puberty. Eur J Orthod 18: 491–497. [DOI] [PubMed] [Google Scholar]
- Scuderi AJ, Harnsberger HR, Boyer RS ( 1993): Pneumatization of the paranasal sinuses: Normal features of importance to the accurate interpretation of CT scans and MR images. AJR Am J Roentgenol 160: 1101–1104. [DOI] [PubMed] [Google Scholar]
- Shah RK, Dhingra JK, Carter BL, Rebeiz EE ( 2003): Paranasal sinus development: A radiographic study. Laryngoscope 113: 205–209. [DOI] [PubMed] [Google Scholar]
- Soriano‐Mas C, Pujol J, Alonso P, Cardoner N, Menchón JM, Harrison BJ, et al. ( 2007): Identifying patients with obsessive‐compulsive disorder using whole‐brain anatomy. Neuroimage 35: 1028–1037. [DOI] [PubMed] [Google Scholar]
- Spaeth J, Krügelstein U, Schlöndorff G ( 1997): The paranasal sinuses in CT‐imaging: Development from birth to age 25. Int J Pediatr Otorhinolaryngol 39: 25–40. [DOI] [PubMed] [Google Scholar]
- Stein DJ ( 2000): Neurobiology of the obsessive‐compulsive spectrum disorders. Biol Psychiatry 47: 296–304. [DOI] [PubMed] [Google Scholar]
- Stewart SE, Geller DA, Jenike M, Pauls D, Shaw D, Mullin B, Faraone SV ( 2004): Long‐term outcome of pediatric obsessive‐compulsive disorder: A meta‐analysis and qualitative review of the literature. Acta Psychiatr Scand 110: 4–13. [DOI] [PubMed] [Google Scholar]
- Szeszko PR, Ardekani BA, Ashtari M, Malhotra AK, Robinson DG, Bilder RM, Lim KO ( 2005): White matter abnormalities in obsessive‐compulsive disorder: A diffusion tensor imaging study. Arch Gen Psychiatry 62: 782–790. [DOI] [PubMed] [Google Scholar]
- Talairach J, Ajuriaguerra JD, David M ( 1952): Etudes stéréotaxiques des structures encéphaliques profondes chez l' homme. Technique du intéret physiologique et thérapeutique. Presse Méd 28: 605–609. [PubMed] [Google Scholar]
- Talairach J, Tournoux P ( 1988): Co‐Planar Stereotaxic Atlas of the Human Brain. New York: Theime Medical Publishers. [Google Scholar]
- Toga AW, Thompson PM, Sowell ER ( 2006): Mapping brain maturation. Trends Neurosci 29: 148–159. [DOI] [PMC free article] [PubMed] [Google Scholar]
- Valleni‐Basile LA, Garrison CZ, Waller JL, Addy CL, McKeown RE, Jackson KL, Cuffe SP ( 1996): Incidence of obsessive‐compulsive disorder in a community sample of young adolescents. J Am Acad Child Adolesc Psychiatry 35: 898–906. [DOI] [PubMed] [Google Scholar]
- Van Essen DC ( 1997): A tension‐based theory of morphogenesis and compact wiring in the central nervous system. Nature 385: 313–318. [DOI] [PubMed] [Google Scholar]
- Waddington JL, Lane A, Larkin C, O'Callaghan E ( 1999): The neurodevelopmental basis of schizophrenia: Clinical clues from cerebro‐craniofacial dysmorphogenesis, and the roots of a lifetime trajectory of disease. Biol Psychiatry 46: 31–39. [DOI] [PubMed] [Google Scholar]
- Weiglein A, Anderhuber W, Wolf G ( 1992): Radiologic anatomy of the paranasal sinuses in the child. Surg Radiol Anat 14: 335–339. [DOI] [PubMed] [Google Scholar]
- Yakovlev PI, Lecours AR ( 1967): The myelogenetic cycles of regional maturation of the brain In: Minkowski A, editor. Regional Development of the Brain in Early Life. Oxford: Blackwell Scientific; pp 3–70. [Google Scholar]
- Yücel M, Harrison BJ, Wood SJ, Fornito A, Wellard RM, Pujol J, et al ( 2007): Functional and biochemical alterations of the medial frontal cortex in obsessive‐compulsive disorder. Arch Gen Psychiatry 64: 946–955. [DOI] [PubMed] [Google Scholar]
Associated Data
This section collects any data citations, data availability statements, or supplementary materials included in this article.
Supplementary Materials
Additional Supporting Information may be found in the online version of this article.
Supporting Movie 1: The movie shows the morphological transformation that best discriminates OCD patients from control subjects in the Linear Discriminant Analysis. The graphic plots the frequency of subjects (vertical axis) showing a specific deformation coefficient (horizontal axis) from OCD patients (blue) to control subjects (red). The anterior commissure was a priori fixed in this analysis. Variations in the shape of frontobasal structures are best appreciated via a continuous loop of the movie sequence.
Supporting Information