

Abstract
Objectives: To investigate the function–structure relationship of white matter within different stages of Huntington's disease (HD) using diffusion tensor imaging (DTI). Experimental design: From the TRACK‐HD study, an early stage HD group and a premanifest gene carrier group (PMGC) were age‐matched to two healthy control groups; all underwent 3‐T MRI scanning of the brain. Region of interest (ROI) segmentation of the corpus callosum, caudate nucleus, thalamus, prefrontal cortex, and sensorimotor cortex was applied, and the apparent fiber pathways of these regions were analyzed. Functional measures of motor, oculomotor, cognition, and behavior were correlated to DTI measures. Principle observations: In PMGC versus controls, higher apparent diffusion coefficient (ADC) was seen in white matter pathways of the sensorimotor cortex (P < 0.01) and in the ROI of corpus callosum (P < 0.017). In early HD, fiber tract analysis showed higher ADC in pathways of the corpus callosum, thalamus, sensorimotor, and prefrontal region (P < 0.01). ROI analysis showed higher diffusivity in the corpus callosum and caudate nucleus (P < 0.017). Motor, oculomotor, cognition, and probability of onset within 2 and 5 years, correlated well with ADC measures of the corpus callosum (P < 0.01 – P < 0.005), sensorimotor (P < 0.01 – P < 0.005), and prefrontal region (P < 0.01). Conclusions: Disturbances in the white matter connections of the sensorimotor cortex can be demonstrated not only in manifest HD but also in premanifest gene carriers. Connectivity measures are well related to clinical functioning. DTI measures can be regarded as a potential biomarker for HD, due to their ability to objectify changes in brain structures and their role within brain networks. Hum Brain Mapp, 2012. © 2011 Wiley Periodicals, Inc.
Keywords: Huntington's disease, white matter, diffusion tensor imaging, sensorimotor, cortex, apparent diffusion coefficient, premanifest, motor, behavior, cognitive, MRI
INTRODUCTION
Huntington's disease (HD) is a neurodegenerative genetic disorder characterized by a progressive deterioration of motor control, cognitive functioning, and mood and behavioral functioning. The presence of an abnormal expansion of CAG repeats in the HTT gene, on chromosome 4 is responsible for the disease. The effect of the HD gene is seen in the brain as progressive cerebral atrophy of the basal ganglia and cortex [Aylward et al.,1997; Roos et al.,1986; Rosas et al.,2002; Tabrizi et al.,2009]. It has been shown that the onset of atrophy may already be present in gene carriers up to 10 years before disease manifestation [Paulsen et al.,2008; Tabrizi et al.,2009]. On the contrary, less is known about white matter changes in HD. Some reports demonstrate global atrophy of the white matter in manifest HD [Beglinger et al.,2005; Fennema‐Notestine et al.,2004], whereas others show regional differences only [Aylward et al.,1998; Jech et al.,2007]. A global volume reduction of white matter was seen only in one study of premanifest gene carriers [Paulsen et al.,2006]. The specific impact of HD on specific white matter pathways, and the clinical relevance of these changes, remains unclear.
The development and clinical application of magnetic resonance diffusion tensor imaging (DTI) has increased knowledge of grey and white matter structure in a variety of neurodegenerative diseases [Nucifora et al.,2007]. In patients with HD, a few studies have applied DTI to characterize changes in the macrostructure and microstructure of the basal ganglia. Lower fractional anisotropy (FA) values were found for premanifest gene carriers in the putamen, caudate nucleus [Reading et al.,2005], and thalamus [Magnotta et al.,2009]. On the contrary, Rosas et al. [2006] found higher FA in the putamen and pallidum [Rosas et al.,2006]. In healthy subjects, FA values of grey matter structures are generally below 0.15. In white matter, values tend to be much higher ranging from 0.2 up to 1 [Mori and van Zijl,2002]. In general, the higher the FA value the more directional the organization of the tissue is regarded to be—as seen in white matter fiber tracts. For this reason, FA is generally accepted as an indication of tissue integrity.
In white matter, lower FA and increased apparent diffusion coefficient (ADC) values have been found in the internal capsule and corpus callosum in premanifest and manifest HD compared with healthy control subjects [Magnotta et al.,2009; Rosas et al.,2006]. In several of neurodegenerative disorders, such as Alzheimer's and Parkinson's disease, ADC values have been found to higher, indicating that degeneration negatively affects the brain tissue structure [Rizzo et al.,2008; Stebbins and Murphy,2009; Zhang et al.,2009]. Higher ADC values indicate that the microstructure of the tissue allows a faster movement of water molecules. These higher values were also found in manifest HD [Douaud et al.,2009; Mascalchi et al.,2004; Sritharan et al.,2009; Vandenberghe et al.,2009]. To find white matter differences that are related to the earliest changes in HD, specific white matter fiber tracts that are related to HD symptomatology should preferably be investigated. A reduction in cognitive, motor, oculomotor performance is present up to a decade before clinical manifestation of HD [Lasker and Zee,1997; Paulsen et al.,2008; Stout et al.,2007], therefore, it can be hypothesized that the fibers associated with these function may also be affected in the premanifest phase. The direct nature of this relationship is unknown, and therefore, the aim of this study is, first, to investigate early FA and ADC changes in white matter fiber bundles running to and from brain areas known to be affected by HD (e.g., caudate nucleus) or those related to the clinical characteristics of HD (e.g., sensorimotor cortex or prefrontal cortex). Second, to investigate to which extent changes in brain tissue structure and integrity in white matter fibers are related to clinical functioning.
METHOD
Participants
As part of the Track‐HD study 90 participants were included at the Leiden University Medical Centre study site [for details see Tabrizi et al.,2009]. Diffusion tensor magnetic resonance imaging was added to the standard MRI protocol. DTI was not performed because of claustrophobia in 10 participants, and another nine were excluded from analysis due to movement artifacts. Of the remaining 71 subjects, 16 subjects had early HD, 27 were premanifest gene carriers, and 28 were healthy control subjects. Inclusion criteria for premanifest HD gene carriers were a CAG repeat ≥40 with a total motor score on the unified HD rating scale 1999 (UHDRS) ≤5. Inclusion criteria for the early manifest HD patients were a CAG repeat ≥40, with a UHDRS motor score ≥5, and a total functional capacity (TFC) score ≥7. Healthy gene negative family members or partners were recruited as control subjects. Because the early HD group is inherently older than the premanifest group, the control group was split into two separate groups of each 14 subjects to achieve age‐matching. The younger healthy control subjects were age matched to the premanifest gene carriers (control group A). The older healthy controls subjects were age‐matched to the manifest group (control group B). None of the participants suffered from a neurological disorder, a major psychiatric diagnosis, or had a history of severe head injury. The study was approved by the Medical Ethical Committee of the Leiden University Medical Centre. All participants gave informed consent.
DTI Acquisition
MRI acquisition was performed on a 3‐Tesla whole body scanner (Philips Achieva, Healthcare, Best, The Netherlands) with an eight channel SENSE head coil. T1‐weighted image volumes were acquired using a 3D MPRAGE acquisition sequence with the following imaging parameters: TR = 7.7 ms, TE = 3.5 ms, FOV = 24 cm, matrix size 224 × 224, number of slices = 164, slice thickness = 1.00 mm, slice gap = 0. A volumetric T2‐weighted image (VISTA) was acquired with the same parameters for field of view, acquisition matrix, and slice thickness as the T1‐weighted images, with TE = 250 ms and TR = 2,500 ms. A single‐shot echo‐planar DTI sequence was applied with 32 measurement directions and the following scan parameters: TR = 10,004 ms, TE = 56 ms, FOV = 220 × 220 × 128 with an acquisition matrix of 112 × 110, 2.00 mm slice thickness, transversal slice orientation, slice gap = 0, flip angle = 90°, single reconstruction voxel dimensions were 1.96 × 1.96 × 2.00 mm, number of slices = 64, B factor = 1,000, halfscan factor = 0.61. Parallel imaging (SENSE) was used with a reduction factor of 2, NSA = 1 and fat suppression was applied. DTI acquisition time was 6.55 min.
Regions of Interest Segmentation
A priori, the caudate nuclei, thalami, and the corpus callosum were determined as regions of interest (ROI). A semiautomatic segmentation and analysis procedure was used as part of the software program FibreTrak (release 2.5.3, Philips Medical Systems, Best, The Netherlands). The caudate nucleus and thalamus were segmented separately on each side but considered as one ROI during data analysis. On the DTI scans, special caution was taken to prevent inclusion of any nongrey matter voxels, as both the caudate nucleus and thalamus are laterally bordered by the internal capsule. All analyses and segmentations were performed blinded to group status. For more detailed information on segmentations see the Supporting Information.
Fiber Tract Analysis
Fiber analysis of fibers running through the following five structures was performed: the corpus callosum (Fig. 1A), sensorimotor cortex (Fig. 1B), caudate nucleus (Fig. 1C), superior prefrontal cortex (Fig. 1D), and thalamus (Fig. 1E). To analyze fibers running through the corpus callosum, caudate nucleus, and thalamus, the previously segmented ROIs were used. Additional segmentations for ROIs of the superior prefrontal cortex and sensorimotor cortex were performed. The superior prefrontal region was segmented on the basis of Brodmann areas 9 and 10. The sensorimotor cortex on Brodmann areas 1, 2, 3, and 4 [Reading et al.,2005]. To calculate the average ADC and FA of the five white matter pathways FibreTrak was used (release 2.5.3, Philips Medical Systems, Best, The Netherlands). The software applies fiber assignment by continuous tracking [Mori et al.,1999]. The following standard parameters were implemented: minimum FA value 0.10, maximum angle change 27°, minimum fiber length 10 mm. For more detailed information on the application of the fiber tracking software see the Supporting Information.
Figure 1.
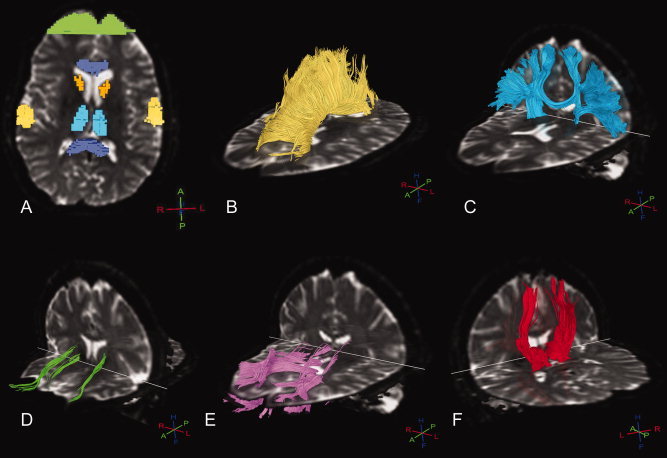
Typical example of ROIs (A) and subsequent white matter fiber pathways in a premanifest gene carrier of the corpus callosum (B), sensorimotor cortex (C), caudate nucleus (D), prefrontal cortex (E), and thalamus (F). 3D crosses depict orientation, whereby H = head, F = feet, A = anterior, P = posterior, R = right, L = left.
Clinical Assessments
From the extensive assessment battery in the TRACK‐HD study, specific tasks were chosen that gave a representation of functioning in each symptom domain. Furthermore, these were tasks that had been proved to provide sensitive outcome measures for group comparisons, even in the premanifest stages [Tabrizi et al.,2009]: index finger speeded tapping and sustained tongue force measures (motor), antisaccade latency and error rate (oculomotor), symbol digit modalities test, the Stroop word reading test, trail making task part B, and a visual working memory task—the spot the change task (cognition); Beck's depression inventory second version (BDI‐II), and the frontal systems behavior inventory, which yields three subscores of disinhibition, executive functioning, and apathy (psychiatry). CAG repeat length and probability of onset within 5 years and Burden of pathology [(CAG – 35.5) × age; Penney et al.,1997] were also added to the analysis. For the complete set of clinical assessments and variables see Tabrizi et al. [2009].
Statistics
Statistical analyses were performed with the Statistical Package for Social Sciences (SPSS for Windows; version 17.0.2, SPSS, Chicago, IL). Distributions and assumptions were checked. independent student's t‐tests and Chi‐square tests were applied where appropriate in the analysis of group differences based on descriptive data; age, CAG, Dutch adult reading test (IQ), TFC, and UHDRS. To test for differences in FA and ADC in the three ROIs and the five white matter fiber bundles between premanifest or manifest gene carriers and their corresponding control groups, analyses were performed using independent student's t‐tests. Correction for multiple comparisons was applied to each analysis. Each analysis of ADC in the basal ganglia ROIs, the FA in the basal ganglia ROIs, the FA of the fiber pathways, and the ADC of the fiber pathways was regarded as a separate analyses. Therefore, a Bonferroni correction was applied to each analysis. For the ADC and FA ROI analysis this lead to 0.05/3 = 0.017, and for the ADC and FA fiber pathways analysis this lead this to 0.05/5 = 0.01. The number of voxels in each seed ROI was compared between groups. Partial Pearson correlations analysis was performed to explore and test for possible associations between measures of white matter fiber pathway integrity and clinical measures. Age and gender were added into this analysis as covariates. The number of voxels in a ROI were also correlated to the clinical variables to examine the possibility that grey matter volume explains any possible correlations. The ADC and FA values of the white matter fiber pathways were correlated to each other to examine other explanations for possible results.
RESULTS
Premanifest
No differences in age, gender, IQ, TFC, and UHDRS motor score between the premanifest gene carriers and their controls were present (Table I).
Table I.
Group demographics, ADC and FA values, and number of seed voxels per region of interest for the premanifest gene carriers and their controls
| Control group A n: 14, male: 7 | Premanifest gene carriers n: 27, male: 16 | |||||
|---|---|---|---|---|---|---|
| Mean | SD | Range | Mean | SD | Range | |
| Age (yrs) | 46 | 7.5 | 35–58 | 43 | 8.3 | 26–61 |
| CAG | – | – | – | 43 | 2.5 | 39–50 |
| IQ | 105.6 | 11.3 | 88–130 | 101.3 | 11.3 | 76–118 |
| TFC | 13 | 0 | 13–13 | 12.6 | 0.8 | 10–13 |
| UHDRS | 1.9 | 1.8 | 0–6 | 2.4 | 1.4 | 0–4 |
| Mean ± SD | Mean ± SD | p | |||
|---|---|---|---|---|---|
| ADC ROI | |||||
| Corpus Callosum | 1884 ± 378 | 0.78 ± 0.028 | 1767 ± 319 | 0.81 ± 0.033 * | 0.014 |
| Caudate Nucleus | 58 ± 13 | 0.73 ± 0.071 | 47 ± 11 *** | 0.76 ± 0.053 | 0.160 |
| Thalamus | 2700 ± 843 | 0.73 ±0.023 | 2601 ± 657 | 0.73 ± 0.023 | 0.994 |
| FA ROI | |||||
| Corpus Callosum | 1884 ± 378 | 0.76 ± 0.019 | 1767 ± 319 | 0.75 ± 0.021 | 0.461 |
| Caudate Nucleus | 58 ± 13 | 0.17 ± 0.015 | 47 ± 11 *** | 0.18 ± 0.023 | 0.058 |
| Thalamus | 2700 ± 843 | 0.34 ± 0.025 | 2601 ± 657 | 0.33 ± 0.022 | 0.368 |
| # voxels ± SD | mean ± SD | # voxels ± SD | mean ± SD | ||
| ADC Fiber pathway | |||||
| Corpus Callosum | 1884 ± 378 | 0.89 ± 0.049 | 1767 ± 319 | 0.91 ± 0.054 | 0.206 |
| Caudate Nucleus | 58 ± 13 | 0.98 ± 0.116 | 47 ± 11 *** | 0.94 ± 0.075 | 0.166 |
| Thalamus | 2700 ± 843 | 0.87 ± 0.055 | 2601 ± 657 | 0.89 ± 0.071 | 0.476 |
| Motor cortex | 595 ± 86 | 0.78 ± 0.017 | 580 ± 71 | 0.80 ± 0.029 ** | 0.009 |
| Prefrontal cortex | 1136 ± 183 | 0.88 ± 0.044 | 1117 ± 322 | 0.89 ± 0.037 | 0.631 |
| FA Fiber pathway | |||||
| Corpus Callosum | 1884 ± 378 | 0.49 ± 0.015 | 1767 ± 319 | 0.49 ± 0.016 | 0.785 |
| Caudate Nucleus | 58 ± 13 | 0.36 ± 0.017 | 47 ± 11 *** | 0.35 ± 0.031 | 0.683 |
| Thalamus | 2700 ± 843 | 0.42 ± 0.018 | 2601 ± 657 | 0.41 ± 0.021 | 0.515 |
| Motor cortex | 595 ± 86 | 0.40 ± 0.017 | 580 ± 71 | 0.39 ± 0.020 | 0.190 |
| Prefrontal cortex | 1136 ± 183 | 0.41 ± 0.018 | 1117 ± 322 | 0.40 ± 0.021 | 0.120 |
SD: standard deviation, CAG: CAG repeat length, IQ: estimate of premorbid intelligence quotient. TFC: Total Functional Capacity score.
UHDRS, Unified Huntington's disease rating scale total motor score; ROI, Region of interest analysis; ADC, apparent diffusion coefficient in μm2/ms; FA, fractional anisotropy (no unit); Fiber pathway, fiber pathways analysis between the listed region and the rest of the brain.
P < 0.017,
P < 0.01 (adjusted for multiple comparisons). # voxels: mean number of voxels in the listed seed region.
Number of voxels differs significantly from healthy controls.
The ADC and FA values of the ROIs and fiber pathways are shown in Table I. Premanifest gene carriers showed increased ADC values in the corpus callosum compared with controls. A significant increase in ADC of the white matter fibers of the sensorimotor cortex was also found between premanifest gene carriers and controls. No differences in ADC were found in the regions of the caudate nucleus and thalamus. No difference in FA was found in any of the three regions between the two groups. Also, no FA or ADC differences were found in any of the fiber pathways between the two groups. The number of voxels in the caudate nucleus ROI of premanifest group is significantly lower than the number in the control group ROI.
Early HD
The demographic data of the early HD and control group B showed no differences in age, gender, or IQ. TFC and UHDRS differed significantly (Table II).
Table II.
Group demographics, ADC and FA values, and number of seed voxels per region of interest for the early HD patients and their controls
| Control group B n: 14, male: 7 | Early HD n: 16, male: 12 | |||||
|---|---|---|---|---|---|---|
| Mean | SD | Range | Mean | SD | Range | |
| Age (yrs) | 51.4 | 7.9 | 42–65 | 48.2 | 10 | 31–63 |
| CAG | – | – | – | 43 | 1.6 | 41–46 |
| IQ | 102.6 | 6.6 | 88–115 | 99.6 | 12 | 72–118 |
| TFC | 12.9 | 0.3 | 12–13 | 10.6 § | 2 | 7–13 |
| UHDRS | 3.1 | 2.8 | 0–7 | 18.3 § | 10.4 | 6–45 |
| mean ± SD | mean ± SD | p | |||
|---|---|---|---|---|---|
| ADC ROI | |||||
| Corpus Callosum | 1934 ± 312 | 0.80 ± 0.031 | 1445 ± 371 *** | 0.85 ± 0.040 * | 0.000 |
| Caudate Nucleus | 57 ± 12 | 0.74 ± 0.048 | 40 ± 7 *** | 0.83 ± 0.069 * | 0.001 |
| Thalamus | 2480 ± 531 | 0.74 ± 0.032 | 3102 ± 1062 | 0.74 ± 0.034 | 0.863 |
| FA ROI | |||||
| Corpus Callosum | 1934 ± 312 | 0.75 ± 0.012 | 1445 ± 371 *** | 0.73 ± 0.033 | 0.046 |
| Caudate Nucleus | 57 ± 12 | 0.17 ± 0.018 | 40 ± 7 *** | 0.19 ± 0.019 | 0.072 |
| Thalamus | 2480 ± 531 | 0.33 ± 0.021 | 3102 ± 1062 | 0.32 ± 0.034 | 0.950 |
| # voxels ± SD | mean ± SD | # voxels ± SD | mean ± SD | ||
| ADC Fiber pathway | |||||
| Corpus Callosum | 1934 ± 312 | 0.89 ± 0.051 | 1445 ± 371 *** | 0.95 ± 0.067 ** | 0.008 |
| Caudate Nucleus | 57 ± 12 | 0.88 ± 0.107 | 40 ± 7 *** | 0.97 ± 0.079 | 0.023 |
| Thalamus | 2480 ± 531 | 0.85 ± 0.080 | 3102 ± 1062 | 0.93 ± 0.063 ** | 0.007 |
| Motor cortex | 589 ± 117 | 0.79 ± 0.023 | 593 ± 110 | 0.82 ± 0.027 ** | 0.001 |
| Prefrontal cortex | 1118 ± 239 | 0.88 ± 0.023 | 1202 ± 274 | 0.95 ± 0.056 ** | 0.000 |
| FA Fiber pathway | |||||
| Corpus Callosum | 1934 ± 312 | 0.48 ± 0.013 | 1445 ± 371 *** | 0.47 ± 0.017 | 0.027 |
| Caudate Nucleus | 57 ± 12 | 0.35 ± 0.027 | 40 ± 7 *** | 0.35 ± 0.021 | 0.592 |
| Thalamus | 2480 ± 531 | 0.41 ± 0.016 | 3102 ± 1062 | 0.41 ± 0.024 | 0.644 |
| Motor cortex | 589 ± 117 | 0.38 ± 0.019 | 593 ± 110 | 0.37 ± 0.024 | 0.059 |
| Prefrontal cortex | 1118 ± 239 | 0.39 ± 0.016 | 1202 ± 274 | 0.38 ± 0.014 ** | 0.006 |
SD, standard deviation; CAG, CAG repeat length; IQ, estimate of premorbid intelligence quotient; TFC, total functional capacity score.
UHDRS, Unified Huntington's disease rating scale total motor score.
Significant difference from control group, P < 0.01. ROI, region of interest analysis; ADC, apparent diffusion coefficient in μm2/ms; FA, fractional anisotropy (no unit); Fiber pathway, fiber pathways analysis between the listed region and the rest of the brain.
P <0.017,
P < 0.01 (adjusted for multiple comparisons). # voxels: mean number of voxels in the listed seed region.
Number of voxels differs significantly from healthy controls.
In the corpus callosum and the caudate nucleus, the ADC values were larger in early HD when compared with controls. Between the two groups, no difference in FA was found in any of the ROIs. ADC values were significantly increased in fibers from all regions, except for the caudate nucleus fibers. FA was decreased in fibers running to and from the prefrontal cortex in early HD patients. No difference in FA was found in fibers passing through the corpus callosum, caudate nucleus, thalamus, and sensorimotor cortex. The number of voxels of the caudate nucleus as well as in the corpus callosum was significantly lower in the patient group than in the control group (Table II).
Clinical Correlations
The correlation analysis between the ADC of the fiber bundles with genetics, probability of onset within 5 years, burden of pathology, motor, oculomotor, cognition, and behavior in all participants are shown in Table III.
Table III.
Standardized correlation coefficients matrix for ADC of white matter fiber bundles and clinical measures in all participants
| Motor | Cognitive | Behavior | ||||||||
|---|---|---|---|---|---|---|---|---|---|---|
| Tapping | Tongue | SDMT | SWR | TMT B | SPOT | BDI‐II | FrSBe Disinhib | FrSBe Exec dysf | FrSBe apathy | |
| Corpus Callosum | 0.38 ** | 0.27 | −0.32 * | −0.39 ** | 0.36 ** | −0.39 ** | 0.11 | 0.01 | 0.09 | 0.10 |
| Caudate Nucleus | 0.13 | 0.23 | −0.08 | −0.04 | 0.13 | −0.19 | −0.05 | 0.05 | −0.02 | −0.01 |
| Thalamus | 0.41 ** | 0.33 * | −0.27 | −0.28 | 0.26 | −0.30 | 0.02 | 0.03 | 0.09 | 0.07 |
| Motor cortex | 0.46 ** | 0.32 * | −0.46 ** | −0.52 ** | 0.55 ** | −0.33 * | 0.15 | −0.02 | 0.11 | 0.17 |
| Prefrontal cortex | 0.33 * | 0.28 | −0.28 | −0.34 * | 0.25 | −0.28 | 0.15 | −0.02 | −0.06 | 0.04 |
| Genetics | Probability of onset | Burden of Pathology | Oculomotor | ||
|---|---|---|---|---|---|
| CAG Gene carriers only | Within 5 years (preHD only) | (CAG‐35.5) × age | Latency of antisaccades | Error % of antiscaccades | |
| Corpus Callosum | 0.36 | 0.61 ** | 0.51 ** | −0.32 * | −0.39 ** |
| Caudate Nucleus | 0.09 | 0.42 | 0.27 | −0.08 | −0.04 |
| Thalamus | 0.10 | 0.06 | 0.19 | −0.27 | −0.28 |
| Motor cortex | 0.32 | 0.58 ** | 0.52 ** | −0.46 ** | −0.52 ** |
| Prefrontal cortex | 0.09 | 0.41 * | 0.37 | −0.28 | −0.34 * |
Tapping, Average speeded tapping intertap variability for left and right index finger; Tongue, sustained tongue force measure; SDMT, Symbol Digit Modalities test; SWR, Stroop word reading task; TMT B, Trail making test part B; SPOT, Visual array comparison task for visual short‐term memory capacity; BDI‐II, Becks Depression Inventory 2nd version; FrSBe = Frontal Systems Behaviour rating scale Self Report; disinhibtion, executive dysfunction and apathy subscores; CAG, CAG repeat length (in gene carriers only); Expected years to onset correlation is only for premanifest gene carriers. All correlations are controlled for the effects of age and gender.
P < 0.01,
P < 0.005
Tapping was moderately associated with the diffusivity (ADC) of bundles through the corpus callosum, thalamus, sensorimotor cortex, and prefrontal cortex. For the tongue force, similar but weaker associations were found. Latency of antisaccades and the percentage of antisaccade errors in the oculomotor task were found to correlate with increased diffusivity of the corpus callosum, sensorimotor cortex, and prefrontal cortex fibers. All cognitive measures were moderately to strongly associated with the ADC of fibers through the corpus callosum, sensorimotor cortex, and to a lesser extent the prefrontal cortex. In premanifest gene carriers, probability of expected onset within 5 years and burden of pathology showed a high positive correlation with the diffusivity of the corpus callosum fibers and with those of the sensorimotor cortex, whereby a loss of integrity related to a higher probability of onset within 5 years and higher burden of pathology. No association in any cognitive domain with fibers of the thalamus was found. CAG repeat length and behavioral measures did not show association with the ADC of any of the fiber bundles studied. No measures showed association with the fibers of the caudate nucleus. FA of the corpus callosum and sensorimotor cortex fibers negatively correlated with the latency (r = −0.52, P < 0.001) and percentage of errors (r = −0.38, P = 0.001) in the anti‐saccade oculomotor task. FA did not demonstrate any significant correlation with genetics, motor, cognition, and behavior.
The results from a correlational analysis between number of voxels in a seed region and clinical variables showed five significant moderate correlations. Only one of these also showed a significant correlation in the analysis of ADC values with clinical variables. This was the correlation between the caudate nucleus and TMT task performance (r = −0.36, P < 0.01). Directly correlating the ADC and FA values of the white matter pathways with each other revealed a number of significant correlations is shown in Table IV in the Supporting Information. The direct correlation of ADC and FA of the same fiber bundle shows that the ADC and FA of the sensorimotor cortex and prefrontal white matter pathways are correlated.
DISCUSSION
The main finding of this study is that in premanifest gene carriers, the white matter pathway of the sensorimotor cortex is impaired. Furthermore, our data show that in the early manifest phase of the disease impairment is more widespread and present in the white matter pathways of the sensorimotor cortex, corpus callosum, thalamus, and prefrontal cortex. Finally, a relationship is seen between the changes in white matter pathways and functionality in the domains of motor, oculomotor, and cognition. Moreover, this study confirms findings of regional differences in the corpus callosum of premanifest and the caudate nuclei and corpus callosum of early HD [Rosas et al.,2006,2009].
In the premanifest phase of the disease, our study demonstrated a reduction of integrity of only the sensorimotor cortex fibers pathway, therefore, this suggests that this pathway may be one of the first to be affected by HD. This is supported by the positive relationship between a higher probability of onset within 5 years, and a higher burden of pathology, with the loss of integrity of the sensorimotor cortex fibers. This premanifest cohort is ‘free’ of motor symptoms, and therefore these finding in a truly ‘premotor’ premanifest group further supports the idea that these white matter changes are among the first to occur. This study is the first to demonstrate this change across the whole pathway; however, other studies examining this area do provide support for this finding. The findings of the voxel‐by‐voxel white matter analysis of Reading et al. [2005] found differences in a cluster of voxels coinciding with the primary motor cortex (Brodmann area 4). Atrophy of the sensorimotor cortex was demonstrated as the only cortical region to be affected in premanifest gene carriers far from predicted onset [Tabrizi et al.,2009]. Furthermore, differences have been reported in functions that utilize this area in premanifest gene carriers, such as measures of motor function [Paulsen et al.,2008; Solomon et al.,2008]. The other important finding of our study in premanifest gene carriers is the differences in diffusivity in the corpus callosum, thereby replicating previous findings by Rosas et al. [2006,2009]. However, we add that these differences are not seen in the white matter projections specifically going to and from the corpus callosum. Therefore, when looking beyond the main structure it can be suggested that the loss of integrity of the main structure is apparent but not spread over its entire network, as is the case in manifest HD.
In the early manifest phase of HD, our data show that the diffusivity of the fiber pathways of the thalamus, corpus callosum, sensorimotor, and prefrontal cortex was higher in HD than in healthy controls. This suggests a disintegration of these structures. Of the five white matter pathways examined in HD all were found to be affected except the pathways of the caudate nuclei. The absence of affected white matter from the caudate nucleus should be interpreted with some caution. It may suggest that the magnitude of integrity loss may not be the same for a structure as for its fibers at a given stage of the disease. However, the variance of these measurements is larger than that of the other fibers pathways. The remaining results, such as that of reduced integrity of the prefrontal cortex fibers, find support in the regional differences demonstrated by Rosas et al. [2006]. Our results show changes in ADC and almost no changes in FA. This suggests that of these two closely related measures, ADC is more sensitive in demonstrating changes across large pathways in HD. The results of the regional analysis showed higher diffusivity in the caudate nucleus and corpus callosum in HD than in healthy controls. This was not the case in the thalamus, whereby similar diffusion properties were seen in both HD and controls. Our findings concur with previous cross‐sectional and longitudinal findings of a widespread effect of HD on white matter [Douaud et al.,2009; Rosas et al.,2006; Vandenberghe et al,2009; Weaver et al,2009]. The finding that a region was not affected, but its fibers were affected, demonstrates the need to embrace the full potential of DTI measures for HD, as this shows that despite a structure not showing integrity differences, the fibers that are needed for this structure to communicate with the brain may well be affected. In the case of the thalamus, this is especially relevant to the clinical expression of the disease as this structure is vital to a large number of functional processes.
The previously discussed outcomes demonstrate that almost all fiber pathways that we examined are affected in early manifest HD and that one specific pathway is also affected in premanifest gene carriers. In exploring the clinical implications of these findings, we see strong relationships between both motor, oculomotor and cognitive measures, and diffusivity measures of the pathways of the corpus callosum, thalamus, sensorimotor, and prefrontal cortex. Although one cognitive measure does correlate to the prefrontal cortex fiber the cognitive measures are most strongly related to the sensorimotor cortex fibers. This finding can be explained with two complementary hypotheses. First, as seen in the premanifest group, the fibers of the sensorimotor cortex are the first to show decreased integrity. This suggests that these are the most severely effected fibers in the earliest (premanifest) stages of HD; therefore, it is not surprising that the clinical measures of decline relate to these fibers. Second, HD effects both cognition and motor function, and all cognitive tests require a motor response. A consequent finding in cognitive HD literature is that cognitive tests sensitive to psychomotor speed are the most sensitive tasks. A great deal of voluntary motor functioning is initiated in the sensorimotor cortex. Because of this we were not entirely surprised that cognitive tests relate strongly to the fibers of the sensorimotor cortex. The tasks chosen for analysis were those that provide meaningful outcomes for all study groups and did not show ceiling or floor effects. Therefore, we can conclude that fibers associated with higher order cognitive and motor coordination are affected in a manner that is congruent to clinical manifestations and that for this reason, DTI measures can be applied to characterize the structure–function relationship of white matter. This conclusion is supported in other studies of white and grey matter and clinical measures, [Beglinger et al.,2005; Wolf et al.,2008]. In another study of eye movements and fiber tracking, similar results were found as ours, especially finding a relationship between eye movements and fiber FA [Kloppel et al.,2008]. We did not show a relationship between CAG repeat length or behavioral processes and changes in white matter integrity. The CAG repeat length is not dependent on disease progression or white matter pathways and this stable quality may, in part, explain this finding. A possible explanation for the absence of a relationship between behavioral measures and diffusivity may be the complex pathophysiological and psychological process underlying these behavioral changes that may not be primarily dependent on white matter. Alternatively, the use of medication may be a factor in the level of symptoms reported [full details of medication use are outlined in Tabrizi et al.,2009] leading to an underestimation of neuropsychiatric problem behavior. However, a recent study has shown that behavioral changes in premanifest HD remain stable [van et al.,2008], thereby reinforcing the idea that degenerative processes are not at the root of these neuropsychiatric differences. Therefore, we conclude that behavioral changes may not be directly reflected by white matter changes.
This study examined and demonstrated differences in white matter pathways of five HD relevant regions, this restriction is a limitation of the study. Differences were found in the number of seed voxels in the caudate nucleus in premanifest gene carriers and in the caudate nucleus and corpus callosum in manifest HD. On the contrary, differences were not seen in the number of voxels in the thalamus, sensorimotor region, or prefrontal regions in the patient group. These reductions do seem to reflect expected atrophy but do not follow the pattern of differences found in ADC. Therefore, these differences do not seem to explain the differences in diffusivity. The results from a correlation analysis between number of voxels in a seed region and clinical variables reveal only five significant moderate correlations. This is in contrast to the analysis of relationship between average ADC and the clinical variables whereby 25 moderate to high correlations were significant. Furthermore, only one of these five was the same as one of the 25 clinical correlations. These results suggest the volume of the seed region does not explain the observed original correlations. With this possibility excluded, it can be stated with more certainty that the relationships observed reflect the underlying changes in structure of the white matter pathways. Futhermore, direct correlation of the ADC and FA of the white matter pathways also supports this conclusion. It can be seen that only significant relationships between the ADC and FA of the same pathways were apparent for pathways that showed (nearly) significant group differences. Overall, the results call for further examination of white matter pathways. The findings warrant confirmation with longitudinal follow‐up.
In conclusion, we demonstrated that the sensorimotor cortex fibers are affected already in the premanifest phase of HD and therefore may be a good target for following progression of the disease. Our data show that impairment is seen in corpus callosum, nuclei, and fiber projections of HD relevant brain regions in both premanifest and early manifest HD. These impairments relate to proven correlates of clinical dysfunction. Overall, the findings of this study confirm the feasibility and use of DTI measures in HD research, whereby we show that ADC is a good measure in characterizing the impaired function–structure relationship present in HD.
Supporting information
Additional Supporting Information may be found in the online version of this article.
Supporting Information.
Acknowledgements
The authors wish to thank the TRACK‐HD study participants, the “CHDI/High Q Foundation,” a not‐for‐profit organization dedicated to finding treatments for HD, for providing financial support (http://www.chdifoundation.org), and all TRACK‐HD investigators for their efforts in conducting this study (http://www.track-hd.net). We would like to thank BioRep for the CAG determinations. The authors would also like to acknowledge the following individuals personally for their contributions: Caroline Jurgens, Marie‐Noelle Witjes‐Ane and Ellen 't Hart for assistance with coordination and data collection, Gail Owen for coordination of data transfer, Mike Sharman for his comments and input, and Felix Mudoh Tita for data monitoring. All work was performed at the Leiden University Medical Centre.
REFERENCES
- Aylward EH, Anderson NB, Bylsma FW, Wagster MV, Barta PE, Sherr M, Feeney J, Davis A, Rosenblatt A, Pearlson GD, Ross CA ( 1998): Frontal lobe volume in patients with Huntington's disease. Neurology 50: 252–258. [DOI] [PubMed] [Google Scholar]
- Aylward EH, Li Q, Stine OC, Ranen N, Sherr M, Barta PE, Bylsma FW, Pearlson GD, Ross CA ( 1997): Longitudinal change in basal ganglia volume in patients with Huntington's disease. Neurology 48: 394–399. [DOI] [PubMed] [Google Scholar]
- Beglinger LJ, Nopoulos PC, Jorge RE, Langbehn DR, Mikos AE, Moser DJ, Duff K, Robinson RG, Paulsen JS ( 2005): White matter volume and cognitive dysfunction in early Huntington's disease. Cogn Behav Neurol 18: 102–107. [DOI] [PubMed] [Google Scholar]
- Douaud G, Behrens TE, Poupon C, Cointepas Y, Jbabdi S, Gaura V, Golestani N, Krystkowiak P, Verny C, Damier P, Bachoud‐Levi AC, Hantraye P, Remy P ( 2009): In vivo evidence for the selective subcortical degeneration in Huntington's disease. Neuroimage 46: 958–966. [DOI] [PubMed] [Google Scholar]
- Fennema‐Notestine C, Archibald SL, Jacobson MW, Corey‐Bloom J, Paulsen JS, Peavy GM, Gamst AC, Hamilton JM, Salmon DP, Jernigan TL ( 2004): In vivo evidence of cerebellar atrophy and cerebral white matter loss in Huntington disease. Neurology 63: 989–995. [DOI] [PubMed] [Google Scholar]
- Jech R, Klempir J, Vymazal J, Zidovska J, Klempirova O, Ruzicka E, Roth J ( 2007): Variation of selective gray and white matter atrophy in Huntington's disease. Mov Disord 22: 1783–1789. [DOI] [PubMed] [Google Scholar]
- Kloppel S, Draganski B, Golding CV, Chu C, Nagy Z, Cook PA, Hicks SL, Kennard C, Alexander DC, Parker GJ, Tabrizi SJ, Frackowiak RS ( 2008): White matter connections reflect changes in voluntary‐guided saccades in pre‐symptomatic Huntington's disease. Brain 131: 196–204. [DOI] [PubMed] [Google Scholar]
- Lasker AG, Zee DS ( 1997): Ocular motor abnormalities in Huntington's disease. Vision Res 37: 3639–3645. [DOI] [PubMed] [Google Scholar]
- Magnotta VA, Kim J, Koscik T, Beglinger LJ, Espinso D, Langbehn D, Nopoulos P, Paulsen JS ( 2009): Diffusion tensor imaging in preclinical Huntington's disease. Brain Imaging Behav 3: 77–84. [DOI] [PMC free article] [PubMed] [Google Scholar]
- Mascalchi M, Lolli F, Della NR, Tessa C, Petralli R, Gavazzi C, Politi LS, Macucci M, Filippi M, Piacentini S ( 2004): Huntington disease: Volumetric, diffusion‐weighted, and magnetization transfer MR imaging of brain. Radiology 232: 867–873. [DOI] [PubMed] [Google Scholar]
- Mori S, Crain BJ, Chacko VP, van Zijl PC ( 1999): Three‐dimensional tracking of axonal projections in the brain by magnetic resonance imaging. Ann Neurol 45: 265–269. [DOI] [PubMed] [Google Scholar]
- Mori S, van Zijl PC ( 2002): Fiber tracking: Principles and strategies—A technical review. NMR Biomed 15: 468–480. [DOI] [PubMed] [Google Scholar]
- Nucifora PG, Verma R, Lee SK, Melhem ER ( 2007): Diffusion‐tensor MR imaging and tractography: Exploring brain microstructure and connectivity. Radiology 245: 367–384. [DOI] [PubMed] [Google Scholar]
- Paulsen JS, Hayden M, Stout JC, Langbehn DR, Aylward E, Ross CA, Guttman M, Nance M, Kieburtz K, Oakes D, Shoulson I, Kayson E, Johnson S, Penziner E ( 2006): Preparing for preventive clinical trials: The Predict‐HD study. Arch Neurol 63: 883–890. [DOI] [PubMed] [Google Scholar]
- Paulsen JS, Langbehn DR, Stout JC, Aylward E, Ross CA, Nance M, Guttman M, Johnson S, MacDonald M, Beglinger LJ, Duff K, Kayson E, Biglan K, Shoulson I, Oakes D, Hayden M ( 2008): Detection of Huntington's disease decades before diagnosis: The Predict‐HD study. J Neurol Neurosurg Psychiatry 79: 874–880. [DOI] [PMC free article] [PubMed] [Google Scholar]
- Penney JB, Vonsattel JP, MacDonald ME, Gusella JF, Myers RH ( 1997): CAG repeat number governs the development rate of pathology in Huntington's disease. Ann Neurol 41: 689–692. [DOI] [PubMed] [Google Scholar]
- Reading SA, Yassa MA, Bakker A, Dziorny AC, Gourley LM, Yallapragada V, Rosenblatt A, Margolis RL, Aylward EH, Brandt J, Mori S, van ZP, Bassett SS, Ross CA ( 2005): Regional white matter change in pre‐symptomatic Huntington's disease: A diffusion tensor imaging study. Psychiatry Res 140: 55–62. [DOI] [PubMed] [Google Scholar]
- Rizzo G, Martinelli P, Manners D, Scaglione C, Tonon C, Cortelli P, Malucelli E, Capellari S, Testa C, Parchi P, Montagna P, Barbiroli B, Lodi R ( 2008): Diffusion‐weighted brain imaging study of patients with clinical diagnosis of corticobasal degeneration, progressive supranuclear palsy and Parkinson's disease. Brain 131: 2690–2700. [DOI] [PubMed] [Google Scholar]
- Roos RA, Bots GT, Hermans J ( 1986): Quantitative analysis of morphological features in Huntington's disease. Acta Neurol Scand 73: 131–135. [DOI] [PubMed] [Google Scholar]
- Rosas HD, Lee SY, Bender A, Zaleta AK, Vangel M, Yu P, Fischl B, Pappu V, Cha JH, Salat DH, Hersch SM ( 2009): Altered white matter microstructure in the corpus callosum in Huntington's disease: Implications for cortical “disconnection.” Neuroimage 49: 2995–3004. [DOI] [PMC free article] [PubMed] [Google Scholar]
- Rosas HD, Liu AK, Hersch S, Glessner M, Ferrante RJ, Salat DH, van der KA, Jenkins BG, Dale AM, Fischl B ( 2002): Regional and progressive thinning of the cortical ribbon in Huntington's disease. Neurology 58: 695–701. [DOI] [PubMed] [Google Scholar]
- Rosas HD, Tuch DS, Hevelone ND, Zaleta AK, Vangel M, Hersch SM, Salat DH ( 2006): Diffusion tensor imaging in presymptomatic and early Huntington's disease: Selective white matter pathology and its relationship to clinical measures. Mov Disord 21: 1317–1325. [DOI] [PubMed] [Google Scholar]
- Solomon AC, Stout JC, Weaver M, Queller S, Tomusk A, Whitlock KB, Hui SL, Marshall J, Jackson JG, Siemers ER, Beristain X, Wojcieszek J, Foroud T ( 2008): Ten‐year rate of longitudinal change in neurocognitive and motor function in prediagnosis Huntington disease. Mov Disord 23: 1830–1836. [DOI] [PMC free article] [PubMed] [Google Scholar]
- Sritharan A, Egan G, Johnston L, Horne M, Bradshaw J, Bohanna I, Asadi H, Cunnington R, Churchyard A, Chua P, Farrow M, Georgiou‐Karistianis N ( 2009): A longitudinal diffusion tensor imaging study in symptomatic Huntington's disease. J Neurol Neurosurg Psychiatry 81: 257–262. [DOI] [PubMed] [Google Scholar]
- Stebbins GT, Murphy CM ( 2009): Diffusion tensor imaging in Alzheimer's disease and mild cognitive impairment. Behav Neurol 21: 39–49. [DOI] [PMC free article] [PubMed] [Google Scholar]
- Stout JC, Weaver M, Solomon AC, Queller S, Hui S, Johnson SA, Gray J, Beristain X, Wojcieszek J, Foroud T ( 2007): Are cognitive changes progressive in prediagnostic HD? Cogn Behav Neurol 20: 212–218. [DOI] [PubMed] [Google Scholar]
- Tabrizi SJ, Langbehn DR, Leavitt BR, Roos RA, Durr A, Craufurd D, Kennard C, Hicks SL, Fox NC, Scahill RI, Borowsky B, Tobin AJ, Rosas HD, Johnson H, Reilmann R, Landwehrmeyer B, Stout JC ( 2009): Biological and clinical manifestations of Huntington's disease in the longitudinal TRACK‐HD study: Cross‐sectional analysis of baseline data. Lancet Neurol 8: 791–801. [DOI] [PMC free article] [PubMed] [Google Scholar]
- van DE, Kingma EM, Timman R, Zitman FG, Tibben A, Roos RA, van der Mast RC ( 2008): Cross‐sectional study on prevalences of psychiatric disorders in mutation carriers of Huntington's disease compared with mutation‐negative first‐degree relatives. J Clin Psychiatry 69: 1804–1810. [DOI] [PubMed] [Google Scholar]
- Vandenberghe W, Demaerel P, Dom R, Maes F ( 2009): Diffusion‐weighted versus volumetric imaging of the striatum in early symptomatic Huntington disease. J Neurol 256: 109–114. [DOI] [PubMed] [Google Scholar]
- Weaver KE, Richards TL, Liang O, Laurino MY, Samii A, Aylward EH ( 2009): Longitudinal diffusion tensor imaging in Huntington's Disease. Exp Neurol 216: 525–529. [DOI] [PMC free article] [PubMed] [Google Scholar]
- Wolf RC, Vasic N, Schonfeldt‐Lecuona C, Ecker D, Landwehrmeyer GB ( 2009): Cortical dysfunction in patients with Huntington's disease during working memory performance. Hum Brain Mapp 30: 327–339. [DOI] [PMC free article] [PubMed] [Google Scholar]
- Zhang K, Yu C, Zhang Y, Wu X, Zhu C, Chan P, Li K ( 2009): Voxel‐based analysis of diffusion tensor indices in the brain in patients with Parkinson's disease. Eur J Radiol. In press; doi: 10.1016/j.ejrad.2009.07.032. [DOI] [PubMed] [Google Scholar]
Associated Data
This section collects any data citations, data availability statements, or supplementary materials included in this article.
Supplementary Materials
Additional Supporting Information may be found in the online version of this article.
Supporting Information.