Abstract
The purpose of this study was to evaluate the effects of longitudinal drift in scanner hardware, inter‐scanner variability (bias), and scanner upgrade on longitudinal changes in global and regional diffusion properties using longitudinal data obtained on two scanners of the exact same model at one institution. A total of 224 normal subjects were scanned twice, at an interval of about 1 year, using two 3.0‐T scanners of the exact same model. Both scanners were simultaneously upgraded during the study period. The subjects were divided into four groups according to the combination of scanners used. With use of tract‐based spatial statistics, we evaluated the effects of scanner drift and inter‐scanner variability (bias) on global and regional fractional anisotropy (FA), axial diffusivity (AD), and radial diffusivity (RD) changes of the white matter. Even with scanners of the exact same model, inter‐scanner variability (bias) significantly affected longitudinal results. FA, AD, and RD of the white matter were relatively stable within the same scanner. We also investigated the effect of scanner upgrade on longitudinal FA, AD, and RD changes. The scanner upgrade included only software upgrade, not hardware upgrade; however, there was a significant effect of scanner upgrade on longitudinal results. These results indicate that inter‐scanner variability and scanner upgrade can significantly affect the results of longitudinal diffusion tensor imaging studies. Hum Brain Mapp, 2012. © 2011 Wiley Periodicals, Inc.
Keywords: bias, diffusion tensor imaging, drift, longitudinal study, magnetic resonance imaging, reliability, reproducibility, scanner, upgrade, variability
INTRODUCTION
Diffusion tensor imaging (DTI) is a magnetic resonance (MR) imaging technique that is sensitive to the random thermal motions of water and can provide contrasts which give insight about tissue architecture. DTI has been widely used to study the integrity of white matter tracts in healthy brains and in a variety of neurological diseases. Longitudinal and multi‐center neuroimaging studies have more power than smaller studies to conduct sophisticated studies of basic neuroanatomy and clinical disorders. Our current knowledge on the effects of normal aging and clinical disorders on the integrity of white matter is derived mostly from cross‐sectional studies. However, the large amount of between‐subject variability that exists in normal brains reduces the sensitivity of methods to detect white matter integrity changes. Longitudinal studies avoid some of the problems of secular trends and between‐subject variation, as each subject forms his or her own control. DTI may be a promising marker to follow longitudinal changes in white matter tracts in normal aging and neurodegenerative diseases. However, for longitudinal studies to be feasible, it is imperative to establish that DTI measurements can be made reliably on individual subjects [Danielian et al.,2010].
The large number of subjects resulting from pooling multi‐scanner data‐sets has numerous advantages. It increases sensitivity thus allowing detection of subtle effects. Additionally, pooling offers increased reliability and confidence about the size of effect by averaging out unforeseen confounds. However, one important confound of combining images obtained from different scanners is the potential for scanner effects to introduce systematic error, thus making the interpretation of results difficult. Differences in DTI measurements due to scanner‐dependent inaccuracies may either mimic or obscure true changes.
Several groups have evaluated intra‐scanner and/or inter‐scanner variability of DTI measurements [Bonekamp et al.,2007; Cassol et al.,2004; Cercignani et al.,2003; Ciccarelli et al.,2003; Danielian et al.,2010; Farrell et al.,2007; Fushimi et al.,2007; Heiervang et al.,2006; Huisman et al.,2006; Hunsche et al.,2001; Jansen et al.,2007; Landman et al.,2007; Marenco et al.,2006; Okada et al.,2006; Pfefferbaum et al.,2003; Qin et al.,2009; Reich et al.,2006]. Most studies investigated reliability by performing repeated scans on a few subjects acquired within the same scan session or within short scan intervals. This approach may underestimate the sources of variability relevant for longitudinal studies (e.g., scanner drift) [Danielian et al.,2010]. To our knowledge, there have been no studies that evaluated intra‐scanner or inter‐scanner reliability using longitudinal data obtained on a large number of subjects. In addition, we are not aware of any study that has investigated whether scanner upgrade influences longitudinal DTI results. In this study, we examined the effects of longitudinal drift in scanner hardware, inter‐scanner variability (bias), and scanner upgrade on longitudinal changes in global and regional DTI measurements using longitudinal (1‐year) data obtained on two scanners of the exact same model at one institution.
MATERIALS AND METHODS
Imaging Data Acquisition
A total of 224 normal subjects (63 females and 161 males, mean age = 57.1 ± 9.5 years, age range = 40.3–83.5 years) were included in this study. None of the subjects had a history of neuropsychiatric disorder including serious head trauma, psychiatric disorders, or alcohol/substance abuse or dependence. The mean mini‐mental state examination (MMSE) score was 29.6 ± 0.7 (range = 27–30). Each subject was scanned twice, at an interval of about 1 year (mean interval = 1.0 ± 0.11 years, range = 0.6–1.3 years). A board‐certified radiologist reviewed all scans (including T1‐weighted and T2‐weighted images) and found no gross abnormalities such as infarct, hemorrhage, or brain tumors in any of the subjects. The Fazekas score (range, 0–3) was 0 or 1 [Fazekas et al.,1987]. The scale is a four‐point rating scale of white matter hyperintensities devised by Fazekas et al. (0 = absence, 1 = caps, pencil‐thin lining and/or punctuate foci). The ethical committee of the University of Tokyo Hospital approved this study. After a complete explanation of the study to each subject, written informed consent was obtained.
MR data were obtained on two 3.0‐T Signa scanners (GE Medical Systems, Milwaukee, WI) with an 8‐channel brain phased array coil. Both scanners were the exact same model, and simultaneously upgraded from HDx to HDxt during the study period. This upgrade included only software upgrade, not hardware upgrade. Of the 224 subjects, 159 subjects underwent baseline and follow‐up scans before upgrade, and the remaining 65 subjects underwent a baseline scan before upgrade and a follow‐up scan after upgrade. Diffusion tensor images were acquired using a single‐shot spin‐echo echo‐planar sequence in 50 axial slices (repetition time = 13,200 ms; echo time = 62 ms; field of view = 288 mm; slice thickness = 3 mm with no gap; acquisition matrix = 96 × 96; number of excitations = 1; image matrix = 256 × 256). Diffusion weighting was applied along 13 non‐collinear directions with a b‐value of 1,000 s/mm2 and a single volume was collected with no diffusion gradients applied (b 0). Parallel imaging (Array Spatial Sensitivity Encoding Technique [ASSET]) was used with an acceleration factor of 2.0. The acquired and reconstructed voxel dimensions were 3.0 mm × 3.0 mm × 3.0 mm and 1.125 mm × 1.125 mm × 3.0 mm, respectively.
Image Processing
Tract‐based spatial statistics
Image analysis was mainly carried out using tract‐based spatial statistics (TBSS) 1.2 [Smith et al.,2006,2007], part of FSL (FMRIB Software Library 4.1, http://www.fmrib.ox.ac.uk/fsl) [Smith et al.,2004]. First, the raw diffusion data were corrected for eddy current distortion and head motion using FMRIB's Diffusion Toolbox (FDT) 2.0 [Smith et al.,2004], and corrected for spatial distortion due to gradient non‐linearity using “grad_unwarp” [Jovicich et al.,2006]. Following brain extraction using Brain Extraction Tool (BET) 2.1 [Smith,2002], fractional anisotropy (FA), axial diffusivity (AD), and radial diffusivity (RD) maps were created by fitting a tensor model to the diffusion data using FDT. All subjects' FA data were then aligned into Montreal Neurological Institute (MNI) 152 space using FMRIB's nonlinear registration tool (FNIRT) 1.0 [Smith et al.,2004], which uses a b‐spline representation of the registration warp field. The FMRIB58_FA standard‐space image was used as the target. Next, a mean FA image was created and thinned to create a mean FA skeleton which represents the centers of all tracts common to the group. The mean FA skeleton image was thresholded at a FA value of 0.2 to prevent inclusion of non‐skeleton voxels [Smith et al.,2006]. Each subject's aligned FA data were then projected onto this skeleton. The AD and RD data were also aligned into MNI 152 space and projected onto the mean FA skeleton (using the FA data to find the projection vectors). Then, baseline skeleton‐projected FA, AD, and RD data were subtracted from follow‐up skeleton‐projected FA, AD, and RD data, respectively. The resulting subtraction images were then fed into voxelwise statistical analysis.
Voxel‐based analysis
Each subject's FA, AD, and RD data aligned into MNI 152 space were resampled (2 mm × 2 mm × 2 mm), and then baseline FA, AD, and RD data were subtracted from follow‐up FA, AD, and RD data, respectively. The resulting subtraction images were smoothed by an isotropic Gaussian kernel (sigma = 3 mm) and also fed into voxelwise statistical analysis.
Statistical Analyses
The subjects were grouped as follows: (a) baseline images were obtained on scanner 1 and follow‐up images were obtained on scanner 1 (n = 70); (b) baseline images were obtained on scanner 1 and follow‐up images were obtained on scanner 2 (n = 45); (c) baseline images were obtained on scanner 2 and follow‐up images were obtained on scanner 1 (n = 56); and (d) baseline images were obtained on scanner 2 and follow‐up images were obtained on scanner 2 (n = 53). Differences in longitudinal skeleton average FA, AD, and RD changes were tested using analysis of covariance (ANCOVA) with change in skeleton average FA, AD, or RD as the dependent variable and group, scanner upgrade, age, sex, and age × sex as independent variables. These statistical analyses were performed using JMP 8.0 (SAS Institute, Cary, NC). A P value of <0.05 was considered to indicate a statistically significant difference.
Voxelwise analyses of the subtraction images were performed using permutation‐based, voxelwise non‐parametric testing [Nichols and Holmes,2002] (as implemented in the randomize tool, part of FSL). First, we identified areas with significant differences in longitudinal changes between the groups (a–d). Scanner upgrade, age, and sex were included as covariates of no interest. Next, we identified areas with significant longitudinal changes in each group (a–d). We also identified areas with common changes in groups b and c. Finally, we identified areas with a significant effect of scanner upgrade on longitudinal changes. Significance levels for t tests (one‐tailed) and F tests were set at P < 0.025 and at P < 0.05, corrected for multiple comparisons using the FWE rate, respectively (voxel‐level inference). We computed two t contrasts (positive, negative) for t tests. The number of permutations was 5,000.
RESULTS
Effects of Scanner on Global FA, AD, and RD
The ANCOVA for longitudinal skeleton average FA, AD, and RD changes revealed a significant effect of group (FA, F = 32.6, P < 0.0001; AD, F = 67.5, P < 0.0001; RD, F = 80.3, P < 0.0001). There was no effect of scanner upgrade (FA, F = 0.49, P = 0.48; AD, F = 0.15, P = 0.70; RD, F = 1.11, P = 0.29). There was no main effect of age (FA, F = 0.0003, P = 0.99; AD, F = 1.92, P = 0.17; RD, F = 1.23, P = 0.27) or sex (FA, F = 3.58, P = 0.060; AD, F = 0.97, P = 0.33; RD, F = 3.79, P = 0.053), nor was there a sex‐by‐age interaction (FA, F = 0.21, P = 0.64; AD, F = 0.008, P = 0.93; RD, F = 0.17, P = 0.68). The results show significant scanner bias (Fig. 1).
Figure 1.
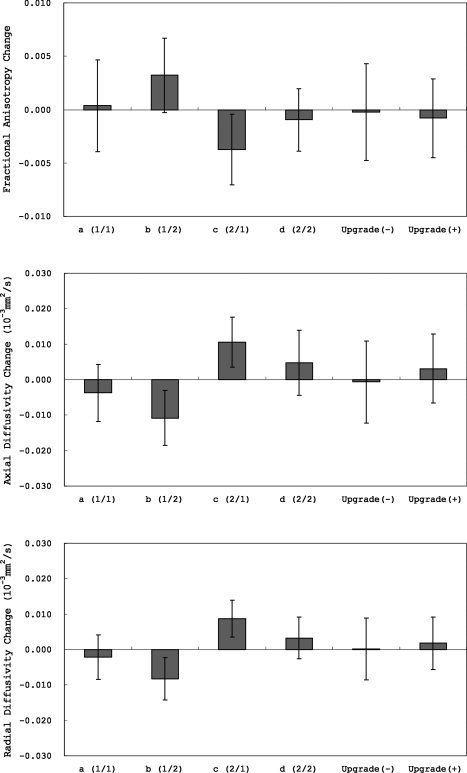
Longitudinal (1‐year) skeleton average fractional anisotropy (FA), axial diffusivity (AD), and radial diffusivity (RD) changes (means ± standard deviations).
Effects of Scanner on Regional FA, AD, and RD
The voxelwise analyses of skeletonized (subtraction) images revealed a number of regions with significant differences in longitudinal changes between the groups (Fig. 2 and Supporting Information Figs. S1,S2) (Table I). In the groups where both baseline and follow‐up images were obtained on the same scanner (a and d), there were no significant longitudinal changes except for a few voxels. In the groups where baseline and follow‐up images were obtained on different scanners (b and c), there were a number of regions with significant longitudinal changes. There was a tendency that the directions of the changes were opposite in these two groups (b and c). The voxelwise analysis showed no regions with common changes in these two groups (b and c) except for a few voxels (Supporting Information Fig. S3), which indicates that the observed longitudinal changes in the two groups were due to scanner bias. The voxelwise analysis also showed a number of regions with a significant effect of scanner upgrade on longitudinal changes (Fig. 3) (Table I).
Figure 2.
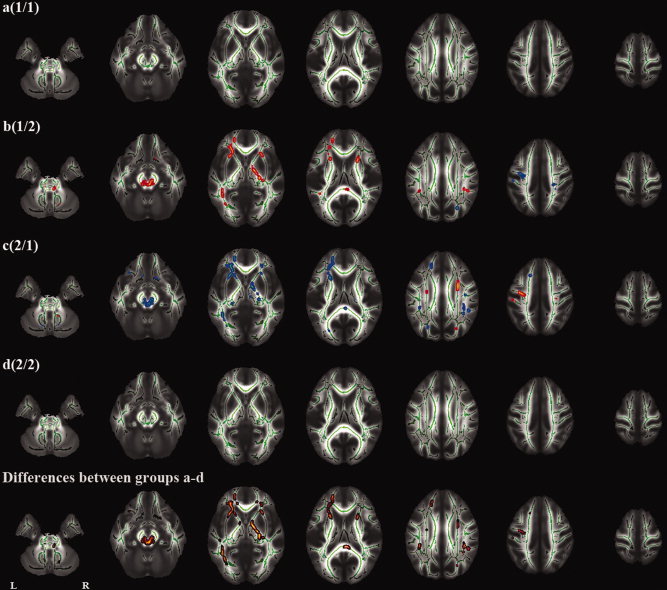
Tract‐based spatial statistics (TBSS) analysis of longitudinal (1‐year) fractional anisotropy (FA) changes. The first four rows indicate an analysis of each group (a‐d). The fifth row indicates an analysis of differences between groups a, b, c, and d (F test). Red and blue represent an increase and decrease in FA, respectively.
Table I.
The Numbers of Significant Voxels in Tract‐Based Spatial Statistics (TBSS) Analyses of Longitudinal (1‐year) Changes
| FA | AD | RD | |
|---|---|---|---|
| Differences between groups a–d | |||
| 5,339 (4.5%) | 2,516 (2.1%) | 4,205 (3.5%) | |
| Group a | |||
| Increase | 1 (0.0%) | 0 (0.0%) | 1 (0.0%) |
| Decrease | 0 (0.0%) | 9 (0.0%) | 3 (0.0%) |
| Group b | |||
| Increase | 2,207 (1.8%) | 10 (0.0%) | 8 (0.0%) |
| Decrease | 151 (0.1%) | 835 (0.7%) | 1,882 (1.6%) |
| Group c | |||
| Increase | 291 (0.2%) | 1,258 (1.0%) | 1,349 (1.1%) |
| Decrease | 2540 (2.1%) | 7 (0.0%) | 14 (0.0%) |
| Group d | |||
| Increase | 0 (0.0%) | 2 (0.0%) | 5 (0.0%) |
| Decrease | 0 (0.0%) | 0 (0.0%) | 0 (0.0%) |
| Effects of Scanner Upgrade | |||
| Positive | 101 (0.1%) | 687 (0.6%) | 1,045 (0.9%) |
| Negative | 714 (0.6%) | 98 (0.1%) | 288 (0.2%) |
FA, indicates fractional anisotropy; AD, axial diffusivity; RD, radial diffusivity.
Figure 3.
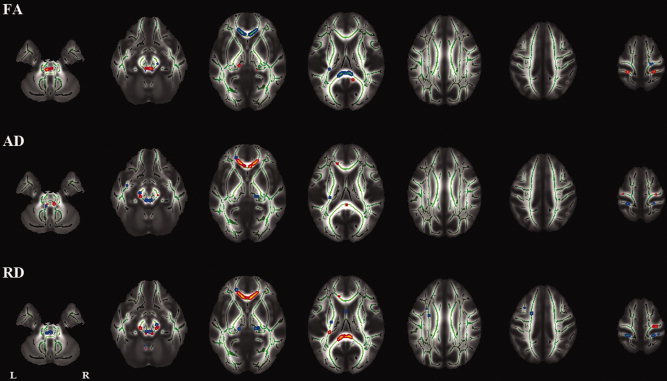
Tract‐based spatial statistics (TBSS) analysis of the effect of scanner upgrade on longitudinal (1‐year) changes. FA indicates fractional anisotropy; AD, axial diffusivity; RD, radial diffusivity.
The voxel‐based analyses of whole brain (subtraction) images also revealed a number of regions with significant differences in longitudinal changes between the groups (Fig. 4, and Supporting Information Figs. S4,S5). In the groups where baseline and follow‐up images were obtained on different scanners (b and c), there were a number of regions with significant longitudinal changes. There was a tendency that the directions of the changes were opposite in these two groups (b and c). The voxelwise analysis showed no regions with common changes in these two groups (b and c) except for small peripheral regions (Supporting Information Fig. S6). The voxel‐based analysis (VBA) also showed a number of regions with a significant effect of scanner upgrade on longitudinal changes (Fig. 5).
Figure 4.
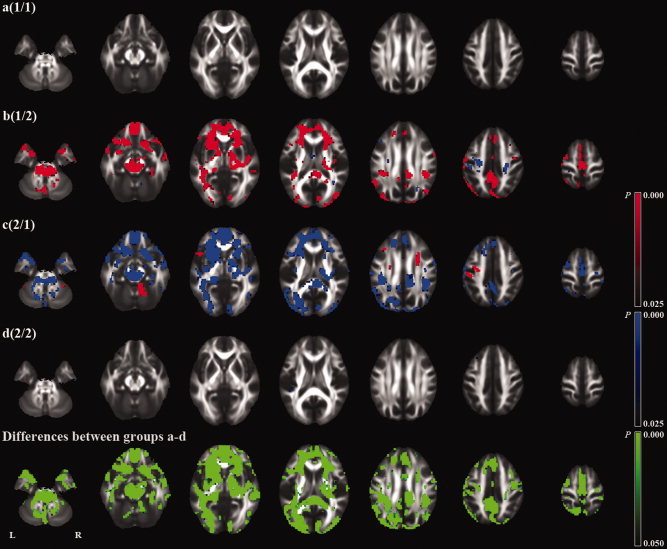
Voxel‐based analysis (VBA) of longitudinal (1‐year) fractional anisotropy (FA) changes. The first four rows indicate an analysis of each group (a‐d). The fifth row indicates an analysis of differences between groups a, b, c, and d (F test). Red and blue represent an increase and decrease in FA, respectively.
Figure 5.
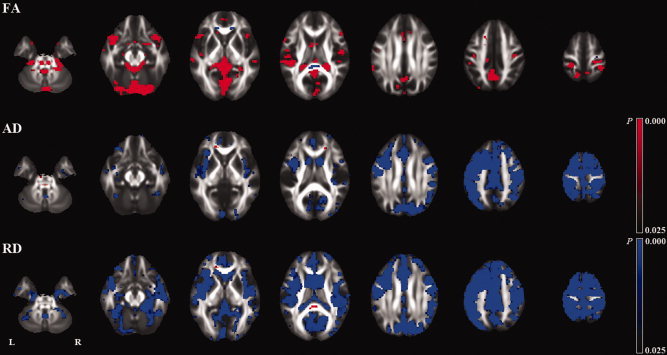
Voxel‐based analysis (VBA) of the effect of scanner upgrade on longitudinal (1‐year) changes. FA indicates fractional anisotropy; AD, axial diffusivity; RD, radial diffusivity.
Supporting Information Figures S7–S9 show mean longitudinal changes in FA, AD, and RD, respectively. Supporting Information Figures S10–S12 show standard deviations of longitudinal changes in FA, AD, and RD, respectively.
Histogram Analysis of Whole‐Brain FA, AD, and RD
To investigate the differences between the two scanners in more detail, whole‐brain histograms were calculated for FA, AD, and RD maps (aligned into MNI 152 space) of the groups where baseline and follow‐up images were obtained on different scanners (b and c). FA histogram bin width was set to 0.01 between 0.0 and 1.0. AD and RD histograms bin width was 0.04 × 10⁻³ mm2/s, between 0.0 × 10⁻³ mm2/s and 4.0 × 10⁻³ mm2/s. The mean AD and RD histograms were shifted toward lower values in scanner 2 compared with scanner 1 (see Fig. 6). This indicates that AD and RD measured by scanner 1 was higher than those measured by scanner 2 as a whole. The mean FA histogram was shifted toward higher values in scanner 2 compared with scanner 1 (see Fig. 6). This indicates that FA measured by scanner 1 was lower than that measured by scanner 1 as a whole.
Figure 6.
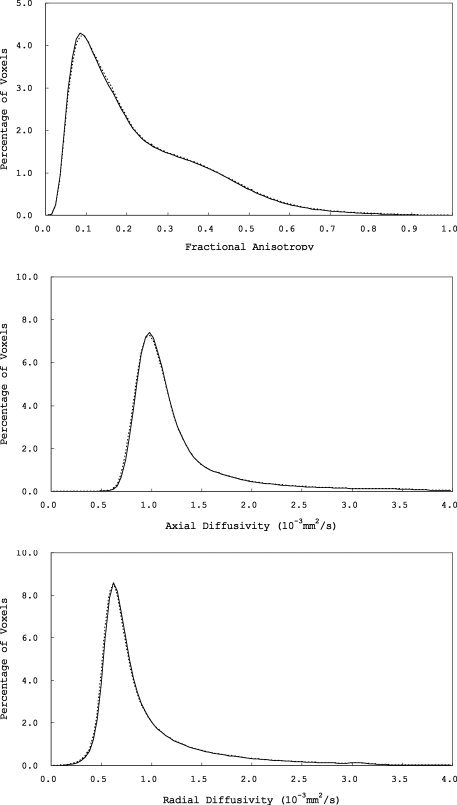
Mean whole‐brain fractional anisotropy (FA), axial diffusivity (AD), and radial diffusivity (RD) histograms (solid lines, scanner 1; dotted lines, scanner 2).
Differences in Head Position
Differences in changes in head position were tested using ANCOVA with change in head position (rotation [x, y, or z] or translation [x, y, or z]), calculated from the transformation parameters derived from aligning each subject's FA data into MNI 152 space, as the dependent variable, and group and scanner upgrade as independent variables. Although the changes in head position were relatively small (Fig. 7), there was a significant effect of group on changes in head position except for translation y ([rotation] x, F = 3.0, P = 0.03; y, F = 11.3, P < 0.0001; z, F = 5.8, P = 0.0008; [translation] x, F = 48.7, P < 0.0001; y, F = 2.2, P = 0.08; z, F = 5.0, P = 0.002). There was no significant effect of scanner update ([rotation] x, F = 0.15, P = 0.69; y, F = 1.3, P = 0.25; z, F = 0.26, P = 0.61; [translation] x, F = 1.1, P = 0.30; y, F = 1.3, P = 0.26; z, F = 2.8, P = 0.10).
Figure 7.
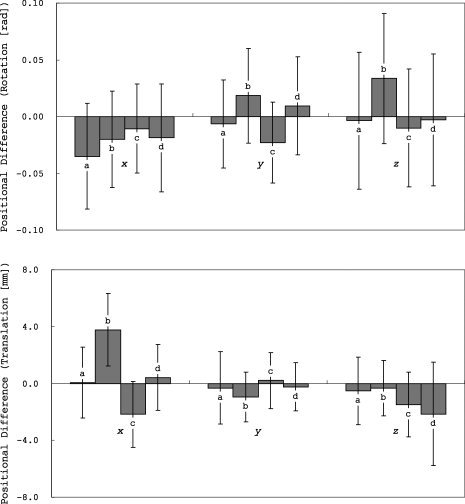
Differences in head position (rotation and translation) between baseline and follow‐up scans (means ± standard deviations).
DISCUSSION
In this study, we examined the effects of longitudinal drift in scanner hardware, inter‐scanner variability (bias), and scanner upgrade on global and regional FA, AD, and RD changes using longitudinal data obtained on two scanners of the exact same model at one institution. Even with scanners of the exact same model, inter‐scanner variability (bias) significantly affected longitudinal results. The difference in skeleton average FA between the two scanners was approximately 0.0035. This is equivalent to about 6 years of change in skeleton average FA (one‐year change estimated cross‐sectionally from the baseline scans = −0.00058 per year). DTI measurements were relatively stable with repeated scans obtained on the same scanner. Reliability of DTI measurements can be affected by a number of factors, including b 0 field inhomogeneities, gradient stability, signal‐to‐noise level, head motion and head positioning. The mean AD and RD histograms were shifted toward lower values in scanner 2 compared with scanner 1, and the mean FA histogram was shifted toward higher values in scanner 2 compared with scanner 1. This might reflect differences in gradients between the two scanners. In this study, there were significant differences in changes in head position between the groups, although the changes were relatively small. Differences in head position might be one of the causes of inter‐scanner variability. The scanner upgrade included only software upgrade, not hardware upgrade. Although it is unclear which software components affected DTI measurements, however, there was also a significant effect of scanner upgrade on longitudinal results.
Several groups have evaluated intra‐scanner and/or inter‐scanner variability of DTI measurements [Bonekamp et al.,2007; Cassol et al.,2004; Cercignani et al.,2003; Ciccarelli et al.,2003; Danielian et al.,2010; Farrell et al.,2007; Fushimi et al.,2007; Heiervang et al.,2006; Huisman et al.,2006; Hunsche et al.,2001; Jansen et al.,2007; Landman et al.,2007; Marenco et al.,2006; Okada et al.,2006; Pfefferbaum et al.,2003; Qin et al.,2009; Reich et al.,2006]. Most studies investigated reliability by performing repeated scans on a few subjects acquired within the same scan session or within short scan intervals. Danielian et al. assessed scan‐rescan and longitudinal reliability in four subjects who had six scans, with two sets of three scans separated by 1 year, using deterministic fiber tracking [Danielian et al.,2010]. They reported that FA, mean diffusivity (MD) and RD were reliable with repeated scans (intraclass correlation coefficient (ICC) > 0.8). However, the effect of scanner drift on longitudinal results is unclear. Pfefferbaum et al.[2003] evaluated within‐scanner and between‐scanner reliability of FA and MD in 10 subjects who had three scans on two different scanners. FA and MD acquired on the same scanner were generally more similar than across scanners. Cercignani et al.[2003] evaluated within‐scanner reliability of diffusion properties in eight subjects who had two scans on two different scanners, and between‐scanner reliability of diffusion properties in four patients who had two scans on the same scanner, using histogram analysis. Inter‐scanner variability was generally larger than intra‐scanner variability. To our knowledge, there have been no studies that investigated whether scanner upgrade influences longitudinal DTI results. The results of our study demonstrated that inter‐scanner variability (bias) and scanner upgrade significantly affected longitudinal results.
In volumetric studies, several groups have analyzed the effects of different scanners on cross‐sectional or longitudinal morphometric results [Briellmann et al.,2001; Dickerson et al.,2008; Ewers et al.,2006; Fennema‐Notestine et al.,2007; Fjell et al.,2009; Han et al.,2006; Ho et al.,2010; Huppertz et al.,2010; Jovicich et al.,2009; Kruggel et al.,2010; Meda et al.,2008; Moorhead et al.,2009; Pardoe et al.,2008; Schnack et al.,2004; Stonnington et al.,2008; Walhovd et al.,2009]. Usually, inter‐scanner variability of volumetric measures is larger than intra‐scanner variability. Drift in scanner hardware significantly affects longitudinal volumetric results, which is an important potential source of error in longitudinal volumetric studies. Any changes in the voxel sizes introduced by scanner instability may either mimic or obscure true changes. Scanner drift is under‐recognized and sometimes ignored in longitudinal volumetric studies [Freeborough and Fox,1998; Whitwell et al.,2001].
TBSS is an unbiased and automated whole‐brain analysis technique that compares diffusion tensor properties between multiple subjects [Smith et al.,2006,2007]. Unlike conventional voxel‐based analyses, TBSS does not require perfect brain alignment or smoothing, and instead projects brains onto an FA skeleton prior to comparison. TBSS combines the strengths of voxel‐based analyses (being able to analyze the whole brain without predefining voxels or tracts of interest) with the strengths of tractography‐based analyses (ideally, being confident that the estimates of FA are truly taken from the relevant voxels) [Smith et al.,2006]. By projecting FA values onto a subject‐mean FA tract skeleton, cross‐subject FA becomes more Gaussian and of lower variability; hence analyses become more robust and more sensitive. TBSS has been widely used to investigate integrity of white matter. Thus, we evaluated the effects of scanner on DTI measurements mainly using TBSS.
CONCLUSION
The results of our study indicate that, even with scanners of the exact same model, inter‐scanner variability (bias) significantly affects longitudinal DTI results, and that scanner upgrade can also affect longitudinal DTI results. The results of our study indicate that DTI measurements are relatively stable within the same scanner.
Supporting information
Additional Supporting Information may be found in the online version of this article.
Supporting Figure 1
Supporting Figure 2
Supporting Figure 3
Supporting Figure 4
Supporting Figure 5
Supporting Figure 6
Supporting Figure 7
Supporting Figure 8
Supporting Figure 9
Supporting Figure 10
Supporting Figure 11
Supporting Figure 12
Acknowledgements
The authors thank Dr. Sachiko Inano, Dr. Eriko Maeda, and Dr. Takeharu Yoshikawa for their help in collecting data.
REFERENCES
- Bonekamp D, Nagae LM, Degaonkar M, Matson M, Abdalla WM, Barker PB, Mori S, Horska A ( 2007): Diffusion tensor imaging in children and adolescents: Reproducibility, hemispheric, and age‐related differences. Neuroimage 34: 733–742. [DOI] [PMC free article] [PubMed] [Google Scholar]
- Briellmann RS, Syngeniotis A, Jackson GD ( 2001): Comparison of hippocampal volumetry at 1.5 tesla and at 3 tesla. Epilepsia 42: 1021–1024. [DOI] [PubMed] [Google Scholar]
- Cassol E, Ranjeva JP, Ibarrola D, Mekies C, Manelfe C, Clanet M, Berry I ( 2004): Diffusion tensor imaging in multiple sclerosis: A tool for monitoring changes in normal‐appearing white matter. Mult Scler 10: 188–196. [DOI] [PubMed] [Google Scholar]
- Cercignani M, Bammer R, Sormani MP, Fazekas F, Filippi M ( 2003): Inter‐sequence and inter‐imaging unit variability of diffusion tensor MR imaging histogram‐derived metrics of the brain in healthy volunteers. AJNR Am J Neuroradiol 24: 638–643. [PMC free article] [PubMed] [Google Scholar]
- Ciccarelli O, Parker GJ, Toosy AT, Wheeler‐Kingshott CA, Barker GJ, Boulby PA, Miller DH, Thompson AJ ( 2003): From diffusion tractography to quantitative white matter tract measures: A reproducibility study. Neuroimage 18: 348–359. [DOI] [PubMed] [Google Scholar]
- Danielian LE, Iwata NK, Thomasson DM, Floeter MK ( 2010): Reliability of fiber tracking measurements in diffusion tensor imaging for longitudinal study. Neuroimage 49: 1572–1580. [DOI] [PMC free article] [PubMed] [Google Scholar]
- Dickerson BC, Fenstermacher E, Salat DH, Wolk DA, Maguire RP, Desikan R, Pacheco J, Quinn BT, Van der Kouwe A, Greve DN, Blacker D, Albert MS, Killiany RJ, Fischl B ( 2008): Detection of cortical thickness correlates of cognitive performance: Reliability across MRI scan sessions, scanners, and field strengths. Neuroimage 39: 10–18. [DOI] [PMC free article] [PubMed] [Google Scholar]
- Ewers M, Teipel SJ, Dietrich O, Schonberg SO, Jessen F, Heun R, Scheltens P, van de Pol L, Freymann NR, Moeller HJ, Hampel H ( 2006): Multicenter assessment of reliability of cranial MRI. Neurobiol Aging 27: 1051–1059. [DOI] [PubMed] [Google Scholar]
- Farrell JA, Landman BA, Jones CK, Smith SA, Prince JL, van Zijl PC, Mori S ( 2007): Effects of signal‐to‐noise ratio on the accuracy and reproducibility of diffusion tensor imaging‐derived fractional anisotropy, mean diffusivity, and principal eigenvector measurements at 1.5 T. J Magn Reson Imaging 26: 756–767. [DOI] [PMC free article] [PubMed] [Google Scholar]
- Fazekas F, Chawluk JB, Alavi A, Hurtig HI, Zimmerman RA ( 1987): MR signal abnormalities at 1.5 T in Alzheimer's dementia and normal aging. AJR Am J Roentgenol 149: 351–356. [DOI] [PubMed] [Google Scholar]
- Fennema‐Notestine C, Gamst AC, Quinn BT, Pacheco J, Jernigan TL, Thal L, Buckner R, Killiany R, Blacker D, Dale AM, Fischl B, Dickerson B, Gollub RL ( 2007): Feasibility of multi‐site clinical structural neuroimaging studies of aging using legacy data. Neuroinformatics 5: 235–245. [DOI] [PubMed] [Google Scholar]
- Fjell AM, Westlye LT, Amlien I, Espeseth T, Reinvang I, Raz N, Agartz I, Salat DH, Greve DN, Fischl B, Dale AM, Walhovd KB ( 2009): High consistency of regional cortical thinning in aging across multiple samples. Cereb Cortex 19: 2001–2012. [DOI] [PMC free article] [PubMed] [Google Scholar]
- Freeborough PA, Fox NC ( 1998): Modeling brain deformations in Alzheimer disease by fluid registration of serial 3D MR images. J Comput Assist Tomogr 22: 838–843. [DOI] [PubMed] [Google Scholar]
- Fushimi Y, Miki Y, Okada T, Yamamoto A, Mori N, Hanakawa T, Urayama S, Aso T, Fukuyama H, Kikuta K, Togashi K ( 2007): Fractional anisotropy and mean diffusivity: Comparison between 3.0‐T and 1.5‐T diffusion tensor imaging with parallel imaging using histogram and region of interest analysis. NMR Biomed 20: 743–748. [DOI] [PubMed] [Google Scholar]
- Han X, Jovicich J, Salat D, van der Kouwe A, Quinn B, Czanner S, Busa E, Pacheco J, Albert M, Killiany R, Maguire P, Rosas D, Makris N, Dale A, Dickerson B, Fischl B ( 2006): Reliability of MRI‐derived measurements of human cerebral cortical thickness: The effects of field strength, scanner upgrade and manufacturer. Neuroimage 32: 180–194. [DOI] [PubMed] [Google Scholar]
- Heiervang E, Behrens TE, Mackay CE, Robson MD, Johansen‐Berg H ( 2006): Between session reproducibility and between subject variability of diffusion MR and tractography measures. Neuroimage 33: 867–877. [DOI] [PubMed] [Google Scholar]
- Ho AJ, Hua X, Lee S, Leow AD, Yanovsky I, Gutman B, Dinov ID, Lepore N, Stein JL, Toga AW, Jack CR Jr, Bernstein MA, Reiman EM, Harvey DJ, Kornak J, Schuff N, Alexander GE, Weiner MW, Thompson PM ( 2010): Comparing 3 T and 1.5 T MRI for tracking Alzheimer's disease progression with tensor‐based morphometry. Hum Brain Mapp 31: 499–514. [DOI] [PMC free article] [PubMed] [Google Scholar]
- Huisman TA, Loenneker T, Barta G, Bellemann ME, Hennig J, Fischer JE, Il'yasov KA ( 2006): Quantitative diffusion tensor MR imaging of the brain: Field strength related variance of apparent diffusion coefficient (ADC) and fractional anisotropy (FA) scalars. Eur Radiol 16: 1651–1658. [DOI] [PubMed] [Google Scholar]
- Hunsche S, Moseley ME, Stoeter P, Hedehus M ( 2001): Diffusion‐tensor MR imaging at 1.5 and 3.0 T: Initial observations. Radiology 221: 550–556. [DOI] [PubMed] [Google Scholar]
- Huppertz HJ, Kroll‐Seger J, Kloppel S, Ganz RE, Kassubek J ( 2010): Intra‐ and interscanner variability of automated voxel‐based volumetry based on a 3D probabilistic atlas of human cerebral structures. Neuroimage 49: 2216–2224. [DOI] [PubMed] [Google Scholar]
- Jansen JF, Kooi ME, Kessels AG, Nicolay K, Backes WH ( 2007): Reproducibility of quantitative cerebral T2 relaxometry, diffusion tensor imaging, and 1H magnetic resonance spectroscopy at 3.0 Tesla. Invest Radiol 42: 327–337. [DOI] [PubMed] [Google Scholar]
- Jovicich J, Czanner S, Greve D, Haley E, van der Kouwe A, Gollub R, Kennedy D, Schmitt F, Brown G, Macfall J, Fischl B, Dale A ( 2006): Reliability in multi‐site structural MRI studies: effects of gradient non‐linearity correction on phantom and human data. Neuroimage 30: 436–443. [DOI] [PubMed] [Google Scholar]
- Jovicich J, Czanner S, Han X, Salat D, van der Kouwe A, Quinn B, Pacheco J, Albert M, Killiany R, Blacker D, Maguire P, Rosas D, Makris N, Gollub R, Dale A, Dickerson BC, Fischl B ( 2009): MRI‐derived measurements of human subcortical, ventricular and intracranial brain volumes: Reliability effects of scan sessions, acquisition sequences, data analyses, scanner upgrade, scanner vendors and field strengths. Neuroimage 46: 177–192. [DOI] [PMC free article] [PubMed] [Google Scholar]
- Kruggel F, Turner J, Muftuler LT ( 2010): Impact of scanner hardware and imaging protocol on image quality and compartment volume precision in the ADNI cohort. Neuroimage 49: 2123–2133. [DOI] [PMC free article] [PubMed] [Google Scholar]
- Landman BA, Farrell JA, Jones CK, Smith SA, Prince JL, Mori S ( 2007): Effects of diffusion weighting schemes on the reproducibility of DTI‐derived fractional anisotropy, mean diffusivity, and principal eigenvector measurements at 1.5T. Neuroimage 36: 1123–1138. [DOI] [PMC free article] [PubMed] [Google Scholar]
- Marenco S, Rawlings R, Rohde GK, Barnett AS, Honea RA, Pierpaoli C, Weinberger DR ( 2006): Regional distribution of measurement error in diffusion tensor imaging. Psychiatry Res 147: 69–78. [DOI] [PMC free article] [PubMed] [Google Scholar]
- Meda SA, Giuliani NR, Calhoun VD, Jagannathan K, Schretlen DJ, Pulver A, Cascella N, Keshavan M, Kates W, Buchanan R, Sharma T, Pearlson GD ( 2008): A large scale (N = 400) investigation of gray matter differences in schizophrenia using optimized voxel‐based morphometry. Schizophr Res 101: 95–105. [DOI] [PMC free article] [PubMed] [Google Scholar]
- Moorhead TW, Gountouna VE, Job DE, McIntosh AM, Romaniuk L, Lymer GK, Whalley HC, Waiter GD, Brennan D, Ahearn TS, Cavanagh J, Condon B, Steele JD, Wardlaw JM, Lawrie SM ( 2009): Prospective multi‐centre voxel based morphometry study employing scanner specific segmentations: procedure development using CaliBrain structural MRI data. BMC Med Imaging 9: 8. [DOI] [PMC free article] [PubMed] [Google Scholar]
- Nichols TE, Holmes AP ( 2002): Nonparametric permutation tests for functional neuroimaging: A primer with examples. Hum Brain Mapp 15: 1–25. [DOI] [PMC free article] [PubMed] [Google Scholar]
- Okada T, Miki Y, Fushimi Y, Hanakawa T, Kanagaki M, Yamamoto A, Urayama S, Fukuyama H, Hiraoka M, Togashi K ( 2006): Diffusion‐tensor fiber tractography: intraindividual comparison of 3.0‐T and 1.5‐T MR imaging. Radiology 238: 668–678. [DOI] [PubMed] [Google Scholar]
- Pardoe H, Pell GS, Abbott DF, Berg AT, Jackson GD ( 2008): Multi‐site voxel‐based morphometry: Methods and a feasibility demonstration with childhood absence epilepsy. Neuroimage 42: 611–616. [DOI] [PMC free article] [PubMed] [Google Scholar]
- Pfefferbaum A, Adalsteinsson E, Sullivan EV ( 2003): Replicability of diffusion tensor imaging measurements of fractional anisotropy and trace in brain. J Magn Reson Imaging 18: 427–433. [DOI] [PubMed] [Google Scholar]
- Qin W, Yu CS, Zhang F, Du XY, Jiang H, Yan YX, Li KC ( 2009): Effects of echo time on diffusion quantification of brain white matter at 1.5 T and 3.0 T. Magn Reson Med 61: 755–760. [DOI] [PubMed] [Google Scholar]
- Reich DS, Smith SA, Jones CK, Zackowski KM, van Zijl PC, Calabresi PA, Mori S ( 2006): Quantitative characterization of the corticospinal tract at 3T. AJNR Am J Neuroradiol 27: 2168–2178. [PMC free article] [PubMed] [Google Scholar]
- Schnack HG, van Haren NE, Hulshoff Pol HE, Picchioni M, Weisbrod M, Sauer H, Cannon T, Huttunen M, Murray R, Kahn RS ( 2004): Reliability of brain volumes from multicenter MRI acquisition: A calibration study. Hum Brain Mapp 22: 312–320. [DOI] [PMC free article] [PubMed] [Google Scholar]
- Smith SM ( 2002): Fast robust automated brain extraction. Hum Brain Mapp 17: 143–155. [DOI] [PMC free article] [PubMed] [Google Scholar]
- Smith SM, Jenkinson M, Woolrich MW, Beckmann CF, Behrens TE, Johansen‐Berg H, Bannister PR, De Luca M, Drobnjak I, Flitney DE, Niazy RK, Saunders J, Vickers J, Zhang Y, De Stefano N, Brady JM, Matthews PM ( 2004): Advances in functional and structural MR image analysis and implementation as FSL. Neuroimage 23 ( Suppl 1): S208–S219. [DOI] [PubMed] [Google Scholar]
- Smith SM, Jenkinson M, Johansen‐Berg H, Rueckert D, Nichols TE, Mackay CE, Watkins KE, Ciccarelli O, Cader MZ, Matthews PM, Behrens TE ( 2006): Tract‐based spatial statistics: Voxelwise analysis of multi‐subject diffusion data. Neuroimage 31: 1487–1505. [DOI] [PubMed] [Google Scholar]
- Smith SM, Johansen‐Berg H, Jenkinson M, Rueckert D, Nichols TE, Miller KL, Robson MD, Jones DK, Klein JC, Bartsch AJ, Behrens TE ( 2007): Acquisition and voxelwise analysis of multi‐subject diffusion data with tract‐based spatial statistics. Nat Protoc 2: 499–503. [DOI] [PubMed] [Google Scholar]
- Stonnington CM, Tan G, Kloppel S, Chu C, Draganski B, Jack CR Jr, Chen K, Ashburner J, Frackowiak RS ( 2008): Interpreting scan data acquired from multiple scanners: A study with Alzheimer's disease. Neuroimage 39: 1180–1185. [DOI] [PMC free article] [PubMed] [Google Scholar]
- Walhovd KB, Westlye LT, Amlien I, Espeseth T, Reinvang I, Raz N, Agartz I, Salat DH, Greve DN, Fischl B, Dale AM, Fjell AM. ( in press): Consistent neuroanatomical age‐related volume differences across multiple samples. Neurobiol Aging. (Epub ahead of print) [DOI] [PMC free article] [PubMed] [Google Scholar]
- Whitwell JL, Crum WR, Watt HC, Fox NC ( 2001): Normalization of cerebral volumes by use of intracranial volume: Implications for longitudinal quantitative MR imaging. AJNR Am J Neuroradiol 22: 1483–1489. [PMC free article] [PubMed] [Google Scholar]
Associated Data
This section collects any data citations, data availability statements, or supplementary materials included in this article.
Supplementary Materials
Additional Supporting Information may be found in the online version of this article.
Supporting Figure 1
Supporting Figure 2
Supporting Figure 3
Supporting Figure 4
Supporting Figure 5
Supporting Figure 6
Supporting Figure 7
Supporting Figure 8
Supporting Figure 9
Supporting Figure 10
Supporting Figure 11
Supporting Figure 12


