

Abstract
Extra‐striate regions are thought to receive non‐retinal signals from the pursuit system to maintain perceptual stability during eye movements. Here, we used magnetoencephalography (MEG) to study changes in oscillatory power related to smooth pursuit in extra‐striate visual areas under three conditions: ‘pursuit’ of a small target, ‘retinal motion’ of a large background and ‘pursuit + retinal motion’ combined. All stimuli moved sinusoidally. MEG source reconstruction was performed using synthetic aperture magnetometry. Broadband alpha–beta suppression (5–25 Hz) was observed over bilateral extra‐striate cortex (consistent with middle temporal cortex (MT+)) during all conditions. A functional magnetic resonance imaging study using the same experimental protocols confirmed an MT+ localisation of this extra‐striate response. The alpha–beta envelope power in the ‘pursuit’ condition showed a hemifield‐dependent eye‐position signal, such that the global minimum in the alpha–beta suppression recorded in extra‐striate cortex was greatest when the eyes were at maximum contralateral eccentricity. The ‘retinal motion’ condition produced sustained alpha–beta power decreases for the duration of stimulus motion, while the ‘pursuit + retinal motion’ condition revealed a double‐dip ‘W’ shaped alpha–beta envelope profile with the peak suppression contiguous with eye position when at opposing maximum eccentricity. These results suggest that MT+ receives retinal as well as extra‐retinal signals from the pursuit system as part of the process that enables the visual system to compensate for retinal motion during eye movement. We speculate that the suppression of the alpha–beta rhythm reflects either the integration of an eye position‐dependent signal or one that lags the peak velocity of the sinusoidally moving target. Hum Brain Mapp, 2013. © 2011 Wiley Periodicals, Inc.
Keywords: smooth pursuit, magnetoencephalography, extra‐retinal signals, MT+/MST, neuronal oscillations
INTRODUCTION
Smooth pursuit eye movements exist to maintain a stable image of a moving target on the fovea. To achieve this, the pursuit system needs to be able to compute the retinal image velocity of the target, process this information and transform the retinotopic coordinates of the target's motion into a spatiotopic, or head‐centred, coordinate frame [Krauzlis and Lisberger, 1994]. These signals can then be used to compute the necessary motor commands to move the eyes and follow the target [Kimmig et al., 2002; Krauzlis, 2004]. At the same time, the visual system must somehow compensate for the retinal motion associated with objects other than the pursuit target [Champion and Freeman, 2010; Freeman et al., 2010; Haarmeier et al., 2001; Naji and Freeman, 2004; Schutz et al., 2008; Souman et al., 2006; Spering and Gegenfurtner, 2006; Turano and Massof, 2001].
Both oculomotor control and the perception of motion during eye movement are subserved by a variety of cortical processes that integrate retinal motion signals with motor commands. The functional neuroanatomy and perceptual bases of these systems have been studied extensively, using invasive electrophysiological recording [Ilg and Thier, 2003; Komatsu and Wurtz, 1988; Newsome et al., 1988] and non‐invasive functional neuroimaging [Dukelow et al., 2001; Nagel et al., 2008; Petit and Haxby, 1999]. These techniques have revealed a functional network located in a number of discrete cortical sites that subserves pursuit eye movements, and the principal regions involved have been studied in detail. In particular, human neuroimaging studies have mapped the spatial extent of the circuitry involved and have found reliable activation in V1, middle temporal cortex (MT+), posterior parietal cortex/intraparietal sulcus, precuneus, the frontal eye fields, supplementary eye fields and cingulate gyrus during smooth pursuit eye movements [Kimmig et al., 2008; Konen et al., 2005; Thier and Ilg, 2005]. The role of MT+ during pursuit has been of special interest as this area is thought to play a principal role in the estimation of object motion on the basis of eye movement signals and the integration of these signals in compensating for retinal motion induced by pursuing a target in a largely stationary world [Haarmeier et al., 2001; Ilg et al., 2004; Komatsu and Wurtz, 1988; Nagel et al., 2008; Newsome et al., 1988; Petit and Haxby, 1999].
Abbreviations
- BOLD
Blood oxygen level dependent
- EEG
Electroencephalography
- EOG
Electro‐oculography
- fMRI
Functional magnetic resonance imaging
- MEG
Magnetoencephalography
- MRI
Magnetic resonance imaging
- MST
Medial superior temporal cortex
- MT/MT+
Middle temporal cortex
- ROI
Region‐of‐interest
- SAM
Synthetic aperture magnetometry
- SPM
Statistical parametric map
Despite the numerous neuroimaging studies of pursuit‐related extra‐retinal activation of the motion processing area MT+ and its sub‐region, the medial superior temporal cortex (MST), to the best of our knowledge these have mostly been limited in scope to using functional magnetic resonance imaging (fMRI) with one exception [Tikhonov et al., 2004]. While the relatively high spatial resolution of fMRI has been key in delineating the MT+ complex into a number of functional sub‐regions, all thought to play different roles in sensory‐motor processing, recent neuroimaging studies have shown that cortical oscillations mediate a number of cognitive and perceptual processes. In particular, extensive research has been conducted on those within the visual domain [Edden et al., 2009; Hadjipapas et al., 2007; Muthukumaraswamy and Singh, 2008; Tallon‐Baudry et al., 1996]. Therefore, it is important that the role of neuronal synchrony underlying pursuit eye movements is examined if we are to properly understand how the brain processes and integrates extra‐retinal eye movement signals into motion processing areas in visual association cortex. With this in mind, we sought to expand on previous findings by using magnetoencephalography (MEG) to explore the changes in cortical oscillations associated with the maintenance of smooth pursuit. This technique benefits from a number of important advantages over electroencephalography (EEG) when imaging neuronal oscillatory dynamics, including a more robust immunity to noise induced from movement of the eyes (particularly in posterior sensors). Additionally, MEG benefits from a greater sensitivity to low‐amplitude, high‐frequency gamma oscillations and greater accuracy when localising superficial neuronal sources in the neocortex [Baillet et al., 2001; Singh, 2006] as it is less sensitive to the distorting effects of the inhomogeneous conductivity profile of the skull.
On the basis of the results from neuroimaging in healthy human subjects, together with the invasive electrophysiological studies on primates, we hypothesised that extra‐striate regions (specifically, areas located in the dorsal visual stream, including MT+) should exhibit pronounced oscillatory power changes related to smooth pursuit. In particular, we predicted alpha‐ (8–12 Hz) and beta‐band (15–25 Hz) power decreases and gamma‐band (>30 Hz) increases, both correlates of cortical activation [Brookes et al., 2005; Muthukumaraswamy and Singh, 2008; Singh et al., 2002], would be present in these regions. Evidence of this might suggest that these dynamic cortical rhythms are part of a putative mechanism in the maintenance of smooth pursuit and perceptual stability. Three conditions were investigated. The ‘pursuit’ condition involved smooth pursuit of a moving target and therefore isolated oculomotor control processes and concomitant extra‐retinal eye movement signals. The ‘retinal motion’ condition used a large moving background and stationary fixation point and so isolated retinal motion signals in the absence of eye movement. The ‘pursuit + retinal’ condition combined the first two by investigating oscillatory changes related to smooth pursuit over a stationary background. By comparing and contrasting the oscillatory dynamics of MT+ in these conditions, we hoped to elucidate some of the neuronal mechanisms that underpin smooth pursuit and how retinal and extra‐retinal motion signals are processed in this area.
The principal focus of this study is to isolate and characterise cortical oscillatory modulations using MEG, and in particular those present during smooth pursuit. However, there is always a concern regarding the accuracy of source‐localisation, especially given the non‐unique EEG/MEG inverse problem. We therefore performed an additional fMRI experiment using modified versions of the three conditions described earlier to compare with the MEG source localisations. This also enabled us to test a subsidiary hypothesis—namely whether increases in fMRI‐blood oxygen level dependent (BOLD)‐activation are co‐localised with amplitude reductions in the alpha/beta bands and a concomitant increase in gamma oscillation power.
METHOD
Participants
Seven healthy participants completed both the MEG and fMRI parts of the experiment, with a further eight participants completing either the MEG or fMRI experiment (four for each modality), giving a cohort of 11 participants for each part of the study in total (MEG—six females, mean age 23.4 years; fMRI—four females, mean age 24.2 years). All participants gave prior informed consent, and all had normal or correct‐to‐normal visual acuity and no history of neurological disorders. All experimental procedures were approved by the Cardiff University School of Psychology Ethics Committee.
Design and Procedure
The experiment consisted of three conditions (see Fig. 1): ‘pursuit’, ‘retinal motion’ and ‘pursuit + retinal motion’. In all three conditions, ambient background light was attenuated using customised goggles fitted with cross‐polarised filters to minimise activation related to pursuit‐induced retinal image motion of any visible landmarks peripheral to the projector screen. The spatial extent of any remaining light on the screen itself was minimised using opaque occluders placed horizontally above and below the oscillating dot. As a check, participants were asked to report whether they could see any objects other than those shown on the screen. If not, successive layers of cross‐polarised filter were added to the goggles until the only perceived object in the ‘pursuit’ condition was the faint target dot.
Figure 1.

Schematic of experimental protocol for the MEG experiment. fMRI parameters are detailed within the text. (a) ‘Pursuit’: a single stationary low‐contrast, monochromatic dot was presented as a fixation point for the 10‐s passive/rest phase. The dot then oscillated back and forth sinusoidally in the horizontal plane for 10 s at ±5° at a frequency of 0.5 Hz, followed by another passive period consisting of 10‐s fixation. This was repeated for 30 trials. (b) ‘Retinal motion’ condition: a central dot was fixated for 10 s (rest), followed by 10 s of an oscillating background consisting of a random dot field. (c) ‘Pursuit + retinal motion’: fixation was maintained for 10 s, followed by pursuit over a stationary random dot field (note that window aperture moved in the same way as the pursuit target).
The ‘pursuit’ condition consisted of smooth pursuit eye movement to a faint, low‐contrast, monochromatic dot in the dark that moved sinusoidally in the horizontal plane (amplitude ±5°, frequency 0.5 Hz and 0.5° visual angle). The second ‘retinal motion’ condition required participants to fixate a static central point while viewing a large‐field random dot‐pattern that moved sinusoidally with the same amplitude, frequency and dot size as that used in the ‘pursuit’ condition. The third ‘pursuit + retinal motion’ condition combined the first two—participants pursued a dot that moved sinusoidally over a stationary random‐dot background. This condition therefore resulted in stimulation related to both the pursuit eye movement and the background retinal motion. Condition order was pseudo‐randomised and counter‐balanced between participants.
The MEG experiment used a boxcar design, with 30 × 20 s epochs each consisting of a 10‐s passive period (baseline/resting brain state) immediately followed by a 10‐s active period (of pursuit, retinal motion or pursuit + retinal motion). Each series ran for ∼10 min in total. In the fMRI experiment, the three conditions were repeated but with 20 epochs lasting 30 s each (15 s passive fixation followed by a 15 s active period). For all conditions, participants were instructed to attend to the central fixation point at all times, following it when the dot moved and keeping their eyes stationary when it did not.
Apparatus and Data Acquisition
During the MEG experiment, visual stimuli were generated on a GeForce graphics card (Nvidia Corporation) and back‐projected (Sanyo XP41 LCD) onto a screen at 60 Hz (size 34 cm × 24.7 cm, total visual angle 25.6° × 19.2° and resolution of 1,024 × 768) at a distance of 71 cm. The visual stimuli and experimental protocol were programmed in Pascal (Delphi 7, Borland Software Corporation) using the OpenGL software library for graphics hardware. A chin rest was used to stabilise the head in the scanner and minimise head movements during each run.
MEG data were recorded using a 275‐channel whole‐head system (CTF Systems, a subsidiary of VSM MedTech) in a magnetically shielded room at a sample rate of 1.2 kHz using a axial gradiometer configuration, with the primary sensors analysed as synthetic third‐order gradiometers. Before and after data acquisition, head position was recorded using three fiduciary markers placed on the nasion and 1 cm anteriorly from both the left and right tragi. Although we did not monitor head movements during each run, the difference between before and after measurements was negligible. Moreover, visual inspection of the raw eye movement recordings showed that observers executed smooth sinusoidal pursuit, as opposed to the more erratic patterns that can result when targets are followed using a combination of head and eye movements (see [Collins and Barnes, 1999]). Both the head and eye recordings suggest that the chin rest was effective in minimising head movements. Each participant's MEG data were then co‐registered offline with their anatomical data based on the position of these easily identifiable anatomical landmarks from the MR scan. These points were verified using high‐resolution digital photographs taken during fiducial placement.
Electro‐oculographic (EOG) recordings were taken during MEG data collection, which allowed us to characterise eye movements while observers wore the polarising goggles. Pairs of electrodes were placed above and below the eye to record vertical displacement and to the lateral corner of each eye to record horizontal displacement. The impedance of each electrode was then measured to ensure satisfactory conductance of the EOG signal. Skin preparation was performed again, and the electrodes were re‐applied if the electrical resistance was found to be above a pre‐defined threshold of 5 kΩ. A pre‐run calibration routine was performed before commencing the experiment. Participants were required to saccade to and fixate a stationary test at ±5° eccentricity, the same visual position as the maximum amplitude of the pursuit cycle.
fMRI data were acquired on a 3T GE scanner with an eight‐channel receive‐only head RF coil, using a gradient echo EPI sequence taking 37 axial slices at 2‐mm isotropic voxel resolution covering the occipital, parietal and a significant portion of temporal cortex, at 128 × 128 matrix size, field‐of‐view 256 × 256 mm, echo time 35 ms, 90° flip angle and a TR of 3 s. For each participant, a 3D FSPGR scan with 1‐mm isotropic voxel resolution was also obtained, to which functional data from both the MEG and fMRI studies could be co‐registered. A single‐volume whole‐brain EPI scan that matched the functional volume in orientation and position but had 75 slices to increase head coverage was also acquired, to aid co‐registration between the anatomical scan and the functional volumes.
Data Analysis
For localisation of the oscillatory response, a multiple, local‐spheres forward‐model was derived by fitting over‐lapping spheres [Huang et al., 1999] to the brain surface extracted by the brain extraction tool (BET) [Smith, 2002]. Source analysis was performed using synthetic aperture magnetometry (SAM), a non‐linear ‘beamforming’ technique based on fixed‐aperture radar technology. This spatial filtering algorithm generates statistical parametric maps (SPMs) of cortical oscillatory power changes [Pfurtscheller and Silva, 1999] between the pre‐defined baseline/passive (fixation) and active (stimulus tracking/retinal motion) periods for user‐specified frequency bands.
The appropriately weighted sum of the MEG sensors is linked to each voxel in the brain so as to provide an optimum spatial filter for that particular cortical location [Singh et al., 2002], with the output known as a ‘virtual electrode’ [Barnes and Hillebrand, 2003]. Details on the calculation of pseudo‐t values in the MEG can be found elsewhere [Hillebrand et al., 2005; Vrba and Robinson, 2001].
SAM images were constructed on a 5 mm × 5 mm × 5 mm grid throughout the brain for each participant. Oscillatory power changes between the passive and active periods for all 30 epochs were mapped for alpha‐ (8–12 Hz), beta‐ (15–25 Hz) and gamma‐ (30–70 Hz) frequency ranges. No regularisation of the covariance matrix was used. Peak coordinates for activation in the specified frequency band in the SAM images were visualised using mri3dX [Singh, 2009] and chosen on the basis of their locality within extra‐striate cortex. Peak locations were identified using an automatic algorithm that first breaks the SAM image into discrete clusters using a moderate pseudo‐t threshold of 0.5. Multiple peaks identified within a radius of 5 mm are considered to represent a single peak. These peak coordinates are then used to compute suitable weights for virtual electrode generation on an individual basis and used in all subsequent analyses (performed using Matlab). Additional computation of time–frequency spectrograms was performed at peak voxel locations based on the Hilbert transform, using frequency ranges 0.1–90 Hz in 0.5‐Hz steps. The percentage change in oscillatory amplitude during the active period was baselined against the 0–10 s passive period.
MRI data analysis was conducted using the FSL software library using a number of pre‐processing steps, including motion correction using MCFLIRT [Jenkinson et al., 2002], brain extraction/non‐brain removal using BET [Smith, 2002] and spatial smoothing using a Gaussian kernel of FWHM 5 mm. The GLM model was used to model a 15‐s on/15‐s off boxcar for the stimulus, after convolution with a standard haemodynamic response function to account for haemodynamic effects. Functional data were initially registered to a whole‐brain EPI scan and then to a high‐resolution FSPGR scan. Statistical thresholding for cortical activation was implemented using cluster‐based thresholding, corrected for the whole brain volume, at P = 0.05.
RESULTS
Behavioural Data
Figure 2 shows group‐averaged eye velocity gain in all three conditions during the MEG experiment. Eye velocity gain was calculated as the ratio of pursuit eye velocity to stimulus velocity, and individual trials with an average eye velocity gain <0.8 were subsequently omitted from further analysis. Therefore, we can be confident that imaging data recorded was predominantly that related to pursuit and/or retinal motion, rather than the result of saccadic eye movements.
Figure 2.

Mean eye velocity gain (ratio of eye velocity to stimulus velocity) for all three conditions.
EOG recording revealed that participants were able to track the target stimulus close to unity (a ratio of eye/stimulus velocity close to 1) when instructed to pursue it as smoothly as possible for both the ‘pursuit’ condition and the ‘pursuit + retinal motion’ condition. Moreover, a paired t‐test revealed no significant difference in the eye velocity gain for these two conditions (t(9) = −0.482, P = 0.641; see Fig. 2). Additionally, participants were able to maintain fixation during the ‘retinal’ motion condition.
Comparing the Oscillatory and BOLD Response in Visual Cortex
Figure 3a, left panel, shows group‐average (n = 11) source power estimates reconstructed using SAM for the MEG data in the broadband beta‐frequency range (15–25 Hz) during smooth pursuit, overlaid on axial and coronal slices of a template brain. The peak oscillatory power changes for pursuit eye movements were localised to voxels in bilateral extra‐striate cortex, consistent with the putative MT+ complex. In comparison, fMRI results (Fig. 3a, right panel) revealed activated clusters in similar regions, showing bilateral extra‐striate cortical activity for the pursuit‐related response, with average Talairach coordinates being similar in both modalities (right hemisphere: fMRI, x = 47, y = −61, z = 7; MEG, x = 43, y = −69, z = 7). The Talairach coordinates reported are consistent with those previously observed for the MT+ complex by Dumoulin et al. [ 2000] (right hemisphere: x = 44, y = −67, z = 0).
Figure 3.

Group results from MEG data and fMRI data in all three conditions, overlaid on a template brain. (a) MEG data, left panel: group‐averaged SAM images in the 15–25 Hz frequency band during smooth pursuit eye movements, overlaid on a template brain. Oscillatory peaks occur in bilateral extra‐striate cortex, with notable beta suppression in areas consistent with putative MT+. Blue/purple/white colour map indicates negative oscillatory amplitude changes with colour bar showing pseudo‐t values. fMRI data, right panel: group fMRI data showing significantly activated clusters (P < 0.05) during pursuit, with warm colours indicating an increasing BOLD amplitude. Note the similar spatial locations of the beta suppression in the MEG data and the BOLD effect in the fMRI data. (b) Group SAM images (15–25 Hz) during ‘retinal motion’ (condition 2) and fMRI data. (c) Group SAM images for ‘pursuit + retinal motion’ (condition 3) and fMRI data. [Color figure can be viewed in the online issue, which is available at wileyonlinelibrary.com.]
The average spatial separation between the peak voxel location in the fMRI‐BOLD cluster and the peak location of the beta suppression estimated using MEG‐SAM was 8.9 mm. Therefore, the spatial difference between the peak activity measured using these two modalities was comparable with the maximum 3D distance between two adjacent SAM voxels (8.7 mm), and given the inherent non‐uniqueness of the MEG/EEG inverse problem and the possibility of minor co‐registration errors when fitting the functional data to structural scans, this can be considered an acceptable co‐localisation of pursuit‐related activity and an important cross‐modal validation of the task.
For the ‘retinal motion’ condition, SAM analysis (Fig. 3b, left panel) revealed bilateral beta suppression in extra‐striate cortex, consistent with MT+, that once again shows a spatial pattern of activation consistent with the fMRI data. MEG data of pursuit over a stationary background (‘pursuit + retinal’ condition, Fig. 3b, left panel) showed a similar spatial coincidence of beta‐frequency suppression as the pursuit condition, with peaks in oscillatory power decreases for the 15–25 Hz response identified in bilateral extra‐striate cortex, including MT+. The fMRI results corroborated this pattern of activation, along with additional peaks identified in early visual cortex (Fig. 3c, right panel).
Alpha‐band SAM images revealed activity in similar regions to the beta frequency in some but not all participants. Therefore, the region‐of‐interest (ROI), MT+, was localised on the results of the beta‐frequency range (15–25 Hz) images for all three conditions, and virtual sensors were constructed on the basis of these images and coordinates. Additionally, no consistent responses in the gamma band were found in any of the tasks. This may in part be due to an insufficient SNR for gamma activity, possibly the result of saccadic eye movement contamination and subsequent exclusion of artefactual trials.
Time–Frequency Analysis
To assess the spectral characteristics of the neuromagnetic response in the ‘pursuit’ condition, an ROI analysis was conducted on an individual basis for peaks identified in the SAM beamformer reconstructions that were consistent with the MT+ complex in extra‐striate cortex. Virtual sensors were constructed at these peak locations and a time–frequency analysis performed. The individual spectral analyses were then averaged to give a group‐mean spectrogram for both left and right hemispheres (Fig. 4a). The results revealed a 5–25 Hz (henceforth referred to as ‘broadband alpha–beta’) amplitude decrease (as percentage change from baseline) for the duration of stimulus tracking in both left and right hemisphere, with a steep initial perturbation in the peak alpha–beta amplitude, with a decrease of ∼25% following eye movement initiation. This broadband alpha–beta amplitude decrease appeared to be modulated in a time‐varying fashion for the duration of the pursuit period.
Figure 4.

(a) Grand‐averaged time–frequency spectrograms during the ‘pursuit’ condition, extracted from the extra‐striate virtual sensor location in both left and right hemispheres, showing task‐induced broadband alpha–beta activity decreases for the duration of target tracking. (b) Spectrograms for ‘retinal motion’ and (c) ‘pursuit + retinal motion’ conditions. [Color figure can be viewed in the online issue, which is available at wileyonlinelibrary.com.]
A time–frequency analysis of peak voxels in extra‐striate cortex during the ‘retinal motion’ condition showed sustained bilateral 5–25 Hz oscillatory amplitude decreases in the region of ∼25% for the duration of retinal motion (Fig. 4b, left and right panel), in contrast to the suppression of the broadband alpha–beta rhythm seen during ‘pursuit’, which appears to vary over time. Inspection of the oscillatory response for voxels in extra‐striate cortex during the ‘pursuit + retinal motion’ condition revealed similar looking patterns of activity to the ‘retinal motion’ condition, albeit with a possible evidence of some task‐induced modulation of the alpha–beta rhythm (Fig. 4c).
Alpha–Beta Envelope Response
‘Pursuit’ condition
To further investigate the modulation of the 5–25 Hz response evident in the spectrogram of the ‘pursuit’ condition, the envelope amplitude in this frequency band was extracted from each of the bilateral extra‐striate virtual sensors and compared with the eye position during smooth pursuit. Figure 5a, left panel, shows the group‐average eye position during the pursuit period and a single pursuit cycle, right panel, during the ‘pursuit’ condition. Figure 5b shows the group‐averaged envelope amplitude in the 5–25 Hz frequency band (as percentage change from baseline) during the active pursuit period from the peak voxel location in extra‐striate cortex in the left hemisphere, left panel. The average 5–25 Hz envelope during a single pursuit cycle is shown in the right panel. The oscillatory amplitude changes during the initial 2 s of the pursuit cycle were omitted from the average amplitude change calculation to exclude the influence of any retinal motion‐ or saccadic movement‐related activity; therefore, we can be confident that this average cycle data are almost‐exclusively the result of pursuit maintenance when eye velocity gain was close to unity. Figure 5c shows the extracted alpha–beta envelope amplitude from the peak voxel in the right hemisphere.
Figure 5.

(a) Horizontal eye position data for the duration of object tracking and single pursuit cycle average eye position. (b) Group‐averaged 5–25 Hz envelope oscillatory amplitude change during pursuit from the left hemisphere MT+ voxel, with single pursuit cycle alpha–beta amplitude average. Maximum suppression of the rhythm appears to correspond to pursuit position when the eye gaze was at maximum eccentricity in the contralateral visual hemifield. (c) Same as (b), except the 5–25 Hz amplitude envelope from right hemisphere MT+ voxel. [Color figure can be viewed in the online issue, which is available at wileyonlinelibrary.com.]
Comparing the 5–25 Hz amplitude envelope from bilateral virtual sensors during the average pursuit cycle (shown in Fig. 5b,c, right panel), it would appear that there is an asymmetry in alpha–beta oscillatory amplitude that reflects a rectified eye position‐dependent signal from MT+. In other words, the maximum suppression (global minimum) of the 5–25 Hz rhythm coincided with the position of the eyes when they were at maximum eccentricity in the contralateral visual hemifield (i.e., to the hemisphere from which the virtual sensor is recorded). It appears that these dynamic oscillatory changes of low‐frequency brain rhythms in MT+ reflect eye position when pursuing a target in the contralateral visual hemifield. Thus, when recording from left hemisphere MT+, a maximum amplitude decrease of ∼14% in the alpha–beta envelope was seen when the eyes were at maximum eccentricity in the right visual hemifield (Fig. 5b, right), and conversely, when recording from right hemisphere MT+, an oscillatory amplitude decrease of ∼13% occurred when the eyes were at maximum eccentricity in the left visual hemifield (Fig. 5c, right).
To test this apparent hemifield‐dependent eye position effect, the average alpha–beta amplitude was quantified over a 100‐ms window when the eyes were at maximum opposing eccentricities (amplitudes) from each hemisphere, and a paired t‐test was performed. This revealed a significant difference in the alpha–beta amplitude for ipsi‐ vs. contralateral eye positions from left MT+ (t(10) = 4.67, P < 0.001; Fig. 6a) and right MT+ (t(10) = 2.86, P = 0.017; Fig. 6b).
Figure 6.
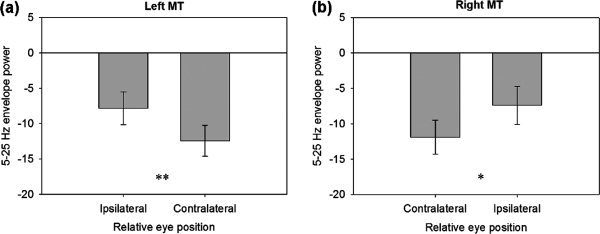
(a) Average broadband alpha–beta amplitude from left MT+ during smooth pursuit, quantified over a 100‐ms window when eyes were at maximum amplitude, relative to virtual electrode location. (b) Same as before, for right MT+. **P < 0.001, *P < 0.05.
‘Retinal motion’ condition
Figure 7 shows the extracted 5–25 Hz amplitude envelope for the ‘retinal motion’ condition. Unlike the ‘pursuit’ condition, both hemispheres showed a largely sustained suppression for the duration of stimulus motion, with a decrease in the amplitude of ∼20% for a single‐cycle period, as opposed to displaying an envelope profile that is asymmetric in nature. This effect was especially prominent in the left MT+ virtual sensor recording.
Figure 7.

(a) Stimulus position (moving dot‐field pattern; red trace) during retinal motion and eye position (blue trace) and single stimulus position cycle with average eye position. (b) Group‐averaged 5–25 Hz amplitude envelope change during retinal motion from the left hemisphere MT+ voxel, with single stimulus cycle alpha–beta amplitude average. Alpha–beta rhythm suppression appears largely sustained for the duration of stimulus motion. (c) Same as (b), except 5–25 Hz amplitude envelope from right hemisphere MT+ voxel. [Color figure can be viewed in the online issue, which is available at wileyonlinelibrary.com.]
‘Pursuit + retinal motion’ condition
For the ‘pursuit + retinal motion’ condition, we might expect alpha–beta envelope profiles similar to the summation of oscillatory amplitude displayed in the ‘pursuit’ and ‘retinal motion only’ condition. However, as Figure 8 shows, this was only approximately the case. Thus, the eye position‐dependent signal showed a partially asymmetric profile, resembling a double‐dip ‘W’ shape. Maximum suppression of the alpha–beta rhythm corresponded to eye position at maximum eccentricity in the contralateral visual hemifield, with a second, smaller, local minimum in the magnitude of alpha–beta activity when the eyes were at maximum eccentricity in the ipsilateral visual hemifield. This evidence of a smaller, local decrease in amplitude that corresponded to ipsilateral eye position eccentricity was not evident in the ‘pursuit’ condition.
Figure 8.

(a) Eye position during pursuit and single cycle eye position average. (b) Group‐averaged 5–25 Hz amplitude envelope change during pursuit over a stationary background from the left hemisphere MT+ voxel, with single stimulus cycle alpha–beta amplitude average. Peak alpha–beta activity decrease occurs with maximum eye eccentricity in the contraleral visual hemifield, with a second peak decrease appearing to reflect eye position in the ipsilateral hemifield during pursuit. (c) Same as (b), except 5–25 Hz amplitude envelope from right hemisphere MT+ voxel. [Color figure can be viewed in the online issue, which is available at wileyonlinelibrary.com.]
DISCUSSION
Using non‐invasive fMRI and magnetoencephalographic recording in human subjects, we investigated the cortical correlates of smooth pursuit eye movements. We focused our attention on the spectral characteristics of the neuromagnetic response during activation of the visual pursuit and retinal motion systems, with a particular emphasis on the mechanisms underlying sensory processing involved with the integration of extra‐retinal eye movement signals in MT+. This was achieved by comparing three conditions: a ‘pursuit’ condition that used an oscillating target stimulus and custom‐made cross‐polarised goggles that eliminated any unwanted retinal motion peripheral to the projector screen, a ‘retinal motion’ condition in which a background stimulus moved in the absence of eye movements and a ‘pursuit + retinal’ motion condition that combined the first two. We found consistent BOLD increases and alpha–beta frequency band (5–25 Hz) power decreases that showed a marked spatial invariance in its cortical location, with SAM demonstrating a source location in extra‐striate cortex consistent with MT+ throughout all three conditions. In line with previous research, this spatial concordance suggests that BOLD activity is related to concomitant changes in beta oscillatory power [Singh et al., 2002].
In the two conditions containing pursuit eye movements, we found modulation of neuronal oscillations that appeared to be related to the processing of extra‐retinal motion signals. In particular, we observed activity in MT+ that covaries with eye position in the contralateral visual hemifield when engaging in pursuit eye movements (‘pursuit’ condition). While we have yet to explore brain rhythms in other cortical structures known to mediate oculomotor control (e.g., the frontal eye fields), we tentatively propose that this cortical oscillatory modulation could represent an increase in neuronal activity and the processing of signals sent from the oculomotor control system to the motion‐processing pathway of the dorsal stream that codes for eye position during pursuit. This, in turn, might be one of a number of mechanisms used in the maintenance of perceptual stability.
However, there are a number of limitations in this study. First, while we were principally investigating activation associated with the pursuit system, we cannot completely exclude the influence of saccadic eye movements on the imaging data recorded, as overlapping cortical regions are known to be active during both saccadic and smooth pursuit eye movements [Petit and Haxby, 1999]. While care was taken to exclude data containing saccadic eye movements (during pursuit initiation and corrective saccade period), it is possible that some trials may have been contaminated by saccadic movements.
Second, and perhaps most importantly, despite efforts to minimise retinal image motion during tracking movements by using the customised goggles, it was not possible to exclude a contribution of retinal slip of the target stimulus to the oscillatory changes we measured. Inspection of eye position during maximum deceleration of the target stimulus showed a decrease in pursuit gain (eye/object velocity mismatch), with the eye movement lagging slightly behind the stimulus when it was approaching maximum amplitude of the pursuit cycle. This ‘error’ in tracking will generate a retinal motion signal that might induce an oscillatory change in the MEG signal, with previous research showing that transient changes in translational motion can induce activity in MT+ [Martinez‐Trujillo et al., 2007]. Any contribution of this retinal slip to changes in cortical activity is likely to be relatively small; we must nevertheless be cautious in our interpretation of the results due to this potential confound.
Finally, while we recorded head position both before and after each run as a diagnostic tool to ensure head movement was minimal and an accurate source reconstruction could be made, we do not have continuous recordings of head position. Therefore, it is possible that modulation of the oscillatory response could in fact be due to correlated head movements during stimulus tracking. While this might be possible, we believe this is unlikely as the eye velocity gain values for the pursuit eye movement conditions were approaching unity and far above that which might have been expected had participants been tracking the stimulus with gaze changes involving head rotation. Additionally, while it could be argued that head and gaze control are regulated by similar mechanisms, previous research would suggest that relatively small amplitude eye movements such as those used here can be dissociated and uncoupled in the brain from head movements, and controlled independently [Collins and Barnes, 1999].
Presently, our interpretation of the hemifield‐dependent signal that we found during the ‘pursuit’ condition remains largely speculative; for example, it is not known whether this signal represents an absolute (as in craniotopic) or relative (in terms of a predictive pursuit cycle) position signal. Animal data suggest that there are neurons with a craniotopic eye position‐sensitivity in MST, but when compared with those that display response characteristics that are coincident with changes in eye velocity, they are in the clear minority [Ilg and Thier, 2003]. We might have expected the contribution of the more common velocity sensitive neurons to dominate the MEG signature, so it is not clear why the disproportionately small percentage of craniotopic neurons might manifest as a 5–25 Hz oscillatory change. However, it is worth pointing out that our use of sinusoidal modulation means that it is not possible to completely disentangle the relative contribution of velocity sensitive and position sensitive signals. This is because any hypothetical position signal is a phase‐lagged version of the velocity signal and we do not have an independent measure of whether amplitude changes in these low‐frequency oscillations are delayed with respect to changes in the underlying neural activity within MT+. Future experiments using alternative temporal designs, such as linear step‐ramps in eye movements and/or retinal motion, should be able to make a more categorical link between low‐frequency suppression and either velocity or position.
Recent literature suggests that these task‐related suppressions of low‐frequency oscillations play an important functional role in the brain. For example, it has been shown that entrainment of cortical rhythms using transcranial alternating current stimulation at the beta frequency over the motor cortex inhibits motor function [Pogosyan et al., 2009], and clinical studies of Parkinsonian patients displaying symptoms of bradykinesia show abnormal and enhanced beta oscillations [Kuh et al., 2008]. Taken together, these data imply a functional role of low‐frequency rhythms in inhibition of task‐irrelevant information (or ‘gating by inhibition’), and conversely, their suppression in regions that process task‐relevant information [Jensen and Mazaheri, 2010].
In addition, it seems reasonable to assume that pursuit‐related modulation of cortical oscillations in the putative MT+ region might also reflect the engagement of further superordinate processes that have not been controlled for in this particular study. These might include an increased load in visuo‐spatial attention mechanisms, known to be integral in the maintenance of deliberate pursuit eye movements [Lovejoy et al., 2009], as well as facilitating neuronal response characteristics and oscillatory power changes in this area [Yamagishia et al., 2008].
While the exact nature of the oscillatory modulations displayed in this area during pursuit and its underlying role in perceptual processing (if any) remains unclear, these questions will guide forthcoming experiments.
REFERENCES
- Baillet S, Mosher JC, Leahy RM ( 2001): Electromagnetic brain mapping. IEEE Signal Process Mag 18: 14–30. [Google Scholar]
- Barnes GR, Hillebrand A ( 2003): Statistical flattening of MEG beamformer images. Hum Brain Mapp 18: 1–12. [DOI] [PMC free article] [PubMed] [Google Scholar]
- Brookes MJ, Gibson AM, Hall SD, Furlong PL, Barnes GR, Hillebrand A, Singh KD, Holliday IE, Francis ST, Morris PG ( 2005): GLM‐beamformer method demonstrates stationary field, alpha ERD and gamma ERS co‐localisation with fMRI BOLD response in visual cortex. Neuroimage 26: 302–308. [DOI] [PubMed] [Google Scholar]
- Champion RA, Freeman TCA ( 2010): Discrimination contours for the perception of head‐centered velocity. J Vision 10: 1–9. [DOI] [PMC free article] [PubMed] [Google Scholar]
- Collins CJS, Barnes GR ( 1999): Independent control of head and gaze movements during head‐free pursuit in humans. J Physiol‐London 515: 299–314. [DOI] [PMC free article] [PubMed] [Google Scholar]
- Dukelow SP, DeSouza JFX, Culham JC, Berg AVvd, Menon RS, Villis T ( 2001): Distinguishing subregions of the human MT+ complex using visual fields and pursuit eye movements. J Neurophysiol 86: 1991–2000. [DOI] [PubMed] [Google Scholar]
- Dumoulin SO, Bittar RG, Kabani NJ, Baker CL, Le Goualher G, Pike GB, Evans AC ( 2000): A new anatomical landmark for reliable identification of human area V5/MT: a quantitative analysis of sulcal patterning. Cereb Cortex 10: 454–463. [DOI] [PubMed] [Google Scholar]
- Edden RAE, Muthukumaraswamy SD, Freeman TCA, Singh KD ( 2009): Orientation discrimination performance is predicted by GABA concentration and gamma oscillation frequency in human primary visual cortex. J Neurosci 29: 15721–15726. [DOI] [PMC free article] [PubMed] [Google Scholar]
- Freeman TCA, Champion RA, Warren PA ( 2010): A Bayesian model of perceived head‐centered velocity during smooth pursuit eye movement. Curr Biol 20: 757–762. [DOI] [PMC free article] [PubMed] [Google Scholar]
- Haarmeier T, Bunjes F, Lindner A, Berret E, Thier P ( 2001): Optimizing visual motion perception during eye movements. Neuron 32: 527–535. [DOI] [PubMed] [Google Scholar]
- Hadjipapas A, Adjamian P, Swettenham JB, Holliday IE, Barnes GR ( 2007): Stimuli of varying spatial scale induced gamma activity with distinct temporal characteristics in human visual cortex. Neuroimage 35: 518–530. [DOI] [PubMed] [Google Scholar]
- Hillebrand A, Singh KD, Holliday IE, Furlong PL, Barnes GR ( 2005): A new approach to neuroimaging with magnetoencephalography. Hum Brain Mapp 25: 199–211. [DOI] [PMC free article] [PubMed] [Google Scholar]
- Huang MX, Mosher JC, Leahy RM ( 1999): A sensor‐weighted overlapping‐sphere head model and exhaustive head model comparison for MEG. Phys Med Biol 44: 423–440. [DOI] [PubMed] [Google Scholar]
- Ilg UJ, Thier P ( 2003): Visual tracking neurons in primate area MST are activated by smooth‐pursuit eye movements of an “imaginary” target. J Neurophysiol 90: 1489–1102. [DOI] [PubMed] [Google Scholar]
- Ilg UJ, Schumann S, Thier P ( 2004): Posterior parietal cortex neurons encode target motion in world‐centred coordinates. Neuron 43: 145–151. [DOI] [PubMed] [Google Scholar]
- Jenkinson M, Bannister P, Brady M, Smith M ( 2002): Improved optimisation for the robust and accurate linear registration and motion correction of brain images. NeuroImage 17: 825–841. [DOI] [PubMed] [Google Scholar]
- Jensen O, Mazaheri A ( 2010): Shaping functional architecture by oscillatory alpha activity: Gating by inhibition. Front Hum Neurosci 4: 1–8. [DOI] [PMC free article] [PubMed] [Google Scholar]
- Kimmig H, Biscaldi M, Mutter J, Doerr JP, Fischer B ( 2002): The initiation of smooth pursuit eye movements and saccades in normal subjects and in “express‐saccade makers”. Exp Brain Res 144: 373–384. [DOI] [PubMed] [Google Scholar]
- Kimmig H, Ohlendorf S, Speck O, Sprenger A, Rutschmann RM, Haller S, Greenlee MW ( 2008): fMRI evidence for sensorimotor transformations in human cortex during smooth pursuit eye movements. Neuropsychologia 46: 2203–2213. [DOI] [PubMed] [Google Scholar]
- Komatsu H, Wurtz RH ( 1988): Relation of cortical areas MT and MST to pursuit eye movements. I. Localization and visual properties of neurons. J Neurophysiol 60: 580–603. [DOI] [PubMed] [Google Scholar]
- Konen CS, Kleiser R, Seitz RJ, Bremmer F ( 2005): An fMRI study of optokinetic nystagmus and smooth‐pursuit eye movements in humans. Exp Brain Res 165: 203–216. [DOI] [PubMed] [Google Scholar]
- Krauzlis RJ ( 2004): Recasting the smooth pursuit eye movement system. J Neurophysiol 91: 591–603. [DOI] [PubMed] [Google Scholar]
- Krauzlis RJ, Lisberger SG ( 1994): A model of visually‐guided smooth pursuit eye movements based on behavioral observations. J Comput Neurosci 1: 265–283. [DOI] [PubMed] [Google Scholar]
- Kuh AA, Kempf F, Brucke C, Doyle LG, Martinez‐Torres I, Pogosyan A, Trottenberg T, Kupsch A, Schneider G, Hariz MI, Vandenberghe W, Nuttin B, Brown P ( 2008): High‐frequency stimulation of the subthalamic nucleus suppresses oscillatory activity in patients with Parkinson's disease in parallel with improvement in motor performance. J Neurosci 28: 6165–6173. [DOI] [PMC free article] [PubMed] [Google Scholar]
- Lovejoy LP, Fowler GA, Krauzlis RJ ( 2009): Spatial allocation of attention during smooth pursuit eye movements. Vision Res 49: 1275–1285. [DOI] [PMC free article] [PubMed] [Google Scholar]
- Martinez‐Trujillo JC, Cheyne D, Gaetz W, Simine E, Tsotsos JK ( 2007): Activation of area MT/V5 and the right inferior parietal cortex during the discrimination of transient direction changes in translational motion. Cereb Cortex 17: 1733–1739. [DOI] [PubMed] [Google Scholar]
- Muthukumaraswamy SD, Singh KD ( 2008): Spatiotemporal frequency tuning of BOLD and gamma band MEG responses compared in primary visual cortex. Neuroimage 40: 1552–1560. [DOI] [PubMed] [Google Scholar]
- Nagel M, Sprenger A, Hohagen F, Binkofski F, Lencer R ( 2008): Cortical mechanisms of retinal and extraretinal smooth pursuit eye movements to different target velocities. Neuroimage 41: 483–492. [DOI] [PubMed] [Google Scholar]
- Naji JJ, Freeman TCA ( 2004): Perceiving depth order during pursuit eye movement. Vision Res 44: 3025–3034. [DOI] [PubMed] [Google Scholar]
- Newsome WT, Wurtz RH, Komatsu H ( 1988): Relation of cortical areas MT and MST to pursuit eye movements. II. Differentiation of retinal from extraretinal inputs. J Neurophysiol 60: 604–620. [DOI] [PubMed] [Google Scholar]
- Petit L, Haxby JV ( 1999): Functional anatomy of pursuit eye movements in humans as revealed by fMRI. J Neurophysiol 82: 463–471. [DOI] [PubMed] [Google Scholar]
- Pfurtscheller G, Lopes da Silva FH ( 1999): Event‐related EEG/MEG synchronisation and desynchronisation: Basic principles. Clin Neurophysiol 110: 1842–1857. [DOI] [PubMed] [Google Scholar]
- Pogosyan A, Gaynor LD, Eusebio A, Brown P ( 2009): Boosting cortical activity at beta‐band frequencies slows movement in humans. Curr Biol 19: 1637–1641. [DOI] [PMC free article] [PubMed] [Google Scholar]
- Schutz AC, Braun DI, Kerzel D, Gegenfurtner KR ( 2008): Improved visual sensitivity during smooth pursuit eye movements. Nat Neurosci 11: 1211–1216. [DOI] [PubMed] [Google Scholar]
- Singh KD ( 2006): Magnetoencephalography In: Senior C, Russell T, Gazzaniga MS, editors. Methods in Mind. London: MIT Press; pp 291–326. [Google Scholar]
- Singh KD ( 2009): mri3dX. Available at: http://cubric.psych.cf.ac.uk/Documentation/mri3dX/features. Accessed on November 2010.
- Singh KD, Barnes GR, Hillebrand A, Forde EM, Williams AL ( 2002): Task‐related changes in cortical synchronisation are spatially coincident with the hemodynamic response. Neuroimage 16: 103–114. [DOI] [PubMed] [Google Scholar]
- Smith SM ( 2002): Fast robust automated brain extraction. Hum Brain Mapp 17: 143–155. [DOI] [PMC free article] [PubMed] [Google Scholar]
- Souman JL, Hooge ITC, Wertheim AH ( 2006): Frame of reference transformations in motion perception during smooth pursuit eye movements. J Comput Neurosci 20: 61–67. [DOI] [PubMed] [Google Scholar]
- Spering M, Gegenfurtner KR ( 2006): Contextual effects on smooth‐pursuit eye movements. J Neurophysiol 97: 1353–1367. [DOI] [PubMed] [Google Scholar]
- Tallon‐Baudry C, Bertrand O, Delpuech C, Pernier J ( 1996): Stimulus specificity of phase‐locked and non‐phase‐locked 40 Hz visual responses in humans. J Neurosci 16: 4240–4249. [DOI] [PMC free article] [PubMed] [Google Scholar]
- Thier P, Ilg UJ ( 2005): The neural basis of smooth pursuit eye movements. Curr Opin Neurobiol 15: 645–652. [DOI] [PubMed] [Google Scholar]
- Tikhonov A, Haarmeier T, Thier P, Braun C, Lutzenberger W ( 2004): Neuromagnetic activity in medial parietooccipital cortex reflects the perception of visual motion during eye movements. Neuroimage 21: 593–600. [DOI] [PubMed] [Google Scholar]
- Turano KA, Massof RW ( 2001): Nonlinear contribution of eye velocity to motion perception. Vision Res 41: 385–395. [DOI] [PubMed] [Google Scholar]
- Vrba J, Robinson SE ( 2001): Signal processing in magnetoencephalography. Methods 25: 249–271. [DOI] [PubMed] [Google Scholar]
- Yamagishia N, Callana DE, Anderson SJ, Kawatob M ( 2008): Attentional changes in pre‐stimulus oscillatory activity within early visual cortex are predictive of human visual performance. Brain Res 1197: 115–122. [DOI] [PubMed] [Google Scholar]