

Abstract
Regions of the brain network activated by painful stimuli are also activated by nonpainful and even nonsomatosensory stimuli. We therefore analyzed where the qualitative change from nonpainful to painful perception at the pain thresholds is coded. Noxious stimuli of gaseous carbon dioxide (n = 50) were applied to the nasal mucosa of 24 healthy volunteers at various concentrations from 10% below to 10% above the individual pain threshold. Functional magnetic resonance images showed that these trigeminal stimuli activated brain regions regarded as the “pain matrix.” However, most of these activations, including the posterior insula, the primary and secondary somatosensory cortex, the amygdala, and the middle cingulate cortex, were associated with quantitative changes in stimulus intensity and did not exclusively reflect the qualitative change from nonpainful to pain. After subtracting brain activations associated with quantitative changes in the stimuli, the qualitative change, reflecting pain‐exclusive activations, could be localized mainly in the posterior insular cortex. This shows that cerebral processing of noxious stimuli focuses predominately on the quantitative properties of stimulus intensity in both their sensory and affective dimensions, whereas the integration of this information into the perception of pain is restricted to a small part of the pain matrix. Hum Brain Mapp, 2012. © 2011 Wiley Periodicals, Inc.
Keywords: pain matrix, nociception, fMRI
INTRODUCTION
The perception of pain has been associated with the activation of a network of brain structures referred to as the “pain matrix” [Apkarian et al.,2005; Peyron et al.,2000]. However, the extent to which components of this network are required for the conscious experience of pain remains under discussion [Kupers and Kehlet,2006]. Moreover, components of this pain matrix were also activated by non‐nociceptive somatosensory, auditory, or visual stimuli [Baliki et al.,2009; Downar et al.,2000; Mouraux and Iannetti,2009] and the amount of activation correlated with the saliency of the activating stimulus, that is, its ability to capture attention [Iannetti et al.,2008; Mouraux and Iannetti,2009]. This led to the hypothesis that the pain matrix represents a sensory matrix of which pain is only a part [Mouraux and Iannetti,2009]. Therefore, brain activations reflecting this qualitative change should be identifiable when taking out brain activations due to raising intensities of potentially noxious stimuli. This requires information about brain activations evoked by stimuli below pain threshold and above pain threshold, respectively, and about the activation reflecting stimulus intensity regardless of stimulus perception. Previous attempts to investigate pain analyzed brain activation in response to either painful and nonpainful stimuli without considering stimulus intensity related effects [Casey et al.,1994; Coghill et al.,1994; Talbot et al.,1991] or stimuli of graded intensity defined implicitly as either nonpainful or painful [Bornhövd et al.,2002; Coghill et al.,1999; Derbyshire et al.,1997; Tölle et al.,1999], or stimuli of a single intensity at the pain threshold while explicitly modeling the stimulus perception [Boly et al.,2007]. Neither design clearly avoids confusing pain perception with stimulus intensity processing. To obtain either information enabling this separation, in the present experiment, potentially nociceptive stimuli of different intensities around the individual pain threshold were applied to healthy volunteers, their painfulness was queried, and the associated brain activations were recorded using functional magnetic resonance imaging (fMRI).
MATERIALS AND METHODS
Subjects
Healthy, right‐handed subjects (12 men, 12 women), aged 23.2–36.9 years (mean ± standard deviation: 29.0 ± 0.7 years) with normal body mass index (19.7–27.2 kg/m2; 23.3 ± 2.4 kg/m2) were enrolled after having given informed written consent. The study was conducted according to the Declaration of Helsinki on Biomedical Research Involving Human Subjects and had been approved by the Ethics Committee of the Medical Faculty of the Goethe‐University, Frankfurt am Main, Germany. The subjects' health was ascertained by medical interview and a short examination. All medications, except oral contraceptives, were prohibited for 1 week, and alcohol for 24 h before the experiments taking place, which were performed between 9 a.m. and 2 p.m.
Pain Stimulation and Experimental Design
Short pulses of gaseous CO2 were administered to the mucosa of the subjects' right nostril by means of an “olfactometer” (OM/2, Burghart Instruments, Wedel, Germany), which allowed for the precise control of stimulus concentration, duration, and steepness of onset (stimulus duration 300 ms, stimulus rise time <50 ms; [Kobal,1981,1985]). To avoid stimulus habituation and adaptation [Hummel et al.,1994], a paradigm with long and regularly spaced intervals (interstimulus interval of 20 s) was preferred to a paradigm with short and randomly spaced intervals [Dale,1999]. The CO2‐stimuli triggered predominantly trigeminal Aδ‐fibers and, to a lesser degree, C‐fibers [Steen et al.,1992] projecting into the nasal mucosa. They do this by activating transient receptor potential cation channels, subfamily V, member 1 (TRPV1), acid sensing ion channels [Ugawa et al.,2005], and proton sensing G‐protein coupled receptors [Huang et al.,2007] expressed at the nociceptive nerve endings.
Subjects received 50 CO2‐stimuli ranging from −10% to +10% v/v CO2 (steps of 0.5% v/v CO2) of the individual pain threshold. Each stimulus was rated 4 s after its administration as either “unnoticed,” “nonpainful,” or “painful” (Presentation software, Neurobehavioral Systems, Albany, CA) [Bornhövd et al.,2002; Büchel et al.,2002]. The pain threshold was determined in a separate training session on the day before the actual measurements by applying 30 CO2‐stimuli in the range from 20 to 50% v/v CO2 under otherwise identical conditions as in the main experiment, that is, the subjects were placed in the MRI‐scanner, and the blood oxygenation level dependent (BOLD) response to the CO2‐stimuli was recorded. This temporally dissociated threshold determination was considered to provide sufficient guidance in the selection of the individual stimuli and allowed to keep the actual experiment short avoiding that subjects suffered fatigue that might have confounded the results. The pain threshold was determined by means of logistic regression of the responses unnoticed and nonpainful, coded as “0,” or painful coded as “1.” The CO2 concentration at the pain threshold was 44.4 ± 3.0% v/v CO2 (mean ± standard deviation). Thus, subjects received CO2‐stimuli in a concentration range of 34–54 % v/v CO2 (median range; minimum range: 29–49%, maximum range: 40–60 %) at the main study occasion. The main experiments started with administration of three CO2 stimuli at individual pain threshold concentration to refamiliarize the subjects with the sensation. With each increase of the CO2‐concentration of 0.5% v/v, the odds to rate a stimulus as painful increased by 1.42 times (Odds ratio; 95% CI = 1.36–1.48; β(Concentration): 0.35 ± 0.02, P < 0.01; Model χ2(1) = 440.4; R 2 (Nagelkerkes) = 0.46). The average number of administered unnoticed, nonpainful, and painful stimuli was 12 ± 8, 26 ± 7, and 12 ± 5, respectively.
Functional Imaging
The BOLD response to the CO2 stimuli was recorded on a 3‐T magnetic resonance head scanner (Siemens Magnetom Allegra, Siemens Medical Solutions, Erlangen, Germany) equipped with a 4‐channel transmit‐receive head coil. The subjects' head was immobilized using foam pads. Using a T 2*‐weighted echo planar imaging (EPI) sequence [parallel imaging method: GRAPPA (reduction factor R = 2), repetition time 1530 ms, echo time 30 ms, flip angle 90°, matrix size 64 × 64, voxel size 3 × 3 × 3 mm3], 760 imaging volumes [29 axial slices (distance factor 40%) covering the whole brain] were acquired. Additionally, high resolution (voxel size 1 × 1 × 1 mm3) T 1‐weighted anatomical images were acquired for each subject using a three‐dimensional (3D) magnetization prepared rapid gradient echo sequence.
Functional magnetic resonance brain image processing and statistical analyses were done with the statistical parametric mapping software SPM8 (Wellcome Department of Imaging Neuroscience, London, UK; http://www.fil.ion.ucl.ac.uk/spm/[Friston,1995; Worsley and Friston,1995]). All volumes of the EPI sequence were corrected for slice timing and realigned to the first volume [Friston et al.,1995]. The high‐resolution T 1‐weighted anatomical image was coregistered to the mean‐EPI, segmented, and normalized using forth‐degree B‐spline interpolation. The resulting spatial normalization parameters were applied to the volumes of the EPI‐sequence, which were subsequently smoothed with an isotropic 8‐mm full‐width‐half‐maximum Gaussian kernel.
First‐level analysis used a general linear model [Friston,1995] to partition the observed neurophysiological responses into components of interest, confounds, and errors. An event‐related analysis estimated the BOLD responses evoked by the CO2 stimuli by modeling them as delta functions convolved with the canonical hemodynamic response function as implemented in SPM8.
CO2‐stimuli‐associated activations and deactivations, the latter also having been shown during painful stimulation [Kong et al.,2010], were analyzed in three steps. The first analysis aimed to ascertain that the painful CO2 stimuli activated the pain matrix as expected or led to deactivations of other brain regions. All painfully perceived CO2 stimuli were therefore modeled as a single regressor (“painful stimuli” regressor) in a categorical first‐level (single subject) design. The unnoticed and nonpainful stimuli were additionally modeled as separate regressors within the design matrix but omitted from the second level analysis. The second and main analysis aimed at separating effects exclusively related to pain perception from stimulus intensity related effects or other stimulus inherent effects. All CO2 stimuli were therefore modeled as a single regressor of interest (“CO2‐stimulus” regressor) in a parametric first‐level design. Three first‐order parametric regressors modulating the stick function, each orthogonalized with respect to the prior regressor, were added to the model in the order as follows (for a more detailed explanation of the regressor order, see Supporting Information): “stimulus intensity” (CO2 concentrations), “nonpainful perception” (Yes = 1/No = 0), and “painful perception” (Yes = 1/No = 0). This implemented a step‐down regression that allowed to categorize the pain‐related effects in (i) activations and deactivations occurring with each stimulus irrespective of its intensity and perception (“CO2 stimulus” regressor), (ii) activations or deactivations depending on the physical stimulus intensity irrespective of stimulus perception (stimulus intensity regressor), (iii) activations or deactivations occurring when the stimulus was perceived as nonpainful (nonpainful perception regressor), and (iv) activations or deactivations occurring exclusively when the stimulus was perceived as painful (painful perception regressor). The assumption that stimulus‐related brain activation increases linearly with increasing stimulus intensity regardless of its perception is based on reports of a linear relationship between the subjective intensity ratings and CO2 stimulus concentration in the present concentration range [Cain and Murphy,1980; Frasnelli et al.,2003; Lötsch et al.,1997b]. The unnoticed stimuli were not explicitly modeled and served as implicit baseline in the model. The third analysis was performed to illustrate the different relationships between the CO2 stimulus concentrations and the corresponding brain activations that led to the separation of the different regressors in the second analysis. Therefore, the 50 CO2 stimuli were arranged in 10 concentration regressors with each regressor representing the pooled activation of five CO2 stimuli in the range of 2% v/v CO2. Subsequently, the mean percent signal change associated with each concentration was calculated for a 5‐mm spherical search volume around selected peak coordinates determined for each regressor in the second analysis. This was done by means of the rfxplot‐toolbox [Gläscher,2009].
Additional regressors of no interest were modeled in each analysis within the design matrix including the first three CO2 stimuli administered for reacquaintance, the stimulus rating event and the six rotational and translational parameters from the rigid body transformation, obtained during image realignment. Low frequency fluctuations of the MR signal were removed with a high‐pass filter (1/128 s frequency cutoff). The serial autocorrelation of the BOLD time series was modeled using a first‐order autoregressive model. Voxelwise regression coefficients for all regressors were estimated using least squares within SPM8. After model estimation, the effects of interest were tested by using linear contrasts, generating statistical parametric maps for each subject.
The computed simple contrast maps derived from each participant were included in a random effects (RFX) analysis. Activations and deactivations associated with each regressor of interest were tested by means of simple positive (contrast weight: 1) and negative (contrast weight: −1) t‐contrasts, respectively. The resulting statistical parametric maps (SPMt) were interpreted with regard to the probabilistic behavior of Gaussian random fields [Worsley,1994]. Only voxels that were significant at the familywise error [Loring et al.,2002] corrected α level (P < 0.05) are reported. The localization of brain activations was aided by the anatomy toolbox, version 1.7, [Eickhoff et al.,2006,2007,2005]. Significant peak activations are reported as Montreal Neurological Institute coordinates (mm).
RESULTS
Activations associated with the painful stimuli at pooled suprathreshold intensities were found in brain regions repeatedly attributed to the pain matrix, mainly contralaterally to the stimulated nostril (first RFX‐analysis, painful stimuli regressor, t‐contrast weight: 1). Specifically, activation was observed in the secondary somatosensory cortex, the postcentral (SI) and precentral (MI) gyrus, the inferior frontal gyrus, and the supplementary motor area. In addition, the insula lobe and middle cingulate cortex were bilaterally activated (Fig. 1/Panel A, Table I).
Figure 1.
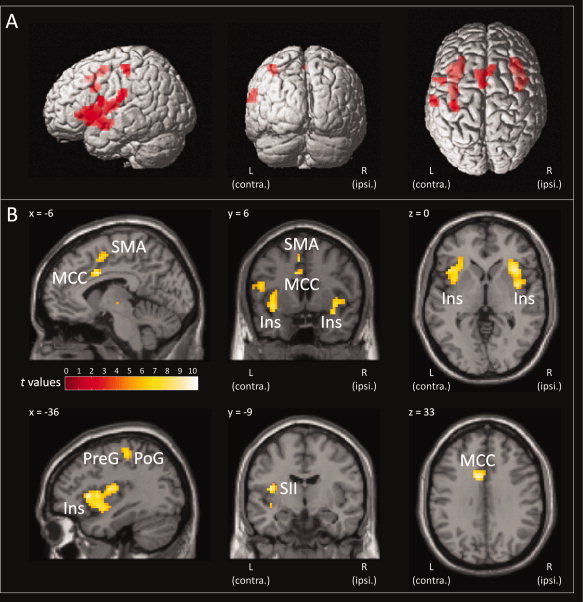
Brain regions activated by painful CO2 stimuli. The painful CO2 stimuli activated brain regions typically attributed to the pain matrix, including the insula lobe (Ins), secondary somatosensory cortex (SII), middle cingulate cortex (MCC), postcentral gyrus (PoG), precentral gyrus (PreG), inferior frontal gyrus, and the supplementary motor area (SMA). Statistically significantly activated voxels (P < 0.05 familywise error corrected) of the painful stimuli t‐contrast (contrast weight: 1) are presented overlaid (red) on 3D surface renderings of a standard Montreal Neurological Institute brain (Panel A) and as colored overlay on the three orthogonal views of a structural standard T 1‐weighted MRI template (Panel B; L, Left hemisphere, contralateral to the presentation of the painful stimuli; R, Right hemisphere). The color depth of the displayed voxels reflects the respective t value of the voxel. Results reflect a 24‐subject group analysis.
Table I.
Brain regions activated by painful CO2 stimuli
| Effect | Left hemispherea | Right hemisphere | ||||||
|---|---|---|---|---|---|---|---|---|
| Region | x | y | z | t value | x | y | z | t value |
| Activations during painful CO2 stimuli | ||||||||
| Insula lobe | −33 | 18 | 6 | 10.36 | 39 | 15 | −6 | 10.11 |
| Insula lobe | −36 | 9 | 3 | 8.81 | 33 | 24 | 3 | 9.29 |
| Insula lobe | −36 | 6 | −6 | 8.41 | 39 | −3 | 6 | 8.87 |
| Insula lobe | −39 | 3 | −9 | 8.37 | — | — | — | — |
| MCC | −9 | 9 | 33 | 9.82 | 6 | 15 | 45 | 7.34 |
| SII | −39 | −9 | 12 | 9.55 | — | — | — | — |
| Postcentral gyrus | −36 | −27 | 51 | 7.95 | — | — | — | — |
| Postcentral gyrus | −60 | −21 | 27 | 7.77 | — | — | — | — |
| Postcentral gyrus | −63 | −18 | 21 | 7.43 | — | — | — | — |
| Precentral gyrus | −51 | 3 | 18 | 8.35 | — | — | — | — |
| IFG | −60 | 6 | 15 | 6.53 | — | — | — | — |
| SMA | −6 | 6 | 51 | 7.46 | — | — | — | — |
Contralateral to the stimulus application side.
SII, secondary somatosensory cortex; MCC, Middle cingulate cortex; IFG, Inferior frontal gyrus; SMA, supplementary motor area.
The table contains the anatomic location of the voxels with highest voxel level t in the respective region of a 24‐subject group analysis. Reported voxels are thresholded at P < 0.05 familywise error (FWE) corrected. Coordinates are reported in MNI space.
The stimulus‐related activations observed in the pain matrix could be categorized in three different activation patterns (second RFX‐analysis): (i) activations occurring with each stimulus irrespective of its intensity and perception (CO2 stimulus regressor, t‐contrast weight: 1). This was observed bilaterally in the anterior insula and the supplementary motor area (Fig. 1/Panel B, Table II). (ii) Activations depending on the physical stimulus intensity irrespective of its perception (“stimulus intensity” regressor, t‐contrast weight: 1). This was observed in the majority of brain regions including the bilateral posterior insula and superior temporal gyri, the contralateral secondary somatosensory cortex, amygdala, parts of the postcentral gyrus, and the middle cingulate cortex. (iii) Activations occurring exclusively when the stimulus was perceived as painful (“painful perception” regressor, t‐contrast weight: 1). This was observed in only a small fraction of the pain matrix, mainly in the contralateral postcentral gyrus, precentral gyrus and middle insula, and in the ipsilateral putamen (Fig. 2). Exclusively nonpainful perception‐related activation (“nonpainful perception” regressor, t‐contrast weight: 1) was not observed.
Table II.
Brain regions activated by the CO2 stimulus irrespective of its intensity and corresponding perception, brain regions coding for stimulus intensity irrespective of the corresponding perception, and brain regions coding exclusively for pain perception
| Effect | Left hemispherea | Right hemisphere | ||||||
|---|---|---|---|---|---|---|---|---|
| Region | x | y | z | t value | x | y | z | t value |
| CO2‐stimulus‐related activation | ||||||||
| Insula lobe | −30 | 21 | 3 | 11.21 | 33 | 21 | 3 | 12.75 |
| Insula lobe | −33 | 18 | 0 | 10.84 | 39 | 0 | 3 | 7.52 |
| Insula lobe | −36 | 6 | −9 | 6.54 | — | — | — | — |
| SMA | −3 | 12 | 48 | 7.25 | 6 | 18 | 48 | 7.78 |
| SMA | — | — | — | — | 12 | 9 | 51 | 7.12 |
| Stimulus intensity‐related activation | ||||||||
| Insula lobe | −33 | −9 | 15 | 9.70 | 45 | 12 | −3 | 7.24 |
| Insula lobe | −36 | −3 | −6 | 8.54 | 51 | 9 | −3 | 6.94 |
| Superior temporal gyrus | −57 | −9 | 6 | 6.73 | 60 | 3 | 3 | 7.10 |
| SII | −45 | −18 | 21 | 7.65 | — | — | — | — |
| SII | −48 | 3 | 12 | 6.71 | — | — | — | — |
| Amygdala (LB) | −27 | 0 | −21 | 8.05 | — | — | — | — |
| Amygdala (SF) | −18 | 0 | −15 | 7.15 | — | — | — | — |
| Postcentral gyrus | −39 | −27 | 54 | 7.67 | — | — | — | — |
| Postcentral gyrus | −57 | −3 | 15 | 7.60 | — | — | — | — |
| Postcentral gyrus | −60 | −15 | 27 | 7.07 | — | — | — | — |
| Postcentral gyrus | −57 | −12 | 30 | 7.02 | — | — | — | — |
| Postcentral gyrus | −63 | −21 | 15 | 7.50 | — | — | — | — |
| MCC | 0 | 12 | 39 | 7.37 | — | — | — | — |
| Pain perception‐related activation | — | — | — | — | ||||
| Precentral gyrus | −39 | −24 | 60 | 8.14 | — | — | — | — |
| Postcentral gyrus | −39 | −33 | 57 | 7.12 | — | — | — | — |
| Insula lobe | −42 | 0 | 9 | 7.83 | — | — | — | — |
| Putamen | — | — | — | — | 33 | 3 | 9 | 6.83 |
Contralateral to the stimulus application side.
SII, secondary somatosensory cortex; MCC, Middle cingulate cortex; SMA, supplementary motor area.
The table contains the anatomic location of the voxels with highest voxel level t in the respective region of a 24‐subject group analysis. Reported voxels are thresholded at P < 0.05 family wise error (FWE) corrected. Coordinates are reported in MNI space.
Figure 2.
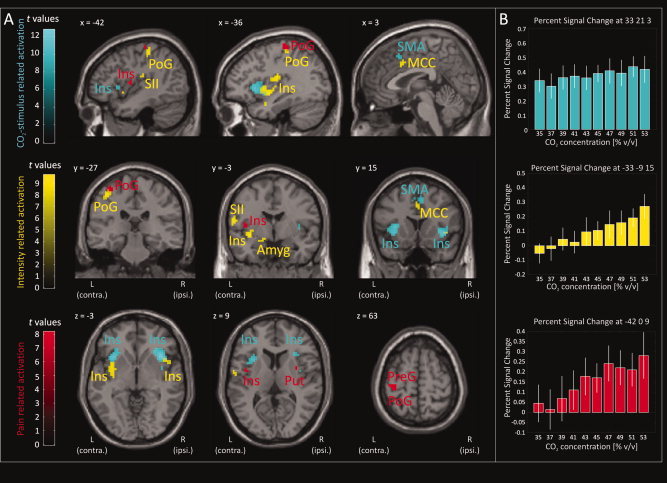
CO2‐stimulus related activation. Brain regions that were activated by the CO2‐stimulus irrespective of its intensity and perception (cyan areas; “CO2‐stimulus” regressor, t‐contrast weight: 1) included the anterior insula (Ins) and the supplementary motor area (SMA). Regions coding for stimulus intensity irrespective of its perception (yellow areas; “stimulus intensity” regressor, t‐contrast weight: 1) included the posterior insula, secondary somatosensory cortex (SII), amygdala (Amyg), postcentral gyrus (PoG), superior temporal gyrus (STG), middle cingulate cortex (MCC). Regions displaying exclusively pain perception related activation (red areas; “painful perception” regressor, t‐contrast weight: 1) included the postcentral gyrus, precentral gyrus (PreG), parts of the mid to posterior insula and the putamen (Put). In contrast, non‐painful stimulus perception was not associated with any specific brain activation (“non‐painful perception” regressor, t‐contrast weight: 1). Statistically significantly activated voxels (P < 0.05 familywise error corrected) are displayed as colored overlay on the three orthogonal views of a structural standard T 1‐weighted MRI template (Panel A; L, Left hemisphere, contralateral to the presentation of the painful stimuli; R, Right hemisphere). The color depth of the displayed voxels reflects the respective t value of the voxel. For each regressor, stimulus related brain activations corresponding to the different CO2‐concentrations are reported as mean percent signal change in a 5‐mm spherical search volume around selected familywise error‐corrected peak coordinates (Panel B; PSC: Colored bars; 90% CI: white error bars). Results reflect a 24‐subject group analysis.
The painful stimuli were further associated with deactivations in large areas of the brain (first RFX analysis, painful stimuli regressor, t‐contrast weight: −1). However, in contrast to the activations, all deactivations occurred with each stimulus irrespective of its intensity and perception (second RFX analysis, CO2 stimulus regressor, t‐contrast weight: −1). This was observed bilaterally in the fusiform gyrus, inferior occipital lobe, precuneus and rectal gyrus, contralaterally in the hippocampus, calcarine gyrus, posterior cingulate cortex, mid orbital gyrus, angular gyrus, middle temporal gyrus and middle frontal gyrus, ipsilateral in the lingual gyrus, thalamus, and superior medial gyrus (Fig. 3 and Table III).3
Figure 3.
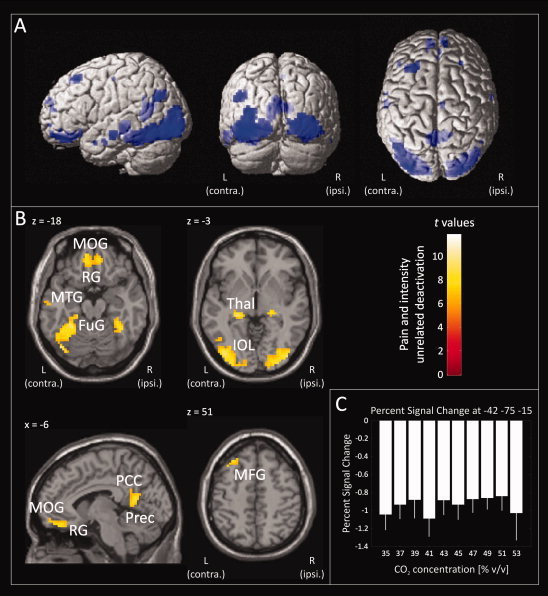
CO2‐stimulus‐related brain deactivation. Brain regions were deactivated irrespective of the stimulus intensity and perception (“CO2 stimulus” regressor, t‐contrast weight: −1). Deactivated regions included the fusiform gyrus (FuG), hippocampus (HipC), inferior occipital lobe (IOL), precuneus (Prec), posterior cingulate cortex (PCC), rectal gyrus (RG), mid orbital gyrus (MOG), thalamus (Thal), middle temporal gyrus (MTG), and middle frontal gyrus (MFG). Statistically significant deactivated voxels (P < 0.05 familywise error corrected) are presented overlaid (blue) on 3D surface renderings of a standard Montreal Neurological Institute brain (Panel A) and as colored overlay on the horizontal and sagittal plane of a structural standard T 1‐weighted MRI template (Panel B; L, Left hemisphere, contralateral to the presentation of the painful stimuli; R, Right hemisphere). The color depth of the displayed voxels reflects the respective t value of the voxel. Furthermore, stimulus related brain activations corresponding to the different CO2 concentrations are reported as mean percent signal change in a 5‐mm spherical search volume around a selected familywise error‐corrected peak coordinate (Panel C; PSC: Colored bars; 90% CI: white error bars). Results reflect a 24‐subject group analysis.
Table III.
Brain regions displaying a CO2‐stimulus‐associated deactivation that was not related to stimulus intensity or pain perception
| Effect | Left hemispherea | Right hemisphere | ||||||
|---|---|---|---|---|---|---|---|---|
| Region | x | y | z | t value | x | y | z | t value |
| Perception and intensity unrelated deactivation | ||||||||
| Fusiform gyrus | −42 | −75 | −15 | 11.77 | 39 | −51 | −15 | 8.92 |
| Fusiform gyrus | −27 | −45 | −18 | 9.49 | — | — | — | — |
| Fusiform gyrus | −27 | −51 | −12 | 9.32 | — | — | — | — |
| Fusiform gyrus | −36 | −51 | −12 | 9.09 | — | — | — | — |
| Hippocampus | −24 | −30 | −6 | 10.42 | — | — | — | — |
| Inferior occipital lobe | −33 | −90 | −6 | 9.62 | 36 | −84 | −12 | 10.27 |
| Inferior occipital lobe | — | — | — | — | 42 | −84 | −3 | 9.41 |
| Inferior occipital lobe | — | — | — | — | 27 | −87 | −12 | 9.14 |
| Inferior occipital lobe | — | — | — | — | 27 | −93 | −3 | 8.39 |
| Lingual gyrus | — | — | — | — | 24 | −90 | −9 | 8.61 |
| Precuneus | −6 | −57 | 15 | 8.63 | 9 | −51 | 18 | 7.89 |
| Calcarine gyrus | −9 | −51 | 6 | 8.43 | — | — | — | — |
| Posterior cingulate cortex | −3 | −51 | 27 | 6.58 | — | — | — | — |
| Rectal gyrus | −9 | 42 | −21 | 8.61 | 9 | 45 | −18 | 8.06 |
| Rectal gyrus | −9 | 51 | −18 | 7.74 | — | — | — | — |
| Mid orbital gyrus | −9 | 57 | −15 | 7.46 | — | — | — | — |
| Angular gyrus | −48 | −66 | 30 | 7.78 | — | — | — | — |
| Thalamus | — | — | — | — | 21 | −27 | 0 | 9.08 |
| Middle temporal gyrus | −60 | −15 | −12 | 7.73 | — | — | — | — |
| Middle frontal gyrus | −30 | 30 | 51 | 8.33 | — | — | — | — |
| Middle frontal gyrus | −27 | 27 | 54 | 8.17 | — | — | — | — |
| Superior medial gyrus | — | — | — | — | 9 | 57 | 18 | 6.8 |
Contralateral to the stimulus application side.
The table contains the anatomic location of the voxels with highest voxel level t in the respective region of a 24‐subject group analysis. Reported voxels are thresholded at P < 0.05 family wise error (FWE) corrected. Coordinates are reported in MNI space.
DISCUSSION
The painful CO2 stimuli evoked activations in a network of brain regions frequently regarded as the pain matrix [Apkarian et al.,2005; Peyron et al.,2000]. However, when separating brain activations with respect to the underlying activation pattern, only a small part of the pain matrix remained specifically associated with the perception of pain, whereas the major part reflected processing of stimulus intensity irrespective of stimulus perception and stimulus inherent processes that were neither related to stimulus intensity nor perception.
Only a small part of the pain matrix seems to be exclusively associated with the perception of pain. This included a small area in the contralateral part of the posterior insula, the postcentral gyrus, precentral gyrus, and ipsilateral putamen. Among these regions, an area in the posterior insula appears to provide sufficient neurophysiological properties for representing the qualitative change in stimulus evaluation occurring at the pain threshold. First, it is a major localization of pain‐related brain activation and has been frequently reported in this context [Boly et al.,2007; Bornhövd et al.,2002; Casey et al.,1994; Coghill et al.,1999; Coghill et al.,1994; Derbyshire et al.,1997; Talbot et al.,1991; Tölle et al.,1999]. Second, the insula is extensively connected to other brain regions such as the prefrontal cortex, cingulate cortex, amygdala, parahippocampal gyrus, and secondary somatosensory cortex [Friedman and Murray,1986; Friedman et al.,1986; Mesulam and Mufson,1982; Mufson and Mesulam,1982; Mufson et al.,1981]. It may therefore act as a relay integrating afferent nociceptive information with working memory, affect and attention, and may selectively gate nociceptive information at the cortical level to modulate varying levels of appreciation of the nociceptive stimulus [Starr et al.,2009]. Other reports substantiate this key role of the posterior insula for pain [Baliki et al.,2009; Frot et al.,2007], and it has been shown that pain can be induced by electrical stimulation of the insula [Mazzola et al.,2009].
The exclusively pain perception‐related activation of the postcentral and precentral gyri, and the putamen appears to be less likely to represent the qualitative component of pain as these areas are typical motor areas. Nevertheless, pain‐induced activation of motor areas has been repeatedly observed [Apkarian et al.,2000; Casey et al.,1996; Gelnar et al.,1999; Porro et al.,1998] and interpreted as the subjects attempt to terminate, reduce, or escape the presence of pain [Price,2000]. In this respect it is further notable that the posterior insula has been suggested to be involved in directing pain‐related motor responses [Henderson et al.,2007]. The putamen has been associated with immediate defense and withdrawal behavior from potential noxious external influence [Bingel et al.,2004,2002]. Pain exclusive activation of the postcentral and precentral gyrus, however, was observed in the hand region of the body [Moore et al.,2000] hinting in the present context at a connection with the experimental rating task because it has not been observed when applying the CO2 stimuli without a subsequent rating task [Oertel et al.,2008]. It may reflect the subject's instantaneous certainty about the painful stimulus quality and the associated urge to press the painful button, which has been shown to activate the precentral gyrus even when movement was only imagined and not executed [Porro et al.,1996]. However, it should be noted that motor activity and pain may be closely associated, especially when pain is produced by muscle contraction as in the human experimental model involving the RIII reflex [Willer,1997], which has been shown by means of fMRI [Peyron et al.,2007]. In addition, activation of brain motor areas is correlated with pain intensity [Bornhövd et al.,2002; Coghill et al.,1999], which further draws the attention to activation of motor areas as possible not pain specific confounders.
In contrast to the small areas displaying exclusively pain perception‐related activation, in the majority of brain regions regarded as the pain matrix activation correlated with the physical stimulus intensity irrespective of pain perception. This was observed in middle and posterior parts of the insula, SII, SI, the amygdala, and the midcingulate cortex. These regions are associated with processing sensory (posterior insula, SII, SI) or affective (amygdala, midcingulate cortex) stimulus information [Coghill et al.,1999; Schneider et al.,2001; Vogt,2005] suggesting that a nonpainful nociceptive stimulus is primarily assessed quantitatively with regard to its sensory intensity and unpleasantness. It has recently been shown that these regions asses not only the magnitude of nociceptive stimuli but also of stimuli of various modalities, for example, auditory or visual stimuli [Baliki et al.,2009; Downar et al.,2000; Mouraux and Iannetti,2009] and that activation in these regions correlated with the saliency of the activating stimulus, that is, its ability to capture attention [Iannetti et al.,2008; Mouraux and Iannetti,2009]. These and our results suggest that major parts of the so called pain matrix represent primarily a sensory matrix that is not specifically coding for pain.
The remaining activations observed during the painful CO2 stimuli were associated with the stimulus irrespective of its intensity and perception. This included the anterior insula and supplementary motor area. The anterior insula has been shown to be activated by a multitude of interoceptive stimuli including pain [Craig,2009] and has been suggested to be the “neural correlate of consciousness” [Christensen et al.,2006] or the “neuronal correlate of awareness” [Craig,2009]. Pain‐related activation of the anterior insula was significantly attenuated when subjects were distracted from pain [Brooks et al.,2002; Craig et al.,2000] or did not have to rate the pain intensity [Schoedel et al.,2008]. The presently observed activation of the insula with each stimulus is therefore probably related to the subjects' attention required to fulfill the subsequent rating task. The anterior insula nevertheless is thought to be a key area of pain. Its pre‐(pain)‐stimulus functional connectivity with the brainstem periaqueductal gray recently has been shown to determine whether a noxious event is perceived as painful or not and to be modulated by pain‐relevant personality traits [Ploner et al.,2010]. The supplementary motor area on the other hand plays an important role in the organization of movement [Cunnington et al.,2006] and therefore probably reflects the subjects preparation for the subsequent button press related to the rating task. Activations of both areas, however, are not pain exclusive although having been observed in many pain investigations [Apkarian et al.,2005; Peyron et al.,2000].
The painful CO2 stimuli were also associated with brain deactivations. These were mainly observed in regions attributed to the core regions of the “default mode network” (DMN) [Buckner et al.,2008] including the posterior cingulate cortex, precuneus, hippocampus, angular gyrus, middle temporal gyrus, and mid orbital gyrus. However, deactivations also occurred in brain regions not primarily associated with the DMN including the inferior occipital lobe, calcarine gyrus, fusiform gyrus, lingual gyrus, rectal gyrus, middle frontal gyrus, and superior medial gyrus and the thalamus. The DMN is suggested to be activated when subjects are left to think to themselves and deactivated during the execution of goal‐oriented behaviors [Buckner et al.,2008]. The present deactivations occurred for all CO2 stimuli and were not exclusively related to pain perception or stimulus intensity. They therefore probably reflect a sensory filter, which is switched off to allow for conscious stimulus perception. Recently, it has been shown that deactivations decreased with increasing pain intensity [Kong et al.,2010], which might indicate a protective function of this network that has presently not come into play because only slightly painful stimuli were applied. However, this is only a hypothesis and whether all deactivated regions act as sensory filter needs further clarification because other investigations have shown that pain stimulus‐related deactivation depended on the stimulated tissue, that is, the signal intensity in the perigenual anterior cingulate cortex decreased during muscle but not cutaneous pain [Henderson et al.,2007; Svensson et al.,1997].
Looking through the published literature, reports of experiments can be found that use different approaches to investigate the different activation patterns underlying pain processing. For example, there are two fMRI studies that applied laser stimuli of graded intensity defined implicitly as either nonpainful or painful and subsequently identified brain regions coding for either stimulus perception, stimulus intensity, or pain intensity by fitting different stimulus response functions to the BOLD responses [Bornhövd et al.,2002; Büchel et al.,2002]. Thus, they found that activation of SII, the anterior insula, parts of the cingulate cortex, and the amygdala correlated with pain intensity instead of stimulus intensity as shown here. However, another study applying the same stimulus while taking intracranial recordings of evoked potentials showed concordantly that activation in the posterior insula coded for pain intensity but, in contrast, activation in SII correlated with stimulus intensity in the nonpainful and the painful range [Frot et al.,2007], which is similar to our results. In contrast to these reports, only binary pain ratings were acquired in the current study, which did thus not allow for separating between stimulus intensity‐ and pain intensity‐related activation increases. However, such approach was adequate because we primarily aimed at identifying brain regions coding specifically for the change of the perception quality from nonpainful to painful. Activations in response to the stimulus intensity or other stimulus inherent effects were therefore statistically controlled for. Thus, the present experiment complements available fMRI data on pain by using a unique experimental design, which allowed for this separation. The only real discrepancy to previously published data is the presently observed stimulus inherent constant activation of the anterior insula, which has previously been found to correlate with pain intensity [Bornhövd et al.,2002]. A possible explanation for this discrepancy may be related to differences in the experimental design across studies, for example, different pain stimuli displayed different activation and deactivation patterns that further depended on the stimulated tissue, that is, whether it originated from cutaneous or muscle tissue [Helmchen et al.,2008; Henderson et al.,2007; Svensson et al.,1997]. Most fMRI studies on pain used painful thermal or laser stimulation of cutaneous tissue [Apkarian et al.,2005]. The presently used pain model and application site provides, therefore, additional new information to the already available fMRI data on pain processing.
A potential problem of the current study was the comparably lower probability of “painful” stimuli (24% of the total number of applied stimuli). Infrequent innocuous and noxious sensory stimuli, in contrast to frequent stimuli, were shown to increase EEG‐derived event‐related brain potentials [Legrain et al.,2002] and also fMRI‐derived BOLD responses [Menon et al.,1997]. This is usually observed when applying the stimuli according to an oddball paradigm. In contrast, in the present study, painful and nonpainful stimuli were mixed in a way that was similar to the succession of clearly distinguished suprathreshold CO2 stimuli (55% v/v CO2, n = 8; 60%, n = 16; 65%, n = 16) applied in previous studies on effects of analgesics on event‐related brain potentials [Hummel et al.,1995; Lötsch et al.,1997a]. In these studies, infrequent stimuli were not accompanied by increased P300 amplitudes or other EEG signs of rareness processing.
The present results suggest that a potentially noxious stimulus is gated to the brain by deactivations in brain regions that had been labeled DMN. It reaches brain structures known as the pain matrix including areas processing qualitative information about sensory and affective dimensions of the stimulus. Although the most parts of the pain matrix represent quantitative processing of sensory input or stimulus inherent processes not specific for pain, the qualitative change in processing of potentially noxious stimuli at the pain threshold, where they become painful, is restricted to the posterior insular cortex. The results therefore suggest a focus on the posterior insular cortex to target pain.
Supporting information
Additional Supporting Information may be found in the online version of this article.
Supporting Figure
Acknowledgements
Bundesministerium für Bildung und Forschung (DLR 01GO0203; CP, RD) for support of the fMRI equipment.
REFERENCES
- Apkarian AV, Gelnar PA, Krauss BR, Szeverenyi NM ( 2000): Cortical responses to thermal pain depend on stimulus size: a functional MRI study. J Neurophysiol 83: 3113–3122. [DOI] [PubMed] [Google Scholar]
- Apkarian AV, Bushnell MC, Treede RD, Zubieta JK ( 2005): Human brain mechanisms of pain perception and regulation in health and disease. Eur J Pain 9: 463–484. [DOI] [PubMed] [Google Scholar]
- Baliki MN, Geha PY, Apkarian AV ( 2009): Parsing pain perception between nociceptive representation and magnitude estimation. J Neurophysiol 101: 875–887. [DOI] [PMC free article] [PubMed] [Google Scholar]
- Bingel U, Quante M, Knab R, Bromm B, Weiller C, Buchel C ( 2002): Subcortical structures involved in pain processing: evidence from single‐trial fMRI. Pain 99: 313–321. [DOI] [PubMed] [Google Scholar]
- Bingel U, Glascher J, Weiller C, Büchel C ( 2004): Somatotopic representation of nociceptive information in the putamen: An event‐related fMRI study. Cereb Cortex 14: 1340–1345. [DOI] [PubMed] [Google Scholar]
- Boly M, Balteau E, Schnakers C, Degueldre C, Moonen G, Luxen A, Phillips C, Peigneux P, Maquet P, Laureys S ( 2007): Baseline brain activity fluctuations predict somatosensory perception in humans. Proc Natl Acad Sci USA 104: 12187–12192. [DOI] [PMC free article] [PubMed] [Google Scholar]
- Bornhövd K, Quante M, Glauche V, Bromm B, Weiller C, Büchel C ( 2002): Painful stimuli evoke different stimulus‐response functions in the amygdala, prefrontal, insula and somatosensory cortex: A single‐trial fMRI study. Brain 125( Pt 6): 1326–1336. [DOI] [PubMed] [Google Scholar]
- Brooks JC, Nurmikko TJ, Bimson WE, Singh KD, Roberts N ( 2002): fMRI of thermal pain: Effects of stimulus laterality and attention. Neuroimage 15: 293–301. [DOI] [PubMed] [Google Scholar]
- Büchel C, Bornhövd K, Quante M, Glauche V, Bromm B, Weiller C ( 2002): Dissociable neural responses related to pain intensity, stimulus intensity, and stimulus awareness within the anterior cingulate cortex: A parametric single‐trial laser functional magnetic resonance imaging study. J Neurosci 22: 970–976. [DOI] [PMC free article] [PubMed] [Google Scholar]
- Buckner RL, Andrews‐Hanna JR, Schacter DL ( 2008): The brain's default network: Anatomy, function, and relevance to disease. Ann N Y Acad Sci 1124: 1–38. [DOI] [PubMed] [Google Scholar]
- Cain WS, Murphy C ( 1980): Interaction between chemoreceptive modalities of odour and irritation. Nature 284: 255–257. [DOI] [PubMed] [Google Scholar]
- Casey KL, Minoshima S, Berger KL, Koeppe RA, Morrow TJ, Frey KA ( 1994): Positron emission tomographic analysis of cerebral structures activated specifically by repetitive noxious heat stimuli. J Neurophysiol 71: 802–807. [DOI] [PubMed] [Google Scholar]
- Casey KL, Minoshima S, Morrow TJ, Koeppe RA ( 1996): Comparison of human cerebral activation pattern during cutaneous warmth, heat pain, and deep cold pain. J Neurophysiol 76: 571–581. [DOI] [PubMed] [Google Scholar]
- Christensen MS, Ramsoy TZ, Lund TE, Madsen KH, Rowe JB ( 2006): An fMRI study of the neural correlates of graded visual perception. Neuroimage 31: 1711–1725. [DOI] [PubMed] [Google Scholar]
- Coghill RC, Talbot JD, Evans AC, Meyer E, Gjedde A, Bushnell MC, Duncan GH ( 1994): Distributed processing of pain and vibration by the human brain. J Neurosci 14: 4095–4108. [DOI] [PMC free article] [PubMed] [Google Scholar]
- Coghill RC, Sang CN, Maisog JM, Iadarola MJ ( 1999): Pain intensity processing within the human brain: a bilateral, distributed mechanism. J Neurophysiol 82: 1934–1943. [DOI] [PubMed] [Google Scholar]
- Craig AD ( 2009): How do you feel—Now? The anterior insula and human awareness. Nat Rev Neurosci 10: 59–70. [DOI] [PubMed] [Google Scholar]
- Craig AD, Chen K, Bandy D, Reiman EM ( 2000): Thermosensory activation of insular cortex. Nat Neurosci 3: 184–90. [DOI] [PubMed] [Google Scholar]
- Cunnington R, Windischberger C, Robinson S, Moser E ( 2006): The selection of intended actions and the observation of others' actions: A time‐resolved fMRI study. Neuroimage 29: 1294–1302. [DOI] [PubMed] [Google Scholar]
- Dale AM ( 1999): Optimal experimental design for event‐related fMRI. Hum Brain Mapp 8: 109–114. [DOI] [PMC free article] [PubMed] [Google Scholar]
- Derbyshire SW, Jones AK, Gyulai F, Clark S, Townsend D, Firestone LL ( 1997): Pain processing during three levels of noxious stimulation produces differential patterns of central activity. Pain 73: 431–445. [DOI] [PubMed] [Google Scholar]
- Downar J, Crawley AP, Mikulis DJ, Davis KD ( 2000): A multimodal cortical network for the detection of changes in the sensory environment. Nat Neurosci 3: 277–283. [DOI] [PubMed] [Google Scholar]
- Eickhoff SB, Stephan KE, Mohlberg H, Grefkes C, Fink GR, Amunts K, Zilles K ( 2005): A new SPM toolbox for combining probabilistic cytoarchitectonic maps and functional imaging data. Neuroimage 25: 1325–1335. [DOI] [PubMed] [Google Scholar]
- Eickhoff SB, Heim S, Zilles K, Amunts K ( 2006): Testing anatomically specified hypotheses in functional imaging using cytoarchitectonic maps. Neuroimage 32: 570–582. [DOI] [PubMed] [Google Scholar]
- Eickhoff SB, Paus T, Caspers S, Grosbras MH, Evans AC, Zilles K, Amunts K ( 2007): Assignment of functional activations to probabilistic cytoarchitectonic areas revisited. Neuroimage 36: 511–521. [DOI] [PubMed] [Google Scholar]
- Frasnelli J, Lötsch J, Hummel T ( 2003): Event‐related potentials to intranasal trigeminal stimuli change in relation to stimulus concentration and stimulus duration. J Clin Neurophysiol 20: 80–86. [DOI] [PubMed] [Google Scholar]
- Friedman DP, Murray EA ( 1986): Thalamic connectivity of the second somatosensory area and neighboring somatosensory fields of the lateral sulcus of the macaque. J Comp Neurol 252: 348–373. [DOI] [PubMed] [Google Scholar]
- Friedman DP, Murray EA, O'Neill JB, Mishkin M ( 1986): Cortical connections of the somatosensory fields of the lateral sulcus of macaques: Evidence for a corticolimbic pathway for touch. J Comp Neurol 252: 323–347. [DOI] [PubMed] [Google Scholar]
- Friston KJ ( 1995): Commentary and opinion: II. Statistical parametric mapping: ontology and current issues. J Cerebr Blood Flow Metab 15: 361–370. [DOI] [PubMed] [Google Scholar]
- Friston KJ, Ashburner J, Frith CD, Poline JB, Heather JD, Frackowiak RS ( 1995): Spatial registration and normalization of images. Hum Brain Mapp 3: 165–189. [Google Scholar]
- Frot M, Magnin M, Mauguiere F, Garcia‐Larrea L ( 2007): Human SII and posterior insula differently encode thermal laser stimuli. Cereb Cortex 17: 610–620. [DOI] [PubMed] [Google Scholar]
- Gelnar PA, Krauss BR, Sheehe PR, Szeverenyi NM, Apkarian AV ( 1999): A comparative fMRI study of cortical representations for thermal painful, vibrotactile, and motor performance tasks. Neuroimage 10: 460–482. [DOI] [PubMed] [Google Scholar]
- Gläscher J ( 2009): Visualization of group inference data in functional neuroimaging. Neuroinformatics 7: 73–82. [DOI] [PubMed] [Google Scholar]
- Helmchen C, Mohr C, Roehl M, Bingel U, Lorenz J, Buchel C ( 2008): Common neural systems for contact heat and laser pain stimulation reveal higher‐level pain processing. Hum Brain Mapp 29: 1080–1091. [DOI] [PMC free article] [PubMed] [Google Scholar]
- Henderson LA, Gandevia SC, Macefield VG ( 2007): Somatotopic organization of the processing of muscle and cutaneous pain in the left and right insula cortex: A single‐trial fMRI study. Pain 128: 20–30. [DOI] [PubMed] [Google Scholar]
- Huang CW, Tzeng JN, Chen YJ, Tsai WF, Chen CC, Sun WH ( 2007): Nociceptors of dorsal root ganglion express proton‐sensing G‐protein‐coupled receptors. Mol Cell Neurosci 36: 195–210. [DOI] [PubMed] [Google Scholar]
- Hummel T, Gruber M, Pauli E, Kobal G ( 1994): Chemo‐somatosensory event‐related potentials in response to repetitive painful chemical stimulation of the nasal mucosa. Electroencephalogr Clin Neurophysiol 92: 426–432. [DOI] [PubMed] [Google Scholar]
- Hummel T, Kraetsch HG, Lötsch J, Hepper M, Liefhold J, Kobal G ( 1995): Comparison of the effects of dihydrocodeine and tramadol when adiministered either in the morning or in the evening. Chronobiol Int 12: 62–72. [DOI] [PubMed] [Google Scholar]
- Iannetti GD, Hughes NP, Lee MC, Mouraux A ( 2008): Determinants of laser‐evoked EEG responses: Pain perception or stimulus saliency? J Neurophysiol 100: 815–828. [DOI] [PMC free article] [PubMed] [Google Scholar]
- Kobal G ( 1981): Elektrophysiologische Untersuchungen des menschlichen Geruchsinnes. Stuttgart: Thieme‐Verlag. [Google Scholar]
- Kobal G ( 1985): Pain‐related electrical potentials of the human nasal mucosa elicited by chemical stimulation. Pain 22: 151–163. [DOI] [PubMed] [Google Scholar]
- Kong J, Loggia ML, Zyloney C, Tu P, Laviolette P, Gollub RL ( 2010): Exploring the brain in pain: Activations, deactivations and their relation. Pain 148: 257–267. [DOI] [PMC free article] [PubMed] [Google Scholar]
- Kupers R, Kehlet H ( 2006): Brain imaging of clinical pain states: A critical review and strategies for future studies. Lancet Neurol 5: 1033–1044. [DOI] [PubMed] [Google Scholar]
- Legrain V, Guerit JM, Bruyer R, Plaghki L ( 2002): Attentional modulation of the nociceptive processing into the human brain: Selective spatial attention, probability of stimulus occurrence, and target detection effects on laser evoked potentials. Pain 99: 21–39. [DOI] [PubMed] [Google Scholar]
- Loring DW, Meador KJ, Allison JD, Pillai JJ, Lavin T, Lee GP, Balan A, Dave V ( 2002): Now you see it, now you don't: statistical and methodological considerations in fMRI. Epilepsy Behav 3: 539–547. [DOI] [PubMed] [Google Scholar]
- Lötsch J, Kobal G, Stockmann A, Brune K, Geisslinger G ( 1997a): Lack of analgesic activity of morphine‐6‐glucuronide after short‐term intravenous administration in healthy volunteers. Anesthesiology 87: 1348–1358. [DOI] [PubMed] [Google Scholar]
- Lötsch J, Marchl R, Kobal G ( 1997b): The influence of stimulus duration on the reliability of pain ratings after nociceptive stimulation of the nasal mucosa with CO2 . Eur J Pain 1: 207–213. [DOI] [PubMed] [Google Scholar]
- Mazzola L, Isnard J, Peyron R, Guenot M, Mauguiere F ( 2009): Somatotopic organization of pain responses to direct electrical stimulation of the human insular cortex. Pain 146: 99–104. [DOI] [PubMed] [Google Scholar]
- Menon V, Ford JM, Lim KO, Glover GH, Pfefferbaum A ( 1997): Combined event‐related fMRI and EEG evidence for temporal‐parietal cortex activation during target detection. Neuroreport 8: 3029–3037. [DOI] [PubMed] [Google Scholar]
- Mesulam MM, Mufson EJ ( 1982): Insula of the old world monkey. III: Efferent cortical output and comments on function. J Comp Neurol 212: 38–52. [DOI] [PubMed] [Google Scholar]
- Moore CI, Stern CE, Corkin S, Fischl B, Gray AC, Rosen BR, Dale AM ( 2000): Segregation of somatosensory activation in the human rolandic cortex using fMRI. J Neurophysiol 84: 558–569. [DOI] [PubMed] [Google Scholar]
- Mouraux A, Iannetti GD ( 2009): Nociceptive laser‐evoked brain potentials do not reflect nociceptive‐specific neural activity. J Neurophysiol 101: 3258–3269. [DOI] [PubMed] [Google Scholar]
- Mufson EJ, Mesulam MM ( 1982): Insula of the old world monkey. II: Afferent cortical input and comments on the claustrum. J Comp Neurol 212: 23–37. [DOI] [PubMed] [Google Scholar]
- Mufson EJ, Mesulam MM, Pandya DN ( 1981): Insular interconnections with the amygdala in the rhesus monkey. Neuroscience 6: 1231–1248. [DOI] [PubMed] [Google Scholar]
- Oertel BG, Preibisch C, Wallenhorst T, Hummel T, Geisslinger G, Lanfermann H, Lötsch J ( 2008): Differential opioid action on sensory and affective cerebral pain processing. Clin Pharmacol Ther 83: 577–588. [DOI] [PubMed] [Google Scholar]
- Peyron R, Laurent B, Garcia‐Larrea L ( 2000): Functional imaging of brain responses to pain. A review and meta‐analysis. Neurophysiol Clin 30: 263–288. [DOI] [PubMed] [Google Scholar]
- Peyron R, Kupers R, Jehl JL, Garcia‐Larrea L, Convers P, Barral FG, et al. ( 2007): Central representation of the RIII flexion reflex associated with overt motor reaction: an fMRI study. Neurophysiol Clin 37: 249–259. [DOI] [PubMed] [Google Scholar]
- Ploner M, Lee MC, Wiech K, Bingel U, Tracey I ( 2010): Prestimulus functional connectivity determines pain perception in humans. Proc Natl Acad Sci USA 107: 355–360. [DOI] [PMC free article] [PubMed] [Google Scholar]
- Porro CA, Francescato MP, Cettolo V, Diamond ME, Baraldi P, Zuiani C, Bazzocchi M, di Prampero PE ( 1996): Primary motor and sensory cortex activation during motor performance and motor imagery: A functional magnetic resonance imaging study. J Neurosci 16: 7688–7698. [DOI] [PMC free article] [PubMed] [Google Scholar]
- Porro CA, Cettolo V, Francescato MP, Baraldi P ( 1998): Temporal and intensity coding of pain in human cortex. J Neurophysiol 80: 3312–3320. [DOI] [PubMed] [Google Scholar]
- Price DD ( 2000): Psychological and neural mechanisms of the affective dimension of pain. Science 288: 1769–1772. [DOI] [PubMed] [Google Scholar]
- Schneider F, Habel U, Holthusen H, Kessler C, Posse S, Muller‐Gartner HW, Arndt JO ( 2001): Subjective ratings of pain correlate with subcortical‐limbic blood flow: An fMRI study. Neuropsychobiology 43: 175–185. [DOI] [PubMed] [Google Scholar]
- Schoedel AL, Zimmermann K, Handwerker HO, Forster C ( 2008): The influence of simultaneous ratings on cortical BOLD effects during painful and non‐painful stimulation. Pain 135: 131–141. [DOI] [PubMed] [Google Scholar]
- Starr CJ, Sawaki L, Wittenberg GF, Burdette JH, Oshiro Y, Quevedo AS, Coghill RC ( 2009): Roles of the insular cortex in the modulation of pain: Insights from brain lesions. J Neurosci 29: 2684–2694. [DOI] [PMC free article] [PubMed] [Google Scholar]
- Steen KH, Reeh PW, Anton F, Handwerker HO ( 1992): Protons selectively induce lasting excitation and sensitization to mechanical stimulation of nociceptors in rat skin, in vitro. J Neurosci 12: 86–95. [DOI] [PMC free article] [PubMed] [Google Scholar]
- Svensson P, Minoshima S, Beydoun A, Morrow TJ, Casey KL ( 1997): Cerebral processing of acute skin and muscle pain in humans. J Neurophysiol 78: 450–460. [DOI] [PubMed] [Google Scholar]
- Talbot JD, Marrett S, Evans AC, Meyer E, Bushnell MC, Duncan GH ( 1991): Multiple representations of pain in human cerebral cortex. Science 251: 1355–1358. [DOI] [PubMed] [Google Scholar]
- Tölle TR, Kaufmann T, Siessmeier T, Lautenbacher S, Berthele A, Munz F, Zieglgänsberger W, Willoch F, Schwaiger M, Conrad B, Bartenstein P ( 1999): Region‐specific encoding of sensory and affective components of pain in the human brain: A positron emission tomography correlation analysis. Ann Neurol 45: 40–47. [DOI] [PubMed] [Google Scholar]
- Ugawa S, Ueda T, Yamamura H, Nagao M, Shimada S ( 2005): Coexpression of vanilloid receptor subtype‐1 and acid‐sensing ion channel genes in the human trigeminal ganglion neurons. Chem Senses 30( Suppl 1): i195. [DOI] [PubMed] [Google Scholar]
- Vogt BA ( 2005): Pain and emotion interactions in subregions of the cingulate gyrus. Nat Rev Neurosci 6: 533–544. [DOI] [PMC free article] [PubMed] [Google Scholar]
- Willer JC ( 1997): Comparative study of perceived pain and nociceptive flexion reflex in man. Pain 3: 69–80. [DOI] [PubMed] [Google Scholar]
- Worsley KJ ( 1994): Local maxima and the expected euler characteristic of excursion sets of χ2, F and t fields. Adv Appl Prob 26: 13–42. [Google Scholar]
- Worsley KJ, Friston KJ ( 1995): Analysis of fMRI time‐series revisited—Again. Neuroimage 2: 173–181. [DOI] [PubMed] [Google Scholar]
Associated Data
This section collects any data citations, data availability statements, or supplementary materials included in this article.
Supplementary Materials
Additional Supporting Information may be found in the online version of this article.
Supporting Figure