Abstract
Constrained spherical deconvolution (CSD) is a new technique that, based on high‐angular resolution diffusion imaging (HARDI) MR data, estimates the orientation of multiple intravoxel fiber populations within regions of complex white matter architecture, thereby overcoming the limitations of the widely used diffusion tensor imaging (DTI) technique. One of its main applications is fiber tractography. The noisy nature of diffusion‐weighted (DW) images, however, affects the estimated orientations and the resulting fiber trajectories will be subject to uncertainty. The impact of noise can be large, especially for HARDI measurements, which employ relatively high b‐values. To quantify the effects of noise on fiber trajectories, probabilistic tractography was introduced, which considers multiple possible pathways emanating from one seed point, taking into account the uncertainty of local fiber orientations. In this work, a probabilistic tractography algorithm is presented based on CSD and the residual bootstrap. CSD, which provides accurate and precise estimates of multiple fiber orientations, is used to extract the local fiber orientations. The residual bootstrap is used to estimate fiber tract probability within a clinical time frame, without prior assumptions about the form of uncertainty in the data. By means of Monte Carlo simulations, the performance of the CSD fiber pathway uncertainty estimator is measured in terms of accuracy and precision. In addition, the performance of the proposed method is compared to state‐of‐the‐art DTI residual bootstrap tractography and to an existing probabilistic CSD tractography algorithm using clinical DW data. Hum Brain Mapp, 2011. © 2010 Wiley‐Liss, Inc.
Keywords: MRI, high‐angular resolution diffusion imaging (HARDI), spherical deconvolution, diffusion tensor imaging (DTI), residual bootstrap, probabilistic fiber tractography
INTRODUCTION
Diffusion‐weighted (DW) MRI is a unique and noninvasive method to characterize tissue microstructure, based on the random thermal motion of water molecules [Stejskal and Tanner,1965]. Within the brain white matter, fiber orientations can be extracted from the DW signal, opening up the possibility of investigating brain connectivity in vivo using so called fiber tracking algorithms [Mori and van Zijl,2002]. The ability to track the white matter pathways of the whole brain from a single in vivo scan raises possibilities for clinical applications and there has been a rapid increase in publications using fiber tractography in clinical studies [Ciccarelli et al.,2008; Johansen‐Berg and Behrens,2006].
Currently, diffusion tensor imaging (DTI) is most commonly used to extract fiber orientations from the DW signal [Basser et al.,1994a,b]. However, in voxels containing multiple fiber orientations, this model has been shown to be inadequate [Alexander et al.,2002; Frank,2001,2002; Tuch et al.,2002]. Such voxels occur frequently throughout the white matter due to partial volume effects between adjacent tracts. A recent study estimated that a third of the white matter voxels contain complex fiber architecture [Behrens et al.,2007]. This has important implications for fiber tractography, as most white matter tracts will traverse regions with multiple fiber orientations at some point along their path. In such regions, the orientation extracted from the diffusion tensor is unreliable and may cause false negatives, in which tracking terminates [Behrens et al.,2007], or false positives, in which tracking switches to an unrelated adjacent tract [Pierpaoli et al.,2001].
To address the limitations of the DTI model, a number of approaches have recently been proposed based on high‐angular resolution diffusion imaging (HARDI) [Anderson,2005; Behrens et al.,2007; Dell'Acqua et al.,2007; Descoteaux et al.,2007; Hosey et al.,2005; Jansons and Alexander,2003; Ozarslan et al.,2006; Tuch et al.,2002; Tuch,2004]. One of these methods, constrained spherical deconvolution (CSD), is especially promising as it can offer a reliable reconstruction of fiber orientation distribution (FOD) functions within clinically feasible acquisition settings [Tournier et al.,2004,2007]. CSD is capable of estimating the FOD within each voxel directly from the HARDI data, using the concept of spherical deconvolution. Recent studies, using both simulations and phantom data, have shown that CSD is able to resolve narrow interfiber angles [Tournier et al.,2007,2008].
While HARDI techniques offer an improved estimate of fiber orientations in the presence of partial volume effects, DW‐MRI is inherently a noisy technique, resulting in uncertainty associated with each fiber orientation estimate. This uncertainty is especially important in the context of fiber tractography. Previous DTI studies have shown that measurement uncertainty can propagate errors in streamlines [Lazar and Alexander,2003]. To take this uncertainty into account, probabilistic tractography algorithms were proposed, which assign a probability to the reconstructed pathways by considering multiple pathways emanating from the same seed point. Random vector generation, for example [Lazar and Alexander,2002; Parker et al.,2003], relates the probability of a tract to the number of times it is reconstructed in a Monte Carlo random walk, where the characteristics of the random walk are determined by the properties of the underlying diffusion tensor. In voxels where there is no anisotropy, the generated vector is completely random. In anisotropic regions, the orientation probability is skewed to the axis of longest diffusion. Similar methods were developed for HARDI‐based reconstruction methods where the characteristics of the random walk are determined by the shape of the underlying orientation distribution functions (ODFs). Some of these methods sample directly from the ODF [Campbell et al.,2005; Descoteaux et al.,2009; Perrin et al.,2005; Tournier et al.,2005]. Other methods first map the ODF parameters to the parameters of another distribution and take samples from this distribution during probabilistic tractography in an attempt to better model the underlying anatomy [Seunarine et al.,2007]. These approaches, however, have an important drawback: they assume an ad hoc relationship between the shape of the diffusion profile and the uncertainty in local fiber orientation. A more rigorous approach computes the local fiber orientation uncertainty given the MR data using a Bayesian model [Behrens et al.,2003,2007]. While this method is theoretically sound, it still requires the uncertainty to be modeled and it does not account for artifacts such as physiological noise and system instabilities.
An alternative to the ad hoc methods is to use the bootstrap method. This is a nonparametric statistical procedure that enables one to estimate the uncertainty of a given statistic, by randomly selecting individual measurements, with replacement, from a set of repeated measurements, thus generating many bootstrap realizations of the data. Each realization provides a random estimate of a given statistic. By generating a sufficient number of realizations, one obtains a measure of the uncertainty of a given statistic from the data itself without requiring a priori assumptions about the sources of uncertainty [Efron,1979; Pajevic and Basser,2003]. Bootstrapping has previously been combined with DTI tractography to produce probabilistic fiber trajectories [Lazar and Alexander,2005; Jones and Pierpaoli,2005]. However, in a clinical setting, the amount of repeated measurements to allow accurate and precise bootstrapping can render acquisition time unacceptably long [Jeurissen et al.,2008b; O'Gorman and Jones,2006].
The problem of long acquisition times can be addressed using model‐based bootstrapping methods [Chung et al.,2006; Jones,2008; Whitcher et al.,2008]. This approach obtains probability distributions for model parameters by resampling residuals from a model fit (e.g., diffusion tensor fit). The huge advantage of this method is that it does not require repeated measurements, bringing acquisition time into the clinical range. Recent work has shown that the residual bootstrap can accurately estimate the uncertainty in DTI [Chung et al.,2006] and Q‐ball Imaging (QBI) [Berman et al.,2008; Haroon et al.,2009].
In this work, a probabilistic tractography algorithm is presented based on CSD and the residual bootstrap. Using CSD to extract local fiber orientations, our algorithm will overcome partial volume effects associated with DTI and the poor angular resolution that is achieved with other HARDI methods such as QBI [Tournier et al.,2008]. Using the residual bootstrap, we allow fiber tract probability estimation within the clinical time frame, without prior assumptions about the form of the uncertainty in the data. Using Monte Carlo simulations, the accuracy and precision of the residual bootstrap method when estimating DTI and CSD fiber pathway uncertainty, is measured. We also apply our algorithm to clinical DW data and compare our method to state‐of‐the‐art DTI residual bootstrap tractography [Chung et al.,2006; Jones,2008] and to an established probabilistic multifiber CSD tractography algorithm [Tournier et al.,2005].
Early work of the proposed tractography framework in this article has been presented at the ISMRM 2009, Hawaii, USA [Jeurissen et al.,2009].
THEORY
Signal Modeling Using Spherical Harmonics
HARDI acquires the DW signal S in a set of n s gradient directions {(θ,ϕ)} with a constant diffusion weighting b. This signal can be expressed as a linear combination of the real spherical harmonics (SH) Y (θ,ϕ) of degree l and order m:
| (1) |
where {c } denote the harmonic series coefficients, and L is the maximum harmonic degree [Frank,2002]. Since the DW signal exhibits antipodal symmetry, only SH of even degree are considered. Equation (1) can be expressed as a linear system:
| (2) |
where B is the n s × n c matrix constructed with the real symmetric SH basis, c is the n c × 1 vector of even‐degree SH coefficients, s is the n s × 1 DW signal vector and ε is the noise vector. Since only even degree coefficients are used, n c = (L + 1) × (L + 2)/2. The coefficients c can then be estimated using least‐squares minimization:
| (3) |
Given (2) and (3), the signal ŝ predicted by the least squares SH fit to the measured signal s is given as:
| (4) |
with
| (5) |
the so‐called hat‐matrix
Fiber Orientation Estimation Using CSD
From the SH coefficients of the DW signal, the SH coefficients of the FOD can be calculated using a technique called spherical deconvolution [Tournier et al.,2004]. This method assumes that the measured DW signal profile is given by the spherical convolution of the response function (the DW signal profile for a typical fiber population) with the FOD. The desired FOD can thus be estimated by spherically deconvolving the measured DW signal with the response function. In the SH framework, the spherical deconvolution operation can simply be expressed as:
| (6) |
where f and c are the n c × 1 SH coefficient vectors of F(θ,ϕ) and S(θ,ϕ), respectively; R is the n c × n c rotational harmonic matrix of R(θ,ϕ). The deconvolution operation, however, is sensitive to noise. Recently, a new technique, called CSD was proposed which introduces a constraint to minimize the appearance of negative values in the reconstructed FOD, which are clearly physically impossible. With this constraint, it becomes possible to perform the spherical deconvolution operation with drastically reduced noise sensitivity [Tournier et al.,2007]. In brief, the method involves the following steps. First, an initial estimate of the FOD is obtained using a low SH order spherical deconvolution. Then, a set of directions is identified, along which the FOD amplitude is negative. This information is then incorporated as a Tikhonov constraint, driving the amplitude of the FOD along those orientations to zero. Finally, an improved estimate of the FOD is obtained by solving the Tikhonov problem, providing a new set of negative amplitude directions. The procedure is repeated until convergence is achieved. A more detailed explanation of these steps can be found in [Tournier et al.,2007].
In this work, CSD will be used to extract the FOD from the DW signal in each voxel. The harmonic degree of the estimated FOD coefficients L will be limited to 8 which corresponds to the maximum degree one can estimate directly based on 60 DW images. Moreover, the highest degree for which significant terms can be found in in vivo HARDI signal profiles at b = 3,000 s/mm2 has been shown to be 8 [Tournier et al.,2009].
Confidence Estimation Using the Residual Bootstrap
The signal ŝ is estimated by the least squares SH fit to the measured signal s as described in the “Signal Modeling Using Spherical Harmonics” section. The resulting residual vector is given as:
| (7) |
Next, the raw residuals are corrected for leverage [Davison and Hinkley,1999]
| (8) |
with h
ii the i
‐th diagonal entry in the hat matrix H (5). Then, the values from  are randomly chosen with replacement to form a new bootstrapped residual
  . Finally, the bootstrapped residual is added back to the signal fit, to create a synthetic bootstrap realization ŝ
* of the DW signal:
| (9) |
We can then refit the SH model using  and further process it using CSD. By repeating this procedure N
b times, we obtain N
b estimates of the FOD and the associated peak orientations, which can be used to estimate the reproducibility of the reconstructed fiber trajectories.
MATERIALS AND METHODS
Fiber Tractography
Standard DTI streamline tractography [Basser et al.,2000] was adapted to work for CSD. The resulting algorithm can be summarized as follows. Fiber tracking is started at a given seed point. First, the DW signal at the current position of the trajectory is obtained using trilinear interpolation. Next, the FOD is estimated using CSD as detailed in the “Fiber Orientation Estimation Using CSD” section. Then, the FOD peak direction that is closest to the previous stepping direction is extracted (Newton optimization on the sphere). Finally, the trajectory is advanced by a fixed step size along the obtained direction. Tracking is ended when the FOD peak intensities are beneath a fixed threshold, a maximum angle is exceeded, or the tract leaves a specified brain mask. As an informative example, Figure 1 displays deterministic CSD trajectories at the crossing of commissural (the corpus callosum, CC), association (the superior longitudinal fasciculus, SLF) and projection fibers (the corticospinal tract, CST) along with the associated diffusion tensor ellipsoids and CSD FODs.
Figure 1.
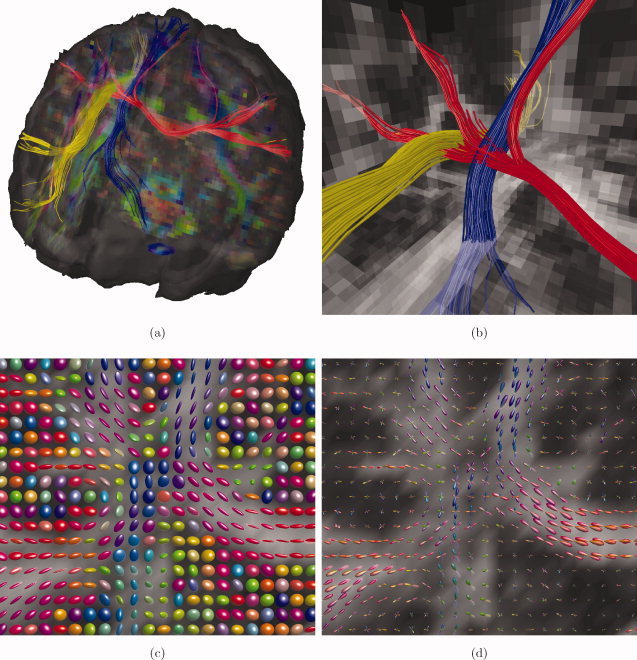
Example of a crossing fiber region. (a) Deterministic CSD tractography of corpus callosum (red), superior longitudinal fasciculus (yellow), and corticospinal tract (blue); (b) detail of (a); (c) DTI ellipsoids; (d) CSD FODs. [Color figure can be viewed in the online issue, which is available at wileyonlinelibrary.com.]
Note that we choose to interpolate on the raw DW signal rather than on the SH coefficients of the FOD. Since CSD is a nonlinear operator, in theory, interpolating linearly is only justified in the signal domain (raw DW signal) and not in the frequency domain (SH coefficients). In practice, however, the SH coefficients of the FOD are almost linearly related to the signal, so similar results could be obtained by interpolating on the SH coefficients of the FOD.
Using the bootstrap method detailed in the “Confidence Estimation Using the Residual Bootstrap” section, this algorithm can be extended into a probabilistic one. First, N b bootstrap realizations are generated from the measured DW dataset. Then, the above deterministic algorithm is run separately on each generated dataset, producing N b tracts emanating from the same seed point. This algorithm will be referred to as “CSD residual bootstrap tractography.”
Finally, visitation maps can be generated by assigning to each voxel the number of bootstrapped trajectories that pass through it [Jones and Pierpaoli,2005].
Note, that by extracting the peaks with a bootstrap procedure, we are implicitly estimating a new, sharper FOD, with the underlying assumption that the fiber orientations are discrete (i.e., delta functions), as in [Behrens et al.,2007; Hosey et al.,2005]. In fact, we are estimating a new FOD that accounts for uncertainty in the data and has the underlying assumption of “sparsity” of the fiber orientations.
Unless specified, the following tractography parameters were used in this work: a step size of 1 mm, a minimum FOD peak intensity of 0.1 and a maximum angle between two consecutive steps of 30°. The 0.1 FOD threshold was a trade‐off between sensitivity and specificity. Increasing the threshold reduced the likeliness of false positives, but at the cost of missing small fiber populations. Decreasing the threshold facilitated tracking through regions with small fiber populations, but at the cost of many spurious fibers.
We compared our method with two other tractography algorithms: The first one, which will be referred to as “DTI residual bootstrap tractography,” is very similar to our method, but uses the diffusion tensor model to estimate the local fiber orientations and to perform the residual bootstrap [Chung et al.,2006; Jones,2008]. The FA threshold used in this method was 0.1.
The second one, which will be referred to as “CSD FOD sampling tractography,” generates probabilistic fiber orientations by taking samples directly from the FODs using a rejection sampling scheme [Tournier et al.,2005, http://www.nitrc.org/projects/mrtrix/]. The same parameters as for the CSD residual bootstrap tractography were used. Note that, in contrast to the CSD residual bootstrap algorithm, this method does not assume that the fiber orientations are discrete, but instead tries to account for uncertainty due to the FOD shape itself, which is assumed to represent the underlying anatomical dispersion.
Simulations
In a previous study we showed, using numerical simulations, that the residual bootstrap realizations of local CSD fiber orientation (at the voxel level) accurately represent the true uncertainty in fiber orientation [Jeurissen et al.,2008a]. We also showed that the residual approach does not introduce a bias in the residual bootstrap realizations of CSD fiber orientations. In this work, the uncertainty of global fiber trajectories (at the dataset level) was estimated by means of probabilistic tractography based on the residual bootstrap. Using a numerical phantom [Leemans et al.,2005], the accuracy and precision of the residual bootstrap for both DTI and CSD probabilistic tractography was measured.
Two properties of the probabilistic tracts were studied: fiber dispersion and success rate. Fiber dispersion of a set of probabilistic trajectories was defined as described in [Lazar and Alexander,2005]. This method takes regular steps along the true noiseless trajectory and computes planes that are perpendicular to the tangent vector. The spatial locations of the intersection of each trajectory with the plane are determined and the distribution of these locations is characterized using principal component analysis. This yields two dispersion measures, λ1 and λ2, indicating the amount of fiber spread along the principal axes of dispersion in this transverse plane. Success rate was defined as the number of trajectories that successfully reached each plane. Using Monte Carlo simulations, dispersion and success rate of gold standard CSD, gold standard DTI, CSD residual bootstrap and DTI residual bootstrap trajectories were compared. For comparison, we also studied the dispersion and success rate of the CSD FOD sampling method.
Gold standard
A noiseless DW dataset was simulated as in [Leemans et al.,2005]. In this framework, diffusion tensor profiles with different orientations are combined to simulate the noiseless DW signal for a multifiber voxel:
| (10) |
The fractions f i (i = 1,…,N) represent the relative contribution of the i‐th fiber orientation along unit direction u. The non‐DW signal, S 0, was set to 1 without loss of generality. Individual diffusion tensors D i (i = 1,…,N) had a fractional anisotropy (FA) of 0.8 and a mean apparent diffusion coefficient (ADC) of 4 × 10⁻⁴ mm2/s (average value measured at the corpus callosum in the real HARDI dataset below). The diffusion weighting b was set to 3000 s/mm2. Sixty diffusion encoding gradient directions were used, distributed evenly on the half sphere [Jones et al.,1999]. Voxel size was 2.4 × 2.4 × 2.4 mm3. This setup corresponds to a realistic and clinically feasible HARDI acquisition. The simulated data set contained three fiber bundles with a crossing arrangement as shown in Figure 2a. Figure 2b–e shows the corresponding DTI ellipsoids and CSD FODs that can be found in the phantom. Rician noise was added to the noiseless dataset to generate 10,000 noisy datasets. The SNR in the individual datasets was 30 within the b = 0 s/mm2 images, which is clinically feasible. Note that all subsequent SNR values are defined on the images without diffusion weighting, since SNR in the DW images depends on the amount of diffusion and its orientation. In the DW images, the average SNR is approximately 5. To show how the tracts behave at different noise levels, we repeated our simulation experiment for lower SNR values: 25, 20, and 15. For each dataset, CSD tractography was started from a fixed seed point (red dot), resulting in 10,000 gold standard probabilistic tracts (Fig. 3b). For reference, 10,000 DTI tractography runs were also performed (Fig. 3a).
Figure 2.
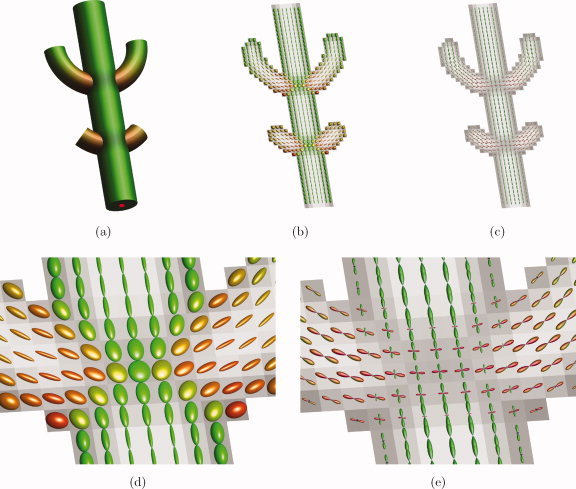
Simulation of DW data. (a) Simulated fiber arrangement; (b) noiseless DTI ellipsoids; (c) noiseless CSD FODs; (d) noiseless DTI ellipsoids at crossing; (e) noiseless CSD FODs at crossing. [Color figure can be viewed in the online issue, which is available at wileyonlinelibrary.com.]
Figure 3.
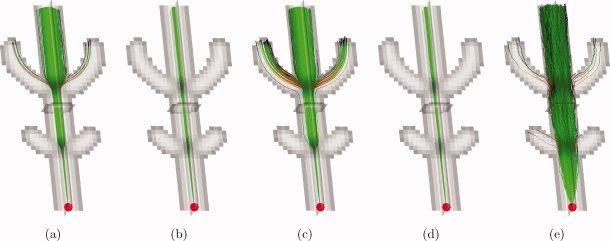
Simulations of probabilistic tractography at SNR 30: trajectories from a single seed point (red dot). (a) Gold standard DTI; (b) gold standard CSD; (c) DTI residual bootstrap; (d) CSD residual bootstrap; (e) CSD FOD sampling. [Color figure can be viewed in the online issue, which is available at wileyonlinelibrary.com.]
Residual bootstrap
Starting from a single noisy simulated dataset, N b = 1000 trajectories were calculated using the probabilistic tractography method as detailed in the “Fiber Tractography” subsection (Fig. 3d). For reference, N b = 1000 DTI residual bootstrap tractography runs were also generated (Fig. 3c). The above procedure was repeated 50 times to calculate the mean and the standard deviation of the dispersion values.
FOD sampling
Starting from a single noisy simulated dataset, N s = 1000 trajectories were sampled from the CSD FODs as detailed in the “Fiber Tractography” section (Fig. 4d). The above procedure was repeated 50 times to calculate the mean and the standard deviation of the dispersion values.
Figure 4.
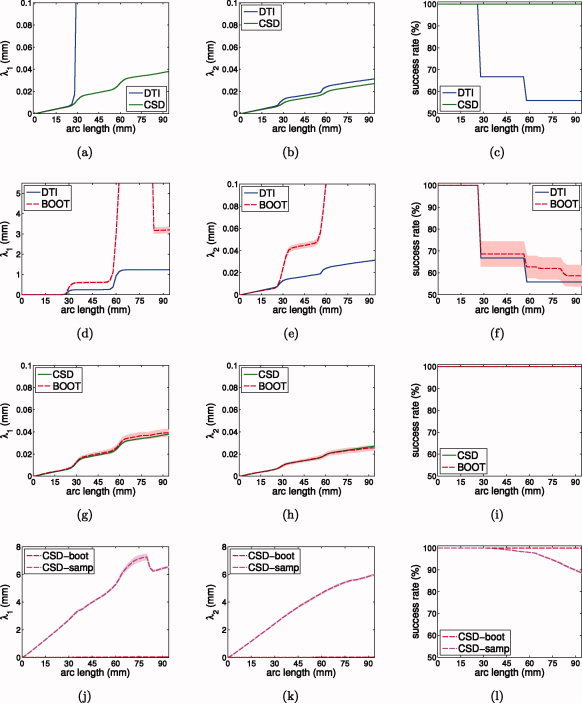
Simulations of probabilistic tractography at SNR 30: fiber dispersion and success rate versus arc length from seed point. λ1 is the dispersion along the major axis of dispersion; λ2 is the dispersion along the minor axis of dispersion. (a–c) Gold standard DTI versus CSD; (d–f) gold standard DTI versus residual bootstrap; (g–i) gold standard CSD versus residual bootstrap; (j–l) CSD residual bootstrap versus CSD FOD sampling. The shaded area represents the 95% confidence interval of the mean. [Color figure can be viewed in the online issue, which is available at wileyonlinelibrary.com.]
Real Data
Whole‐brain HARDI data were acquired from a healthy adult volunteer on a General Electric 3T HDx Signa system. An eight‐channel head coil with parallel imaging factor of 2 was used to acquire twice‐refocused spin echo echoplanar images with TE = 109 ms and 2.4 × 2.4 × 2.4 mm3 voxel size (FOV 23 × 23 cm2, 96 × 96 acquisition matrix, NEX = 1, partial Fourier encoding with 16 overscans before the center of k, 60 slices with 2.4‐mm thickness with no gap). Diffusion gradients were applied in 60 directions uniformly distributed on a sphere through electrostatic repulsion [Jones et al.,1999] with b = 3000 s/mm2. Six images with b = 0 s/mm2 were also acquired. Cardiac gating was applied using a peripheral pulse oximeter with an effective TR = 20 R‐R intervals. Total scan time was approximately 20 min. Motion distortion correction was applied taking into account the B‐matrix rotation [Leemans and Jones,2009] and the tensor model was fitted to the data using a weighted (anisotropic covariance matrix) linear regression method [Basser et al.,1994a]. These processing steps were performed with the diffusion MR toolbox ExploreDTI (http://www.ExploreDTI.com) [Leemans et al.,2009]. SNR within the b = 0 s/mm2 images was approximately 30, calculated using the difference method to compensate for geometric noise variations in parallel images [Dietrich et al.,2007]. The subject gave written informed consent to participate in this study under a protocol approved by the Cardiff University Ethics Committee.
Using the guidelines in [Catani and Thiebaut de Schotten,2008], seed points (shown as red dots) were selected at the core of three well known fiber tracts for which DTI is assumed to perform well (i.e., no fiber crossings): the corpus callosum, the cingulum and the fornix (Fig. 5a–i). Next, all three tractography methods were started in the predefined seed points. Fiber dispersion was calculated as explained in the “Simulations” subsection, using the deterministic DTI trajectory as reference trajectory. Fiber dispersion was only calculated in the segment of the reference trajectory where both DTI and CSD reported 75% success rate to avoid too much artificial drop in fiber dispersion due to spurious fibers terminating early.
Figure 5.
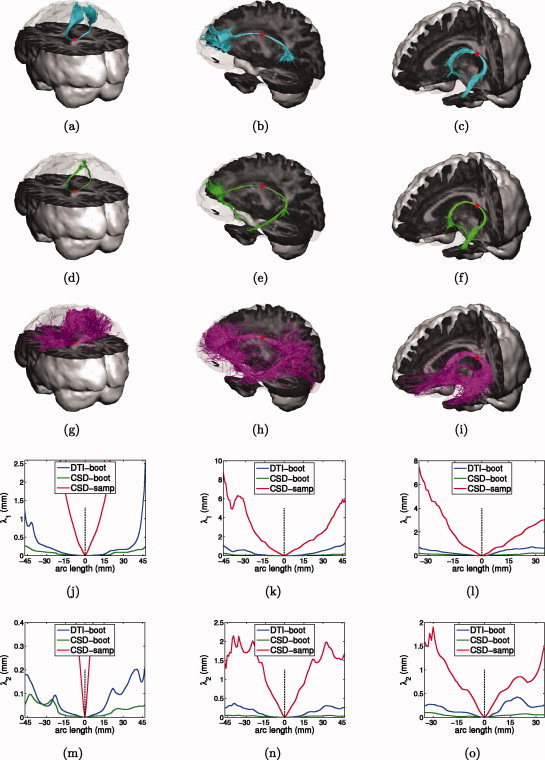
Probabilistic tractography in corpus callosum (first column), cingulum (second column), and fornix (third column). (a–c) DTI residual bootstrap trajectories; (d–f) CSD residual bootstrap trajectories; (g–i) CSD FOD sampling trajectories; emanating from a single seed point (red dot); (j–l) fiber dispersion along major axis of dispersion; (m–o) fiber dispersion along minor axis of dispersion. [Color figure can be viewed in the online issue, which is available at wileyonlinelibrary.com.]
Next, seed points were placed close to the crossing of the CC, the SLF and the CST1 and all three tractography methods were started from those seed points. In these regions, dispersion values could no longer be measured objectively as explained in the “Simulations” subsection, since both algorithms are now expected to follow different paths as suggested by the plot of the DTI ellipsoids in Figure 1c. Instead, visitation maps were generated by assigning to each voxel the number of trajectories that pass through it [Jones and Pierpaoli,2005] and the maps were qualitatively compared (Figs. 6, 7, 8, 6, 7, 8).
Figure 6.
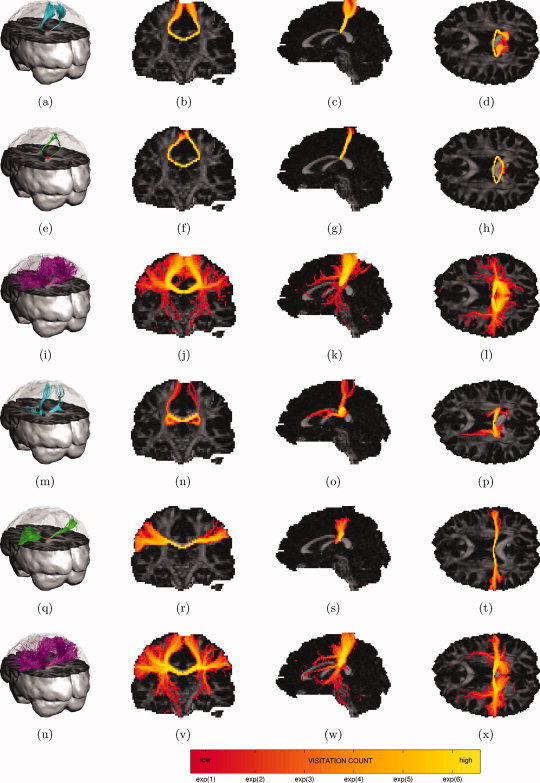
Probabilistic tractography of the superior (first three rows) and lateral projections (last three rows) of the corpus callosum: trajectories emanating from a single seed point (red dot) (first column) and maximum intensity projections of their associated visitation maps (last three columns). (a–d, m–p) DTI residual bootstrap; (e–h, q–t) CSD residual bootstrap; (i–l, u–x) CSD FOD sampling. [Color figure can be viewed in the online issue, which is available at wileyonlinelibrary.com.]
Figure 7.
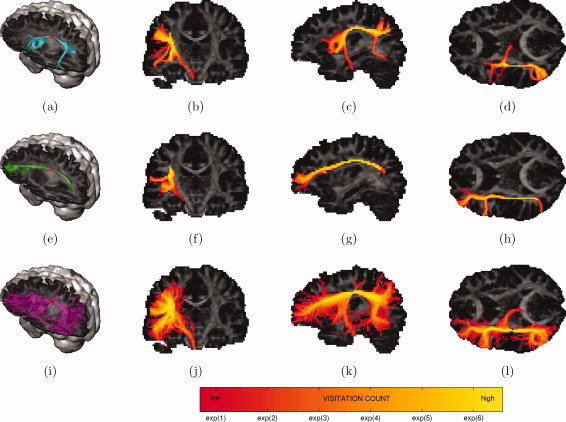
Probabilistic tractography of the superior longitudinal fasciculus: trajectories emanating from a single seed point (red dot) (first column) and maximum intensity projections of their associated visitation maps (last three columns). (a–d) DTI residual bootstrap; (e–h) CSD residual bootstrap; (i–l) CSD FOD sampling. [Color figure can be viewed in the online issue, which is available at wileyonlinelibrary.com.]
Figure 8.
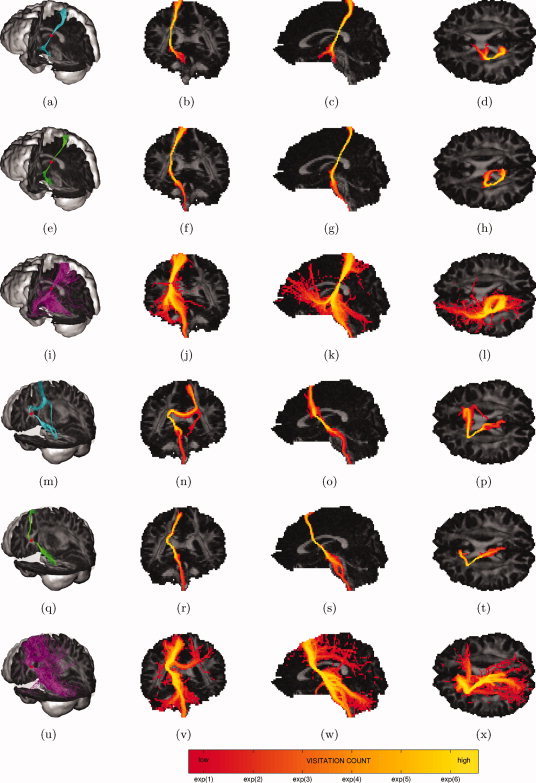
Probabilistic tractography of the corticospinal tract: trajectories emanating from a single seed point (red dot) (first column) and maximum intensity projections of their associated visitation maps (last three columns). (a–d, m–p) DTI residual bootstrap; (e–h, q–t) CSD residual bootstrap; (i–l, u–x) CSD FOD sampling. [Color figure can be viewed in the online issue, which is available at wileyonlinelibrary.com.]
RESULTS
Simulated Data
Figure 3a shows 1000 gold standard DTI fiber tracts emanating from the same seed point (red dot), superimposed on an FA map. When the tracts enter regions of crossing fibers (low FA), there is considerable increase in tract dispersion due to partial volume effects. At the second fiber crossing, these tracts even disperse into the crossing tract. Figure 3b shows the corresponding CSD tracts, having no bifurcations and much smaller tract dispersion. Figure 3c displays N b = 1000 tracts generated by DTI residual bootstrap tractography (starting from a single noisy measurement), showing an additional tract dispersion in the event of partial volume effects. Figure 3d shows the corresponding CSD residual bootstrap tracts, which are in close agreement with the gold standard ones from Figure 3b. Figure 3e displays N s = 1000 tracts generated by CSD FOD sampling tractography (starting from a single noisy measurement), showing a very large overall dispersion, even in regions without partial volume effects. At the fiber crossings, some tracts disperse into the crossing tracts.
To explore this in more detail, Figure 4, plots fiber dispersion values λ1 and λ2 and the success rate as a function of arc length along the trajectory, for gold standard DTI (blue line), gold standard CSD (green line), the mean residual bootstrap approximation (red line), and the CSD FOD sampling tractography. The shaded red area represents a 95% confidence interval for the mean.
From Figure 4a, it is clear that gold standard DTI trajectories undergo heavy λ1 dispersion in case of partial voluming (around 30 and 60 mm from the seed point). This is due to the disc shaped diffusion tensors which have no well defined largest eigenvector. Gold standard CSD trajectories on the other hand are much less sensitive to λ1 dispersion in the event of partial voluming. For λ2, both gold standard DTI and CSD trajectories, show similar dispersion, though dispersion for gold standard CSD is slightly lower (Fig. 4b). This can be explained by the fact that while the disc shaped diffusion tensors have high uncertainty associated with the largest eigenvector, the disc shape does not allow them to disperse out of the plane. Finally, gold standard CSD achieves 100% success rate along the entire phantom, whereas gold standard DTI success rate drops significantly at each fiber crossing (Fig. 4c).
Figure 4d,e shows that the DTI residual bootstrap tractography algorithm accurately estimates gold standard DTI fiber dispersion, as long as the tensor model holds (before 30 mm). In the event of partial volume effects, however, there is a large positive bias in the fiber dispersion estimated by DTI residual bootstrap. Figure 4g,h, on the other hand, shows that the bootstrap estimates of CSD fiber dispersion (both λ1 and λ2) are very close to the gold standard, even in the event of partial voluming. Figure 4i reports 100% success rate for the CSD residual bootstrap, whereas DTI residual bootstrap tractography results in additional fiber termination, due to dispersing tracts (Fig. 4f).
Figure 4j,k shows that the CSD FOD sampling fiber dispersion measures (both λ1 and λ2) are rapidly increasing even in perfectly aligned fiber structures. Because of this large degree of dispersion, more trajectories are stopping as the tracts move further away from the seed point (Fig. 4l).
Additional simulations at other SNR levels (see Fig. 9), show that the uncertainty estimates of the CSD residual bootstrap are very close to the gold standard uncertainty for a wide range of SNR levels (Fig. 9g–i). The plots also show that the residual bootstrap dispersion increases with decreasing SNR, indicating less confidence in the trajectories (Fig. 9g–i). Dispersion of the CSD FOD sampling tractography, however, remains almost constant for different SNR levels and is much higher than for the residual bootstrap (Fig. 9j–l).
Figure 9.
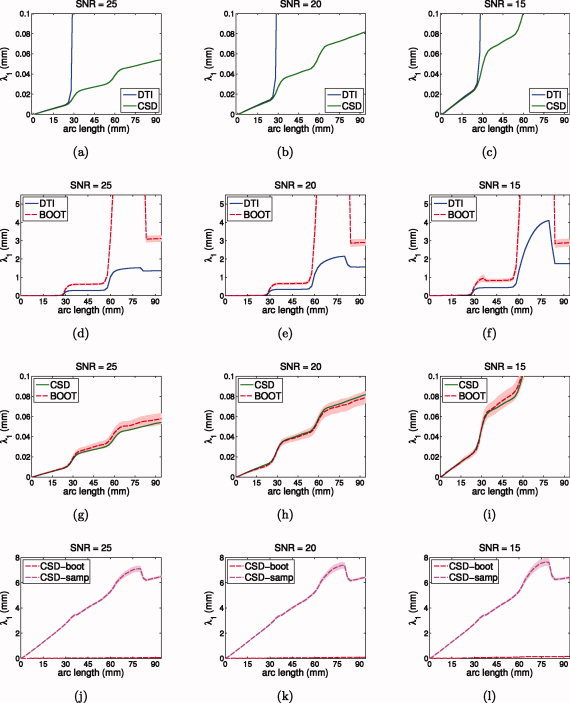
Simulations of probabilistic tractography at SNR 25 (first column), 20 (second column), and 15 (third column): fiber dispersion λ1 along major axis of dispersion versus arc length from seed point (λ2 and success rate similar but not shown). (a–c) Gold standard DTI versus CSD; (d–f) gold standard DTI versus residual bootstrap; (g–i) gold standard CSD versus residual bootstrap; (j–l) CSD residual bootstrap versus CSD FOD sampling. [Color figure can be viewed in the online issue, which is available at wileyonlinelibrary.com.]
Real Data
Figure 5 shows probabilistic fiber trajectories and their associated dispersion for DTI residual bootstrap (blue), CSD residual bootstrap (green), and CSD FOD sampling tractography (magenta), for three well‐defined fiber bundles. While both DTI and CSD residual bootstrap produced very similar reconstructions of all three tracts (Fig. 5a–f), higher fiber dispersion values were observed for DTI residual bootstrap tractography in all three tracts (Fig. 5j–o). Looking at the CSD FOD sampling tractography results, there is generally a much higher degree of dispersion, resulting in spurious fibers as we move further away from the seed point (Fig. 5g–i). Even close to the seed point, where the FODs are very sharp and aligned, very high dispersion is measured (Fig. 5j–o). Also notice that a very high dispersion rate was recorded at the base of the corpus callosum (Fig. 5j,m), which is the region with the most sharp and well‐aligned FODs in the brain.
Figures 6, 7, 8, 6, 7, 8 show individual probabilistic fiber trajectories and maximum intensity projections of the visitation maps in the region with complex fiber architecture.
Figure 6a–h shows both DTI and CSD residual bootstrap tractography are able to reconstruct the superior projections of the CC, when placing the seed point high in the CC at the midsagittal plane. DTI trajectories, however, show much more dispersion in the cortical region. Figure 6m–t shows that CSD residual bootstrap tractography is able to reconstruct the lateral projections of the CC, when placing the seed point low in the CC at the midsagittal plane. DTI residual bootstrap tractography on the other hand is not able to find these lateral projections (false negatives) and instead switches to the superior projections and to the tail of caudate nucleus (false positives). Looking at the FOD sampling tractography results (Fig. 6i–l,u–x), there is generally a much higher degree of dispersion, especially as the tracts move further away from the seed point. Placing the seed point high in the CC, most of the trajectories follow the superior projections, and some trajectories also follow the lateral projections (Fig. 6i–l). Placing the seed point low in the CC, the trajectories follow both the superior and lateral projections (Fig. 6u–x) but some trajectories switch to the CST and the SLF (false positives).
Figure 7 shows CSD residual bootstrap tractography is able to reconstruct a well defined path through the SLF (Fig. 7e–h). DTI residual bootstrap tractography on the other hand shows a mixture between the true SLF, the CST and the external capsule (Fig. 7a–d). CSD FOD sampling tractography shows a mixture between the true SLF, the CST, and the external capsule (false positives) and there is generally a much higher degree of dispersion (Fig. 7i–l).
Figure 8a–h shows that CSD residual bootstrap tractography is able to reconstruct the CST running all the way from the cortex to the spine. DTI residual bootstrap tractography results are very similar, even in the region of crossing fibers. However, placing the seed point on a different location in the CST caused DTI residual bootstrap to switch to the CC and track into the opposite hemisphere, whereas CSD residual bootstrap was still able to reconstruct the CST without false positives (Fig. 8m–t). Looking at the CSD FOD sampling tractography results (Fig. 8i–l,u–x), there is generally a much higher degree of dispersion, especially as the tracts move further away from the seed point. In both cases, CSD FOD sampling tractography is able to reconstruct the CST running all the way from the cortex to the spine. However, the trajectories also switch to other structures: fibers projecting from the region of the thalamus to the frontal cortex (Fig. 8k), CC (Fig. 8v) and fibers projecting to the cerebellum (Fig. 8k,w) (false positives).
Figure 10 shows plots of the DTI ellipsoids (transparent) and the corresponding principle orientations (white lines) along with the CSD FODs in the regions where probabilistic DTI tractography suffers from partial volume effects. The transparent blue arrow represents the most likely DTI trajectory, while the green arrow represents the most likely CSD trajectory.
Figure 10.
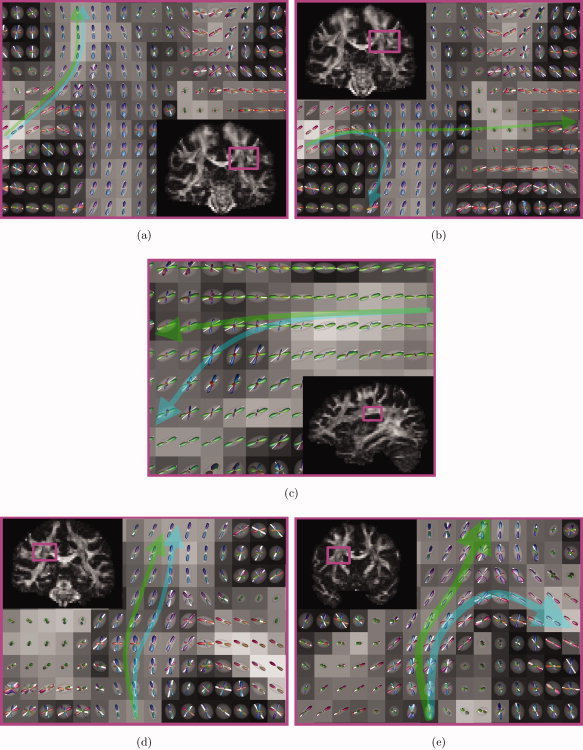
Partial volume effects of DTI in more detail: FA maps with DTI ellipsoids (transparent), first eigenvectors (white lines) and CSD FODs for the trajectories in Figures 6, 7, 8, 6, 7, 8. The arrows are a schematic representation of the probabilistic DTI (blue) and probabilistic CSD (green) trajectories. [Color figure can be viewed in the online issue, which is available at wileyonlinelibrary.com.]
Notice that when the seed point is placed high enough in the CC, CSD, and DTI will produce similar trajectories, i.e., the superior projections of the CC (Fig. 10a). If the seed point is placed lower in the CC, CSD will produce the lateral projections of the CC, but DTI will produce false positives (Fig. 10b).
For the SLF, the dominant fiber orientations of the CST force the DTI trajectories to curve downwards, while the CSD trajectories are allowed to follow a much straighter pathway (Fig. 10c).
In regions where the CST is the dominant fiber orientation, the fiber trajectories are the same for both DTI and CSD (Fig. 10d). However, in some regions, dominant crossing fibers skew the principle diffusion orientations towards adjacent tracts such as the CC (Fig. 10e).
DISCUSSION
In this work, a new probabilistic tractography algorithm was proposed, based on CSD and the residual bootstrap. By using CSD, multiple intravoxel fiber populations could be resolved, allowing our method to confidently track through regions of complex fiber architecture. The residual bootstrap allowed us to estimate local fiber uncertainty to derive global probabilistic tracts.
The use of CSD over other popular HARDI methods such as Q‐ball imaging (QBI) was motivated by a recent study showing that CSD is able to estimate multiple intravoxel fiber orientations more accurately than QBI [Tournier et al.,2008]. The study showed a bias in the fiber orientations obtained with QBI, for crossing angles smaller than 90°, which may have adverse effects on fiber‐tracking results derived using this method [Berman et al.,2008; Haroon et al.,2009]. Also angular resolution was shown to be higher for CSD, which allows resolving smaller interfiber angles.
The residual bootstrap allowed us to estimate fiber orientation uncertainty without prior assumptions about the form of uncertainty in the data, overcoming the limitations of ad hoc‐methods, which assume an ad hoc relationship between the shape of FOD and the uncertainty in fiber orientation [Campbell et al.,2005; Descoteaux et al.,2009; Perrin et al.,2005; Tournier et al.,2005]. The huge advantage over methods employing the classic bootstrap is that it does not require the collection of extra data, bringing acquisition time into the clinical realm. Since our bootstrap approach uses a SH fit of the DW signal itself, the results are completely general and applicable to other HARDI methods than spherical deconvolution [Tournier et al.,2009].
Numerical simulations of complex fiber architecture showed that our probabilistic algorithm accurately estimates CSD fiber trajectory uncertainty (Fig. 4g–i) and that it is superior to DTI residual bootstrap tractography in terms of false positives (fiber dispersion) and false negatives (fibers stopping) (Fig. 4d–f). The improvement by moving from DTI to CSD is two‐fold. First, CSD allows a more accurate estimation of the local fiber orientations in regions of complex fiber architecture. Second, our method allows more accurate estimation of the uncertainty associated with these orientations. Indeed, in regions where the DTI model does not hold, DTI does not only suffer from errors in the estimation of fiber orientations (Fig. 4a–c), it also results in erroneous residual bootstrapping (Fig. 4d–f), since the residuals from the diffusion tensor fit no longer match the true noise characteristics of the data.
An important remark is that the residual bootstrap dispersion measures reported in this study are not to be confused with anatomical dispersion values. Instead, the residual bootstrap is measuring dispersion due to noise. Bootstrap dispersion should be viewed as a measure of robustness for the tractography algorithm (e.g., CSD streamline tractography) and a measure for data quality. While data with higher SNR or a more robust tractography algorithm will reduce fiber dispersion, it will certainly not change the actual anatomical dispersion present in the brain. This is in contrast with the CSD FOD sampling dispersion. Here, the sampling procedure tries to account for uncertainty in the FOD itself. While this approach allows tracts to fan out more, possibly allowing a better result in structures with extensive fanning (such as the CST), this approach has some limitations. To begin with, it is very difficult to relate the shape of the FOD to the underlying anatomical dispersion. For example: a noiseless delta peak FOD will already have an intrinsic width related to its SH order (see Fig. 11). Sampling from this FOD will result in dispersion that is not anatomically meaningful. So while this method will allow tracts to fan out more, it does so in great part regardless of their actual anatomical dispersion. This can be appreciated from our simulation experiments (Fig. 4j–k), where perfectly aligned high amplitude FOD's produce very dispersed trajectories. A practical example of this deficiency is that some of the highest FOD sampling dispersion measures were recorded at the base of the corpus callosum (Fig. 5j,m), which paradoxically is the region with the most sharp and well‐aligned FODs in the brain. The reason is that the high FOD amplitudes and the large extent of the CC allow the FOD sampling method to disperse “freely.” Second, because this method allows the trajectories to disperse more, it is more susceptible to false positives and thus less specific.
Figure 11.
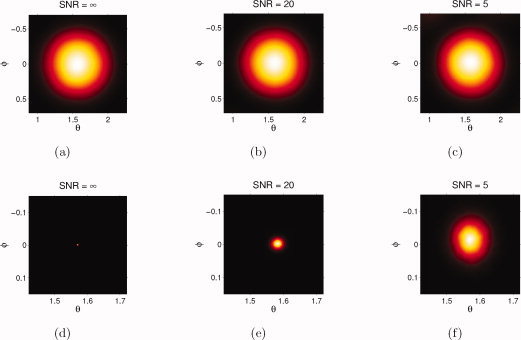
Simulation of a delta function FOD without noise (first column), with low noise (second column) and with high noise (third column): 2D polar histogram of the FOD samples (top row) and the bootstrap samples (bottom row) for different noise levels. Note that the bootstrap histogram uses a different scaling of the axes than the FOD sampling histogram. [Color figure can be viewed in the online issue, which is available at wileyonlinelibrary.com.]
Judging from the tractography results on the experimental data, the problem of DTI in regions of fiber crossings is obvious. DTI residual bootstrap was unable to identify the lateral projections of the corpus callosum (false negatives) and instead reported the superior projections and portions of the nearby caudate nucleus (false positives) (see Fig. 6). It was also unable to reconstruct the correct path for the superior longitudinal fasciculus and switched to the corticospinal tract and external capsule instead (see Fig. 7). These errors are all caused by partial volume effects, as can be appreciated from the DTI ellipsoids and CSD FODs in Figure 10. These results show that residual bootstrap tractography in itself does not solve the crossing fibers issue and that a HARDI approach is required. DTI residual bootstrap tractography of the corticospinal tract, however, produced an anatomically plausible trajectory from the first seed point, even in the region of crossing fibers (Fig. 8a–h). The reason DTI did not fail here, is that the corticospinal tract is the dominant fiber population in this region, causing the principal axes of the diffusion tensors to be skewed towards its orientation. Since the orientation of the CST is nearly perpendicular to the orientation of the crossing structures, the orientation of the first eigenvector is almost perfectly aligned with the true fiber orientation (Fig. 10d). Starting from another seed point, however, does result in false negatives and false positives (Fig. 8m–t), again due to partial volume effects (Fig. 10e).
The CSD residual bootstrap tractography results are promising: the method was able to consistently reconstruct the lateral projections of the corpus callosum (see Fig. 6), the superior longitudinal fasciculus (see Fig. 7), and the corticospinal tracts (see Fig. 8) and was less prone to dispersion in low FA regions than its DTI counterpart.
In regions where DTI and CSD produced similar trajectories (i.e., regions without too much partial volume effects), dispersion measures were consistently lower for CSD residual bootstrap than for its DTI counterpart (see Fig. 5). This may be counterintuitive, since CSD estimates far more parameters than DTI (45 instead of 6) and one might expect higher dispersion when using CSD. However, CSD is using a nonnegativity constraint, effectively reducing the noise in the FODs, making it more reproducible than the unconstrained diffusion tensor fit. Additionally, even in relatively homogenous fiber structures, small partial volume effects will introduce small errors in the DTI fit, causing the residual bootstrap to overestimate trajectory dispersion. Although these effects are small, they will be important during tractography due to propagation of errors. Not only does the diffusion tensor model result in false positives and false negatives in regions of crossing fibers, it is also generally more prone to dispersion than CSD.
One limitation of our method is that it does not explicitly handle fanning fiber configurations. The fanning problem is a deficiency of tracking algorithms in general, since the FOD itself cannot differentiate between fanning, bending, or acute fiber crossing angles, even in the ideal case without noise. Usually, this is handled with additional explicit (somewhat ad hoc) processing methods, typically by using shape characteristics of the FOD [Seunarine et al.,2007] or by including local neighborhood information [Savadjiev et al.,2008]. We do not address this deficiency in our CSD residual bootstrap algorithm, although we acknowledge that it is an outstanding problem.
CONCLUSION
We have presented a new probabilistic tracking algorithm based on CSD and the residual bootstrap that accurately estimates fiber trajectory uncertainty in regions of complex fiber architecture, without prior assumptions about the form of uncertainty in the data and using only a single acquisition, making the technique clinically feasible. By performing simulations and presenting real data examples, we have clearly demonstrated the advantages of CSD residual bootstrap over DTI residual bootstrap probabilistic tractography: in regions of multiple fiber orientations, CSD is much less prone to fiber dispersion, false positives, and false negatives. We have also shown the advantages of our method over CSD FOD sampling tractography: in regions of well ordered and sharp peak orientations, our method does not suffer from unrealistically high dispersion and our method has a higher specificity in general.
Acknowledgements
This work was financially supported by the I.W.T. (Institute for Science and Technology‐Belgium; SBO Quantiviam).
Footnotes
Here, we refer to CST as the collection of fiber pathways that travel between the cerebral cortex and the spinal cord. Note that only a part of the CST was reconstructed, as we used only one seed voxel.
REFERENCES
- Alexander DC,Barker GJ,Arridge SR ( 2002): Detection and modeling of non‐Gaussian apparent diffusion coefficient profiles in human brain data. Magn Reson Med 48: 331–340. [DOI] [PubMed] [Google Scholar]
- Anderson AW ( 2005): Measurement of fiber orientation distributions using high angular resolution diffusion imaging. Magn Reson Med 54: 1194–1206. [DOI] [PubMed] [Google Scholar]
- Basser PJ,Mattiello J,LeBihan D ( 1994a): Estimation of the effective self‐diffusion tensor from the NMR spin echo. J Magn Reson B 103: 247–254. [DOI] [PubMed] [Google Scholar]
- Basser PJ,Mattiello J,LeBihan D ( 1994b): MR diffusion tensor spectroscopy and imaging. Biophys J 66: 259–267. [DOI] [PMC free article] [PubMed] [Google Scholar]
- Basser PJ,Pajevic S,Pierpaoli C,Duda J,Aldroubi A ( 2000): In vivo fiber tractography using DT‐MRI data. Magn Reson Med 44: 625–632. [DOI] [PubMed] [Google Scholar]
- Behrens TE,Woolrich MW,Jenkinson M,Johansen‐Berg H,Nunes RG,Clare S,Matthews PM,Brady JM,Smith SM ( 2003): Characterization and propagation of uncertainty in diffusion‐weighted MR imaging. Magn Reson Med 50: 1077–1088. [DOI] [PubMed] [Google Scholar]
- Behrens TE,Johansen‐Berg H,Jbabdi S,Rushworth MF,Woolrich MW ( 2007): Probabilistic diffusion tractography with multiple fibre orientations: What can we gain? NeuroImage 34: 144–155. [DOI] [PMC free article] [PubMed] [Google Scholar]
- Berman JI,Chung S,Mukherjee P,Hess CP,Han ET,Henry RG ( 2008): Probabilistic streamline q‐ball tractography using the residual bootstrap. NeuroImage 39: 215–222. [DOI] [PubMed] [Google Scholar]
- Campbell JS,Siddiqi K,Rymar VV,Sadikot AF,Pike GB ( 2005): Flow‐based fiber tracking with diffusion tensor and q‐ball data: Validation and comparison to principal diffusion direction techniques. NeuroImage 27: 725–736. [DOI] [PubMed] [Google Scholar]
- Catani M,Thiebaut de Schotten M ( 2008): A diffusion tensor imaging tractography atlas for virtual in vivo dissections. Cortex 44: 1105–1132. [DOI] [PubMed] [Google Scholar]
- Chung S,Lu Y,Henry RG ( 2006): Comparison of bootstrap approaches for estimation of uncertainties of DTI parameters. NeuroImage 33: 531–541. [DOI] [PubMed] [Google Scholar]
- Ciccarelli O,Catani M,Johansen‐Berg H,Clark C,Thompson A ( 2008): Diffusion‐based tractography in neurological disorders: Concepts, applications, and future developments. Lancet Neurol 7: 715–727. [DOI] [PubMed] [Google Scholar]
- Davison AC,Hinkley DV. 1999. Bootstrap Methods and Their Application. Cambridge: Cambridge University Press; 582 p. [Google Scholar]
- Dell'Acqua F,Rizzo G,Scifo P,Clarke RA,Scotti G,Fazio F ( 2007): A model‐based deconvolution approach to solve fiber crossing in diffusion‐weighted MR imaging. IEEE Trans Biomed Eng 54: 462–472. [DOI] [PubMed] [Google Scholar]
- Descoteaux M,Angelino E,Fitzgibbons S,Deriche R ( 2007): Regularized, fast, and robust analytical Q‐ball imaging. Magn Reson Med 58: 497–510. [DOI] [PubMed] [Google Scholar]
- Descoteaux M,Deriche R,Knosche TR,Anwander A ( 2009): Deterministic and probabilistic tractography based on complex fibre orientation distributions. IEEE Trans Med Imaging 28: 269–286. [DOI] [PubMed] [Google Scholar]
- Dietrich O,Raya JG,Reeder SB,Reiser MF,Schoenberg SO ( 2007): Measurement of signal‐to‐noise ratios in MR images: Influence of multichannel coils, parallel imaging, and reconstruction filters. J Magn Reson Imaging 26: 375–385. [DOI] [PubMed] [Google Scholar]
- Efron B ( 1979): Bootstrap methods: Another look at the jackknife. Ann Stat 7: 1–26. [Google Scholar]
- Frank LR ( 2001): Anisotropy in high angular resolution diffusion‐weighted MRI. Magn Reson Med 45: 935–939. [DOI] [PubMed] [Google Scholar]
- Frank LR ( 2002): Characterization of anisotropy in high angular resolution diffusion‐weighted MRI. Magn Reson Med 47: 1083–1099. [DOI] [PubMed] [Google Scholar]
- Haroon HA,Morris DM,Embleton KV,Alexander DC,Parker GJ ( 2009): Using the model‐based residual bootstrap to quantify uncertainty in fiber orientations from Q‐ball analysis. IEEE Trans Med Imaging 28: 535–550. [DOI] [PubMed] [Google Scholar]
- Hosey T,Williams G,Ansorge R ( 2005): Inference of multiple fiber orientations in high angular resolution diffusion imaging. Magn Reson Med 54: 1480–1489. [DOI] [PubMed] [Google Scholar]
- Jansons KM,Alexander DC ( 2003): Persistent angular structure: New insights from diffusion magnetic resonance imaging data. Inverse Probl 19: 1031–1046. [DOI] [PubMed] [Google Scholar]
- Jeurissen B,Leemans A,Tournier JD,Sijbers J ( 2008a): Can residual bootstrap reliably estimate uncertainty in fiber orientation obtained by spherical deconvolution from diffusion‐weighted MRI? In: Proceedings 14th annual meeting of the Organization of Human Brain Mapping, Melbourne.
- Jeurissen B,Leemans A,Tournier JD,Sijbers J ( 2008b): Estimation of uncertainty in constrained spherical deconvolution fiber orientations. In IEEE International Symposium on Biomedical Imaging: From Nano to Macro. Paris, pp 907–910.
- Jeurissen B,Leemans A,Tournier JD,Sijbers J ( 2009): Probabilistic fiber tracking using the residual bootstrap with constrained spherical deconvolution MRI. In Proceedings 17th Scientific Meeting, International Society for Magnetic Resonance in Medicine, Honolulu. p 1438.
- Johansen‐Berg H,Behrens TE ( 2006): Just pretty pictures? What diffusion tractography can add in clinical neuroscience. Curr Opin Neurol 19: 379–385. [DOI] [PMC free article] [PubMed] [Google Scholar]
- Jones DK ( 2008): Tractography gone wild: Probabilistic fibre tracking using the wild bootstrap with diffusion tensor MRI. IEEE Trans Med Imaging 27: 1268–1274. [DOI] [PubMed] [Google Scholar]
- Jones DK,Pierpaoli C ( 2005): Confidence mapping in diffusion tensor magnetic resonance imaging tractography using a bootstrap approach. Magn Reson Med 53: 1143–1149. [DOI] [PubMed] [Google Scholar]
- Jones DK,Horsfield MA,Simmons A ( 1999): Optimal strategies for measuring diffusion in anisotropic systems by magnetic resonance imaging. Magn Reson Med 42: 515–525. [PubMed] [Google Scholar]
- Lazar M,Alexander AL ( 2002): White matter tractography using random vector (RAVE) perturbation. In Proceedings 10th Scientific Meeting, International Society for Magnetic Resonance in Medicine, Honolulu.
- Lazar M,Alexander AL ( 2003): An error analysis of white matter tractography methods: Synthetic diffusion tensor field simulations. NeuroImage 20: 1140–1153. [DOI] [PubMed] [Google Scholar]
- Lazar M,Alexander AL ( 2005): Bootstrap white matter tractography (BOOT‐TRAC). NeuroImage 24: 524–532. [DOI] [PubMed] [Google Scholar]
- Leemans A,Jones DK ( 2009): The B‐matrix must be rotated when correcting for subject motion in DTI data. Magn Reson Med 62: 1336–1349. [DOI] [PubMed] [Google Scholar]
- Leemans A,Sijbers J,Verhoye M,van der Linden A,van Dyck D ( 2005): Mathematical framework for simulating diffusion tensor MR neural fiber bundles. Magn Reson Med 53: 944–953. [DOI] [PubMed] [Google Scholar]
- Leemans A,Jeurissen B,Sijbers J,Jones DK ( 2009): ExploreDTI: A graphical toolbox for processing, analyzing, and visualizing diffusion MR data. In: Proceedings 17th Scientific Meeting, International Society for Magnetic Resonance in Medicine, Honolulu. p 3537.
- Mori S,van Zijl PC ( 2002): Fiber tracking: Principles and strategies—A technical review. NMR Biomed 15: 468–480. [DOI] [PubMed] [Google Scholar]
- O'Gorman RL,Jones DK ( 2006): Just how much data need to be collected for reliable bootstrap DT‐MRI? Magn Reson Med 56: 884–890. [DOI] [PubMed] [Google Scholar]
- Ozarslan E,Shepherd TM,Vemuri BC,Blackband SJ,Mareci TH ( 2006): Resolution of complex tissue microarchitecture using the diffusion orientation transform (DOT). NeuroImage 31: 1086–1103. [DOI] [PubMed] [Google Scholar]
- Pajevic S,Basser PJ ( 2003): Parametric and non‐parametric statistical analysis of DT‐MRI data. J Magn Reson 161: 1–14. [DOI] [PubMed] [Google Scholar]
- Parker GJ,Haroon HA,Wheeler‐Kingshott CA ( 2003): A framework for a streamline‐based probabilistic index of connectivity (PICo) using a structural interpretation of MRI diffusion measurements. J Magn Reson Imaging 18: 242–254. [DOI] [PubMed] [Google Scholar]
- Perrin M,Poupon C,Cointepas Y,Rieul B,Golestani N,Pallier C,Rivière D,Constantinesco A,LeBihan D,Mangin JF ( 2005): Fiber tracking in q‐ball fields using regularized particle trajectories. Inf Process Med Imaging 19: 52–63. [DOI] [PubMed] [Google Scholar]
- Pierpaoli C,Barnett A,Pajevic S,Chen R,Penix LR,Virta A,Basser PJ ( 2001): Water diffusion changes in Wallerian degeneration and their dependence on white matter architecture. NeuroImage 13: 1174–1185. [DOI] [PubMed] [Google Scholar]
- Savadjiev P,Campbell JS,Descoteaux M,Deriche R,Pike GB,Siddiqi K ( 2008): Labeling of ambiguous subvoxel fibre bundle configurations in high angular resolution diffusion MRI. NeuroImage 41: 58–68. [DOI] [PubMed] [Google Scholar]
- Stejskal EO,Tanner JE ( 1965): Spin diffusion measurements: Spin echoes in the presence of a time‐dependent field gradient. J Chem Phys 42: 288–292. [Google Scholar]
- Seunarine KK,Cook PA,Hall MG,Embleton KV,Parker GJM,Alexander DC ( 2007): Exploiting peak anisotropy for tracking through complex structures. In: IEEE 11th International Conference on Computer Vision, Rio de Janeiro. pp 1–8.
- Tournier JD,Calamante F,Gadian DG,Connelly A ( 2004): Direct estimation of the fiber orientation density function from diffusion‐weighted MRI data using spherical deconvolution. NeuroImage 23: 1176–1185. [DOI] [PubMed] [Google Scholar]
- Tournier JD,Calamante F,Gadian DG,Conneley A ( 2005): Probabilistic fibre tracking through regions containing crossing fibres. In: Proceedings 13th Scientific Meeting, International Society for Magnetic Resonance in Medicine, Miami. p 1343.
- Tournier JD,Calamante F,Connelly A ( 2007): Robust determination of the fibre orientation distribution in diffusion MRI: Non‐negativity constrained super‐resolved spherical deconvolution. NeuroImage 35: 1459–1472. [DOI] [PubMed] [Google Scholar]
- Tournier JD,Yeh CH,Calamante F,Cho KH,Connelly A,Lin CP ( 2008): Resolving crossing fibres using constrained spherical deconvolution: Validation using diffusion‐weighted imaging phantom data. NeuroImage 42: 617–625. [DOI] [PubMed] [Google Scholar]
- Tournier JD,Calamante F,Connelly A ( 2009): How many diffusion gradient directions are required for HARDI? In: Proceedings 17th Scientific Meeting, International Society for Magnetic Resonance in Medicine, Honolulu. p 358.
- Tuch DS,Reese TG,Wiegell MR,Makris N,Belliveau JW,Wedeen VJ ( 2002): High angular resolution diffusion imaging reveals intravoxel white matter fiber heterogeneity. Magn Reson Med 48: 577–582. [DOI] [PubMed] [Google Scholar]
- Tuch DS ( 2004): Q‐ball imaging. Magn Reson Med 52: 1358–1372. [DOI] [PubMed] [Google Scholar]
- Whitcher B,Tuch DS,Wisco JJ,Sorensen AG,Wang L ( 2008): Using the wild bootstrap to quantify uncertainty in diffusion tensor imaging. Hum Brain Mapp 29: 346–362. [DOI] [PMC free article] [PubMed] [Google Scholar]


