

Abstract
In language processing, the relative contribution of early sensory and higher cognitive brain areas is still an open issue. A recent controversial hypothesis proposes that sensory cortices show sensitivity to syntactic processes, whereas other studies suggest a wider neural network outside sensory regions. The goal of the current event‐related fMRI study is to clarify the contribution of sensory cortices in auditory syntactic processing in a 2 × 2 design. Two‐word utterances were presented auditorily and varied both in perceptual markedness (presence or absence of an overt word category marking “‐t”), and in grammaticality (syntactically correct or incorrect). A multivariate pattern classification approach was applied to the data, flanked by conventional cognitive subtraction analyses. The combination of methods and the 2 × 2 design revealed a clear picture: The cognitive subtraction analysis found initial syntactic processing signatures in a neural network including the left IFG, the left aSTG, the left superior temporal sulcus (STS), as well as the right STS/STG. Classification of local multivariate patterns indicated the left‐hemispheric regions in IFG, aSTG, and STS to be more syntax‐specific than the right‐hemispheric regions. Importantly, auditory sensory cortices were only sensitive to the overt perceptual marking, but not to the grammaticality, speaking against syntax‐inflicted sensory cortex modulations. Instead, our data provide clear evidence for a distinction between regions involved in pure perceptual processes and regions involved in initial syntactic processes. Hum Brain Mapp, 2012. © 2011 Wiley Periodicals, Inc.
Keywords: fMRI, language comprehension, linear support vector machine classifier, multivariate pattern classification, perceptual processing, syntactic processing
INTRODUCTION
In language comprehension, the analysis of syntactic structure is thought to be accomplished in two successive stages. The first is associated with processes of initial structure building, which, when disturbed, elicit the early left anterior negativity (ELAN, between 100–200 ms) of the event‐related potential [ERP; Friederici et al.,1993]. The second stage is thought to reflect revision/repair processes, with the P600 (positivity around 600 ms) elicited in case of syntactic violations [Friederici,2002; Hagoort et al.,1993]. The ELAN is considered to be strongly automatic, whereas the P600 can be modulated by task or expectation of a violation [Hahne and Friederici,1999,2002]. Recently, Hasting and Kotz [2008] observed an early negativity, but no P600 when two‐word utterances that included a syntactic phrase structure violation were presented (e.g., “ein kegelt”, Engl. “a bowls [verb] ”). The authors argued that revision/repair processes were not initialized for these two‐word utterances, as they do not suffice to form a sentence [Hasting and Kotz,2008].
Localizing the neural mechanisms underlying initial syntactic processing in the visual domain, Dikker et al. [2009,2010] recently argued that visual sensory cortices can be affected by syntactic word category violations, in cases in which the syntactic category is overtly marked by a suffix. In an auditory oddball paradigm using two‐word utterances, Herrmann et al. [2009] reported seemingly compatible results by localizing the syntactic mismatch negativity (sMMN) to phrase structure violations in the primary auditory cortex (PAC). In such a paradigm, however, syntactic processing is accompanied by a salient acoustic change [see Shtyrov and Pulvermüller,2007], which might bias the source localization towards the primary areas. Auditory sentence processing studies rather revealed activations in the anterior superior temporal gyrus (aSTG) than in auditory sensory cortices in response to syntactically incorrect sentences [Friederici et al.,2000; Knösche et al.,1999]. Furthermore, magnetoencephalography (MEG) and functional magnetic resonance imaging (fMRI) studies using sentences reported activations in the inferior frontal gyrus (IFG) or in the frontal operculum [Brauer and Friederici,2007; Friederici et al.,2000,2003,2010; Knösche et al.,1999] in addition to the aSTG. Moreover, the studies reporting early sensory cortex modulations were based on MEG recordings. MEG, however, might not provide the spatial resolution to differentiate between cortical regions in very close proximity [Baillet et al.,2001]. Consequently, it is still an open question whether auditory sensory cortices are affected by initial syntactic processing or not.
The aim of the present fMRI study was to investigate the underlying brain regions involved in initial syntactic processing and to clarify the role of the auditory sensory cortices in this process. Previous fMRI studies on syntactic processing were not able to differentiate between initial syntactic processes and processes of revision/repair due to the time‐insensitive hemodynamic response measured with fMRI. In order to gain from the high spatial resolution of fMRI but circumvent the overlap of responses to the two different processes, two‐word utterances that have previously been shown to lead to initial syntactic processes only [Hasting and Kotz,2008] were presented in a 2 × 2 stimulus design. Within one factor the grammaticality of the utterances was varied (either syntactically correct or syntactically incorrect), whereas the second factor varied the overt perceptual markedness of the utterances (either with or without a suffix “‐t” marking the word category of the second word). Methodologically, we used both, a conventional cognitive subtraction (univariate) analysis and a multivariate pattern analysis (MVPA) to evaluate the data. In general, a MVPA uses the information contained in local brain activation patterns to decode the cognitive state associated with those activations. Importantly, MVPA has been found sensitive to effects that are undetected by conventional analyses [Formisano et al.,2008; Haynes and Rees,2005,2006], thus, providing a method that is potentially able to decode very small syntactic effects from auditory cortex activation patterns.
MATERIALS AND METHODS
Participants
The current experiment was conducted with twenty‐five participants (12 female). All were native speakers of German, Aged 22–32. They were all right‐handed as measured by the Edinburgh Handedness Inventory [Oldfield,1971] with a mean laterality quotient of 94.3 (±1.7 SEM; standard error of the mean). Participants had no known hearing deficit or neurological diseases in their history. They gave informed consent prior to the experiment and were paid for their participation.
Stimulus Material
Participants were auditorily presented with 384 German two‐word utterances throughout the experiment, from which 182 were syntactically correct and 182 syntactically incorrect. In half of the correct and half of the incorrect two‐word utterances the ending of the second word was perceptually overtly marked by a suffix, whereas the other half of the correct and the incorrect utterances were unmarked, thereby constituting the Grammaticality‐ Perceptual Markedness 2 × 2 stimulus design.
In more detail, stimuli were developed around 24 different monosyllabic word stems (e.g., “knie”, Engl. “knee”). The word stems were either perceptually overtly marked by the suffix “‐t”, giving 24 different verbs (e.g., “kniet”, Engl. “kneels”), or unmarked, giving 24 different nouns (“Knie”, Engl. “knee”). These verbs and nouns were preceded once by a personal pronoun (“er”, Engl. “he”) and once by a preposition (“im”, Engl. “in‐the”), resulting in 96 different two‐word utterances, which were each spoken by four different trained native speakers of German (two female) and digitized at 44.1 kHz (16 bit, mono, normalized by peak intensity), leading to the 384 two‐word utterances used in the experiment.
The 182 syntactically correct utterances consisted of either a personal pronoun‐verb combination (e.g., “er kniet”, Engl. “he kneels”) or of a preposition‐noun combination (e.g., “im Knie”, Engl. “in‐the knee”). The 182 syntactically incorrect utterances consisted of a personal pronoun‐noun combination (e.g., “er Knie”, Engl. “he knee”) or of a preposition‐verb combination (e.g., “im kniet”, Engl. “in‐the kneels”). The latter combination included a word category violation at the verb, because in German, a preposition requires a noun phrase to follow. The former combination, on the other hand, is not absolutely incorrect in German, because within a sentence, a noun is allowed to follow a personal pronoun (e.g., “Sie sah, dass er Knie und Haut verletzt hatte”, literal translation: “She saw, that he knee and skin had injured.”). However, in isolation without sentence context, this combination was previously categorized as absolutely incorrect by all participants asked [Herrmann et al.,2009] and is therefore taken as syntactically incorrect. Moreover, the correct use of such a combination in speech would require an intonational phrase boundary (with a pause) after “er”, which was not present in the current stimulus material.
Henceforth, syntactically correct and syntactically incorrect utterances including a bare word stem are referred to as perceptually “unmarked conditions” and utterances including a perceptually overt marking are called “marked conditions”. Thus, four different conditions were presented: correct unmarked, correct marked, incorrect unmarked and incorrect marked (see Table I).
Table I.
Experimental conditions in the 2 × 2 stimulus design (transcripts of the auditory stimuli)
| Perceptual markedness | Grammaticality | |
|---|---|---|
| Correct | Incorrect | |
| Unmarked | e.g., “im Knie” (in‐the knee) | e.g., “er Knie” (he knee) |
| Marked | e.g., “er kniet” (he kneels) | e.g., “im kniet” (in‐the kneels) |
Design and Procedure
Imaging was conducted using a 3‐T Siemens TRIO scanner (Erlangen, Germany) with a 12‐channel head‐coil. Participants were comfortably positioned in the bore and wore air‐conduction headphones (Resonance Technology, Los Angeles, USA). Echo‐planar imaging (EPI) scans were acquired in 30 axial slices covering temporal, inferior frontal and visual cortices. The sequence was set up with echo time (TE) 30 ms, flip angle 90°, repetition time (TR) 2.0 s, and acquisition bandwidth 116 kHz. The matrix was 64 × 64 pixels with a field of view of 192 mm2, resulting in an in‐plane resolution of 3 × 3 mm2. The measured slice thickness was 2 mm plus an interslice gap of 1 mm. Scans were acquired in six independent runs which were separated by a short break of about 30–60 s in which scanning was discontinued. Additionally, a field map was acquired in each participant, providing an estimate of local field inhomogeneities that was used in the spatial preprocessing of the functional data.
Sixty‐four two‐word utterances (16 of each condition; see Stimulus Material) were presented auditorily in each of the six runs. Within each run, utterances were randomized for each subject with the constraint that no more than three stimuli of the same type (word stem, speaker's gender, grammaticality) were presented in direct succession. The inter‐trial‐interval was 7 s and the onset of the utterance was jittered by 0, 400, 800, and 1200 ms equally distributed over conditions. To avoid motor preparation, a variable response key assignment was used as follows. A picture showing a happy and a sad smiley side by side was presented 2,600 ms after the utterance ended. The positions (left vs. right) of the happy and sad smiley were randomized uniformly within each run and across conditions. For the grammaticality judgment, participants used their index fingers to press the button corresponding to the happy (correct utterance) or sad smiley (incorrect utterance). The response pictures were projected through an LCD projector (PLC‐XP50L, Sanyo) onto the back of a screen. Participants viewed the pictures on the screen above their heads through a mirror attached to the head‐coil. An IBM‐compatible computer running with Presentation (Neurobehavioral Systems, Albany, CA) controlled the stimulation.
Data Analysis—Univariate Approach
Functional images were preprocessed for each run separately using Statistical Parametric Mapping (SPM8, Wellcome Imaging Department, University College, London, UK, http://www.fil.ion.ucl.ac.uk/spm). Functional time series were realigned, and corrected for field inhomogeneities using individual field maps [Cusack et al.,2003; Jezzard and Balaban,1995] (“unwarped”), slice scan time corrected, normalized to the standard SPM8 EPI template using a transformation matrix calculated from the mean EPI image generated during realignment, and spatially filtered using a Gaussian filter with 6 mm FWHM. The first five images of the functional time series of each run were discarded to allow for magnetic saturation effects. The time series were 1/100 Hz high‐pass filtered and corrected for first‐order autocorrelation. For each participant, a general linear model (GLM) including all six runs with four conditions (correct unmarked; correct marked; incorrect unmarked; incorrect marked) was estimated with a canonical hemodynamic response function [Friston et al.,1995]. Responses to the syntactically incorrect conditions were contrasted against those to the syntactically correct conditions (Grammaticality contrast), and responses to the marked conditions were contrasted against those to the unmarked conditions (Perceptual Markedness contrast). Note that both contrasts controlled for any acoustic differences introduced by the personal pronoun and the preposition due to the current 2 × 2 stimulus design. For the two contrasts, the individual contrast images were then entered into a second‐level random‐effects analysis consisting of a one‐sample t‐test which indicates whether the observed differences between conditions are significantly different from zero. Subsequently, t‐values were transformed into z‐scores. Activations were cluster extent threshold corrected for multiple comparisons (P ≤ 0.05) using Monte Carlo simulations as described in Slotnick and Schacter [2004] and Slotnick et al. [2003]. Only regions with a z‐score equal or greater than 3.719 (P = 0.0001) and with a volume equal or greater than 216 mm (eight voxels) were considered statistically significant.
To further explore differences between conditions, a region of interest (ROI) analysis was conducted using the MarsBaR toolbox [v0.42; Brett et al.,2002]. Mean beta weights from peak‐voxel‐centered spheres of 4‐mm radius were estimated based on the random‐effects contrasts. Motivated by the study conducted by Herrmann et al. [2009], mean coordinates of the PAC provided by Rademacher et al. [2001] were transformed into MNI (Montreal Neurological Institute) space [Lancaster et al.,2007] (left PAC (TE 1.0): −44 −20 6; right PAC (TE 1.0): 51 −11 5) and then entered into the analysis. Mean beta weights were transformed to percentage signal change (PSC). Subsequently, a two‐way repeated measures analysis of variance (rmANOVA) including the factors Grammaticality (correct; incorrect) and Perceptual Markedness (unmarked; marked) was conducted for each ROI, using the PSC as dependent measure. Note that such a post‐hoc ANOVA is potentially biased in the subset of regions of interest which has been extracted from the group SPM results of the same data set and should thus be used with caution. Strictly speaking, the statistical results of this analysis do not adhere to the same stringency as those obtained from the whole‐brain analysis where a correction for multiple comparisons was applied. Nonetheless, this approach has been considered valid to further explore patterns of activity across conditions [Poldrack,2007] and has been pursued as such previously [e.g., Altmann et al.,2008; Bornkessel‐Schlesewsky et al.,2009; Shtyrov et al.,2008]. For the PAC ROIs, however, no such potential bias is present because they were based on independent, previously published data [Herrmann et al.,2009]. The SPM Anatomy toolbox (v1.6) was used to derive the cortical labels associated with the peak voxels [Eickhoff et al.,2005].
Data Analysis—Multivariate Approach
We also conducted a MVPA to evaluate the data with a method known to also be sensitive to small changes in activity patterns [Formisano et al.,2008; Haynes and Rees2005,2006]. The univariate fMRI analysis described in the previous section is based on spatially smoothed fMRI signals focusing on overall differences in activation strength associated with the experimental conditions. This allows inferences about the involvement of a region in a specific mental function. Pattern analysis, by contrast, focuses on the information contained in the region's local activity pattern changes related to the experimental conditions, which allows inferences about the representational content of a region [Haynes and Rees,2006; Kriegeskorte and Bandettini,2007; Mur et al.,2009; Norman et al.,2006].
Preprocessing of the functional images was conducted using SPM8, whereby functional time series of each run were realigned, and corrected for field inhomogeneities using individual field maps [Cusack et al.,2003; Jezzard and Balaban,1995] (“unwarped”), slice scan time corrected, and spatially filtered using a Gaussian filter with 3 mm FWHM. Applying spatial smoothing prior to the multivariate pattern classification has previously been shown to improve the classification performance [Ethofer et al.,2009]. As in the univariate analysis, the first five images of the functional time series of each run were discarded to allow for magnetic saturation effects. The time series were 1/100 Hz high‐pass filtered and corrected for first‐order autocorrelation. For each run, a GLM was computed at the single‐participant level with the four conditions (correct unmarked; correct marked; incorrect unmarked; incorrect marked) using a canonical hemodynamic response function [Friston et al.,1995]. The individual brain activity patterns used for the MVPA were then estimated as spm{T} condition‐specific main contrasts (condition vs. global baseline) for each run separately.
A linear support vector machine (SVM) classifier was applied to analyze the brain activation patterns [Chang and Lin,2001, LIBSVM matlab‐toolbox v2.89], as several studies in cognitive neuroscience have recently reported accurate classification performance using a SVM classifier [e.g., Ethofer et al.,2009; Formisano et al.,2008; Haynes et al.,2007]. For each condition and run, a feature vector x with the length of voxels was acquired using the spm{T} estimates as feature values. A linear SVM separates training data points x for two different given labels by fitting a hyperplane w T x + b = 0 defined by the weight vector w and an offset b. Classification performance generalization was tested using a leave‐one‐out cross validation (LOOCV), in which the data of one run was kept out while the data of the other five runs was used to train the classifier. The trained classifier was then tested in decoding the labels from the brain activation patterns of the run which had been left out in training. Decoding accuracies were obtained by comparing the decoded labels with the experimental labels and averaged afterwards. This procedure was repeated six times (i.e., using each of the six runs as test run once). Subsequently, the six accuracies were averaged, resulting in a mean decoding accuracy value.
In the current setting, a multivariate “searchlight” approach was used to estimate the local discriminative patterns over the whole brain [Haynes et al.,2007; Kriegeskorte et al.,2006]. On that account, a series of multivariate pattern classifications was conducted for each voxel position. The searchlight feature vector contained spm{T} estimates for that voxel and its close neighbors. A searchlight radius of two voxels (6 mm), which comprised about 33 voxels per searchlight position, was selected. Decoding accuracies were computed by applying a full LOOCV for each searchlight. In order to conduct a group analysis, individual 3D decoding accuracy maps were spatially normalized to the standard SPM8 EPI template using a transformation matrix calculated from the mean EPI image generated during realignment, and spatially smoothed using a Gaussian filter with 6 mm FWHM. The reliability of the decoding performance was tested by conducting a t‐test for each voxel comparing the decoding accuracy of that voxel to the overall mean decoding accuracy of all the other gray and white matter voxels (i.e., an effective chance level). This procedure resembles the localization test proposed for ROI‐based classification approaches [Etzel et al.,2009], which is more conservative than comparing to the 50% chance level. Subsequently, t‐values were transformed into z‐scores. To correct for multiple comparisons, a cluster extent threshold, ensuring a whole‐brain Type I error control of α ≤ 0.05, was determined in a Monte Carlo simulation, and consecutively applied [Slotnick and Schacter,2004; Slotnick et al.,2003]. Only regions with a z‐score equal or greater than 3.719 (P = 0.0001) and with a volume equal or greater than 216 mm (eight voxels) were considered statistically significant, similar to the univariate analysis.
The following two pairwise classifications were obtained: Grammaticality (correct conditions vs. incorrect conditions) and Perceptual Markedness (unmarked conditions vs. marked conditions).
RESULTS
Behavioral Performance
Mean percentage of hit rates (± SEM) in the scanner were as follows: correct unmarked 88.3% (SEM = 3.4); correct marked 93.8% (SEM = 2.3); incorrect unmarked 92.7% (SEM = 2.1); incorrect marked 93.8% (SEM = 2.1). A two‐way rmANOVA including the factors Grammaticality (correct; incorrect) and Perceptual Markedness (unmarked; marked) was carried out and revealed a mild main effect of Grammaticality (F(1,24) = 4.62, P = 0.042, η2 P = 0.16) and a main effect of Perceptual Markedness (F(1,24) = 11.72, P = 0.002, η2 P = 0.33), overridden by a significant Grammaticality × Perceptual Markedness interaction (F(1,24) = 9.78, P = 0.005, η2 P = 0.29). Post‐hoc tests showed that the hit rate for the syntactically correct unmarked condition was significantly lower compared to each of the other three conditions (for all, F(1,24) > 7.5, P < 0.05, η2 P > 0.20; all other comparisons F(1,24) < 2.5, P > 0.10).
Reaction times are not reported as the participants were instructed to make a delayed grammaticality judgment 2.6 s after the full utterance was presented.
Univariate fMRI Analysis
The whole brain analysis revealed stronger responses for syntactically incorrect versus syntactically correct two‐word utterances in the left middle STS (mSTS) extending into the posterior STS (pSTS), in the left IFG (BA44), the left aSTG as well as in the right STS/STG extending into anterior and posterior areas. Furthermore, stronger hemodynamic responses were observed for perceptually overtly marked versus unmarked conditions in the mSTG and the auditory cortex (AC) in both hemispheres (see Fig. 1). For each peak voxel within a z‐map cluster, corresponding z‐score values, MNI coordinates and voxel extent are shown in Table II.
Figure 1.
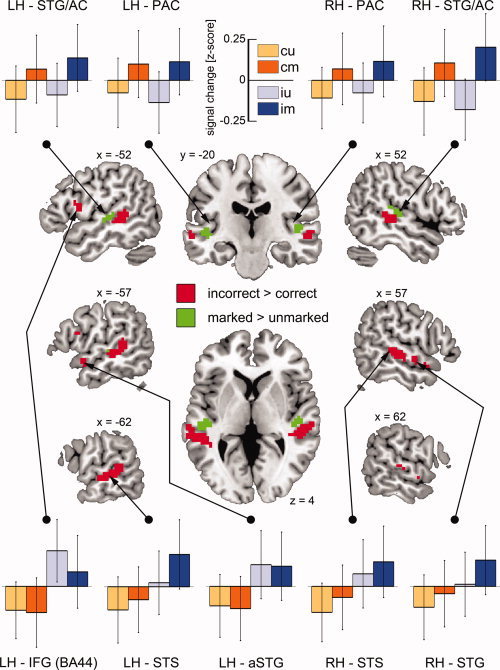
Results of the group analysis for the two univariate contrasts. Center: syntactically incorrect > correct (red, Grammaticality contrast), perceptually marked > unmarked (green, Perceptual markedness contrast), z‐maps thresholded at P ≤ 0.0001 and a cluster extent of k ≥ 8 voxels. Top and Bottom: z‐normalized percent signal change for each ROI and condition (cu—correct unmarked, cm—correct marked, iu—incorrect unmarked, im—incorrect marked) (LH—left hemisphere, RH—right hemisphere, STG—superior temporal gyrus, STS—superior temporal sulcus, IFG—inferior frontal gyrus, PAC—primary auditory cortex, AC—auditory cortex, a—anterior). The error bars reflect the standard error of the mean.
Table II.
Univariate analysis: Brain regions activated in the grammaticality and in the perceptual markedness contrast and peak voxel information
| Region | MNI peak coordinate (mm) | Contrast | z‐score | Extent in voxel |
|---|---|---|---|---|
| Left IFG (BA44) | −54 8 10 | G | 4.41 | 19 |
| Left STS | −60 −22 −2 | G | 5.06 | 144 |
| Left aSTG | −54 5 −14 | G | 4.85 | 13 |
| Right STS | 57 −28 1 | G | 4.68 | 89 |
| Right STG | 60 −4 −8 | G | 4.75 | 21 |
| Left STG/AC (TE 1.1) | −45 −22 1 | P | 4.58 | 42 |
| Right STG/AC (TE 1.1) | 48 −22 7 | P | 4.80 | 61 |
TE—temporal area “E”, STG—superior temporal gyrus, STS—superior temporal sulcus, IFG—inferior frontal gyrus, AC—auditory cortex, a—anterior, G—grammaticality contrast, P—perceptual markedness contrast.
To evaluate the effects of the conditions separately (see Methods), a ROI analysis was conducted for each cluster peak voxel (sphere) presented in Table II. For the left‐hemispheric ROIs of the Grammaticality contrast, the IFG (BA44) and the aSTG each showed a significant main effect of Grammaticality exclusively (F(1,24) = 28.70, P < 0.001, η2 P = 0.54; F(1,24) = 39.02, P < 0.001, η2 P = 0.62; respectively), driven by the higher signal change in syntactically incorrect conditions. A main effect of Grammaticality (F(1,24) = 49.04, P < 0.001, η2 P = 0.67) and a main effect of Perceptual Markedness (F(1,24) = 7.09, P = 0.014, η2 P = 0.23) were found in the left STS. Syntactically incorrect conditions led to higher PSC than the syntactically correct conditions and the perceptually marked conditions showed higher PSC compared to the unmarked conditions. Similar results were obtained for the right STG and STS regions, showing a main effect of Grammaticality (F(1,24) = 40.20, P < 0.001, η2 P = 0.63; F(1,24) = 34.00, P < 0.001, η2 P = 0.59; respectively) as well as a main effect of Perceptual Markedness (F(1,24) = 6.76, P = 0.016, η2 P = 0.22; F(1,24) = 5.29, P = 0.031, η2 P = 0.18; respectively).
The analysis for the ROIs of the Perceptual Markedness contrast revealed only a main effect of Perceptual Markedness in the left and right STG/AC caused by higher PSC for the marked conditions (F(1,24) = 27.70, P < 0.001, η2 P = 0.54; F(1,24) = 28.96, P < 0.001, η2 P = 0.55; respectively). None of the other main effects or interactions were significant (for all, F(1,24) < 3.5, P > 0.05).
The hypothesis‐driven investigation of the PAC revealed a main effect of Perceptual Markedness in the left and right hemisphere (F(1,24) = 13.84, P = 0.001, η2 P = 0.37; F(1,24) = 5.45, P = 0.028, η2 P = 0.19; respectively), whereas no significant main effects of Grammaticality nor significant interactions were found (for all, F(1,24) < 1.0, P > 0.30). Figure 1 shows the results of the ROI analyses.
Multivariate fMRI Analysis
As depicted in Figure 2, decoding performance for the Grammaticality classification revealed a strong left‐hemispheric bias, showing accuracies significantly above chance level in the left inferior and superior IFG (BA44), the left aSTG, the left STS and the left posterior middle temporal gyrus (pMTG). That is, neural activation imprints in these subregions of the frontal and temporal cortices allowed the correct decoding of the grammatical correctness of the utterances heard.
Figure 2.
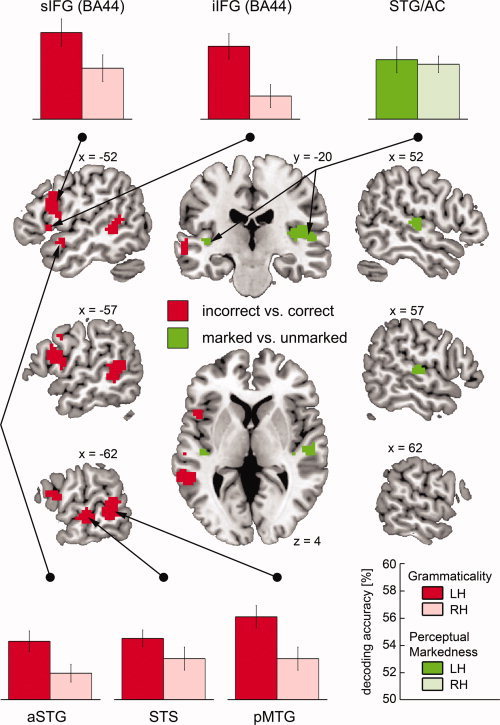
Results of the group analysis for the two multivariate classifications. Center: syntactically incorrect vs. correct (red, Grammaticality classification), perceptually marked vs. unmarked (green, Perceptual markedness classification), z‐maps thresholded at P ≤ 0.0001 and a cluster extent of k ≥ 8 voxels. Top and Bottom: decoding accuracies for the left‐hemispheric regions and their homologue regions in the right hemisphere (LH—left hemisphere, RH—right hemisphere, STG—superior temporal gyrus, STS—superior temporal sulcus, MTG— middle temporal gyrus, IFG—inferior frontal gyrus, AC—auditory cortex, a—anterior, p—posterior, i—inferior, s—superior). The error bars reflect the standard error of the mean.
To test the statistical significance of the leftward bias in the Grammaticality classification, the following post‐hoc procedure was applied. For each peak voxel in a cluster of the z‐score map (see Table III), a homologue voxel in the opposite hemisphere was selected by multiplying the x‐coordinate of that cluster voxel by −1. A sphere of 4 mm radius was centered on each of these voxels and the mean decoding accuracy for each participant and ROI was extracted. Subsequently, an rmANOVA including the factors Hemisphere (left; right) and ROI (inferior IFG; superior IFG; aSTG; STS; pMTG) was conducted. Importantly, the rmANOVA revealed a main effect of Hemisphere (F(1,24) = 34.67, P < 0.001, η2 P = 0.59), caused by higher decoding accuracies in the left hemisphere, whereas the main effect of ROI and the Hemisphere × ROI interaction were not significant (F(4,96) = 2.15, P > 0.05; F(4,96) = 0.82, P > 0.50; respectively) (see Fig. 2). To assure that these results were not caused by the left‐right asymmetry of the brain, the decoding accuracy maps were also spatially normalized to a symmetrical template (built from the SPM8 EPI template described in the Methods by mirroring the left hemisphere to the right). As before, the rmANOVA revealed a main effect of Hemisphere (F(1,24) = 47.63, P < 0.001, η2 P = 0.67), due to higher decoding accuracies in the left hemisphere, whereby the main effect of ROI and the Hemisphere × ROI interaction were not significant (F(4,96) = 2.14, P > 0.05; F(4,96) = 0.40, P > 0.70; respectively).
Table III.
Multivariate analysis: Brain regions discriminating between conditions in the grammaticality and in the perceptual markedness classification and peak voxel information
| Region | MNI peak coordinate (mm) | Classification | z‐score | Extent in voxel |
|---|---|---|---|---|
| Left iIFG (BA44) | −45 14 4 | G | 4.35 | 18 |
| Left sIFG (BA44) | −51 11 22 | G | 4.61 | 131 |
| Left aSTG | −51 5 −11 | G | 4.01 | 10 |
| Left STS | −63 −22 −2 | G | 4.90 | 28 |
| Left pMTG | −60 −43 −2 | G | 4.72 | 132 |
| Left STG/AC | −39 −22 1 | P | 3.87 | 9 |
| Right STG/AC (TE 1.0) | 54 −19 4 | P | 4.71 | 116 |
TE—temporal area “E”, STG—superior temporal gyrus, STS—superior temporal sulcus, MTG—middle temporal gyrus, IFG—inferior frontal gyrus, AC—auditory cortex, a—anterior, p—posterior, i—inferior, s—superior, G—grammaticality classification, P—perceptual markedness classification.
With respect to the Perceptual Markedness classification, a bilateral pattern was observed, revealing decoding accuracies significantly above chance level in the rather medial left and right STG. Thus, bilateral areas most likely belonging to belt and parabelt areas of the auditory cortex (and being relatively low in the language processing hierarchy) allowed the correct identification of perceptually overtly marked stimuli.
Although the cluster in the right hemisphere was much larger than the one in the left hemisphere, a one‐way rmANOVA including the factor Hemisphere (left; right) did not show a significant difference between decoding accuracies for peak‐centered spheres in the left and right hemisphere (F(1,24) = 0.19, P > 0.60) (see Fig. 2).
DISCUSSION
The present fMRI study aimed to test whether auditory sensory cortices are affected by initial syntactic processes, and—if so—to which processing step they specifically contribute. On this account, two‐word utterances that were either syntactically correct or contained a syntactic word category violation were presented. Additionally, the critical word category of the utterances was either perceptually overtly marked by a suffix or was unmarked, eliciting a salient acoustic difference as a consequence. The analysis revealed stronger hemodynamic responses for syntactically incorrect utterances compared to correct ones in the left IFG, the left aSTG, the left STS and in the right STS/STG, but no such difference in the AC. Instead, increased activation in the PAC/AC was observed for overtly marked items, revealing a perceptual response. These results were further confirmed by a second analysis using a MVPA. In the following, the findings are discussed in more detail starting at the behavioral level, followed by the perceptually‐based processes and grammar‐based processes.
Behaviorally, participants had more trouble judging the grammaticality of the correct yet unmarked utterances (e.g., “im Knie”, Engl. “in‐the knee”) compared to the other conditions. Previously, Herrmann et al. [2009] reported similar effects in their stimulus rating of two‐word phrases. This effect might be due to the slight category ambiguity of the noun (e.g., “Knie”, Engl. “knee”), because in speech, it could also serve as the seldom‐used imperative form of a verb (e.g., “knie nieder”, Engl. “kneel down”). Importantly, the current fMRI results do not show any specific neural responses to the correct unmarked condition, indicating automatic processing of these stimuli.
Neural Imprints of Perceptually‐Based Processes
With respect to perceptual processes, two‐word utterances which were perceptually overtly marked by the suffix “‐t” led to stronger hemodynamic responses bilaterally within the AC. Consistently, the MVPA also revealed STG/AC regions to be informative for separating the unmarked from the perceptually marked conditions, with no difference in decoding accuracies between hemispheres. These results are in line with previous studies showing that the PAC and (para)belt areas respond strongly to more basic acoustic features of the auditory signal, with increasing sensitivity to more complex stimuli in regions further away from the core regions [Kaas and Hackett,2000; Rauschecker and Tian,2004; Wessinger et al.,2001]. It should be mentioned, nonetheless, that in the current paradigm, the perceptual markedness contrast (marked vs. unmarked conditions) also reflects a verb vs. noun contrast, as only verbs were overtly marked by the suffix. However, this explanation is unlikely to account for the present findings as activation was restricted to the sensory cortices, whereas previous studies contrasting verbs with nouns revealed regions in the left IFG, middle frontal gyrus, MTG and STG [e.g., Perani et al.,1999; Tyler et al.,2004]. Additionally, participants' attention was drawn to the grammaticality of the utterances, requiring them to focus on the suffix, whose presence or absence rendered the utterances syntactically correct or incorrect. In essence, the sensitivity of the auditory cortices to the perceptually overt marker illustrates how higher‐level language regularities such as word category marking are intertwined with their acoustic realizations. The brain is likely to utilize all cues available to judge the grammaticality, which—in this case—is best solved on an acoustic basis, hence eliciting unambiguous (i.e., classifiable) neural patterns already in the sensory cortices.
Neural Imprints of Grammar‐Based Processes
Regarding syntactic processing, in their EEG study on similar two‐word utterances containing a syntactic phrase structure violation, Hasting and Kotz [2008] only found an early syntactic effect (between 100 and 300 ms) but no additional effect in a later time window. If their interpretation that these stimuli do not lead to P600 assigned revision processes is correct in principle, then for the current study, this implies that although fMRI lacks the fine‐grained temporal resolution in the range of milliseconds, the observed activations can be attributed to early automatic processes reflecting phrase structure building (difficulties) alone [Friederici et al.,1993; Hahne and Friederici,1999,2002], rather than to both early processes and processes associated with revision/repair [Friederici,2002; Friederici and Kotz,2003].
Recent studies which reported that syntactic violations can affect sensory cortex activations when unexpected form properties (e.g., an unexpected suffix) of the critical word category are encountered [Dikker et al.,2009,2010; Herrmann et al.,2009] must be seen in the context of the current findings which rather indicate that syntax as such triggers activations outside the auditory cortices. The activation patterns of the AC allowed distinguishing only the subtle acoustic differences between the two speech signals, i.e., the presence or absence of a suffix, while they were insensitive to grammaticality. This result was also confirmed by the MVPA that was applied because of its known high sensitivity, revealing informative patterns in the AC activations only for the perceptual markedness of the utterances but not for the grammaticality, a finding that is in line with the view that the primary auditory regions are not yet involved in speech‐specific processes [Scott and Johnsrude,2003].
The present results show that a wider neural network is involved in syntactic processes (i.e., initial phrase structure building and possible difficulties at this stage), which can be clearly distinguished from the regions involved in pure perceptual processes elicited by the presence of a suffix. In detail, comparison of syntactically incorrect with syntactically correct two‐word utterances revealed increased activation in the left IFG (BA44), the left aSTG, the left STS and the right STS/STG. Previous fMRI studies that investigated syntactic phrase structure violations reported activations in the left frontal operculum adjacent to BA44 rather than in BA44, in addition to activations in the STG [Brauer and Frederici,2007; Friederici et al.,2003]. The left BA44, however, has been shown to be involved in syntactic processing when syntactic complexity was varied [Lee and Newman,2010; Makuuchi et al.,2009], or when processing demands for sentences with syntactic phrase structure violations increases due to participants' inproficiency in the language [Brauer and Friederici,2007; Rüschemeyer et al.,2005], or when sentences containing phrase structure violations were randomly mixed with unintelligible sentences [Friederici et al.,2010]. Furthermore, in an fMRI study using visually presented two‐word phrases which included a syntactic word category violation, activation was found in the left BA44 as well [Kang et al.,1999]. Thus, the current results are in line with these previous findings showing the involvement of the inferior frontal cortex in syntactic processing, although it remains an open question under which conditions the frontal operculum as opposed to the pars opercularis (BA 44) is engaged in phrase structure processing.
We also observed stronger hemodynamic responses for syntactically incorrect utterances in the left aSTG and the left STS as well as in the right STS/STG. Moreover, the MVPA revealed similar results in the left hemisphere, with an additional cluster extending from the pSTS into the pMTG, whereas multivariate patterns informative for the experimental conditions in the right hemisphere were not significant. This is compatible with the notion of a left‐lateralized network for syntactic processing [Friederici,2002; Friederici and Kotz,2003]. Interestingly, in the ROI analysis, the left STS and the right STS/STG showed a perceptual markedness effect in addition to the syntactic effect. Although previous studies reported an involvement of the STS in a variety of different processes [for a review see Hein and Knight,2008], in the language domain, the STS has previously been associated with phonetic processing [Liebenthal et al.,2005; Obleser et al.,2007] and, in more posterior regions, with syntactic processing in general [Friederici et al.,2009,2010]. The left aSTG in particular, was found to be involved in syntactic processing only, confirming previous results that highlight the importance of the aSTG in syntactic processes [Brauer and Friederici,2007; Friederici et al.,2003; Humphries et al.,2005]. In conjunction with the MTG the STS has also been associated, with accessing the mental lexicon [Kotz et al.,2002; Obleser and Kotz,2010]. Previous functional and structural connectivity studies reported strong connections between auditory cortex regions and the anterior and posterior STS/STG [Caclin and Fonlupt,2006; Kumar et al.,2007; Upadhyay et al.,2008]. This is compatible with the current findings of the distribution of perceptually‐based and grammar‐based processes in AC and STS/STG.
To our knowledge, the current study is the first to report successful classification of syntactic processing brain states from multi‐voxel activation patterns. Importantly, the most prominent difference between the univariate and the multivariate analysis was the left‐hemispheric lateralization revealed by the multivariate pattern classification. In the present study, the activation estimates used for the pattern classification were based on a single GLM for each run, which provided a lower signal‐to‐noise ratio for these estimates than in the univariate approach. This in turn highlights the consistency of the left‐hemispheric neural network involved in syntactic processes [Friederici,2002; Herrmann et al.,2009; Kaan and Swaab,2002; Shtyrov et al.,2003].
CONCLUSIONS
To summarize, initial syntactic processing of two‐word utterances that contained a phrase structure violation led to the involvement of the left IFG, the left aSTG, the left‐STS and the right STS/STG, with some indications of a left‐hemispheric predominance. The AC, on the other hand, was only engaged in processing the perceptual aspect, namely the word category's suffix, but was not sensitive to syntactic manipulations. As a consequence, the present findings offer reconciliation for seemingly contradictory views on syntax‐inflicted sensory cortex modulations and allow a clear distinction between lower‐level auditory perceptual processes and higher‐level syntactic processes.
Acknowledgements
The authors thank Anke Kummer and Simone Wipper for helping to acquire the data and Rosie Wallis for proofreading the manuscript. Björn Herrmann was supported by the Deutsche Forschungsgemeinschaft, graduate program “Function of Attention in Cognition.” They thank two anonymous reviewing colleagues for their helpful comments.
REFERENCES
- Altmann CF, Hennig M, Döring KM, Kaiser J ( 2008): Effects of feature‐selective attention on auditory pattern and location processing. NeuroImage 41: 69–79. [DOI] [PubMed] [Google Scholar]
- Baillet S, Mosher JC, Leahy RM ( 2001): Electromagnetic brain mapping. IEEE Signal Process Mag 18: 14–30. [Google Scholar]
- Bornkessel‐Schlesewsky ID, Schlesewsky M, von Cramon DY ( 2009): Word order and Broca's region: Evidence for a supra‐syntactic perspective. Brain Lang 111: 125–139. [DOI] [PubMed] [Google Scholar]
- Brauer J, Friederici AD ( 2007): Functional neural networks of semantic and syntactic processes in the developing brain. J Cogn Neurosci 19: 1609–1623. [DOI] [PubMed] [Google Scholar]
- Brett M, Anton J‐L, Valabregue R, Poline J‐B ( 2002): Region of interest analysis using an SPM toolbox. Proc Int Conf Funct Mapp Hum Brain 16: 497. [Google Scholar]
- Caclin A, Fonlupt P ( 2006): Functional and effective connectivity in an fMRI study of an auditory‐related task. Eur J Neurosci 23: 2531–2537. [DOI] [PubMed] [Google Scholar]
- Chang C‐C, Lin C‐J ( 2001): LIBSVM: A library for support vector machines. Available at: http://www.csie.ntu.edu.tw/~cjlin/libsvm.
- Cusack R, Brett M, Osswald K ( 2003): An evaluation of the use of magnetic field maps to undistort echo‐planar images. NeuroImage 18: 127–142. [DOI] [PubMed] [Google Scholar]
- Dikker S, Rabagliati H, Pylkkänen L ( 2009): Sensitivity to syntax in visual cortex. Cognition 110: 293–321. [DOI] [PMC free article] [PubMed] [Google Scholar]
- Dikker S, Rabagliati H, Farmer TA, Pylkkänen L ( 2010): Early occipital sensitivity to syntactic category is based on form typicality. Psychol Sci 21: 629–634. [DOI] [PubMed] [Google Scholar]
- Eickhoff SB, Stephan KE, Mohlberg H, Grefkes C, Fink GR, Amunts K, Zilles K ( 2005): A new SPM toolbox for combining probabilistic cytoarchitectonic maps and functional imaging data. NeuroImage 25: 1325–1335. [DOI] [PubMed] [Google Scholar]
- Ethofer T, Van De Ville D, Scherer K, Vuilleumier P ( 2009): Decoding of emotional information in voice‐sensitive cortices. Curr Biol 19: 1028–1033. [DOI] [PubMed] [Google Scholar]
- Etzel JA, Gazzola V, Keysers C ( 2009): An introduction to anatomical ROI‐based fMRI classification analysis. Brain Res 1282: 114–125. [DOI] [PubMed] [Google Scholar]
- Formisano E, De Martino F, Bonte M, Goebel R ( 2008): “Who” is saying “what”? Brain‐based decoding of human voice and speech. Science 322: 970–973. [DOI] [PubMed] [Google Scholar]
- Friederici AD ( 2002): Towards a neural basis of auditory sentence processing. Trends Cogn Sci 6: 78–84. [DOI] [PubMed] [Google Scholar]
- Friederici AD, Kotz SA ( 2003): The brain basis of syntactic processes: Functional imaging and lesion studies. NeuroImage 20: 8–17. [DOI] [PubMed] [Google Scholar]
- Friederici AD, Pfeifer E, Hahne A ( 1993): Event‐related brain potentials during natural speech processing: Effects of semantic, morphological and syntactic violations. Cogn Brain Res 1: 183–192. [DOI] [PubMed] [Google Scholar]
- Friederici AD, Wang Y, Herrmann CS, Maess B, Oertel U ( 2000): Localization of early syntactic processes in frontal and temporal cortical areas: A magnetoencephalographic study. Hum Brain Mapp 11: 1–11. [DOI] [PMC free article] [PubMed] [Google Scholar]
- Friederici AD, Rüschemeyer S‐A, Hahne A, Fiebach CJ ( 2003): The role of left inferior frontal and superior temporal cortex in sentence comprehension: Localizing syntactic and semantic processes. Cereb Cortex 13: 170–177. [DOI] [PubMed] [Google Scholar]
- Friederici AD, Makuuchi M, Bahlmann J ( 2009): The role of the posterior superior temporal cortex in sentence comprehension. NeuroReport 20: 563–568. [DOI] [PubMed] [Google Scholar]
- Friederici AD, Kotz SA, Scott SK, Obleser J ( 2010): Disentangling syntax and intelligibility in auditory language comprehension. Hum Brain Mapp 31: 448–457. [DOI] [PMC free article] [PubMed] [Google Scholar]
- Friston KJ, Holmes AP, Worsley KJ, Poline J‐P, Frith CD, Frackowiak RSJ ( 1995): Statistical parametric maps in functional imaging: A general linear approach. Hum Brain Mapp 2: 189–210. [Google Scholar]
- Hagoort P, Brown C, Groothusen J ( 1993): The syntactic positive shift (SPS) as an ERP measure of syntactic processing. Lang Cogn Process 8: 439–483. [Google Scholar]
- Hahne A, Friederici AD ( 1999): Electrophysiological evidence for two steps in syntactic analysis: Early automatic and late controlled processes. J Cogn Neurosci 11: 194–205. [DOI] [PubMed] [Google Scholar]
- Hahne A, Friederici AD ( 2002): Differential task effects on semantic and syntactic processes as revealed by ERPs. Cogn Brain Res 13: 339–356. [DOI] [PubMed] [Google Scholar]
- Hasting AS, Kotz SA ( 2008): Speeding up syntax: On the relative timing and automaticity of local phrase structure and morphosyntactic processing as reflected in event‐related brain potentials. J Cogn Neurosci 20: 1207–1219. [DOI] [PubMed] [Google Scholar]
- Haynes J‐D, Rees G ( 2005): Predicting the orientation of invisible stimuli from activity in human primary visual cortex. Nat Neurosci 8: 686–691. [DOI] [PubMed] [Google Scholar]
- Haynes J‐D, Rees G ( 2006): Decoding mental states from brain activity in humans. Nat Rev Neurosci 7: 523–534. [DOI] [PubMed] [Google Scholar]
- Haynes J‐D, Sakkai K, Rees G, Gilbert S, Frith C, Passingham RE ( 2007): Reading hidden intentions in the human brain. Curr Biol 17: 323–328. [DOI] [PubMed] [Google Scholar]
- Hein G, Knight RT ( 2008): Superior temporal sulcus—it's my area: Or is it? J Cogn Neurosci 20: 2125–2136. [DOI] [PubMed] [Google Scholar]
- Herrmann B, Maess B, Hasting AS, Friederici AD ( 2009): Localization of the syntactic mismatch negativity in the temporal cortex: An MEG study. NeuroImage 48: 590–600. [DOI] [PubMed] [Google Scholar]
- Humphries C, Love T, Swinney D, Hickok G ( 2005): Response of anterior temporal cortex to syntactic and prosodic manipulations during sentence processing. Hum Brain Mapp 26: 128–138. [DOI] [PMC free article] [PubMed] [Google Scholar]
- Jezzard P, Balaban RS ( 1995): Correction for geometric distortion in echo planar images from B0 field variations. Magn Reson Med 34: 65–73. [DOI] [PubMed] [Google Scholar]
- Kaan E, Swaab TY ( 2002): The brain circuitry of syntactic comprehension. Trends Cogn Sci 6: 350–356. [DOI] [PubMed] [Google Scholar]
- Kaas JH, Hackett TA ( 2000): Subdivisions of auditory cortex and processing streams in primates. Proc Natl Acad Sci USA 97: 11793–11799. [DOI] [PMC free article] [PubMed] [Google Scholar]
- Kang AM, Constable RT, Gore JC, Avrutin S ( 1999): An event‐related fMRI study of implicit phrase‐level syntactic and semantic processing. NeuroImage 10: 555–561. [DOI] [PubMed] [Google Scholar]
- Knösche TR, Maess B, Friederici AD ( 1999): Processing of syntactic information monitored by brain surface current density mapping based on MEG. Brain Topogr 12: 75–87. [DOI] [PubMed] [Google Scholar]
- Kotz SA, Cappa SF, von Cramon DY, Friederici AD ( 2002): Modulation of the lexical‐semantic network by auditory semantic priming: An event‐related functional MRI study. NeuroImage 17: 1761–1772. [DOI] [PubMed] [Google Scholar]
- Kriegeskorte N, Bandettini P ( 2007): Analyzing for information, not activation, to exploit high‐resolution fMRI. NeuroImage 38: 649–662. [DOI] [PMC free article] [PubMed] [Google Scholar]
- Kriegeskorte N, Goebel R, Bandettini P ( 2006): Information‐based functional brain mapping. Proc Natl Acad Sci USA 103: 3863–3868. [DOI] [PMC free article] [PubMed] [Google Scholar]
- Kumar S, Stephan KE, Warren JD, Friston KJ, Griffiths TD ( 2007): Hierarchical processing of auditory objects in humans. PLoS Comput Biol 3: 977–985. [DOI] [PMC free article] [PubMed] [Google Scholar]
- Lancaster JL, Tordesillas‐Gutierrez D, Martinez M, Salinas F, Evans AC, Zilles K, Mazziotta JC, Fox PT ( 2007): Bias between MNI and Talairach coordinates analyzed using the ICBM‐152 brain template. Hum Brain Mapp 28: 1194–1205. [DOI] [PMC free article] [PubMed] [Google Scholar]
- Lee D, Newman SD ( 2010): The effect of presentation paradigm on syntactic processing: An event‐related fMRI study. Hum Brain Mapp 31: 65–79. [DOI] [PMC free article] [PubMed] [Google Scholar]
- Liebenthal E, Binder JR, Spitzer SM, Possing ET, Melder DA ( 2005): Neural substrates of phonemic perception. Cereb Cortex 15: 1621–1631. [DOI] [PubMed] [Google Scholar]
- Makuuchi M, Bahlmann J, Anwander A, Friederici AD ( 2009): Segregating the core computational faculty of human language from working memory. Proc Natl Acad Sci 106: 8362–8367. [DOI] [PMC free article] [PubMed] [Google Scholar]
- Mur M, Bandettini PA, Kriegeskorte N ( 2009): Revealing representational content with pattern‐information fMRI—An introductory guide. Social Cogn Affect Neurosci 4: 101–109. [DOI] [PMC free article] [PubMed] [Google Scholar]
- Norman KA, Polyn SM, Detre GJ, Haxby JV ( 2006): Beyond mind‐reading: Multi‐voxel pattern analysis of fMRI data. Trends Cogn Sci 10: 424–430. [DOI] [PubMed] [Google Scholar]
- Obleser J, Kotz SA ( 2010): Expectancy constraints in degraded speech modulate the language comprehension Network. Cereb Cortex 20: 633–640. [DOI] [PubMed] [Google Scholar]
- Obleser J, Zimmermann J, Van Meter J, Rauschecker JP ( 2007): Multiple stages of auditory speech perception reflected in event‐related fMRI. Cereb Cortex 17: 2251–2257. [DOI] [PubMed] [Google Scholar]
- Oldfield RC ( 1971): The assessment and analysis of handedness: The Edinburgh Inventory. Neuropsychologia 9: 97–113. [DOI] [PubMed] [Google Scholar]
- Perani D, Cappa SF, Schnur T, Tettamanti M, Collina S, Rosa MM, Fazio F ( 1999): The neural correlates of verb and noun processing: A PET study. Brain 122: 2337–2344. [DOI] [PubMed] [Google Scholar]
- Poldrack RA ( 2007): Region of interest analysis for fMRI. Social Cogn Affect Neurosci 2: 67–70. [DOI] [PMC free article] [PubMed] [Google Scholar]
- Rademacher J, Morosan P, Schormann T, Schleicher A, Werner C, Freund H‐J, Zilles K ( 2001): Probabilistic mapping and volume measurement of human primary auditory cortex. NeuroImage 13: 669–683. [DOI] [PubMed] [Google Scholar]
- Rauschecker JP, Tian B ( 2004): Processing of band‐passed noise in the lateral auditory belt cortex of the rhesus monkey. J Neurophysiol 91: 2578–2589. [DOI] [PubMed] [Google Scholar]
- Rüschemeyer S‐A, Fiebach CJ, Kempe V, Friederici AD ( 2005): Processing lexical semantic and syntactic information in first and second language: fMRI evidence from German and Russian. Hum Brain Mapp 25: 266–286. [DOI] [PMC free article] [PubMed] [Google Scholar]
- Scott SK, Johnsrude IS ( 2003): The neuroanatomical and functional organization of speech perception. Trends Neurosci 26: 100–107. [DOI] [PubMed] [Google Scholar]
- Shtyrov Y, Pulvermüller F ( 2007): Language in the mismatch negativity design: Motivations, benefits, and prospects. J Psychophysiol 21: 176–187. [Google Scholar]
- Shtyrov Y, Pulvermüller F, Näätänen R, Ilmoniemi RJ ( 2003): Grammar processing outside the focus of attention: An MEG Study. J Cogn Neurosci 15: 1195–1206. [DOI] [PubMed] [Google Scholar]
- Shtyrov Y, Osswald K, Pulvermüller F ( 2008): Memory traces for spoken words in the brain as revealed by the hemodynamic correlate of the mismatch negativity. Cereb Cortex 18: 29–37. [DOI] [PubMed] [Google Scholar]
- Slotnick SD, Schacter DL ( 2004): A sensory signature that distinguishes true from false memories. Nat Neurosci 7: 664–672. [DOI] [PubMed] [Google Scholar]
- Slotnick SD, Moo LR, Segal JB, Hart J Jr. ( 2003): Distinct prefrontal cortex activity associated with item memory and source memory for visual shapes. Cogn Brain Res 17: 75–82. [DOI] [PubMed] [Google Scholar]
- Tyler LK, Bright P, Fletcher P, Stamatakis EA ( 2004): Neural processing of nouns and verbs: The role of inflectional morphology. Neuropsychologia 42: 512–523. [DOI] [PubMed] [Google Scholar]
- Upadhyay J, Silver A, Knaus TA, Lindgren KA, Ducros M, Kim D‐S, Tager‐Flusberg H ( 2008): Effective and structural connectivity in the human auditory cortex. J Neurosci 28: 3341–3349. [DOI] [PMC free article] [PubMed] [Google Scholar]
- Wessinger CM, VanMeter J, Tian B, Van Lare J, Pekar J, Rauschecker JP ( 2001): Hierarchical organization of the human auditory cortex revealed by functional magnetic resonance imaging. J Cogn Neurosci 13: 1–7. [DOI] [PubMed] [Google Scholar]