

Abstract
The ability to stop a prepared response (reactive inhibition) appears to depend on the degree to which stopping is expected (proactive inhibition). Functional MRI studies have shown that activation during proactive and reactive inhibition overlaps, suggesting that the whole neural network for reactive inhibition becomes already activated in anticipation of stopping. However, these studies measured proactive inhibition as the effect of stop‐signal probability on activation during go trials. Therefore, activation could reflect expectation of a stop‐signal (evoked by the stop‐signal probability cue), but also violation of this expectation because stop‐signals do not occur on go trials. We addressed this problem, using a stop‐signal task in which the stop‐signal probability cue and the go‐signal were separated in time. Hence, we could separate activation during the cue, reflecting expectation of the stop‐signal, from activation during the go‐signal, reflecting expectation of the stop‐signal or violation of that expectation. During the cue, the striatum, the supplementary motor complex (SMC), and the midbrain activated. During the go‐signal, the right inferior parietal cortex (IPC) and the right inferior frontal cortex (IFC) activated. These findings suggest that the neural network previously associated with proactive inhibition can be subdivided into two components. One component, including the striatum, the SMC, and the midbrain, activated during the cue, implicating this network in proactive inhibition. Another component, consisting of the right IPC and the right IFC, activated during the go‐signal. Rather than being involved in proactive inhibition, this network appears to be involved in processes associated with violation of expectations. Hum Brain Mapp 34:2015–2024, 2013. © 2011 Wiley Periodicals, Inc.
Keywords: cognitive control, response inhibition, stop‐signal, anticipation, probabilistic, basal ganglia, striatum, presupplementary motor area, anterior cingulated, midbrain, inferior frontal cortex
INTRODUCTION
The ability to stop a prepared response (i.e., reactive inhibition) seems to depend on the degree to which stopping is expected (i.e., proactive inhibition). This is supported by experimental findings from stop‐signal tasks that manipulate stop‐signal expectation by varying the probability that stop‐signals occur. For example, the higher the stop‐signal probability the slower participants respond to go‐signals [Jahfari et al., 2010; Logan and Burkell, 1986; Ramautar et al., 2004, 2006; Verbruggen and Logan, 2009; Vink et al., 2005, 2006; Zandbelt and Vink, 2010; Zandbelt et al., 2011] and the slower participants respond to go‐signals the greater the chance that they can stop when a stop‐signal occurs [Logan and Cowan, 1984]. Across individuals, greater proactive response slowing is associated with faster reactive stopping [Chikazoe et al., 2009], perhaps indicating that greater proactive slowing causes faster reactive stopping. Furthermore, the higher the stop‐signal probability the longer it takes for activity in the primary motor cortex to reach the threshold for response initiation [Jahfari et al., 2010]. This could reflect that the state of the motor system before the onset of a stop‐signal determines whether or not a response can be stopped [Lo et al., 2009; van den Wildenberg et al., 2010].
Functional magnetic resonance imaging (fMRI) studies have shown that activation during proactive and reactive inhibition largely overlaps [Chikazoe et al., 2009; Jahfari et al., 2010; Swann et al., 2012; Zandbelt and Vink, 2010; Zandbelt et al., 2011]. This has led to the view that the whole neural network for reactive inhibition becomes already activated in anticipation of stopping [Aron, 2011]. Typically, proactive inhibition has been measured as the effect of stop‐signal probability on activation during go trials (i.e., trials in which a stop‐signal ultimately does not occur). For example, Chikazoe et al. (2009) identified brain regions involved in proactive inhibition by contrasting activation during go trials containing a go‐signal that was followed by a stop‐signal in 20% of all trials with activation during go trials containing a go‐signal that was never followed by a stop‐signal (i.e., trials in which stop‐signals would never be expected). Recently, we took a similar approach but varied stop‐signal probability in five steps from 0% to 33% [Zandbelt et al., 2011; Zandbelt and Vink, 2010].
Importantly, activation differences between stop‐signal probability contexts on go trials may not only reflect expectation of a stop‐signal (evoked by the stop‐signal probability cue), but also violation of this expectation, because stop‐signals do not actually occur on go trials. In other words, the expectation of a stop‐signal at the beginning of a trial, triggered by a cue indicating stop‐signal probability, is violated at the end of the trial when it becomes clear that no stop‐signal will occur. Previous studies could not distinguish between activation related to the expectation of a stop‐signal and activation associated with the violation of this expectation, because the cue indicating stop‐signal probability and the go‐signal were always presented simultaneously.
Here, we addressed this problem, using a stop‐signal task in which the stop‐signal probability cue and the stimulus period were separated in time (Fig. 1). Therefore, we could distinguish the effect of stop‐signal probability on activation during the cue period from the effect of stop‐signal probability on activation during the stimulus period.
Figure 1.
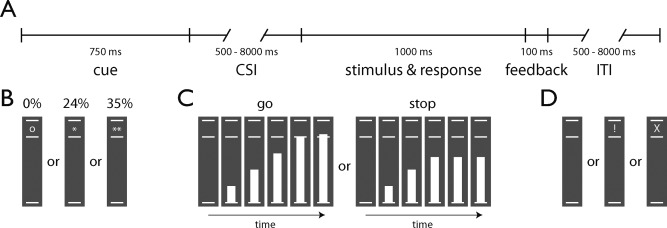
Delayed‐response version of the stop‐signal anticipation task. (A) Timeline of a trial. (B) Each trial started with the presentation of a cue for 750 ms that indicated the probability that a stop‐signal would be presented (o, 0%, N = 85; *, 24%, N = 85; **, 35%, N = 85). (C) After a variable cue‐stimulus interval (CSI, mean 4138 ms, range 500–8000 ms), a bar moved from the lower line towards the upper line, reaching the middle line in 800 ms. On go trials (80%, N = 205), participants had to stop the bar as close to the middle line as possible, by pressing a button with the right thumb (i.e., the target response time was 800 ms). On stop trials (20%, N = 50), the bar stopped moving automatically before reaching the middle line (i.e., stop‐signal), indicating that a response had to be suppressed. The initial stop‐signal delay (from the moment the bar started moving) was 500 ms and was adjusted in 33‐ms steps according to a tracking procedure. We used separate tracking procedures for each stop‐signal probability level. Stop trials were pseudorandomly interspersed between go trials. (D) Feedback was presented for 100 ms if the response time was longer than 900 ms (!) or if an error was made (X). The intertrial interval (ITI) was on average 4038 ms and ranged from 500 to 7900 ms. The task lasted 42 m and 37 s.
MATERIALS AND METHODS
Participants
Twenty‐two healthy volunteers (mean age 23.5 years, range 20–28 years; 13 women) participated in this study. All participants were right‐handed, had normal or corrected‐to‐normal vision, and gave written informed consent after having received complete description of the study. The study was approved by the University Medical Center Utrecht ethics committee and was performed in accordance with the Declaration of Helsinki.
Delayed‐Response Version of the Stop‐Signal Anticipation Task
Participants performed a delayed‐response version of the stop‐signal anticipation task [Zandbelt and Vink, 2010] that is described in detail in Figure 1. The SSAT is a modified version of the standard stop‐signal task [Lappin and Eriksen, 1966; Logan and Cowan, 1984; Verbruggen and Logan, 2008]. Participants are instructed to respond when a moving indicator reaches a target, but to suppress a response when this moving indicator stops automatically before reaching this target [Coxon et al., 2006, 2007, 2009; Slater‐Hammel, 1960]. In keeping with our previous studies [Zandbelt et al., 2011; Zandbelt and Vink, 2010], we investigated proactive inhibition by manipulating the probability that such a stop‐signal occurs. Stop‐signal probability was varied pseudorandomly across trials and was 0%, 24%, or 35%. Participants were extensively trained on this task before the fMRI experiment.
Data Acquisition
The experiment was performed on a 3.0 T MRI scanner (Philips Medical System, Best, The Netherlands) at the University Medical Center Utrecht. We collected 1600 whole‐brain T*2‐weighted echo planar images (EPI) with blood‐oxygen level‐dependent (BOLD) contrast in a single run and a T1‐weighted image for within‐subject registration purposes, using scan parameters identical to those described before [Zandbelt and Vink, 2010].
Behavioral Analysis
In keeping with previous studies, proactive inhibition was measured as the effect of stop‐signal probability on go trial response time (RT). We also expressed this effect in a single‐value index of proactive inhibition, called the stop‐signal probability slope, which is defined as the change in go trial RT per stop‐signal probability unit increase. Reactive inhibition, on the other hand, was measured in terms of the stop‐signal reaction time (SSRT) [Logan and Cowan, 1984]. The SSRT was computed according to the integration method [Logan and Cowan, 1984], separately for the 24% and 35% stop‐signal probability level.
The main outcome measure of interest was the effect of stop‐signal probability on go trial response time (RT). In addition, we investigated the effect of stop‐signal probability on other performance measures, including go trial accuracy, stop trial accuracy, the stop‐signal reaction time (SSRT) and RT on failed stop trials.
The effect of stop‐signal probability on go trial RT, go trial accuracy, SSRT, RT on failed stop trials, and stop trial accuracy was analyzed in separate repeated‐measures ANOVAs, with stop‐signal probability as factor. The correlation between the stop‐signal probability slope and the SSRT (pooled across stop‐signal probability contexts) was analyzed using the Pearson correlation coefficient.
fMRI Analysis
Functional images were analyzed with SPM5 (http://www.fil.ion.ucl.ac.uk/spm/software/spm5). Pre‐processing was performed as described before [Zandbelt and Vink, 2010], involving correction for slice timing differences, realignment for head motion correction, spatial normalization to the Montreal Neurological Institute (MNI) template brain, and spatial smoothing to accommodate interindividual differences in neuroanatomy.
Statistical analysis was performed within the framework of the general linear model and followed a two‐level procedure. We modeled the onsets of cue 0% (i.e., cue in the 0% stop‐signal probability context), cue 24%, cue 35%, response on go 0% trials, response on go 24% trials, response on go 35% trials, response on failed stop trials, target response time on successful stop trials, and explicit feedback. All events were modeled as a delta function, except for the cues that were modeled as a boxcar with duration of the period between cue and stimulus onset. The data were high‐pass filtered (cutoff: 128 s) to remove low‐frequency drifts and a first‐order autoregressive model was used to model the remaining serial correlations. We generated contrast images for cue 0%, cue 24%, cue 35%, response on go 0% trials, response on go 24% trials, and response on go 35% trials (all against baseline). Note that the effect of stop‐signal probability on activation during the cue and during the stimulus period cannot be contrasted directly, because cue periods were modeled as epochs whereas stimulus periods were modeled as events [Henson, 2007]. To enable a direct comparison, we first standardized cue and stimulus contrast images to Z‐score images and then computed an image of the effect of stop‐signal probability on these Z‐scores using linear regression, separately for the cue and the stimulus.
These images were entered into a second‐level random‐effects full factorial analysis, with trial component (cue vs. stimulus) as a within‐subject factor and the stop‐signal probability slope as a covariate of interest. This covariate was included to test the relation between the effect of stop‐signal probability on activation and go trial RT across participants during the cue versus during the stimulus period. Statistical parametric maps were tested for significance using cluster‐level inference (cluster‐defining threshold of P < 0.001, cluster‐probability of P < 0.05, familywise error corrected for multiple comparisons). For a graphical representation of the experimental effects, we used the activated clusters to extract mean contrast estimates.
In addition, we ran a region‐of‐interest (ROI) analysis to test the effect of stop‐signal probability on cue‐ and stimulus‐related activation in two right IFC local maxima that were found to be activated during proactive inhibition in our previous study [Zandbelt and Vink, 2010]. These ROIs were located in a ventral portion (x = 48, y = 12, z = 4) and dorsal portion (x = 56, y = 8, z = 24) of the right inferior frontal cortex. We extracted mean activation levels from spheres with a 6‐mm radius around the local maximum of each ROI for the cue and stimulus period and transformed these to Z scores (see above). These Z scores were analyzed in two repeated‐measures ANOVAs, with stop‐signal probability (0%, 24%, 35%) as factor.
RESULTS
Task Performance
Table 1 shows descriptive statistics of task performance on go and stop trials, separately for each stop‐signal probability context. First, we assessed whether it took longer to respond as stop‐signal probability increased (Fig. 2A). Whereas go trial RTs after a 0% stop‐signal probability cue were close to the target RT of 800 ms, go trial RTs became progressively slower as stop‐signal probability increased (linear contrast, F 1,21 = 36.61, P < 0.001). This is consistent with previous studies manipulating stop‐signal probability [Logan and Burkell, 1986; Ramautar et al., 2004, 2006; Verbruggen and Logan, 2009; Vink et al., 2005, 2006; Zandbelt and Vink, 2010] and suggests that participants slowed down proactively in anticipation of a stop‐signal. There was no effect of stop‐signal probability on Go trial accuracy (linear contrast, F1 ,21 < 1, P = 0.46).
Table 1.
Descriptive statistics for go and stop trials
| Trial type | Stop‐signal probability | ||
|---|---|---|---|
| 0% | 24% | 35% | |
| Go | |||
| Accuracy (%) | 99.5 ± 1.6 | 99.2 ± 1.8 | 99.3 ± 1.4 |
| RT (ms) | 808 ± 14 | 821 ± 20 | 829 ± 21 |
| Stop | |||
| Accuracy (%) | — | 49.3 ± 3.2 | 50.0 ± 2.7 |
| SSD (ms) | — | 493 ± 23 | 493 ± 26 |
| SSRT (ms) | — | 328 ± 20 | 336 ± 16 |
| Failed RT (ms) | — | 796 ± 27 | 793 ± 29 |
All figures represent mean ± s.d.; RT, response time; SSD, stop‐signal delay; SSRT, stop‐signal reaction time.
Figure 2.
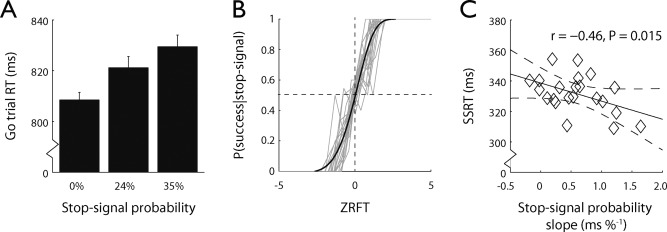
Stop‐signal anticipation task performance. (A) Go trial response times increased as a function of stop‐signal probability. Bars represent mean go trial response times, error bars indicate standard errors. (B) Normalized inhibition functions plotting the probability of successful stopping given a stop‐signal against the Z‐transformed relative finishing time [Logan and Cowan, 1984]. The gray graphs represent individual inhibition functions, the smooth opaque graph is a Weibull function fitted to the group average normalized inhibition function. The horizontal dashed line indicates that the mean proportion of successfully inhibited trials was 50%. (C) SSRT was negatively correlated with the stop‐signal probability slope, the change in go trial response time per stop‐signal probability unit increase. Each data point represents a single subject. The regression line and the 95% confidence bands are given as solid and dashed lines, respectively.
Stop trial accuracy was close to 50%, indicating the effectiveness of the staircase procedure, and did not differ between stop‐signal probability contexts (F 1,21 < 1, P = 0.38). Furthermore, task performance was in line with predictions of the race model [Logan and Cowan, 1984]: The inhibition functions of all participants showed that stopping rate decreased with later stop‐signal onset (Fig. 2B), response times on failed stop trials were faster than on go trials (t(21) = 12.92, P < 0.001). The SSRT was similar to those in previous reports of the stop‐signal anticipation task [Zandbelt et al., 2011; Zandbelt and Vink, 2010] and other modified versions of the stop‐signal task [e.g., Cai et al., 2011; van Gaal et al., 2009; Verbruggen et al., 2010]. SSRTs did not differ between stop‐signal probability contexts (t(21) = 1.35, P = 0.19), confirming others [Verbruggen and Logan, 2009]. There were also no significant effects of stop‐signal probability on response times on unsuccessful stop trials (F 1,21 < 1, P = 0.62), neither on stop trial accuracy (F 1,21 < 1, P = 0.38).
Next, we tested whether greater proactive slowing was associated with faster reactive stopping, as previously reported [Chikazoe et al., 2009]. We examined the relationship between the stop‐signal probability slope (i.e., the change in go trial RT per stop‐signal probability unit increase) and the stop‐signal reaction time (SSRT) (Fig. 2B). The stop‐signal probability slope and the SSRT were negatively correlated (r = −0.46, P = 0.015), replicating the finding from Chikazoe et al. This correlation could indicate that greater response slowing causes more efficient stopping. However, as noted above, SSRTs did not differ significantly between high and low stop‐signal probability contexts. Moreover, this difference, if any, was in fact in the opposite direction: SSRTs were longer in the high versus low stop‐signal probability context (Table 1). A more plausible explanation for the correlation between the stop‐signal probability slope and the SSRT could therefore be that participants who are good at proactive inhibition are also competent in reactive inhibition.
Functional MRI
In an initial analysis, we examined the effect of stop‐signal probability on activation during the cue and the stimulus period, separately (Supporting Information Figure S1 and Table SI). During the cue, activation increased as a function of stop‐signal probability in the left and right striatum, the supplementary motor complex (SMC), the midbrain, and the left and right insula. During the stimulus period on go trials, there was a significant effect of stop‐signal probability on activation in the right inferior parietal cortex (IPC) and the right inferior frontal cortex (IFC) extending into the middle frontal cortex (MFC). Combined, the networks activated during the cue and the stimulus show striking overlap with the networks reported by previous reports studying proactive inhibition [Chikazoe et al., 2009; Jahfari et al., 2010; Zandbelt and Vink, 2010].
These fMRI results appear to indicate that the network previously associated with proactive inhibition can be separated into two distinct components. To test this idea directly, we contrasted the effect of stop‐signal probability on activation during the cue and the stimulus period (Fig. 3, Supporting Information Table SII). Several regions showed a greater effect of stop‐signal probability on activation during the cue versus the stimulus period, including the left and right striatum, the SMC, the midbrain, and the left premotor cortex. There was a greater effect of stop‐signal probability on activation during the stimulus versus the cue period in the right IPC and the right IFC/MFC. These findings confirm that the neural network previously associated with proactive inhibition can be divided into two subcomponents.
Figure 3.
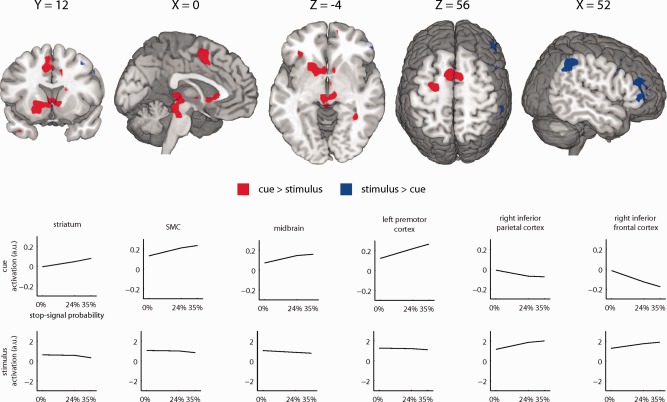
Effect of stop‐signal probability on brain activation differs between cue and stimulus period. Brain regions showing a significant increase in activation as a function of stop‐signal probability during the cue versus the stimulus period on go trials (red) or during the stimulus period on go trials versus the cue period (blue). Significant clusters of activation (P < 0.05, FWE‐corrected) are displayed on a normalized brain (neurological orientation, left is left). Line graphs are shown to provide a graphical representation of the mean effect of stop‐signal probability on activation during the cue (top row) and during the stimulus period (bottom row). [Color figure can be viewed in the online issue, which is available at http://wileyonlinelibrary.com.]
It is noteworthy that the current right IFC activation clusters lie more anteriorly and superiorly as compared to those reported by previous studies [Chikazoe et al., 2009; Jahfari et al., 2010; Swann et al., 2012; Zandbelt et al., 2011; Zandbelt and Vink, 2010]. We therefore investigated the effect of stop‐signal probability on cue‐ and stimulus‐related activation in two ROIs centered on the two peak coordinates in the right IFC of the proactive inhibition contrast in our previous experiment: a ventral site (x = 48, y = 12, z = 4) and a dorsal site (x = 56, y = 8, z = 24). Figure 4 shows the location of these ROI and how stop‐signal probability modulates activation levels in the cue and the stimulus periods. Whereas there were no significant effects of stop‐signal probability on cue‐related activation (dorsal site: F 1,21 < 1, P = 0.62; ventral site: F 1,21 < 1, P = 0.73), activation did increase with stop‐signal probability during the stimulus period (dorsal site, F 1,21 < 1, P = 0.008; ventral site, F 1,21 < 1, P = 0.04). Thus, also in regions reported by previous studies of proactive inhibition, right IFC activation occurs during the stimulus rather than during the cue period.
Figure 4.
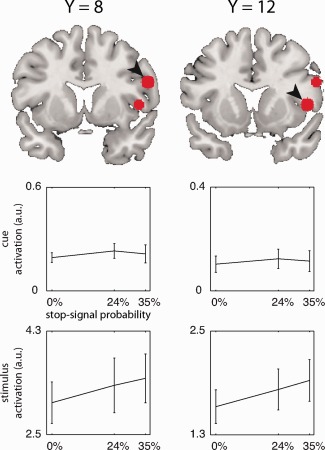
Effect of stop‐signal probability on brain activation in right inferior frontal cortex regions‐of‐interest (ROIs) during the cue (upper line graphs) and during the stimulus (lower line graphs). Arrowheads indicate for which ROI data is shown. ROIs were defined as spheres with a 6‐mm radius around local maxima reported by Zandbelt and Vink (2010). [Color figure can be viewed in the online issue, which is available at http://wileyonlinelibrary.com.]
Finally, we tested whether interindividual differences in activation levels during the cue and the stimulus period could be explained by between‐subjects variation in the degree of proactive slowing. We tested the between‐subjects relation between the effect of stop‐signal probability on activation and go trial RT during the cue against this relation during the stimulus period. (Fig. 5, Supporting Information Table SIII). We found a stronger positive relationship during the cue than during the stimulus in the left and right striatum, the SMA, and in the occipital cortex, as well as in the ventromedial prefrontal cortex. In contrast, there was a stronger positive relationship between proactive slowing and activation during the stimulus in the right IPC. Correlations in the midbrain and left premotor cortex (during the cue period), as well as the right IFC (during the stimulus period) did not reach whole‐brain corrected significance, even though these regions did activate as a function of stop‐signal probability (Fig. 3). Nevertheless, post hoc exploratory analyses of activation in 6‐mm spheres around the local maxima of these regions (Supporting Information Table SII) revealed a stronger positive relationship during the cue versus the stimulus period in the midbrain (P = 0.010, small volume corrected, SVC) and the left premotor cortex (P = 0.001, SVC), as well as a stronger positive relationship during the stimulus versus the cue period in the right IFC (P = 0.002, SVC). Thus, participants showing the greatest degree of proactive slowing showed the strongest activation of the striatum, the SMC and the midbrain during the cue, and the strongest activation of the right IPC and right IFC during the stimulus period.
Figure 5.
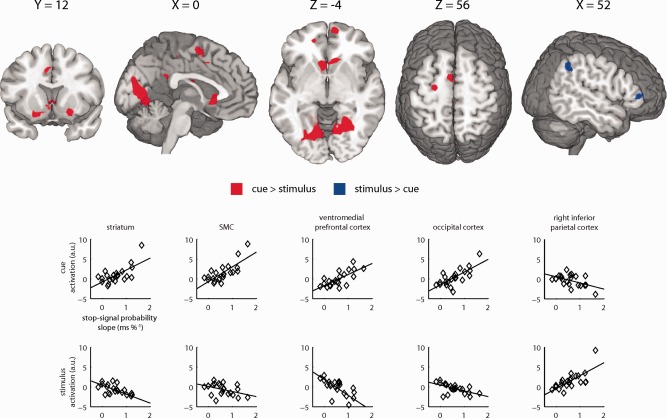
Effect of stop‐signal probability on brain activation in relation to proactive slowing differs between cue and stimulus period. Brain regions shown a significantly stronger positive relationship during the cue than during the stimulus period increase in activation as a function of stop‐signal probability during the cue versus stimulus period on go trials (red) or during the stimulus period on go trials versus the cue (blue). Significant clusters of activation (P < 0.05, FWE‐corrected) are displayed on a normalized brain (neurological orientation, left is left). Scatter graphs are shown to provide a graphical representation of the relation between the behavioral and physiological sensitivity to increasing stop‐signal probability during the cue (top row) and during the stimulus period on go trials (bottom row). [Color figure can be viewed in the online issue, which is available at http://wileyonlinelibrary.com.]
DISCUSSION
We studied the neural network associated with proactive inhibition (i.e., expectation of stopping). Previous fMRI studies measured proactive inhibition as the effect of stop‐signal probability on activation during go trials [Chikazoe et al., 2009; Jahfari et al., 2010; Swann et al., 2012; Zandbelt et al., 2011; Zandbelt and Vink, 2010]. However, this activation may not only reflect expectation of a stop‐signal (evoked by the stop‐signal probability cue presented at the beginning of each trial), but also violation of that expectation (occurring at the end of a go trial when it becomes clear that no stop‐signal will be presented). These studies could not dissociate expectation and violation of that expectation, because the stop‐signal probability cue and the go stimulus were presented simultaneously. Here, we used a stop‐signal task in which the stop‐signal probability cue and the stimulus were separated in time. Therefore, we could distinguish the effect of stop‐signal probability on activation during the cue from the effect of stop‐signal probability on activation during the stimulus period. We showed a network including the left and the right striatum, the supplementary motor complex (SMC), and the midbrain activated during the cue. In contrast, a network consisting of the right inferior parietal cortex (IPC) and the right inferior and middle frontal cortex (IFC/MFC, hereafter referred to as IFC) activated during the stimulus period. In both networks, greater activation was associated with greater proactive slowing across participants.
When added together, the networks activated during the cue and the stimulus period correspond very well to the network observed in previous fMRI studies of proactive inhibition [Chikazoe et al., 2009; Jahfari et al., 2010; Zandbelt and Vink, 2010] as well as to the network activated during reactive inhibition (for review, see Chambers et al., 2009). Previous studies have therefore suggested that the whole network underlying reactive inhibition becomes activated already in anticipation of a stop‐signal [Aron, 2011; Chikazoe et al., 2009; Jahfari et al., 2010; Zandbelt and Vink, 2010]. The present findings appear to challenge this view in that only a part of this network becomes activated before a stop‐signal occurs, whereas other regions, such as the right IFC and the right IPC, do not activate during the cue but only during the stimulus period. In what follows, we will argue that the network activated during the cue period is involved in processes related to expectation of the stop‐signal (i.e., proactive inhibition) whereas the network activated during the stimulus period is involved in processes associated with violation of expectations.
Cue‐related activation in the striatum and the SMC has been associated with preparation for inhibition of motor responses [Apicella et al., 1992; Chen et al., 2010; Curtis and D'Esposito, 2003; Watanabe and Munoz, 2010]. Anticipatory activation in the striatum and the SMC may reflect the act of increasing the threshold that triggers a motor response (i.e., response threshold). Participants increase the response threshold when they expect a stop‐signal [Verbruggen and Logan, 2009] and there is evidence to suggest that the striatum and the SMC are involved in such response threshold adjustments [Chen et al., 2010; Forstmann et al., 2008; Lo and Wang, 2006; Stuphorn and Schall, 2006]. So, our findings are consistent with the idea that the striatum and the SMC have a central role in proactive inhibition [Aron, 2011; Chen et al., 2010; Stuphorn et al., 2010; Vink et al., 2005, 2006; Zandbelt and Vink, 2010].
In addition, we found cue‐related activation in the midbrain. This region harbors the ventral tegmental area and the substantia nigra pars compacta, the main dopaminergic cell groups in the midbrain. The midbrain activation we report might reflect increased dopaminergic signaling. This is consistent with the idea that midbrain dopaminergic neurons are fundamental to proactive control [Braver et al., 2007]. Furthermore, our findings corroborate a study applying the stop‐signal task showing that midbrain fMRI signals predict response strategy adjustments in the forthcoming trial [Boehler et al., 2010], possibly implemented by the striatum and the SMC. However, these interpretations are speculative and should be made with caution, because midbrain fMRI signals are at best indirectly associated with activity in midbrain dopaminergic neurons and may be confounded by the presence of nearby pulsatile blood vessels [D'Ardenne et al., 2008; Düzel et al., 2009].
Activation in the right IFC and right IPC also increased as a function of stop‐signal probability. However, rather than during the cue, these effects occurred during the stimulus period. Therefore, this activation could reflect either expectation of a stop‐signal or violation of that expectation. The right IFC has indeed been implicated in proactive control [Braver et al., 2007], particularly in the maintenance of contextual information (e.g., stop‐signal probability) to bias processing in pathways responsible for task performance. However, if the right IFC maintains stop‐signal probability then it should activate during the cue‐stimulus interval, but it did not. Alternatively, the right IFC might implement proactive inhibition, but only from the time when a stop‐signal can be expected (i.e., after the bar starts rising). This would explain why the right IFC activates time‐locked to the stimulus rather than during the cue. Nevertheless, this appears unlikely, given previous stop‐signal studies showing that activity in the right IFC is modulated after rather than before stop‐signal onset [Swann et al., 2009] and that stimulation of the right IFC alters reactive inhibition, but not proactive inhibition [Bloemendaal et al., 2010; Verbruggen et al., 2010]. Furthermore, a recent electrocorticogram study in a single patient performing a similar stop‐signal task showed that the rIFC response occurs as late as around response time, rather than time‐locked to the cue or the go stimulus [Swann et al., 2012]. In contrast, the SMC did modulate earlier, between the presentation of the cue and the go stimulus, in agreement with the present findings. Finally, neither of these interpretations explains the meaning of right IPC activation. Thus, the right IPC and the right IFC may not be involved in proactive inhibition.
Instead, stimulus‐related activation of the right IPC and the right IFC could reflect that an expected stop‐signal did not occur. Participants demonstrated proactive slowing, indicating that they expected stop‐signals. However, in the trials we analyzed (i.e., go trials) this expectation was violated because no stop‐signal occurred. Indeed, unexpected events activate the right IPC and the right IFC [Arrington et al., 2000; Asplund et al., 2010; Corbetta et al., 2000] and the more unexpected an event the larger the activation in these regions [Shulman et al., 2009; Vossel et al., 2006]. It is likely that stop‐signal expectation is updated over the course of a trial (i.e., it declines as the rising bar gets closer to the target line). The right IPC and the right IFC have also been implicated in such online updating of temporal expectations [Coull, 2009; Nobre et al., 2007]. More generally, the right IPC and the right IFC constitute a network that is concerned with externally driven bottom‐up processes (e.g., updating of expectations) rather than internally driven top‐down processes (e.g., expectation of a stop‐signal) [Corbetta et al., 2008; Corbetta and Shulman, 2002]. Thus, stop‐signal probability effects on right IPC and right IFC activation reported here and elsewhere [Chikazoe et al., 2009; Jahfari et al., 2010; Swann et al., 2012; Zandbelt et al., 2011; Zandbelt and Vink, 2010] may reflect expectancy violation and updating of expectations rather than stop‐signal expectation. In fact, many of the conditions that activate the ventral network may involve violating an expectation [Corbetta et al., 2008]. Therefore, right IPC and right IFC activation during reactive inhibition (i.e., during successful stop versus go trials) may also be interpreted in terms of expectancy violation and updating of expectations. That is, the onset of a stop‐signal can be viewed as an unexpected event. Future studies, using techniques with millisecond temporal resolution such as magnetoencephalography, should examine the timing of activity in the right IPC and the right IFC. If the modulation of activity by stop‐signal probability occurs time‐locked to stimulus onset, then it probably reflects expectation of a stop‐signal. However, if it occurs around the time a stop‐signal is presented or around response time, then it is more likely to indicate violation of expectation. Recent findings from Swann et al. (2012), discussed above, support the latter explanation, but replication in a larger sample is required.
A potential caveat of this study is that the effect of stop‐signal probability on go trial RTs could reflect, in part, a waiting strategy (delayed facilitation of a response) rather than proactive inhibition (active suppression of a response). This alternative explanation cannot be ruled out based on the present findings. However, findings from other experiments suggest that proactive slowing is due to active suppression rather than delayed facilitation of a response. First, a study measuring corticomotor excitability using motor evoked potentials (MEPs) during a similar stop‐signal paradigm found that the MEP of the hand that might need to be stopped was reduced in comparison to rest [Cai et al., 2011]. Importantly, this reduction in corticomotor excitability occurred already before an action was triggered (i.e., before the go‐signal), indicating that this effect is more likely due to active suppression than delayed facilitation. Second, another TMS experiment investigating the neurocognitive mechanisms of proactive slowing, concluded that proactive slowing was better explained active suppression than delayed facilitation [Jahfari et al., 2010]. Third, computational modeling of task performance in a stop‐signal task involving proactive inhibition suggests response slowing in anticipation of a stop‐signal is associated with an increased response threshold [Verbruggen and Logan, 2009a]. Together, these studies suggest that proactive slowing more likely reflects active suppression rather than delayed facilitation of a response.
Our findings provide strong support for the involvement of the striatum, the SMC, and the midbrain in anticipation of stopping. We interpreted these results in terms of top‐down control through response threshold adjustments, but there may be alternative explanations. For example, activation during proactive inhibition may also be interpreted in terms of conflict [Neubert and Klein, 2010]. In the current task design, greater stop‐signal probability automatically resulted in greater uncertainty and therefore greater response conflict. Future experiments should try to distinguish between these explanations by varying stop‐signal probability independently from uncertainty.
CONCLUSION
We show that the neural network previously associated with proactive inhibition can be subdivided into two components. One component, including the striatum, the SMC, and the midbrain, activated during the cue, implicating this network in proactive inhibition. Another component, consisting of the right IPC and the right IFC, activated during the stimulus period. Rather than being involved in proactive inhibition, this network may be involved in processes associated with violation of expectations.
Supporting information
Supporting Information Figure 1
Supporting Information Table 1
Acknowledgments
The authors thank Mariët van Buuren and Thomas Gladwin for helpful comments on a previous version of the manuscript.
REFERENCES
- Apicella P, Scarnati E, Ljungberg T, Schultz W (1992): Neuronal activity in monkey striatum related to the expectation of predictable environmental events. J Neurophysiol 68:945–60. [DOI] [PubMed] [Google Scholar]
- Aron AR (2011): From reactive to proactive and selective control: Developing a richer model for stopping inappropriate responses. Biol Psychiatry 69:e55–e68. [DOI] [PMC free article] [PubMed] [Google Scholar]
- Arrington CM, Carr TH, Mayer AR, Rao SM (2000): Neural mechanisms of visual attention: Object‐based selection of a region in space. J Cogn Neurosci 12 (Suppl 2):106–117. [DOI] [PubMed] [Google Scholar]
- Asplund CL, Todd JJ, Snyder AP, Marois R (2010): A central role for the lateral prefrontal cortex in goal‐directed and stimulus‐driven attention. Nat Neurosci 13:507–512. [DOI] [PMC free article] [PubMed] [Google Scholar]
- Bloemendaal M, Zandbelt BB, Kahn RS, Vink M (2010): Effects of prefrontal stimulation on stop‐signal response inhibition: A combined fMRI/rTMS study. Program No. 734.7. 2010 Neuroscience Meeting Planner. San Diego, CA: Society for Neuroscience. [Google Scholar]
- Boehler CN, Bunzeck N, Krebs RM, Noesselt T, Schoenfeld MA, Heinze HJ, Münte TF, Woldorff MG, Hopf JM (2010): Substantia nigra activity level predicts trial‐to‐trial adjustments in cognitive control. J Cogn Neurosci 23:362–373. [DOI] [PMC free article] [PubMed] [Google Scholar]
- Braver TS, Gray JR, Burgess GC (2007): Explaning the many varieties of working memory variation: Dual mechanisms of cognitive control In: Conway A, Jarrold C, Kane M, Miyake A, Towse K, editors. Variation in Working Memory. Oxford: Oxford University Press; pp 76–106. [Google Scholar]
- Cai W, Oldenkamp CL, Aron AR (2011): A proactive mechanism for selective suppression of response tendencies. J Neurosci 31:5965–5969. [DOI] [PMC free article] [PubMed] [Google Scholar]
- Chambers CD, Garavan H, Bellgrove MA (2009): Insights into the neural basis of response inhibition from cognitive and clinical neuroscience. Neurosci Biobehav Rev 33:631–646. [DOI] [PubMed] [Google Scholar]
- Chen X, Scangos K, Stuphorn V (2010): Supplementary motor area exerts proactive and reactive control of arm movements. J Neurosci 30:14657–14675. [DOI] [PMC free article] [PubMed] [Google Scholar]
- Chikazoe J, Jimura K, Hirose S, Yamashita K‐i, Miyashita Y, Konishi S (2009): Preparation to inhibit a response complements response inhibition during performance of a stop‐signal task. J Neurosci 29:15870–15877. [DOI] [PMC free article] [PubMed] [Google Scholar]
- Corbetta M, Kincade JM, Ollinger JM, McAvoy MP, Shulman GL (2000): Voluntary orienting is dissociated from target detection in human posterior parietal cortex. Nat Neurosci 3:292–297. [DOI] [PubMed] [Google Scholar]
- Corbetta M, Patel G, Shulman GL (2008): The reorienting system of the human brain: From environment to theory of mind. Neuron 58:306–324. [DOI] [PMC free article] [PubMed] [Google Scholar]
- Corbetta M, Shulman GL (2002): Control of goal‐directed and stimulus‐driven attention in the brain. Nat Rev Neurosci 3:201–215. [DOI] [PubMed] [Google Scholar]
- Coull JT (2009): Neural substrates of mounting temporal expectation. PLoS Biol 7:e1000166. [DOI] [PMC free article] [PubMed] [Google Scholar]
- Coxon JP, Stinear CM, Byblow WD (2006): Intracortical inhibition during volitional inhibition of prepared action. J Neurophysiol 95:3371–3383. [DOI] [PubMed] [Google Scholar]
- Coxon JP, Stinear CM, Byblow WD (2007): Selective inhibition of movement. J Neurophysiol 97:2480–2489. [DOI] [PubMed] [Google Scholar]
- Coxon JP, Stinear CM, Byblow WD (2009): Stop and go: The neural basis of selective movement prevention. J Cogn Neurosci 21:1193–1203. [DOI] [PubMed] [Google Scholar]
- Curtis CE, D'Esposito M (2003): Success and failure suppressing reflexive behavior. J Cogn Neurosci 15:409–418. [DOI] [PubMed] [Google Scholar]
- D'Ardenne K, McClure SM, Nystrom LE, Cohen JD (2008): BOLD responses reflecting dopaminergic signals in the human ventral tegmental area. Science 319:1264–1297. [DOI] [PubMed] [Google Scholar]
- Düzel E, Bunzeck N, Guitart‐Masip M, Wittmann B, Schott BH, Tobler PN (2009): Functional imaging of the human dopaminergic midbrain. Trends Neurosci 32:321–328. [DOI] [PubMed] [Google Scholar]
- Forstmann BU, Dutilh G, Brown S, Neumann J, von Cramon DY, Ridderinkhof KR, Wagenmakers EJ (2008): Striatum and pre‐SMA facilitate decision‐making under time pressure. Proc Natl Acad Sci USA 105:17538–17542. [DOI] [PMC free article] [PubMed] [Google Scholar]
- Henson R (2007): Efficient experimental design for fMRI In: Friston KJ, Ashburner JT, Kiebel SJ, Nichols TE, Penny W, editors. Statistical Parametric Mapping. The Analysis of Functional Brain Images, 1st ed London: Academic Press; pp 193–210. [Google Scholar]
- Jahfari S, Stinear C, Claffey M, Verbruggen F, Aron A (2010): Responding with restraint: What are the neurocognitive mechanisms? J Cogn Neurosci 22:1479–1492. [DOI] [PMC free article] [PubMed] [Google Scholar]
- Lappin JS, Eriksen CW (1966): Use of a delayed signal to stop a visual reaction‐time response. J Exp Psychol 72:805–811. [Google Scholar]
- Lo C, Boucher L, Paré M, Schall JD, Wang X (2009): Proactive inhibitory control and attractor dynamics in countermanding action: A spiking neural circuit model. J Neurosci 29:9059–9071. [DOI] [PMC free article] [PubMed] [Google Scholar]
- Lo C, Wang X (2006): Cortico‐basal ganglia circuit mechanism for a decision threshold in reaction time tasks. Nat Neurosci 9:956–963. [DOI] [PubMed] [Google Scholar]
- Logan GD, Burkell J (1986): Dependence and independence in responding to double stimulation. A comparison of stop, change, and dual‐task paradigms. J Exp Psychol: Hum Percept Perform 12:549–563. [Google Scholar]
- Logan GD, Cowan WB (1984): On the ability to inhibit thought and action: A theory of an act of control. Psychol Rev 91:291–327. [DOI] [PubMed] [Google Scholar]
- Neubert F‐X, Klein M (2010): What is driving inhibition‐related activity in the frontal lobe? J Neurosci 30:4830. [DOI] [PMC free article] [PubMed] [Google Scholar]
- Nobre A, Correa A, Coull J (2007): The hazards of time. Curr Opin Neurobiol 17:465–470. [DOI] [PubMed] [Google Scholar]
- Ramautar JR, Kok A, Ridderinkhof KR (2004): Effects of stop‐signal probability in the stop‐signal paradigm: The N2/P3 complex further validated. Brain Cogn 56:234–252. [DOI] [PubMed] [Google Scholar]
- Ramautar JR, Slagter HA, Kok A, Ridderinkhof KR (2006): Probability effects in the stop‐signal paradigm: The insula and the significance of failed inhibition. Brain Res 1105:143–154. [DOI] [PubMed] [Google Scholar]
- Shulman G, Astafiev S, Franke D, Pope D, Snyder A, Mcavoy M, Corbetta M (2009): Interaction of stimulus‐driven reorienting and expectation in ventral and dorsal frontoparietal and basal ganglia‐cortical networks. J Neurosci 29:4392. [DOI] [PMC free article] [PubMed] [Google Scholar]
- Slater‐Hammel AT (1960): Reliability, accuracy, and refractoriness of a transit reaction. Res Q 31:217–228. [Google Scholar]
- Stuphorn V, Brown JW, Schall JD (2010): Role of supplementary eye field in saccade initiation: Executive, not direct, control. J Neurophysiol 103:801–816. [DOI] [PMC free article] [PubMed] [Google Scholar]
- Stuphorn V, Schall JD (2006): Executive control of countermanding saccades by the supplementary eye field. Nat Neurosci 9:925–931. [DOI] [PubMed] [Google Scholar]
- Swann N, Tandon N, Canolty R, Ellmore TM, McEvoy LK, Dreyer S, DiSano M, Aron AR (2009): Intracranial EEG reveals a time‐ and frequency‐specific role for the right inferior frontal gyrus and primary motor cortex in stopping initiated responses. J Neurosci 29:12675–12685. [DOI] [PMC free article] [PubMed] [Google Scholar]
- Swann NC, Cai W, Conner CR, Pieters TA, Claffey MP, George JS, Aron AR, Tandon N (2012): Roles for the pre‐supplementary motor area and the right inferior frontal gyrus in stopping action: Electrophysiological responses and functional and structural connectivity. Neuroimage 59:2860–2870. [DOI] [PMC free article] [PubMed] [Google Scholar]
- van den Wildenberg WPM, Burle B, Vidal F, van der Molen MW, Ridderinkhof KR, Hasbroucq T (2010): Mechanisms and dynamics of cortical motor inhibition in the stop‐signal paradigm: A TMS study. J Cogn Neurosci 22:225–239. [DOI] [PubMed] [Google Scholar]
- van Gaal S, Ridderinkhof KR, van den Wildenberg WPM, Lamme VAF (2009): Dissociating consciousness from inhibitory control: Evidence for unconsciously triggered response inhibition in the stop‐signal task. Journal of experimental psychology Hum Percept Perform 35:1129–1139. [DOI] [PubMed] [Google Scholar]
- Verbruggen F, Aron AR, Stevens MA, Chambers CD (2010): Theta burst stimulation dissociates attention and action updating in human inferior frontal cortex. Proc Natl Acad Sci USA 107:13966–13971. [DOI] [PMC free article] [PubMed] [Google Scholar]
- Verbruggen F, Logan GD (2008): Response inhibition in the stop‐signal paradigm. Trends Cogn Sci 12:418–424. [DOI] [PMC free article] [PubMed] [Google Scholar]
- Verbruggen F, Logan GD (2009): Proactive adjustments of response strategies in the stop‐signal paradigm. J Exp Psychol Hum Percept Perform 35:835–854. [DOI] [PMC free article] [PubMed] [Google Scholar]
- Vink M, Kahn RS, Raemaekers M, van den Heuvel M, Boersma M, Ramsey NF (2005): Function of striatum beyond inhibition and execution of motor responses. Hum Brain Mapp 25:336–344. [DOI] [PMC free article] [PubMed] [Google Scholar]
- Vink M, Ramsey NF, Raemaekers M, Kahn RS (2006): Striatal dysfunction in schizophrenia and unaffected relatives. Biol Psychiatry 60:32–39. [DOI] [PubMed] [Google Scholar]
- Vossel S, Thiel CM, Fink GR (2006): Cue validity modulates the neural correlates of covert endogenous orienting of attention in parietal and frontal cortex. Neuroimage 32:1257–1264. [DOI] [PubMed] [Google Scholar]
- Watanabe M, Munoz DP (2010): Presetting basal ganglia for volitional actions. J Neurosci 30:10144–10157. [DOI] [PMC free article] [PubMed] [Google Scholar]
- Zandbelt BB, van Buuren M, Kahn RS, Vink M (2011): Reduced proactive inhibition in schizophrenia is related to corticostriatal dysfunction and poor working memory. Biol Psychiatry 70:1151–1158. [DOI] [PubMed] [Google Scholar]
- Zandbelt BB, Vink M (2010): On the role of the striatum in response inhibition. PLoS One 11:e13848. [DOI] [PMC free article] [PubMed] [Google Scholar]
Associated Data
This section collects any data citations, data availability statements, or supplementary materials included in this article.
Supplementary Materials
Supporting Information Figure 1
Supporting Information Table 1