

Abstract
Frontostriatal brain areas have been implicated in the neurobiology of attention deficit/hyperactivity disorder (ADHD), but little work has directly addressed the white matter connections between these regions. The present study investigates the microstructural organization and myelination of frontostriatal white matter in children with ADHD and controls. Diffusion tensor imaging and magnetization transfer imaging scans were acquired in 30 children with ADHD and 34 controls. A study specific volume of interest (VOI) of frontostriatal white matter was created using a tractography based statistical group map. Fractional anisotropy (FA, indexing microstructural organization) and magnetization transfer ratio (MTR, indexing macromolecular content, myelin in particular) were computed for the frontostriatal VOI and for total cerebral white matter. Exploratory analyses were conducted investigating the effect of stimulant use on these measures. Frontostriatal FA but not MTR was decreased in ADHD compared with controls. There were no differences in FA or MTR for total cerebral white matter. Frontostriatal FA correlated negatively with teacher‐rated attention problems in controls but not children with ADHD. The duration of stimulant use did not affect the main results. Changes in frontostriatal connectivity in ADHD appear to be related to changes in microstructural organization rather than myelination per se. A correlation with attention problems for controls suggests that frontostriatal organization is relevant to ADHD‐related behaviors. Hum Brain Mapp, 2012. © 2011 Wiley Periodicals, Inc
Keywords: diffusion tensor imaging, magnetization transfer imaging, structural connectivity, striatum, prefrontal cortex, cognitive control, developmental disorders
INTRODUCTION
Attention deficit/hyperactivity disorder (ADHD) is a common neurodevelopmental disorder characterized by age‐inappropriate levels of inattentive and/or hyperactive/impulsive behavior [American Psychiatric Association, 1994], estimated to affect 5% of children worldwide [Polanczyk et al., 2007]. Frontostriatal networks have frequently been implicated in ADHD and are thought to be central to symptoms of the disorder [Durston et al., in press; Makris et al., 2009; Nigg and Casey, 2005]. Indeed, reductions in volume and attenuated activity in (pre)frontal cortex and striatum are among the most frequently replicated neuroimaging findings in ADHD [Bush et al., 2005; Durston et al., 2009a; Valera et al., 2007]. The frontostriatal network is critical for the efficient recruitment of cognitive control: the ability to flexibly adapt behavior to changing circumstances [Durston et al., 2006; Liston et al., 2006]. Deficits in performance on cognitive control tasks, accompanied by changes in frontostriatal function, have repeatedly been demonstrated in ADHD [Bush et al., 2005; Casey et al., 2007; Dickstein et al., 2006; Durston et al., 2003, 2009a].
As investigators are now moving away from simply investigating changes in brain volume or activity toward considering networks of brain areas, it is of theoretical interest to investigate connectivity of the frontostriatal network in ADHD [Konrad and Eickhoff, 2010]. The present study investigates microstructural organization and myelination of frontostriatal white matter in children with ADHD, rather than regional changes in this network. By using two different magnetic resonance imaging modalities, we assess both the microstructural organization and the myelination of these tracts.
Diffusion tensor imaging (DTI) assesses both the microstructural organization and the myelination of white matter through measuring the diffusion of water molecules in the brain [Beaulieu, 2002; Le Bihan et al., 2001]. Diffusion is anisotropic along white matter fiber bundles, as water molecules more readily diffuse along them than at angles perpendicular to them. A quantitative measure of the directionality of diffusion is fractional anisotropy (FA) [Basser and Pierpaoli, 1996], a scalar measure varying from 0 (equal diffusion in all directions or isotropic diffusion) to 1 (fully unidirectional or anisotropic diffusion). Higher FA indexes a directionally more homogeneous microstructural organization of white matter.
Magnetization transfer imaging (MTI) gives a more direct estimate of myelination than DTI and relies on the transfer of magnetization from protons that are bound to macromolecular structures (e.g., myelin and cell membranes) to protons in free water [Wolff and Balaban, 1994]. The quantity of magnetic transfer differs between tissue types and is larger where more macromolecular structure is present. The magnetization transfer ratio (MTR) describes the proportion of MRI signal reduction because of the presence of macromolecules. Within white matter, myelin‐bound water disproportionally contributes to this measure, rendering MTR an index of myelination [Stanisz et al., 1999].
Our study aimed to investigate one specific white matter bundle in the brain, the frontostriatal tract. As these tracts are not part of current tractography based atlases, we used a study specific frontostriatal white matter volume of interest (VOI) approach based on a group map of individually reconstructed frontostriatal tracts, derived from the DTI scans using deterministic tractography. This method ensures anatomical robustness (e.g., generalizability to all scans in our sample) and sensitivity to changes in this specific white matter fiber tract.
Most earlier studies of structural connectivity in ADHD used only DTI‐derived measures and mainly used voxelwise analysis techniques [Ashtari et al., 2005; Davenport et al., 2010; Konrad et al., 2010; Silk et al., 2009]. Whereas this work has yielded some interesting starting points for generating hypotheses, these studies were designed to detect focal differences in FA and may therefore have lacked the sensitivity to detect changes in specific white matter bundles of interest. Results from these studies showed widespread changes in microstructural organization in ADHD, with some studies also suggesting specific changes in (pre)frontal white matter close to frontostriatal tracts [Ashtari et al., 2005; Davenport et al., 2010; Konrad et al., 2010; Silk et al., 2009]. However, there is substantial heterogeneity in results, with some studies reporting decreased frontal microstructural organization [Ashtari et al., 2005; Konrad et al., 2010] while others report increases [Davenport et al., 2010; Silk et al., 2009]. This may in part be due to differences in location of changes found in these studies, as these show little overlap although often located in the prefrontal white matter. However, small sample sizes may also play a role, as these studies have typically included no more than 10–15 subjects per group. One study used a specific manually defined region of interest (ROI) in the anterior corona radiata, close to the frontostriatal tracts, and reported reduced microstructural organization in this area [Pavuluri et al., 2009].
As stimulant medication is the mainstay treatment for ADHD, with many children with ADHD using stimulants for relatively long periods [Van den Ban et al., 2010; Winterstein et al., 2008], this is a factor that should be considered in studies of the brain in ADHD. Anatomical MRI studies have investigated the effect of prolonged methylphenidate use on the volume of striatum [Semrud‐Clikeman et al., 2006] and thickness of the cortex [Shaw et al., 2008] and have shown that stimulant medication affects gray matter in the frontostriatal network. Interestingly, a study comparing cerebral white matter volume in children with ADHD who were medication naive to children with ADHD who had used stimulants for prolonged periods showed that, compared to healthy controls, cerebral white matter volume was decreased in the medication naive children with ADHD, but that there were no differences between typically developing controls and children with ADHD who had used medication [Castellanos et al., 2002]. However, the impact of stimulant medication on white matter within the frontostriatal network per se remains unclear.
In sum, previous studies have hinted at changes in frontal white matter in ADHD but have methodologically lacked the anatomical specificity to isolate the frontostriatal white matter tracts. Furthermore, the impact of stimulant medication on this network is unclear. In this study, we set out to investigate frontostriatal structural connectivity in ADHD using DTI and MTR. Prior theoretical work has implicated frontostriatal connectivity in many ways, suggesting that both organization of the network and signal conduction within it may be disrupted [Durston et al., in press; Makris et al., 2009; Nigg and Casey, 2005]. Given the established relevance of the network and the absence of theoretical reasons to suspect that one aspect of structural connectivity might be more affected than another, our hypothesis was that frontostriatal microstructural organization (as indexed by FA) and myelination (as indexed by MTR) would be reduced in ADHD. We expected no global changes in FA or MTR in total cerebral white matter in ADHD. In addition, we performed exploratory analyses investigating the effect of stimulant use on frontostriatal FA and MTR.
METHOD
Participants
The institutional review board of the UMC Utrecht approved the study and its procedures. Thirty children with ADHD [three girls, age range 6–14, M (SD) = 9.6 (2.3)] were recruited from our outpatient clinic for disruptive disorders. Thirty‐four controls [four girls, age range 6–16, M (SD) = 10.2 (2.3)] were recruited through elementary schools in the wider Utrecht area. Table I lists the demographic characteristics of the sample.
Table I.
Demographic characteristics
| Control (n = 34) | ADHD(n = 30) | ||
|---|---|---|---|
| Gender | N boys/girls | 30/4 | 27/3 |
| Age | M (SD) | 10.2 (2.3) | 9.6 (2.3) |
| Range | 6.3–16.0 | 6.3–14.2 | |
| Total IQ | M (SD) | 111 (16) | 104 (17) |
| Range | 75–145 | 72–143 | |
| Handedness | N right−/lefthanded | 32/2 | 25/5 |
| DISC‐IV | ADHD inattentive | 0 | 6 |
| ADHD hyperactive/impulsive | 0 | 5 | |
| ADHD combined | 0 | 19 | |
| ODD | 0 | 11 | |
| CBCLa | Internalizing raw score M (SD) | 6.1 (5.8) | 8.3 (6.6) |
| Externalizing raw score M (SD) | 4.8 (4.9) | 12.8 (8.1)c | |
| Attention problems raw score M (SD) | 3.2 (2.1) | 8.7 (3.1)c | |
| TRFb | Internalizing raw score M (SD) | 2.3 (3.1) | 6.1 (4.8)d |
| Externalizing raw score M (SD) | 2.7 (5.0) | 11.0 (10.5)e | |
| Attention problems raw score M (SD) | 5.9 (6.3) | 18 (10.3)c | |
| SES | Education father (years) | 13.8 (2.5) | 12.5 (3.3) |
ADHD: attention deficit/hyperactivity disorder; ODD: oppositional defiant disorder; DISC‐IV: Diagnostic Interview Schedule for Children‐Fourth Edition; CBCL: child behavior checklist; TRF: teacher report form; SES: socioeconomic status.
Unavailable for 1 control and 3 ADHD subjects.
Unavailable for 1 control and 9 ADHD subjects.
P < 0.001.
P < 0.05.
P < 0.01.
Participants and their parents made two visits to the laboratory. During the first visit, written informed consent was obtained from parents after full disclosure of the study purpose and procedure. Children provided written and/or verbal assent. The DISC‐IV, parent version [Shaffer et al., 2000], was administered to parents to confirm the clinical diagnosis of ADHD from our department (ADHD group) or to exclude psychiatric morbidity (controls). Parents filled out the child behavior checklist (CBCL [Verhulst et al., 1996], unavailable for one control and three ADHD participants) and teachers the teacher report form (TRF [Verhulst et al., 1997], unavailable for one control and nine ADHD cases) to provide a dimensional measure of behavioral symptoms. Controls were excluded in the case of psychiatric morbidity or first degree relatives with a history of psychiatric problems. Children with ADHD were excluded if they met DISC‐IV criteria for a comorbid disorder other than oppositional defiant disorder (ODD) or conduct disorder (CD). In both groups, additional exclusion criteria were any major physical or neurological illnesses or the presence of metals in the body that precluded the MRI session. Eleven subjects with ADHD (37%) were comorbid for ODD, none for CD. IQ was assessed using a four subtest short form of the Dutch version of the WISC‐III [Wechsler, 2005]. Groups were matched at group level for age, gender, and IQ. Our sample is typical of clinical samples of children with ADHD in that it has some heterogeneity in ADHD subtypes. However, in our sample, only two of seven ADHD cases diagnosed with the inattentive subtype scored <50% of the required number of hyperactive symptoms to be classified as combined type. Similarly, only one of six children with the hyperactive/impulsive subtype scored <50% of the required number of inattentive symptoms to be classified combined type. Therefore, our sample consisted by and large of children with combined type ADHD or subthreshold combined type ADHD. Children with comorbid ODD were generally more severely affected with ADHD. Comorbidity between ADHD and ODD is slightly over 30% in epidemiological data [Nock et al., 2007], up to 50% or more in clinical samples [Jensen et al., 1997]. As this suggests that there may be etiological overlap between ADHD and ODD, we chose not to exclude patients with comorbid ODD.
Prior to the MRI session, children 12 years of age and under participated in a practice session using a mock scanner to get acquainted with the scanner and scanning procedures and to reduce any anxiety related to the MRI scan [Durston et al., 2009b]. Children over 12 years were also offered the opportunity to do a practice session.
At the time of scanning, 26 children in the ADHD group (87%) were using stimulant medication (all methylphenidate). Duration of methylphenidate use was ascertained by careful review of the medical files of the participants. For the remaining four children, medication status at scan was unknown or could not be established reliably. Mean age for starting stimulant medication was 8.2 years (range 5–11 years, SD = 1.7). Mean duration of medication use prior to scanning was 1.8 years (range 0–4.2 years, SD = 1.4).
Neuroimaging
Scans were acquired on a 1.5 Tesla Philips Achieva MRI scanner, using a 6‐element SENSE receiver head coil (Philips, Best, The Netherlands). The protocol included a high‐resolution coronal 3D T1‐FFE scan for anatomical reference [256 × 256 matrix; echo time (TE) = 4.6 ms; repetition time (TR) = 30 ms; flip angle = 30°; 160–180 contiguous slices; total scan duration = 405–456 s; 1 × 1 × 1.2 mm3 voxels; field of view (FOV) = 256 mm/70%; and parallel imaging applied in both phase‐encoding directions with SENSE factor = 1.5], two transverse single‐shot echo planar imaging DTI scans (32 diffusion‐weighted volumes with different noncollinear diffusion directions with b‐factor = 1,000 s/mm2 and 8 diffusion‐unweighted volumes with b‐factor = 0 s/mm2; parallel imaging SENSE factor = 2.5; flip angle = 90°; 60 slices of 2.5 mm; no slice gap; 96 × 96 acquisition matrix; reconstruction matrix 128 × 128; FOV = 240 mm; TE = 88 ms; TR = 9,822 ms; scan duration = 296 s), and a 3D MTI scan comprising two volumes (transverse; 60 slices of 2.5 mm; 128 × 128 acquisition matrix; FOV = 240 mm; flip angle = 8°; TE = 3.7 ms; TR = 37.5 ms; SENSE factor = 2.5). For the second MTI volume, an additional off‐resonance prepulse was applied (frequency offset = 1,100 Hz; 620°; three‐lobe sync‐shaped). Total MTI scan duration was 394 s. Of note is that the use of parallel imaging allows for shorter echo times (TE), reducing susceptibility artifacts [Jaermann et al., 2004]. For one control subject, no MTI scan was available.
Anatomical MRI, DTI, and MTI Processing
Processing of the T1 images has been described previously [Langen et al., 2009] and included the definition of a binary map of cerebral white matter, used here for calculation of mean FA and MTR in total cerebral white matter. Preprocessing of the MTI and DTI scans, tract reconstruction, and normalization of individual tracts to a model brain were based on earlier work by Mandl and colleagues [Mandl et al., 2010].
The T1‐weighted images were automatically placed in Talairach orientation [Talairach and Tournoux, 1988] without scaling, by registering them to a model brain in Talairach orientation. The translation and rotation parameters of this registration were then applied to the images [Maes et al., 1997]. The T1‐weighted images were corrected for field inhomogeneities using the N3 algorithm [Sled et al., 1998]. An automatic image processing pipeline was used to define binary segments of intracranium, total brain, and cerebral grey and cerebral white matter. This pipeline has been described previously and includes histogram analysis, mathematical morphology operations, and anatomical knowledge‐based rules to connect all voxels of interest [Brouwer et al., 2010; Schnack et al., 2001a, b]. The intracranial volume segment was checked and edited manually where necessary and served as a mask for all subsequent segmentations. The cerebral white matter segment was carried forward for the analyses of FA and MTR in total cerebral white matter.
The two DTI scans were simultaneously realigned and corrected for possible gradient‐induced distortions [Andersson and Skare, 2002]. A robust estimation of the diffusion tensors was obtained using M‐estimators to limit the influence of possible outliers [Chang et al., 2005]. FA was computed from the diffusion tensors [Basser and Pierpaoli, 1996].
To compute MTR from the MTI acquisition, the second volume of the MTI scan was rigidly aligned with the first using the ANIMAL package [Collins et al., 1995] with mutual information as the similarity metric. MTR was computed on the image with the magnetization prepulse (I m) and the image without the magnetization prepulse (I 0) using the equation MTR = (I 0−I m)/I 0. MTR is expressed as a fraction where 0 represents no signal reduction and 1 represents total signal reduction because of magnetization transfer.
For both the MTR (using the scan without the magnetization prepulse) and the T1‐weighted scan, rigid transformations were determined to spatially align them to the diffusion‐unweighted (b = 0 s/mm2) volume of the DTI scan using mutual information as the similarity metric. For each subject, a nonlinear transformation was computed using ANIMAL that spatially aligns the T1‐weighted scan with a T1‐weighted model brain [Collins et al., 1995; Hulshoff Pol et al., 2004]. The combination of these two transformations was used at a later stage to warp the reconstructed tracts to model space.
Frontostriatal Tract Selection and Definition of Study Specific Volume of Interest
We used a white matter VOI approach, similar to the approach used in DTI tractography based white matter atlases that are currently being developed [Oishi et al., 2009; Peng et al., 2009]. As frontostriatal connections are not yet included in these atlases, we constructed a study specific frontostriatal VOI, using a tractography based statistical map of frontostriatal fibers [Ciccarelli et al., 2003]. In short, the FACT tractography algorithm [Mori et al., 1999] was applied to FA maps to reconstruct all white matter fibers within the brain (eight different equidistant seed points per voxel, minimum FA = 0.2, maximum angle = 60°, and maximum average angle with neighboring voxels = 90°). The reconstructed tracts of each individual subject were then normalized to a model brain [Hulshoff Pol et al., 2004].
For each individual subject, white matter fibers connecting the striatum and prefrontal cortex were then selected in model space using a multiple ROI approach. The ROIs were defined in model space and applied to each individual scan after it had been transformed to model space [Ciccarelli et al., 2003]. First, a manual segmentation of the basal ganglia was performed on the model brain using segmentation criteria with high inter‐rater reliability, described elsewhere [Langen et al., 2007]. Since gray matter does not provide sufficient directional information for fiber tracking, the segment was dilated by two voxels in all directions in order for it to penetrate white matter. The ROI of the prefrontal cortex was based on a custom adaptation of the automatic anatomical labeling (AAL) template [Tzourio‐Mazoyer et al., 2002]. First, the AAL map was registered to the model brain. Then, the dorsolateral prefrontal, ventrolateral prefrontal, and ventromedial prefrontal cortices were selected from the AAL map, as these have been most frequently implicated in both cognitive control and ADHD [Durston et al., 2009b, in press]. Included were AAL template ROIs 5–10, 13–16, and 25–28. For each individual subject, only tracts connecting both the striatal and prefrontal ROIs were carried forward to the next stage of the analysis.
Next, additional exclusion ROIs were used to exclude tracts of the corpus callosum, uncinate fasciculus, or longitudinal fasciculi from the frontostriatal tract results of each individual subject. For the corpus callosum, the area of the rostrum and genu (extending into the body) of the corpus callosum were manually delineated on the midsagittal slice of the model brain. To exclude tracts of the longitudinal fasciculus, a large coronal plane was delineated spanning the entire brain, four slices posterior to the last slice that included parts of the striatum inclusion ROI. Uncinate tracts were excluded using a similar plain, drawn in axial orientation at Talairach coordinate −14 and spanning the entire temporal lobe at that level. Subsequently, all voxels with reconstructed frontostriatal fibers running through them were flagged, resulting in individual binary maps of frontostriatal tracts for all subjects in the sample.
Next, a statistical group map was created representing the proportion of the sample with a frontostriatal fiber reconstructed per voxel, by averaging all individual segments. The frontostriatal VOI was defined by including all voxels that had a reconstructed frontostriatal fiber running through them for at least 60% of the sample. This resulted in a group‐wise frontostriatal VOI in model space. This VOI was then warped back to native scan space for each individual subject. Mean FA and MTR were computed individually for this VOI and for total cerebral white matter (excluding the frontostriatal VOI). We assessed whether groups contributed equally to the VOI by computing the distribution of the contribution to voxels in the VOI for each group separately. As Figure 1 shows, this distribution was similar between controls and children with ADHD. Furthermore, the proportion of white matter included in the VOI did not differ between the groups (P = 0.479). Figure 2 illustrates the frontostriatal fiber selection procedure.
Figure 1.
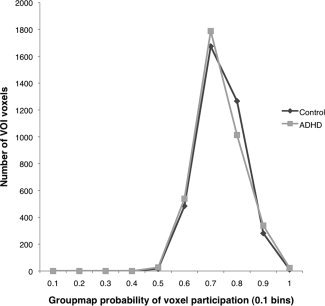
The contribution to VOI is similar between groups, independent of the probability per voxel. On the X‐axis, bins are presented of probability of contribution to a voxel, the Y‐axis shows the voxel count per bin.
Figure 2.
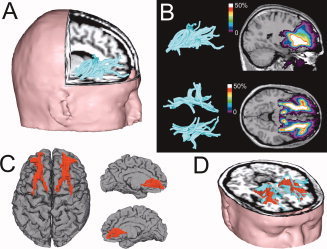
Frontostriatal tract selection and definition of the study specific volume of interest. (A) Individual frontostriatal tracts were defined in model space, using two regions of interest (striatum and prefrontal cortex); (B) A cumulative group map of individual binary frontostriatal maps was created; (C) The frontostriatal volume of interest in model space as defined by all voxels that include frontostriatal fibers in 60% or more of the individuals in the sample; (D) 3D rendering of the frontostriatal tracts (turquoise) and the frontostriatal VOI (red) for one subject in native space. [Color figure can be viewed in the online issue, which is available at wileyonlinelibrary.com.]
Statistical Analyses
The main hypothesis was tested using ANCOVA with age and gender as covariates, both with and without total cerebral white matter FA and MTR included as an additional covariate. Correlations were calculated with the attention problems subscales of the CBCL and TRF. Since the distributions of the CBCL and TRF data were skewed, square root transformations were first applied to normalize the data. After transformation, both skewness and kutosis of the transformed variables were within normal range (−1 to 1) except for the CBCL attention problems scale, which still had high kutosis in the ADHD group (K = −1.45), because of a ceiling effect for ADHD subjects on this scale.
For the exploratory analyses of stimulant treatment effects, we split the ADHD group into two groups of subjects who had received relatively long versus relatively short duration of treatment. Using the duration of medication as a continuous measure is problematic, as it is strongly determined by age. Only the 26 children whose medication histories could reliably be established were used for this analysis. We first standardized the treatment duration (measured in years) by calculating an age‐corrected measure of duration of medication use (DM) using the equation DMcorrected = DMuncorrected/(age−5). The age of 5 years was chosen as a minimum, as this was the youngest age at which medication was prescribed in our sample, and it thus serves as the lower boundary for the standardized measure DMcorrected. DMcorrected was not correlated to age at scan. We then performed a median split on this DMcorrected, yielding two groups: one that had received stimulant medication for a relatively short period, given their age (DMuncorrected M (SD) = 0.8 (0.7) years, n = 13) and one that had received stimulant medication for a relatively long period (DMuncorrected M (SD) = 2.9 (1.7) years, n = 13). These groups did not differ in mean age, gender distribution, IQ, number of DISC‐IV rated ADHD symptoms, or scores on any of the CBCL and TRF scales. The group‐wise analyses were repeated with three groups (controls, ADHD‐long, and ADHD‐short) with contrasts comparing both ADHD subgroups with the controls.
RESULTS
The main results are depicted in Figure 3 (large panels). The ADHD group showed reduced frontostriatal FA compared with controls (F(1,60) = 5.38, P < 0.05), falling just short of significance when FA in total white matter was added as a covariate (F(1,59) = 3.97, P = 0.051). There were no group differences for frontostriatal MTR (F(1,59) = 0.67, P = 0.42; F(1,58) = 0.63, P = 0.43 when overall white matter MTR was included as a covariate). There were no group differences in total cerebral white matter FA (F(1,60) = 1.29, P = 0.26) or MTR (F(1,59) = 0.17, P = 0.68).
Figure 3.
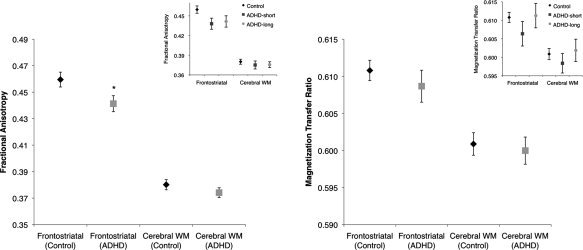
Frontostriatal microstructural organization is reduced in ADHD but myelination is not. The smaller insets show the results for the exploratory analyses on the short versus long medication treatment groups. ADHD: attention deficit/hyperactivity disorder (ADHD‐short: relatively short methylphenidate treatment; ADHD‐long: long duration of methylphenidate treatment); FA: fractional anisotropy; MTR: magnetization transfer ratio.
The exploratory analyses on the effect of stimulant medication did not change the pattern of results (Fig. 3, small panels), although for frontostriatal FA the main effect of group (control, ADHD‐short, and ADHD‐long) fell just short of significance (F(1,55) = 2.95, P = 0.061), likely because of diminished power with the smaller ADHD group sizes. However, a Helmert contrast showed that both ADHD subgroups together still showed lower FA than controls (P < 0.05), but that FA did not differ between the ADHD‐long and ADHD‐short groups (P = 0.80). For frontostriatal MTR, there was no main effect of group (F(1,54) = 1.12, P = 0.33), and Helmert contrasts showed no difference between the controls and the ADHD‐long and ADHD‐short group taken together (P = 0.50) or between the two ADHD subgroups (P = 0.19).
We found no significant correlations with age or age by group interactions for any of the measures studied, neither for the ADHD and control groups nor for the ADHD medication subgroups.
Finally, frontostriatal FA correlated negatively with teacher‐rated TRF attention problems for controls (r = −0.47, P < 0.01) but not ADHD children (r = −0.12, P = 0.62; Fig. 4). This correlation was not observed for parent ratings (CBCL). Frontostriatal MTR did not correlate with either parent or teacher ratings. Frontostriatal FA and MTR did not correlate with IQ in any group.
Figure 4.
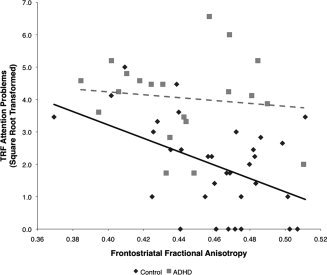
Frontostriatal microstructural organization is related to teacher‐rated attention problems for typically developing children but not for children with ADHD. Linear regression for typically developing children (solid black line) and for children with ADHD (dashed gray line). ADHD: attention deficit/hyperactivity disorder; FA: fractional anisotropy; TRF: teacher report form.
DISCUSSION
Our results show that frontostriatal connectivity is reduced in ADHD. Specifically, the microstructural organization of frontostriatal white matter is affected, but this does not appear to be due to a reduction in myelination, as we found no changes in MTR. These findings add to existing evidence of frontostriatal involvement in ADHD [Bush et al., 2005; Casey et al., 2007; Dickstein et al., 2006; Durston et al., 2003, 2009a; Seidman et al., 2005; Valera et al., 2007] to show that it is not merely regions within this network but also the white matter connections between them that are affected.
The result that myelination is less affected than microstructural organization was surprising to us. Myelin is an important constituent of white matter, and reductions in white matter volumes have been reported in ADHD, although not universally [Durston et al., 2009a; Valera et al., 2007]. In addition, medication use has been associated with normalization of white matter volume in ADHD [Castellanos et al., 2002]. Visual inspection of our data suggest that such a trend may exist for myelination (see Fig. 3), but this effect was not statistically significant. In all, these findings suggest that white matter changes in ADHD may be attributable to factors other than myelination.
We found a negative relationship between frontostriatal microstructural organization and teacher‐rated attention problems for controls but not subjects with ADHD, suggesting that frontostriatal microstructure is relevant to ADHD‐related behaviors, at least in typically developing individuals. Although it is surprising that this correlation was not found in children with ADHD, there are a number of factors that may have contributed to this. First, in our data, the TRF measure of attention problems had substantial variability in controls, but the ADHD group as a whole scored high on this measure and may therefore have been at ceiling, where no correlation could be detected. Second, other neurobiological systems or environmental factors (teaching style and applied classroom structuring) may contribute to symptoms in the higher range, in addition to the frontostriatal circuit changes. Furthermore, no correlations were found with parent‐rated attention problems for either group. This may be due to the substantially lower variability of this measure in both groups. However, low parent–teacher agreement on ADHD symptoms is among the most robust rater effects in the ADHD literature [Wolraich et al., 2004] and may also play a role.
Our sample was typical of clinical ADHD samples, with some heterogeneity in ADHD‐subtypes, comorbidity, and IQ. However, in our data, there was no evidence that these factors were affecting the results.
What This Study Adds to Existing Knowledge of Structural Connectivity in ADHD
Earlier DTI studies of ADHD found differences in areas close to our VOI using whole‐brain voxelwise or similar approaches but were not aimed specifically at detecting differences in frontostriatal white matter, such as our method. These results were diverse and sometimes inconsistent, and it seems likely that changes in proximal tracts that we have sought to exclude may have contributed to previous findings. One study reported decreased FA in anterior internal capsule, extending into frontostriatal white matter in children with ADHD [Ashtari et al., 2005]. However, two subsequent studies reported increased FA in the inferior frontal area [Silk et al., 2009] and anterior corona radiata [Davenport et al., 2010], which contrasts with the current findings. A recent study in adults with ADHD reported decreased FA and increased mean diffusivity in orbitofrontal white matter [Konrad et al., 2010]. The clusters in these four studies are likely to have included tracts or bundles that were excluded in our VOI, such as the internal capsule [Ashtari et al., 2005], uncinate fasciculus [Konrad et al., 2010; Silk et al., 2009], callosal and prefrontal‐cingulate white matter [Silk et al., 2009], the corona radiata [Davenport et al., 2010], and inferior fronto‐occipital fasciculus [Konrad et al., 2010], complicating a direct comparison with the current findings. Our method was aimed at isolating frontostriatal tracts based on a clear hypothesis that these should be involved in ADHD whereas that is not so clear for other tracts in the area. Using this method, our results clearly point to reduced structural connectivity in frontostriatal white matter tracts. We advocate further replication of such changes using hypothesis‐driven approaches. For example, a DTI study specifically targeting the cingulum bundle and superior longitudinal fasciculus in a sample of adults with ADHD showed reduced structural connectivity of these tracts, which was not evident from voxel‐based studies [Makris et al., 2007].
Our VOI approach shows that a similar type of analysis is possible for tracts of theoretical interest by employing a study specific mapping of the tract of interest. Of course, the group map thresholding in such an analysis is essentially arbitrary and involves balancing specificity of the VOI (low thresholds may lead to relatively uncommon areas being included) and sensitivity (the VOI should be large enough to allow generalizability across the sample). In our analyses, thresholds of 40%–70% yielded the same basic pattern of results.
Our results of reduced frontostriatal connectivity in ADHD converge with studies showing that structural connectivity in the frontostriatal network modulates performance on tasks tapping cognitive control [Casey et al., 2007; Liston et al., 2006], an ability often compromised in ADHD [Durston et al., 2009a]. A structural connectivity study by Casey and colleagues, which investigated the relationship between DTI measures and cognitive control using a tractography based approach, showed that frontostriatal FA was correlated with both performance on a cognitive control task and brain activity in the caudate nucleus during that task in both adolescents and adults with ADHD [Casey et al., 2007]. However, participants in that study were considerably older and no data on group differences in FA were reported.
DTI studies of typical development have reported age‐dependent increases in FA across the brain [Lebel et al., 2008; Tamnes et al., 2010]. Longitudinal structural MRI studies in ADHD have suggested a delay in the maturation of both prefrontal cortex and caudate nucleus [Castellanos et al., 2002; Shaw et al., 2007]. Tentatively, these results suggest the possibility of age effects on structural connectivity between these regions. However, we found no age correlations or age by group interactions for any of the measures studied, possibly because of limited power in this cross‐sectional study. Longitudinal approaches will be able to inform us more on developmental differences in frontostriatal connectivity between children with ADHD and typically developing controls.
Relationships With Brain Function and Stimulant Effects
Studies of functional connectivity (synchronized activity of brain areas during specific brain states) in ADHD have mainly targeted resting state networks and have generally shown reduced functional connectivity in networks of brain regions that show synchronized activity during rest (such as the default mode network, see Broyd and others [Broyd et al., 2009] for a review). Studies assessing functional connectivity during tasks are scarce, but the few studies that have been conducted show reduced synchronized activity between the striatum and the prefrontal cortex in ADHD [Cubillo et al., 2010; Konrad and Eickhoff, 2010; Wolf et al., 2009], which may be normalized by methylphenidate [Rubia et al., 2009]. Taken together with our findings and earlier volumetric work on frontostriatal neuroanatomy [Durston et al., 2009a; Valera et al., 2007], a picture is starting to emerge of a frontostriatal system that is affected at every level in ADHD, including in terms of structure, function, and connectivity.
Rubia and colleagues have reported that administration of methylphenidate normalizes frontostriatal functional connectivity in ADHD [Rubia et al., 2009]. This would seem to suggest that methylphenidate can overcome the restrictions placed on the network by decreased microstructural organization, such as reported in the current study. However, one issue that disallows such a causal interpretation is that it is unclear whether this normalization is driven by a stronger “signal” from the gray matter structures (prefrontal cortex and striatum) that form the nodes in this network or by stronger or more efficient signal conduction through white matter connections between these nodes. As for the latter, it seems unlikely that increases in synaptic dopamine, caused by an acute administration of methylphenidate, could overcome the functional consequences of reduced microstructural organization. Furthermore, our exploratory analyses do not support that prolonged methylphenidate use affects frontostriatal connectivity, at least in terms of structural connectivity. A possible confounding factor in the analyses of the duration of medication may be that the most severely affected children with ADHD are likely to have started medication earlier. If so, these children might be expected to show more pronounced brain changes compared with the group that was medicated for a shorter period. We did not find differences on any measure of ADHD symptoms between the high and low medication groups. However, in many cases, these measures were obtained a considerable time after medication was initiated. As such, this does not preclude the possibility that the children who were medicated for longer were more affected by ADHD at the initiation of treatment. Therefore, we emphasize that our analyses of the effects of the duration of medication are to be considered exploratory.
Our approach was specifically targeted at reconstructing anatomical connections between the striatum and the prefrontal cortex by defining ROIs in these regions to select the tracts of interest and excluding tracts from other fiber bundles. At present, DTI‐based tractography at regular MRI field strengths does not provide sufficient anatomical detail to distinguish between different frontostriatal networks, such as the orbitofrontostriatal pathway that is relevant to reward processing and the dorsolateral frontostriatal pathway, which is more related to cognitive control [Alexander et al., 1986; Durston et al., in press; Haber, 2003]. Studies combining functional MRI using tasks that tap these processes with DTI and MTI measures may be able to elucidate whether these pathways are differentially affected.
In sum, we show that ADHD is not merely associated with regional changes in frontostriatal volume and function, but that the white matter connections between these regions are also affected. In particular, microstructural organization seems to be involved, rather than myelination per se. Furthermore, in typically developing children, frontostriatal microstructural organization is related to behaviors associated with ADHD.
REFERENCES
- Alexander GE, DeLong MR, Strick PL ( 1986): Parallel organization of functionally segregated circuits linking basal ganglia and cortex. Ann Rev Neurosci 9: 357–381. [DOI] [PubMed] [Google Scholar]
- American Psychiatric Association ( 1994): Diagnostic and Statistical Manual of Mental Disorders. Washington, DC: American Psychiatric Association. [Google Scholar]
- Andersson JL, Skare S ( 2002): A model‐based method for retrospective correction of geometric distortions in diffusion‐weighted EPI. NeuroImage 16: 177–199. [DOI] [PubMed] [Google Scholar]
- Ashtari M, Kumra S, Bhaskar SL, Clarke T, Thaden E, Cervellione KL, Rhinewine J, Kane JM, Adesman A, Milanaik R, Maytal J, Diamond A, Szeszko P, Ardekani BA ( 2005): Attention‐deficit/hyperactivity disorder: A preliminary diffusion tensor imaging study. Biol Psychiatry 57: 448–455. [DOI] [PubMed] [Google Scholar]
- Basser PJ, Pierpaoli C ( 1996): Microstructural and physiological features of tissues elucidated by quantitative‐diffusion‐tensor MRI. J Magn Reson B 111: 209–219. [DOI] [PubMed] [Google Scholar]
- Beaulieu C ( 2002): The basis of anisotropic water diffusion in the nervous system—A technical review. NMR Biomed 15: 435–455. [DOI] [PubMed] [Google Scholar]
- Brouwer RM, Hulshoff Pol HE, Schnack HG ( 2010): Segmentation of MRI brain scans using non‐uniform partial volume densities. NeuroImage 49: 467–477. [DOI] [PubMed] [Google Scholar]
- Broyd SJ, Demanuele C, Debener S, Helps SK, James CJ, Sonuga‐Barke EJ ( 2009): Default‐mode brain dysfunction in mental disorders: A systematic review. Neurosci Biobehav Rev 33: 279–296. [DOI] [PubMed] [Google Scholar]
- Bush G, Valera EM, Seidman LJ ( 2005): Functional neuroimaging of attention‐deficit/hyperactivity disorder: A review and suggested future directions. Biol Psychiatry 57: 1273–1284. [DOI] [PubMed] [Google Scholar]
- Casey BJ, Epstein JN, Buhle J, Liston C, Davidson MC, Tonev ST, Spicer J, Niogi S, Millner AJ, Reiss A, Garrett A, Hinshaw SP, Greenhill LL, Shafritz KM, Vitolo A, Kotler LA, Jarrett MA, Glover G ( 2007): Frontostriatal connectivity and its role in cognitive control in parent‐child dyads with ADHD. Am J Psychiatry 164: 1729–1736. [DOI] [PubMed] [Google Scholar]
- Castellanos FX, Lee PP, Sharp W, Jeffries NO, Greenstein DK, Clasen LS, Blumenthal JD, James RS, Ebens CL, Walter JM, Zijdenbos A, Evans AC, Giedd JN, Rapoport JL ( 2002): Developmental trajectories of brain volume abnormalities in children and adolescents with attention‐deficit/hyperactivity disorder. JAMA 288: 1740. [DOI] [PubMed] [Google Scholar]
- Chang LC, Jones DK, Pierpaoli C ( 2005): RESTORE: Robust estimation of tensors by outlier rejection. Magn Reson Med 53: 1088–1095. [DOI] [PubMed] [Google Scholar]
- Ciccarelli O, Toosy AT, Parker GJ, Wheeler‐Kingshott CA, Barker GJ, Miller DH, Thompson AJ ( 2003): Diffusion tractography based group mapping of major white‐matter pathways in the human brain. NeuroImage 19: 1545–1555. [DOI] [PubMed] [Google Scholar]
- Collins D, Holmes C, Peters T, Evans A ( 1995): Automatic 3‐D model‐based neuroanatomical segmentation. Hum Brain Mapp 3: 190–208. [Google Scholar]
- Cubillo A, Halari R, Ecker C, Giampietro V, Taylor E, Rubia K ( 2010): Reduced activation and inter‐regional functional connectivity of fronto‐striatal networks in adults with childhood Attention‐Deficit Hyperactivity Disorder (ADHD) and persisting symptoms during tasks of motor inhibition and cognitive switching. J Psychiatr Res 44: 629–639. [DOI] [PubMed] [Google Scholar]
- Davenport ND, Karatekin C, White T, Lim KO ( 2010): Differential fractional anisotropy abnormalities in adolescents with ADHD or schizophrenia. Psychiatry Res 181: 193–198. [DOI] [PMC free article] [PubMed] [Google Scholar]
- Dickstein SG, Bannon K, Xavier Castellanos F, Milham MP ( 2006): The neural correlates of attention deficit hyperactivity disorder: An ALE meta‐analysis. J Child Psychol Psychiatry 47: 1051–1062. [DOI] [PubMed] [Google Scholar]
- Durston S, Tottenham NT, Thomas KM, Davidson MC, Eigsti IM, Yang Y, Ulug AM, Casey BJ ( 2003): Differential patterns of striatal activation in young children with and without ADHD. Biol Psychiatry 53: 871. [DOI] [PubMed] [Google Scholar]
- Durston S, Davidson MC, Tottenham N, Galvan A, Spicer J, Fossella JA, Casey BJ ( 2006): A shift from diffuse to focal cortical activity with development. Dev Sci 9: 1–8. [DOI] [PubMed] [Google Scholar]
- Durston S, de Zeeuw P, Staal WG ( 2009a): Imaging genetics in ADHD: A focus on cognitive control. Neurosci Biobehav Rev 33: 674–689. [DOI] [PubMed] [Google Scholar]
- Durston S, Nederveen H, van Dijk S, van Belle J, de Zeeuw P, Langen M, van Dijk A ( 2009b): Magnetic resonance simulation is effective in reducing anxiety related to magnetic resonance scanning in children. J Am Acad Child Adolesc Psychiatry 48: 206–207. [DOI] [PubMed] [Google Scholar]
- Durston S, Van Belle J, De Zeeuw P: Differentiating fronto‐striatal and fronto‐cerebellar circuits in ADHD. Biol Psychiatry (in press). [DOI] [PubMed] [Google Scholar]
- Haber SN ( 2003): The primate basal ganglia: parallel and integrative networks. J Chem Neuroanat 26: 317–330. [DOI] [PubMed] [Google Scholar]
- Hulshoff Pol HE, Schnack HG, Mandl RC, Cahn W, Collins DL, Evans AC, Kahn RS ( 2004): Focal white matter density changes in schizophrenia: Reduced inter‐hemispheric connectivity. NeuroImage 21: 27–35. [DOI] [PubMed] [Google Scholar]
- Jaermann T, Crelier G, Pruessmann KP, Golay X, Netsch T, van Muiswinkel AM, Mori S, van Zijl PC, Valavanis A, Kollias S, Boesiger P ( 2004): SENSE‐DTI at 3 T. Magn Reson Med 51: 230–236. [DOI] [PubMed] [Google Scholar]
- Jensen PS, Martin D, Cantwell DP ( 1997): Comorbidity in ADHD: Implications for research, practice, and DSM‐V. J Am Acad Child Adolesc Psychiatry 36: 1065–1079. [DOI] [PubMed] [Google Scholar]
- Konrad A, Dielentheis TF, El Masri D, Bayerl M, Fehr C, Gesierich T, Vucurevic G, Stoeter P, Winterer G ( 2010): Disturbed structural connectivity is related to inattention and impulsivity in adult attention deficit hyperactivity disorder. Eur J Neurosci 31: 912–919. [DOI] [PubMed] [Google Scholar]
- Konrad K, Eickhoff SB ( 2010): Is the ADHD brain wired differently? A review on structural and functional connectivity in attention deficit hyperactivity disorder. Hum Brain Mapp 31: 904–916. [DOI] [PMC free article] [PubMed] [Google Scholar]
- Langen M, Durston S, Staal WG, Palmen SJ, van Engeland H ( 2007): Caudate nucleus is enlarged in high‐functioning medication‐naive subjects with autism. Biol Psychiatry 62: 262–266. [DOI] [PubMed] [Google Scholar]
- Langen M, Schnack HG, Nederveen H, Bos D, Lahuis BE, de Jonge MV, van Engeland H, Durston S ( 2009): Changes in the developmental trajectories of striatum in autism. Biol Psychiatry 66: 327–333. [DOI] [PubMed] [Google Scholar]
- Le Bihan D, Magin JF, Poupon C, Clark CA, Pappata S, Molko N, Chabriat H ( 2001): Diffusion tensor imaging: Concepts and applications. J Magn Reson Imaging 13: 534–546. [DOI] [PubMed] [Google Scholar]
- Lebel C, Walker L, Leemans A, Phillips L, Beaulieu C ( 2008): Microstructural maturation of the human brain from childhood to adulthood. NeuroImage 40: 1044–1055. [DOI] [PubMed] [Google Scholar]
- Liston C, Watts R, Tottenham N, Davidson MC, Niogi S, Ulug AM, Casey BJ ( 2006): Frontostriatal microstructure modulates efficient recruitment of cognitive control. Cereb Cortex 16: 553–560. [DOI] [PubMed] [Google Scholar]
- Maes F, Collignon A, Vandermeulen D, Marchal G, Suetens P ( 1997): Multimodality image registration by maximization of mutual information. IEEE Trans Med Imaging 16: 187–198. [DOI] [PubMed] [Google Scholar]
- Makris N, Buka SL, Biederman J, Papadimitriou GM, Hodge SM, Valera EM, Brown AB, Bush G, Monuteaux MC, Caviness VS, Kennedy DN, Seidman LJ ( 2007): Attention and executive systems abnormalities in adults with childhood ADHD: A DT‐MRI study of connections. Cereb Cortex 18: 1210–1220. [DOI] [PubMed] [Google Scholar]
- Makris N, Biederman J, Monuteaux MC, Seidman LJ ( 2009): Towards conceptualizing a neural systems‐based anatomy of attention‐deficit/hyperactivity disorder. Dev Neurosci 31: 36–49. [DOI] [PMC free article] [PubMed] [Google Scholar]
- Mandl RC, Schnack HG, Luigjes J, van den Heuvel MP, Cahn W, Kahn RS, Hulshoff Pol HE ( 2010): Tract‐based analysis of magnetization transfer ratio and diffusion tensor imaging of the frontal and frontotemporal connections in schizophrenia. Schizophr Bull 36: 778–787. [DOI] [PMC free article] [PubMed] [Google Scholar]
- Mori S, Crain BJ, Chacko VP, van Zijl PC ( 1999): Three‐dimensional tracking of axonal projections in the brain by magnetic resonance imaging. Ann Neurol 45: 265–269. [DOI] [PubMed] [Google Scholar]
- Nigg JT, Casey BJ ( 2005): An integrative theory of attention‐deficit/hyperactivity disorder based on the cognitive and affective neurosciences. Dev Psychopathol 17: 785–806. [DOI] [PubMed] [Google Scholar]
- Nock MK, Kazdin AE, Hiripi E, Kessler RC ( 2007): Lifetime prevalence, correlates, and persistence of oppositional defiant disorder: Results from the National Comorbidity Survey Replication. J Child Psychol Psychiatry 48: 703–713. [DOI] [PubMed] [Google Scholar]
- Oishi K, Faria A, Jiang H, Li X, Akhter K, Zhang J, Hsu JT, Miller MI, van Zijl PC, Albert M, Lyketsos CG, Woods R, Toga AW, Pike GB, Rosa‐Neto P, Evans A, Mazziotta J, Mori S ( 2009): Atlas‐based whole brain white matter analysis using large deformation diffeomorphic metric mapping: Application to normal elderly and Alzheimer's disease participants. NeuroImage 46: 486–499. [DOI] [PMC free article] [PubMed] [Google Scholar]
- Pavuluri MN, Yang S, Kamineni K, Passarotti AM, Srinivasan G, Harral EM, Sweeney JA, Zhou XJ ( 2009): Diffusion tensor imaging study of white matter fiber tracts in pediatric bipolar disorder and attention‐deficit/hyperactivity disorder. Biol Psychiatry 65: 586–593. [DOI] [PMC free article] [PubMed] [Google Scholar]
- Peng H, Orlichenko A, Dawe RJ, Agam G, Zhang S, Arfanakis K ( 2009): Development of a human brain diffusion tensor template. NeuroImage 46: 967–980. [DOI] [PMC free article] [PubMed] [Google Scholar]
- Polanczyk G, de Lima MS, Horta BL, Biederman J, Rohde LA ( 2007): The worldwide prevalence of ADHD: A systematic review and metaregression analysis. Am J Psychiatry 164: 942–948. [DOI] [PubMed] [Google Scholar]
- Rubia K, Halari R, Cubillo A, Mohammad AM, Brammer M, Taylor E ( 2009): Methylphenidate normalises activation and functional connectivity deficits in attention and motivation networks in medication‐naive children with ADHD during a rewarded continuous performance task. Neuropharmacology 57: 640–652. [DOI] [PubMed] [Google Scholar]
- Schnack HG, Hulshoff HE, Baare WF, Viergever MA, Kahn RS ( 2001a): Automatic segmentation of the ventricular system from MR images of the human brain. NeuroImage 14: 95–104. [DOI] [PubMed] [Google Scholar]
- Schnack HG, Hulshoff Pol HE, Baare WF, Staal WG, Viergever MA, Kahn RS ( 2001b): Automated separation of gray and white matter from MR images of the human brain. NeuroImage 13: 230–237. [DOI] [PubMed] [Google Scholar]
- Seidman LJ, Valera EM, Makris N ( 2005): Structural brain imaging of attention‐deficit/hyperactivity disorder. Biol Psychiatry 57: 1263–1272. [DOI] [PubMed] [Google Scholar]
- Semrud‐Clikeman M, Pliszka SR, Lancaster J, Liotti M ( 2006): Volumetric MRI differences in treatment‐naive vs chronically treated children with ADHD. Neurology 67: 1023–1027. [DOI] [PubMed] [Google Scholar]
- Shaffer D, Fisher P, Lucas CP, Dulcan MK, Schwab‐Stone ME ( 2000): NIMH Diagnostic Interview Schedule for Children Version IV (NIMH DISC‐IV): Description, differences from previous versions, and reliability of some common diagnoses. J Am Acad Child Adolesc Psychiatry 39: 28–38. [DOI] [PubMed] [Google Scholar]
- Shaw P, Eckstrand K, Sharp W, Blumenthal J, Lerch JP, Greenstein D, Clasen L, Evans A, Giedd J, Rapoport JL ( 2007): Attention‐deficit/hyperactivity disorder is characterized by a delay in cortical maturation. Proc Natl Acad Sci U S A 104: 19649–19654. [DOI] [PMC free article] [PubMed] [Google Scholar]
- Shaw P, Sharp WS, Morrison M, Eckstrand K, Greenstein DK, Clasen LS, Evans AC, Rapoport JL ( 2008): Psychostimulant treatment and the developing cortex in attention deficit hyperactivity disorder. Am J Psychiatry 66: 888–896. [DOI] [PMC free article] [PubMed] [Google Scholar]
- Silk TJ, Vance A, Rinehart N, Bradshaw JL, Cunnington R ( 2009): White‐matter abnormalities in attention deficit hyperactivity disorder: A diffusion tensor imaging study. Hum Brain Mapp 30: 2757–2765. [DOI] [PMC free article] [PubMed] [Google Scholar]
- Sled JG, Zijdenbos AP, Evans AC ( 1998): A nonparametric method for automatic correction of intensity nonuniformity in MRI data. IEEE Trans Med Imaging 17: 87–97. [DOI] [PubMed] [Google Scholar]
- Stanisz GJ, Kecojevic A, Bronskill MJ, Henkelman RM ( 1999): Characterizing white matter with magnetization transfer and T(2). Magn Reson Med 42: 1128–1136. [DOI] [PubMed] [Google Scholar]
- Talairach J, Tournoux P ( 1988): Co‐planar Stereotaxic Atlas of the Human Brain: 3‐Dimensional Proportional System: An Approach to Cerebral Imaging. New York: Thieme. [Google Scholar]
- Tamnes CK, Ostby Y, Fjell AM, Westlye LT, Due‐Tonnessen P, Walhovd KB ( 2010): Brain maturation in adolescence and young adulthood: Regional age‐related changes in cortical thickness and white matter volume and microstructure. Cereb Cortex 20: 534–548. [DOI] [PubMed] [Google Scholar]
- Tzourio‐Mazoyer N, Landeau B, Papathanassiou D, Crivello F, Etard O, Delcroix N, Mazoyer B, Joliot M ( 2002): Automated anatomical labeling of activations in SPM using a macroscopic anatomical parcellation of the MNI MRI single‐subject brain. NeuroImage 15: 273–289. [DOI] [PubMed] [Google Scholar]
- Valera EM, Faraone SV, Murray KE, Seidman LJ ( 2007): Meta‐analysis of structural imaging findings in attention‐deficit/hyperactivity disorder. Biol Psychiatry 61: 1361–1369. [DOI] [PubMed] [Google Scholar]
- Van den Ban E, Souverein P, Swaab H, van Engeland H, Heerdink R, Egberts T ( 2010): Trends in incidence and characteristics of children, adolescents, and adults initiating immediate‐ or extended‐release methylphenidate or atomoxetine in the Netherlands during 2001–2006. J Child Adolesc Psychopharmacol 20: 55–61. [DOI] [PubMed] [Google Scholar]
- Verhulst F, Van Der Ende J, Koot H ( 1996): Handleiding voor de CBCL/4–18 (Manual for the CBCL/4–18). Rotterdam: Department of Child and Adolescent Psychiatry, Erasmus Academic Medical Centre. [Google Scholar]
- Verhulst F, Van Der Ende J, Koot H ( 1997): Handleiding voor de Teacher's Report Form (TRF) (Manual for the Teacher Report Form (TRF)). Rotterdam: Department of Child and Adolescent Psychiatry, Erasmus Academic Medical Centre. [Google Scholar]
- Wechsler D ( 2005): Wechsler Intelligence Scale for Children—Derde Editie NL. Handleiding en Verantwoording. (Wechsler Intelligence Scale for Children—Third Edition, Dutch Version, Manual). London: Harcourt Assessment. [Google Scholar]
- Winterstein AG, Gerhard T, Shuster J, Zito J, Johnson M, Liu H, Saidi A ( 2008): Utilization of pharmacologic treatment in youths with attention deficit/hyperactivity disorder in Medicaid database. Ann Pharmacother 42: 24–31. [DOI] [PubMed] [Google Scholar]
- Wolf RC, Plichta MM, Sambataro F, Fallgatter AJ, Jacob C, Lesch KP, Herrmann MJ, Schonfeldt‐Lecuona C, Connemann BJ, Gron G, Vasic N ( 2009): Regional brain activation changes and abnormal functional connectivity of the ventrolateral prefrontal cortex during working memory processing in adults with attention‐deficit/hyperactivity disorder. Hum Brain Mapp 30: 2252–2266. [DOI] [PMC free article] [PubMed] [Google Scholar]
- Wolff SD, Balaban RS ( 1994): Magnetization transfer imaging: Practical aspects and clinical applications. Radiology 192: 593–599. [DOI] [PubMed] [Google Scholar]
- Wolraich ML, Lambert EW, Bickman L, Simmons T, Doffing MA, Worley KA ( 2004): Assessing the impact of parent and teacher agreement on diagnosing attention‐deficit hyperactivity disorder. J Dev Behav Pediatr 25: 41–47. [DOI] [PubMed] [Google Scholar]