

Abstract
When manipulating objects with both hands, the corpus callosum (CC) is of paramount importance for interhemispheric information exchange. Hence, CC damage results in impaired bimanual performance. Here, healthy young adults performed a complex bimanual dial rotation task with or without augmented visual feedback and according to five interhand frequency ratios (1:1, 1:3, 2:3, 3:1, 3:2). The relation between bimanual task performance and microstructural properties of seven CC subregions (i.e., prefrontal, premotor/supplementary motor, primary motor, primary sensory, occipital, parietal, and temporal) was studied by means of diffusion tensor imaging (DTI). Findings revealed that bimanual coordination deteriorated in the absence as compared to the presence of augmented visual feedback. Simple frequency ratios (1:1) were performed better than the multifrequency ratios (non 1:1). Moreover, performance was more accurate when the preferred hand (1:3–2:3) as compared to the nonpreferred hand (3:1–3:2) moved faster and during noninteger (2:3–3:2) as compared to integer frequency ratios (1:3–3:1). DTI findings demonstrated that bimanual task performance in the absence of augmented visual feedback was significantly related to the microstructural properties of the primary motor and occipital region of the CC, suggesting that white matter microstructure is associated with the ability to perform bimanual coordination patterns in young adults. Hum Brain Mapp, 2013. © 2011 Wiley Periodicals, Inc.
Keywords: bimanual coordination, visual feedback, corpus callosum, DTI, fractional anisotropy
INTRODUCTION
In many day‐to‐day activities a high degree of collaboration between the hands is required, such as tying your shoelaces or opening a bottle. Such coordinated movements of the hands, especially their directional specifications and temporal coupling, rely on communication through the corpus callosum (CC) as demonstrated by studies on patients who underwent partial or complete callosotomy [Eliassen et al., 1999, 2000; Kennerley et al., 2002; Preilowski, 1972; Sternad et al., 2007]. The CC forms the primary communication link between both hemispheres, and is known as the largest white matter (WM) structure in the human brain.
Diffusion tensor imaging (DTI) is a noninvasive magnetic resonance technique that provides information about microstructural organization of white matter bundles by measuring the directionality of water diffusion, expressed by means of fractional anisotropy (FA) [Basser et al., 1994; Beaulieu, 2002; Tournier et al., 2011]. Recently, DTI has been introduced in the search for variations in brain structure underlying bimanual coordination with some promising findings. For example, Johansen‐Berg et al. [ 2007] reported that interindividual variations in asynchronous bimanual finger‐thumb opposition movements were predicted by variation in WM organization of the CC midbody. Sullivan et al. [ 2001] and Muetzel et al. [ 2008] reported relations between FA in the splenium of the CC and the speed of an alternating finger tapping task. Bonzano et al. [ 2008] reported that performance on a repetitive finger opposition task with both hands simultaneously was impaired in patients with multiple sclerosis, showing lower FA values in the CC. Especially damage to anterior parts of the CC, exchanging information between prefrontal and motor regions of the two hemispheres, correlated with bimanual performance. These findings help us understand the role of changes in callosal organization in bimanual coordination. However, no DTI studies have yet included a broader umbrella of complex bimanual task conditions, thereby varying the degree and nature of interhemispheric communication required. Accordingly, it remains unclear how specific this brain‐behavior association is as a function of the task conditions.
Most of the aforementioned DTI studies have used the Witelson classification [ 1989] of the CC or examined only three CC subregions, i.e., the genu, body, and splenium. These subdivisions were often suboptimal because they were predominantly based on nonhuman primates. In addition, the Witelson scheme may not necessarily reflect functionally distinct regions. In the present study, we introduced a more specific classification of the CC, based on tractography that allows for a distribution of FA values to functionally distinct CC regions [Hofer and Frahm, 2006; Huang et al., 2005]. We partitioned the CC into seven subregions based on its connections to the (1) prefrontal regions, (2) premotor and supplementary motor areas, (3) primary motor cortex, (4) primary sensory cortex, (5) occipital, (6) parietal, and (7) temporal cortex. We investigated the organization of the seven CC subregions in healthy young adults in relation to performance on a bimanual visuomotor task, which is a computerized version of the “Etch‐a‐sketch” device (for earlier versions, see Preilowski [ 1972] and Mueller et al. [ 2009]). This bimanual coordination task allowed us (a) to manipulate the key behavioral principles of bimanual motor coordination (see further) and (b) to further explore the importance of visual feedback for task performance.
Previous literature on bimanual coordination has revealed performance deterioration when trying to perform spatially different movements with both hands at the same time [Franz et al., 1991, 2001; Swinnen, 2002; Swinnen et al., 2002, 2003; Wenderoth et al., 2003] or when less preferred, antiphase relations are adopted [Carson et al., 1997; Kelso, 1984; Semjen et al., 1995; Summers et al., 1995; Swinnen, 2002; Swinnen et al., 1997b, 1998; Temprado et al., 1999]. Constraints also occur when trying to perform movements with a different temporal structure. A general finding from the finger tapping literature is that simple rhythms, in which one frequency is an integer multiple of the other (e.g., 1:1, 2:1, 3:1), are performed more accurately than polyrhythms (e.g., 2:3, 3:5) [Deutsch, 1983; Klapp et al., 1985; Peper et al., 1995b; Summers et al., 1993; Swinnen, 2002; Treffner and Turvey, 1993]. Moreover, the dominant hand is more accurate than the nondominant hand in both the spatial and temporal domain when performing bimanual movements [Carson et al., 1997; Semjen et al., 1995; Summers et al., 1995; Swinnen et al., 1996]. During multifrequency coordination tasks, performance is better when the preferred hand executes the faster of the two frequencies [Byblow and Goodman, 1994; Peters, 1985].
Even though constraints are apparent in bimanual movements, they can be overcome by means of practice and/or experimental manipulations that drive the performer towards the task goal, such as visual aids or task conceptualization [Debaere et al., 2003; Franz et al., 2001; Franz and McCormick, 2010; Kovacs et al., 2010; Lee et al., 1995; Ronsse et al., 2011; Swinnen et al., 1997a]. We aimed to test the previously mentioned bimanual constraints in our newly designed task and expected these to be more pronounced in the absence of augmented visual feedback.
Importantly, a major focus of this study was the examination of the relationship between the microstructural organization of the CC (as determined with DTI) and performance on the bimanual coordination tasks. We hypothesized that correlations between task performance and measures of structural organization in the described CC subregions would be dependent on the level of task complexity and the availability of augmented visual feedback. More specifically, we expected that the CC substructures connecting bilateral prefrontal and sensorimotor areas would become increasingly important for more complex, multifrequency movements than for simple, isofrequency movements, because prefrontal activity would gain prominence with supervising and supporting processing in the sensorimotor areas. Moreover, internally guided movements (in the absence of augmented visual feedback) were hypothesized to be more demanding for the bilateral prefrontal areas and the supporting anterior CC substructures than externally‐guided movements (with augmented visual feedback) [Goldberg, 1985].
MATERIALS AND METHODS
Subjects
Thirty undergraduate students of the University of Leuven (23 females, 7 males, mean age 20.5, SD = 1.4 years, range 19–25) participated in the experiment. Subjects were all right‐handed as determined by the Oldfield Handedness scale [Oldfield, 1971] [mean laterality 94.7 ± 8.4 (S.D.), range 70–100] and had no history of neurological or psychiatric disorders. They were naïve with respect to the task and had normal or corrected‐to‐normal vision. Informed written consent was obtained from each participant prior to testing according to the Declaration of Helsinki. The experimental protocol received approval from the local ethical committee of the University of Leuven.
Apparatus and Task Description
Two sessions were administered: a behavioral session followed by a DTI scanning session within a week. During the behavioral session, participants were seated comfortably at a table in front of a computer monitor with both lower arms resting on two custom‐made adjustable ramps. At the end of each ramp, 8 cm below the plane, a dial was mounted on a horizontal support consisting of a flat disc (diameter 5 cm) and a vertical peg. The dials were rotated by holding each peg between the thumb and index finger (see Fig. 1). High precision shaft encoders were aligned with the axis of rotation of the dials to record angular displacement (Avago Technologies, sampling frequency = 100 Hz, accuracy = 0.089°). Forearms rested on the ramps covered with foam to maximize comfort and minimize fatigue. Direct vision of both hands and forearms was occluded by a horizontal table‐top bench that was placed over the forearms of the subject (see Fig. 1). The left and right dial controlled the movement of a red cursor along the vertical and horizontal axis, respectively. When the left dial was rotated to the right (clockwise), the cursor moved up; when turned to the left (counterclockwise), the cursor moved down. When the right dial was rotated to the left (counterclockwise), the cursor moved to the left, when rotated to the right (clockwise), the cursor moved to the right. The gain was set to 10 U rotation−1, indicating that drawing a horizontal/vertical line on the screen of 150 U required 15 complete rotations of the right/left dial, respectively.
Figure 1.
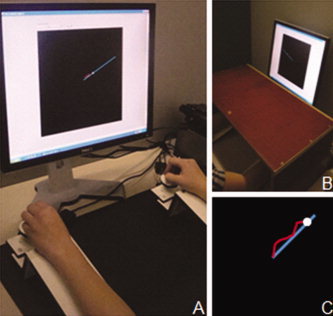
Experimental setup. (A) Subject seated in front of a computer screen displaying the task. The response apparatus consisted of two dials fixated on a ramp. (B) The hands were covered with a horizontal table‐top bench during the experiment. (C) Display on the screen during a single trial. [Color figure can be viewed in the online issue, which is available at wileyonlinelibrary.com.]
Visual feedback of actual performance consisted of a moving red dot with a 1‐cm long tail displayed on the screen. The target was a white cursor which remained motionless in the center of the screen for 1 s, after which it began to move from the center of the display (a black 15 × 15 cm2), along a blue target line, to the periphery (see Fig. 1), indicative of the bimanual coordination pattern to be produced (see further). The target moved at a constant rate for a total duration of 7 s. After 7 s the screen turned black, regardless of the subject's location on the screen, and the next target line would appear after a random interval of 4–6 s. The goal of each trial was to generate the correct direction and speed by turning the dials, to produce a line with the equivalent angle. In other words, subjects had to match the red cursor with the white cursor in space and time as accurately as possible.
Four coordination patterns were introduced: two in which the left and right dial moved in the same direction, either clockwise (CW) or counterclockwise (CCW), and two in which the left and right dial moved toward (IN) or away from each other (OUT) (see Fig. 2). The coordination patterns were performed according to one of the following frequency ratios between the left and right hand, determining the precise slope (angle) of the target line on the screen, using the convention of referring to the left hand first, and the right hand second (L:R): 1:1, 1:3, 2:3, 3:1, and 3:2. For example, a 1:3 frequency ratio indicated that the left hand moved three times slower than the right hand. The combination of coordination patterns (4) and frequency ratios (5) resulted in 20 experimental target pathways (see Fig. 2). In addition, two tracking conditions were administered: with augmented visual feedback of actual performance on the screen (FB) and without (NoFB). In the FB condition, the blue target line, the white target and the red cursor (online visual feedback) were presented on the screen. In the NoFB condition, a static visual display of a blue target line was presented, but the target and subject‐controlled cursor remained invisible. An auditory stimulus was provided to indicate the start and end of the trial. Participants were then required to track the target pathway based on their mapping of the coordination pattern onto the target line representation and by using proprioceptive cues.
Figure 2.
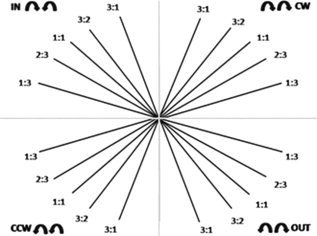
Schematic representation of the bimanual coordination task. The 20 target pathways are represented: five frequency ratios (1:1, 1:3, 2:3, 3:1, 3:2) between the left and right hand and four different coordination patterns (CW, CCW, IN, OUT).
Subjects performed 12 trial blocks, 6 with feedback (FB) and 6 without feedback (NoFB), with 2–3 min of rest between blocks. Each trial block consisted of 20 distinctive target lines presented in a pseudorandom order. Trial blocks of FB and NoFB were alternated, with the starting condition being randomized across subjects. Prior to data recording participants were allowed to practice each of the 20 lines in both FB conditions, for a duration of 10 min, to become familiar with the task variants. At completion of the behavioral experiment, participants were asked to rate the difficulty of the task (in general, per movement direction and per frequency ratio) on a scale from 1 to 10 (1 is very easy, 10 is very difficult). The behavioral part of the experiment typically lasted 90 min. Computer programming for this task was done using LabView, version 8.5.
Data Analysis
The data of the bimanual coordination task were analyzed using both Labview (8.5) software (National Instruments, Austin, TX) and MATLAB R 2008a. On each trial, the x‐ and y‐ positions of the target and the cursor were sampled in real time at 100 Hz. Per target line the slope error was calculated as a measure of accuracy. Slope error compared the slope produced by the participant relative to the target slope, which was calculated using the following multistep procedure: (1) the slope angle of each target line was determined by calculating the arctangent of the target frequency ratio:
where ωleft is defined as the frequency of the left dial and ωright the frequency of the right dial. (2) A linear least square was then fitted to the line drawn by the participant at the end of each trial. (3) The participant's slope angle was determined similarly to the slope angle of the target line, using the arctangent of the slope of the subject. (4) The absolute difference between the slope angle of the subject and the slope angle of the target was defined as the slope error expressed in degrees (°).
To determine whether subjects generally met the task requirements, all data were transformed into z‐scores [(X ‐ MEAN)/SD)]. A trial was classified as an outlier and discarded from the analysis when z values were greater than |3|. On average 3% of the data points were removed from the dataset [range 0–11.3%; SD 2.40].
Image Acquisition
A Siemens 3 T Magnetom Trio MRI scanner (Siemens, Erlangen, Germany) with standard head coil was used for image acquisition. For all subjects, a high resolution T1‐weighted structural image was acquired using magnetization prepared rapid gradient echo (MPRAGE; TR = 2300 ms, echo time (TE) = 2.98 ms, 1 × 1 × 1.1 mm3 voxels, field of view (FOV): 240 × 256 mm2, 160 sagittal slices) for anatomical detail. Diffusion tensor images were acquired using the following parameters: single‐shot spin‐echo; slice thickness = 2.5 mm, TR = 8700 ms, TE = 116 ms, number of diffusion directions = 150, b values were 700, 1000, and 2800 s mm−2, number of sagittal slices = 58, voxel size = 2.5 × 2.5 × 2.5 mm3. Total scan time was 30 min.
DTI Processing
Data analysis was performed on 24 of 30 participants due to (motion) artefacts and drop‐out. The DTI data were analyzed and processed using the following multistep procedure:
-
a
The raw diffusion weighted data and the nondiffusion weighted images were loaded into ExploreDTI [Leemans et al., 2009] and we “looped” through the separate diffusion weighted imaging volumes at a high frame rate to check for any obvious artifacts in the data, such as large signal dropouts and geometric distortions. Moreover, we inspected the images in different “orthogonal” views (i.e., not only in the image plane that the data were acquired in) to detect any interslice and intravolume instabilities (e.g., the “zebra pattern”). We also quickly toggled between the views of the first and last acquired diffusion weighted image to observe subtle system drifts. Finally, we checked the residual map, reflecting the difference between the modeled and the measured signal [Tournier et al., 2011]. With such a residual map one can detect artifacts that are not always visible on the FA map or on the individual diffusion weighted images.
-
b
The DTI data sets were corrected for subject motion and eddy current induced geometric distortions [Leemans and Jones, 2009]. In summary, the diffusion weighted images were realigned to the nondiffusion weighted image using an affine coregistration method based on mutual information with cubic interpolation to resample the images [Klein et al., 2010]. During this correction procedure, the b‐matrix was adjusted for the rotational component of subject motion to ensure correct diffusion tensor estimates.
-
c
The diffusion tensor model was fitted to the data using the Levenberg–Marquardt nonlinear regression method [Marquardt, 1963]. The diffusion measure FA was subsequently calculated as described previously by Basser and Pierpaoli [ 1996]. FA values range from 0 to 1, where 0 represents maximal isotropic diffusion (i.e., equal amount of diffusion in all directions), or lack of directional organization, and 1 represents maximal anisotropic diffusion (i.e., only movement parallel to the major axis of a WM tract), and higher values reflecting “more” organized tissues such as in WM tracts.
-
d
We reinspected the data in three orthogonal planes in a “loop” format to ensure that the motion/distortion correction was performed correctly and that no additional artifacts were introduced into the data.
-
e
DTI data were transformed to MNI space to maximize uniformity in terms of intersubject brain angulation. In doing so, the subregions of the CC in the subsequent fiber tractography analysis can be defined in a standardized way. The first step in the DTI coregistration process to MNI space consisted of the construction of a population‐based MNI template [Mori et al., 2008; Van Hecke et al., 2008]. With this template, an affine, and, subsequently, a high‐dimensional nonaffine DTI‐based coregistration technique could be applied to obtain the final DTI data sets in MNI space [Leemans et al., 2005; Van Hecke et al., 2007]. In the nonaffine coregistration approach, the images are modeled as a viscous fluid, imposing a constraint on the local deformation field. During normalization, the Jacobian is constrained to reduce the chance of forcing the underlying brain structures in an anatomically nonplausible way. This viscous fluid model was optimized for aligning multiple diffusion tensor components and has been applied successfully in a wide range of applications, where adjusting for morphological intersubject (and intergroup) differences, such as, for instance, ventricle size, is considered to be of paramount importance [Hecke et al., 2010; Hsu et al., 2010; Sage et al., 2009; Verhoeven et al., 2010]. Based on a recently developed simulation framework, the nonaffine DTI‐based coregistration method, in particular, has been shown to provide highly accurate registration results [Van Hecke et al., 2009].
-
f
Deterministic streamline tractography of the CC was performed for each subject by manually drawing regions of interest in ExploreDTI [Leemans et al., 2009] by the same operator (J.G.). FA thresholds to initiate and continue tracking were set to 0.15; the maximum angle was thresholded at 40°; and step size 1 mm. Tractography was performed using two‐dimensional regions of interest at the midline of the brain. All regions of interest were drawn according to specific anatomical landmarks and a priori determined rules that were followed carefully and consistently for each subject [Catani and de Schotten, 2008]. Intra‐ and interrater reliability of this approach has been shown in a previous study in patients with progressive supranuclear palsy [Ito et al., 2008].
ROIs Definition
According to the recently described paradigm by Hofer and Frahm [ 2006], the CC can be geometrically partitioned into five vertical regions using the following strategy. The most anterior sixth of the entire CC makes up the first ROI (CC1/Prefrontal), containing fibers projecting into the prefrontal region. The second ROI (CC2/Premotor), consisting of the remaining part of the anterior half of the CC, contains fibers projecting to premotor and supplementary motor areas. A third ROI (CC3/Primary motor) is the posterior half minus the posterior third and refers to fibers projecting into the primary motor cortex. Next, the fourth ROI (CC4/Primary sensory) is defined as the posterior one‐third minus posterior one‐fourth and contains fibers interconnecting both primary sensory cortices. The remaining part of the posterior half of the CC was further divided according to Huang's scheme [ 2005]. The splenium was divided into an occipital (CC5), a parietal (CC6), and a temporal (CC7) region in which occipital fibers are found in the posterior inferior region of the splenium, parietal fibers are spread across a wide area in the posterior–superior region of the splenium and temporal fibers are found in the anterior‐inferior region of the splenium of the CC. Mean FA values were then calculated in the seven ROIs for all participants. Regions of interest (ROIs) were drawn within the CC of each participant on the midsagittal plane of FA maps (see Fig. 3).
Figure 3.
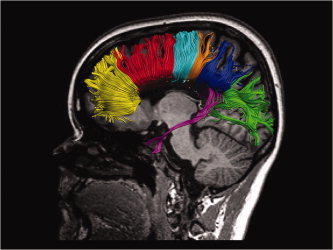
Seven regions of interest. Prefrontal (yellow), premotor/SMA (red), primary motor (cyan), primary sensory (orange), parietal (purple), temporal (magenta), occipital (green). [Color figure can be viewed in the online issue, which is available at wileyonlinelibrary.com.]
Statistical Analysis
For slope error, a 2 × 4 × 5 (feedback × coordination pattern × frequency ratio) repeated measures ANOVA was performed. Feedback consisted of two levels, i.e., FB and NoFB. Coordination pattern contained four levels, i.e., inwards (IN), outwards (OUT), clockwise (CW), and counterclockwise (CCW). Frequency ratio comprised five levels, i.e., 1:1, 1:3, 2:3, 3:1, 3:2. In addition, to explore the effect of hand allocation, we collapsed the frequency ratios in which the right hand was leading (1:3 and 2:3) and the frequency ratios in which the left hand was leading (3:1 and 3:2) and performed a 2 × 2 (feedback × hand) repeated measures ANOVA. A similar 2 × 2 (feedback × movement pattern) repeated measures ANOVA was performed to explore the effects of movement patterns during 1:1 frequency ratios. Inwards and outwards coordination patterns were grouped as “inphase” movements and clockwise and counterclockwise coordination patterns were grouped as “antiphase” movements. Significant main and interaction effects were further explored by post hoc tests using Tukey correction. In addition to the significant main effects, only the interaction effects concerning the feedback factor are of direct interest and will be described.
To examine the microstructural differences among the seven CC subregions a one‐way repeated measures ANOVA was conducted. Forward stepwise regression models were employed to test whether FA in specific CC subregions is predictive of performance on this bimanual coordination task. The F‐to‐enter was set to 1.0 and the F‐to‐remove was set to 0.5. All statistical analyses were performed with Statistica 8 (StatSoft, Tulsa) using an α‐level of 0.05.
RESULTS
Behavioral Data
Using a 2 × 4 × 5 repeated measures ANOVA, analysis of slope error revealed a main effect of feedback, indicating that the error of the slope angle was generally lower (indicative of better performance) when online visual feedback information was available (see Table I). A significant main effect was also observed with respect to frequency ratio. The main effect of coordination pattern was not significant. No significant interaction effect was found between feedback and coordination pattern. However, the feedback × frequency ratio interaction was significant (see Table I). Post‐hoc Tukey revealed that the slope error was higher in the no visual feedback condition as compared to the visual feedback condition across all frequencies (P < 0.01), except for the 1:1 ratio (P > 0.05). For the NoFB condition slope error was smallest for the 1:1 frequency ratio and gradually increased with increasing frequency difference (P < 0.001). Figure 4 represents this finding, referred to as the “seagull” effect by virtue of its resemblance to the bird's wings. Tukey post‐hoc tests also revealed the asymmetry of the seagull in the NoFB condition, i.e., slope error for the 3:1 frequency ratio was higher than for the 1:3 (P < 0.05) and 2:3 ratios (P < 0.001) and the 3:2 frequency ratio revealed a higher slope error than the 2:3 ratio (P < 0.05). For the FB condition, the 3:1 frequency ratio revealed a higher error score than both the 1:1 (P < 0.001) and 2:3 frequency ratio (P < 0.01). The three‐way interaction between feedback, coordination pattern, and frequency ratio was not significant.
Table I.
Slope error
| Effect | df | F | P |
|---|---|---|---|
| Three‐way repeated measures ANOVA | |||
| Feedback | 1 | 153.66 | <0.001 |
| Frequency ratio | 4 | 24.01 | <0.001 |
| Coordination pattern | 3 | 1.85 | >0.050 |
| Feedback × frequency ratio | 4 | 18.56 | <0.001 |
| Feedback × coordination pattern | 3 | 1.43 | >0.050 |
| Feedback × frequency ratio × coordination pattern | 12 | 0.754 | >0.050 |
| Two‐way repeated measures ANOVA—Effect of hand dominance | |||
| Feedback | 1 | 148.15 | <0.001 |
| Hand | 1 | 7.35 | <0.050 |
| Feedback × hand | 1 | 1.37 | >0.050 |
| Two‐way repeated measures ANOVA—Effect of coordination mode | |||
| Feedback | 1 | 2.61 | >0.050 |
| Movement pattern | 1 | 12.10 | <0.010 |
| Feedback × movement pattern | 1 | 1.14 | >0.050 |
Figure 4.
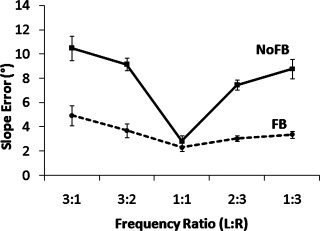
Slope error for each frequency ratio. Full line and dashed line represent nonaugmented (NoFB) and augmented (FB) trials. We refer to the left hand first and the right hand second (L:R).
In addition, the left hand leading conditions and the right hand leading conditions were grouped. A 2 × 2 (feedback [FB ‐ NoFB] × hand [left ‐ right]) repeated measures ANOVA was conducted and revealed a main effect of FB and a main effect of Hand (see Table I). No significant interaction effect was found. Further exploration revealed that slope error was smaller when visual feedback was present and when the right instead of the left hand adopted the higher frequency.
Finally, we collapsed the in‐ and outward coordination patterns (inphase movements) and the CW and CCW patterns (antiphase movements) for the 1:1 frequency ratio. A 2 × 2 (feedback [FB ‐ NoFB] × movement pattern [inphase ‐ antiphase]) repeated measures ANOVA revealed a main effect of movement pattern, indicating that mean slope error was smaller when moving the hands inphase. No significant main effect of FB or interaction effects were found (see Table I).
DTI Results
Regional effects of fractional anisotropy
A repeated measures ANOVA on the seven CC subregions revealed a significant main effect of region [F(6,138) = 48.41, P < 0.001)] (see Fig. 5). Post‐hoc Tukey demonstrated that FA values were higher in the parietal (CC6) and occipital region of the CC (CC5) as compared to the other regions (P < 0.001).
Figure 5.
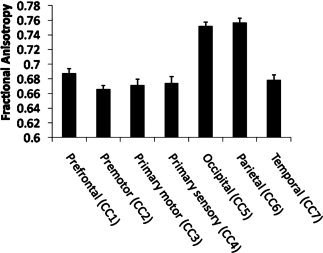
FA values for the seven subregions of the CC.
Relation between white matter organization and bimanual coordination
Because of the minor impact of the four different coordination patterns they were combined in the subsequent analysis. Moreover, we decided to only use the data of the 1:1 and 3:1 frequency ratios without consideration of the others, because (1) post‐hoc data of the main effect of frequency ratio and (2) data of experienced difficulty (63% of the subjects rated the 3:1 ratio as most difficult and 81.5% of the subjects rated the 1:1 ratio as the most unproblematic) revealed that 1:1 resulted in the best performance and 3:1 in the worst performance. Accordingly, this parsimonious strategy preserved the broad spectrum of performance differences among the frequency ratios while reducing the likelihood of Type I errors.
To evaluate the amount of variance that was explained by the FA values of the seven CC subregions, we performed a forward stepwise regression analysis on the slope error of 1:1 NoFB/FB and 3:1 NoFB/FB conditions. Predictors for each model were FA values of the selected CC regions. The dependent measure obtained during the visual FB conditions was not significantly predicted by the FA values of the CC regions. However, significant models were found for the NoFB conditions. FA of the occipital region (β = −0.61, P < 0.01) contributed significantly to the prediction of slope error during 1:1 frequency ratio coordination. Furthermore, slope error during performance of the 3:1 ratio showed a significant association with FA of the primary motor region (β = ‐0.66, P < 0.01). Corresponding correlation plots are depicted in Figures 6 and 7, respectively. A summary of the regression analyses is shown in Table II.
Figure 6.
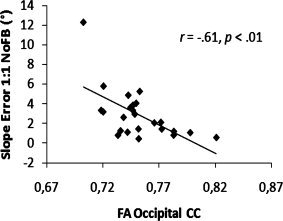
Scatterplot indicating the relationship between FA of the occipital CC and slope error for the 1:1 frequency ratio task without augmented feedback (NoFB). Without outlier: r = ‐0.52, P < 0.01.
Figure 7.
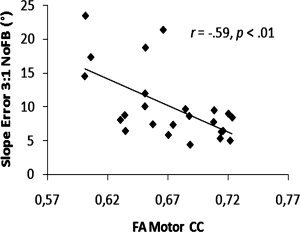
Scatterplot indicating the relationship between FA of the Motor CC and Slope error for the 3:1 frequency ratio task without augmented feedback (NoFB).
Table II.
Linear regression models predicting accuracy scores from FA
| Prefrontal (CC1) | Premotor (CC2) | Primary motor (CC3) | Primary sensory (CC4) | Occipital (CC5) | Parietal (CC6) | Temporal (CC7) | ||||||||||
|---|---|---|---|---|---|---|---|---|---|---|---|---|---|---|---|---|
| Model | Adj R 2 | P | β | P | β | P | β | P | β | P | β | P | β | P | β | P |
| 1 | 0.337 | 0.002 | −0.605 | 0.002 | ||||||||||||
| 2 | 0.396 | 0.005 | 0.305 | 0.111 | −0.661 | 0.002 | −0.235 | 0.183 | ||||||||
| 3 | 0.217 | 0.049 | 0.368 | 0.063 | −0.379 | 0.057 | −0.264 | 0.173 | ||||||||
| 4 | 0.065 | 0.237 | 0.241 | 0.251 | −0.248 | 0.241 | −0.277 | 0.189 | ||||||||
Each model is referred to with a number in the leftmost column representing the models: (1) 1:1 Slope error NoFB; (2) 3:1 slope error NoFB; (3) 1:1 slope error FB; (4) 3:1 slope error FB.
DISCUSSION
This study shows that quantitative DTI information enables associating the microstructural organization of specific CC substructures with behavioral functions in healthy young adults. Bimanual coordination was assessed with a unique bimanual visuomotor task and revealed all but one of the previously described behavioral constraints. White matter integrity of some of the CC substructures was predictive of bimanual performance during the more demanding internally‐guided movement condition without augmented visual FB, but this prediction was not modulated by task complexity features.
Bimanual Constraints and Overcoming Constraints
Consistent with previous research, the isofrequency ratios (1:1) resulted in better performance than the multifrequency ratios (i.e., 1:3, 3:1, 2:3, and 3:2). Comparison among the multifrequency ratios demonstrated that the 1:3 and 3:1 frequency ratios resulted in higher error scores than the 2:3 and 3:2 frequency ratios, respectively. Previous research on multifrequency coordination revealed a distinction between rhythms with harmonic (e.g., 2:1, 3:1, etc) and nonharmonic (e.g., 3:2, 5:4, etc.) frequency ratios. Specifically, literature on finger tapping tasks demonstrated that tapping simple rhythms was more accurate than tapping polyrhythms [Deutsch, 1983; Klapp et al., 1985; Peper et al., 1995a; Summers et al., 1993; Treffner and Turvey, 1993]. Our findings are not consistent with these results, possibly due to the dissimilarities between finger tapping and the present more complex coordination task. This effect can possibly be accounted for by the relative velocity difference between the two hands. When performing the 3:2 or 2:3 ratios, the relative speed difference between the two hands is 1.5, whereas it is 3 for the 3:1 and 1:3 frequency ratios. A higher speed difference between both hands is apparently associated with less accurate performance, irrespective of whether the frequency ratio is integer or non‐integer. Moreover, the type of movement may also affect bimanual constraints. Ivry et al. [ 2002] referred to two types of timing, i.e., event timing (discrete events like finger tapping) and emergent timing (continuous trajectories like drawing circles), having no relation with each other concerning temporal precision [Robertson et al., 1999]. Although periodicity was not directly tested here, the hand movements can be regarded as much more continuous and smooth than typical finger tapping movements that require distinct reversals in direction. Correspondingly, the disagreement with the previous literature on integer and noninteger ratios can possibly be accounted for by these different movement types and their associated timing, i.e., discrete events such as finger tapping (typically used in past polyrhythm research) versus emergent timing (as used in the present bimanual circling task).
We also observed a greater accuracy when participants were required to move faster with the preferred hand (i.e., 1:3 and 2:3) than with the non‐preferred hand (i.e., 3:1 and 3:2), supporting previous work on manual asymmetry in bimanual forearm movements [Byblow and Goodman, 1994; Summers et al., 2002], bimanual finger tapping [Peters, 1985] and bimanual circular movements [Carson et al., 1997; Semjen et al., 1995; Stucchi and Viviani, 1993; Swinnen et al., 1996]. Finally, consistent with previous literature, we found that antiphase movements resulted in less successful performance than inphase movements when performing the 1:1 frequency ratio [Carson et al., 1997; Kelso, 1984; Semjen et al., 1995; Summers et al., 1995, 2002; Swinnen, 2002; Swinnen et al., 1997b, 1998; Temprado et al., 1999].
We manipulated the availability of augmented visual information to assess its effect on the alleviation of coordination constraints. Previous work has demonstrated that bimanual constraints can be overcome with the help of augmented feedback (FB) [Debaere et al., 2003; Franz and McCormick, 2010; Kovacs et al., 2010; Lee et al., 1995; Ronsse et al., 2011; Swinnen et al., 1997a]. Our results are consistent with these findings, as exemplified by the major improvements in the non 1:1 (more demanding) frequency ratios when augmented visual FB was present. The 1:1 frequency ratio again appeared to be highly stable as it was less influenced by the presence of augmented visual FB.
DTI and Bimanual Coordination
Consistent with previous studies, significantly higher FA values were found for the posterior regions of the CC compared to the anterior and middle CC regions [Chepuri et al., 2002; Hasan et al., 2005, 2009; Hofer and Frahm, 2006; Madden et al., 2004; Ota et al., 2006; Pfefferbaum and Sullivan, 2003; Sullivan et al., 2001]. Chepuri et al. [ 2002] have explained this regional difference in FA by a combination of tighter packing of axons, fewer obliquely oriented axons and less permeable myelin sheaths in the posterior compared to the anterior regions of the CC. In addition, microscopic examination of the CC revealed more densely packed thin fibers in the genu and splenium of the CC, whereas less densely packed fibers were found in the posterior midbody of the CC [Aboitiz et al., 1992]. This regional differentiation of fiber types and densities is paralleled by a regional differentiation of FA, with higher values whenever densely packed CC fibers predominate [Hofer and Frahm, 2006]. These structural differences are consistent with the observation of the lowest FA values in the primary motor/sensory areas and temporal subregions, and the highest FA values in the occipital fiber bundle.
We hypothesized that correlations between task performance and measures of structural organization in the described subregions of the CC would be dependent on task complexity and the availability of augmented visual FB. With respect to FB availability we assumed that bimanual performance in the absence of visual FB would require increased involvement of prefrontal areas (connected by the anterior CC). This structural association was not directly supported even though significant brain‐behavior correlations were found in the NoFB condition. With respect to task complexity we expected that for more complex multifrequency movements the CC substructures connecting the bilateral prefrontal and sensorimotor areas would gain prominence as the supporting architecture for processing in prefrontal and sensorimotor areas. The correlation between FA of the CC primary motor substructure and 3:1 performance fits with this assumption. However, no significant correlations with CC1 (prefrontal) were observed. Furthermore, performance on the easiest 1:1 mode correlated with the CC5 (occipital) substructure.
That we found this correlation in the easiest (1:1) condition without augmented FB may appear somewhat unexpected at first sight, but several potential accounts can be put forward. First, even in the no‐vision condition subjects received a static visual display of a target line (with different slopes), which was associated with a particular trajectory (see Fig. 2). This may have facilitated the involvement of visual processing areas and information exchange through interconnecting CC pathways. Second, apart from an important tactuo‐proprio‐motor component, visual imagery, which is mediated via more posterior CC regions, may support bimanual performance and more effectively so for familiar (1:1) than less familiar tasks (non 1:1). Thus, subjects might have visualized an image of the cursor on the screen representing their performance. This is indirectly supported by several studies showing that cortical visual areas are indeed activated during imagery [Olsson et al., 2008; Solodkin et al., 2004]. Recently it has been demonstrated that performance of a 90° out‐of‐phase task in the absence of augmented visual FB, following acquisition in the presence of this FB, still elicited brain activation in the middle occipital gyrus as if the visual source of information was still present [Ronsse et al., 2011]. This lends support to our assumption that visual processing areas may remain activated when the visual input is withdrawn and the underlying white matter architecture may support this processing. Nevertheless, these specific accounts should be interpreted with caution because it is possible that the association between brain structure and behavior is of a more generic nature whereby later maturing CC substructures, such as occipital CC [Giedd et al., 1996; Hasan et al., 2009; Rajapakse et al., 1996], might constitute a representative candidate of the general state of CC white matter integrity during young adulthood. Moreover, the present finding is generally consistent with previous studies reporting a correlation between FA in the splenium of the CC and performance on a bimanual coordination task, i.e., alternated finger tapping [Muetzel et al., 2008; Sullivan et al., 2001]. We have, however, delineated the substructure of the posterior region of the CC in more detail here.
That occipital CC substructure behavior associations were evident only in the 1:1 task may be a result of the fact that visual imagery may be more helpful for familiar than less familiar coordination patterns. Moreover, the present 1:1 task requires temporal synchronization between both hands but also spatial mapping to ensure symmetrical positions of both hands in space across the whole trajectory, whereas spatial relations between both hands continuously change during non 1:1 coordination. This implies that spatial coupling may be more salient during 1:1 coordination, implying processing along the dorsal visual stream and reliance on visual cortical and parietal association areas. Accordingly, the possibility arises that this spatial mapping may have facilitated visual imagery, thereby indirectly contributing to the significant correlation between 1:1 performance and the occipital region of the CC. That we did not replicate this finding in the augmented visual feedback condition is not necessarily surprising because the structural organization of these tracts and hence their ability to transmit signals in healthy individuals in the context of (lower demand) augmented visual FB conditions may be relatively homogeneous, resulting in less subject variability (being a prerequisite for observing correlations). As such, it appears to be the case that the NoFB conditions are providing the most optimal window into brain structure‐behavior associations in non‐skilled performers, even though performance conditions with augmented visual FB may be instrumental to perform successfully during the NoFB conditions because the latter leave little incentive for improvement whereas the former may be used to tune somatosensory input by mapping proprioceptive onto visual information.
Performance on the present bimanual visuomotor task was also significantly predicted by FA values of the primary motor region of the CC. Higher FA values in this region correlated with lower error scores on the 3:1 task, again in the absence of augmented visual FB. This is consistent with fMRI evidence that the supplementary motor area (SMA) and the primary motor area (M1) contribute to bimanual coordination [Swinnen and Wenderoth, 2004]. Consequently, during bimanual performance communication between both hemispheres will take place along the part of the CC connecting these motor related areas, i.e., the posterior midbody of the CC. Similarly, Meyer et al. [ 1998] demonstrated that the posterior half of the CC is important for communication between both hemispheres nearby the primary motor cortices. Some studies have pointed to the more anterior regions of the CC for bimanual coordination, i.e., genu and anterior midbody [Bonzano et al., 2008; Johansen‐Berg et al., 2007; Preilowski, 1972]. We were not able to reproduce these results and it is important to consider the many differences among studies with respect to generation of brain structural as well as behavioral metrics.
In summary, using a detailed segmentation technique, we determined the association between structural organization of CC white matter microstructure and performance of a complex bimanual coordination task. Extending previous lesion and medical imaging work, brain structure directly predicted the ability to perform bimanual coordination patterns in normal adults. This effect was most clearly evident when bimanual coordination patterns were internally‐guided. The task appeared to be sensitive enough to demonstrate significant brain structure/behavior correlations during the simpler 1:1 as well as during the more difficult 3:1 frequency ratio conditions. The present task may provide an important vehicle to investigate how performance under different task and contextual conditions is predicted by white matter microstructure of the CC subdivisions in normal and pathological groups.
REFERENCES
- Aboitiz F, Scheibel AB, Fisher RS, Zaidel E ( 1992): Fiber composition of the human corpus‐callosum. Brain Res 598: 143–153. [DOI] [PubMed] [Google Scholar]
- Basser PJ, Mattiello J, Lebihan D ( 1994): MR diffusion tensor spectroscopy and imaging. Biophys J 66: 259–267. [DOI] [PMC free article] [PubMed] [Google Scholar]
- Basser PJ, Pierpaoli C ( 1996): Microstructural and physiological features of tissues elucidated by quantitative‐diffusion‐tensor MRI. J Magn Reson B 111: 209–219. [DOI] [PubMed] [Google Scholar]
- Beaulieu C ( 2002): The basis of anisotropic water diffusion in the nervous system—A technical review. NMR Biomed 15: 435–455. [DOI] [PubMed] [Google Scholar]
- Bonzano L, Tacchino A, Roccatagliata L, Abbruzzese G, Mancardi GL, Bove M ( 2008): Callosal contributions to simultaneous bimanual finger movements. J Neurosci 28: 3227–3233. [DOI] [PMC free article] [PubMed] [Google Scholar]
- Byblow WD, Goodman D ( 1994): Performance asymmetries in multifrequency coordination. Hum Movement Sci 13: 147–174. [Google Scholar]
- Carson RG, Thomas J, Summers JJ, Walters MR, Semjen A ( 1997): The dynamics of bimanual circle drawing. Q J Exp Psychol A 50: 664–683. [DOI] [PubMed] [Google Scholar]
- Catani M, de Schotten MT ( 2008): A diffusion tensor imaging tractography atlas for virtual in vivo dissections. Cortex 44: 1105–1132. [DOI] [PubMed] [Google Scholar]
- Chepuri NB, Yen YF, Burdette JH, Li H, Moody DM, Maldjian JA ( 2002): Diffusion anisotropy in the corpus callosum. AJNR AM J Neuroradiol 23: 803–808. [PMC free article] [PubMed] [Google Scholar]
- Debaere F, Wenderoth N, Sunaert S, Van Hecke P, Swinnen SP ( 2003): Internal vs. external generation of movements: Differential neural pathways involved in bimanual coordination performed in the presence or absence of augmented visual feedback. Neuroimage 19: 764–776. [DOI] [PubMed] [Google Scholar]
- Deutsch D ( 1983): The generation of two isochronous sequences in parallel. Percept Psychophys 34: 331–337. [DOI] [PubMed] [Google Scholar]
- Eliassen JC, Baynes K, Gazzaniga MS ( 1999): Direction information coordinated via the posterior third of the corpus callosum during bimanual movements. Exp Brain Res 128: 573–577. [DOI] [PubMed] [Google Scholar]
- Eliassen JC, Baynes K, Gazzaniga MS ( 2000): Anterior and posterior callosal contributions to simultaneous bimanual movements of the hands and fingers. Brain 123: 2501–2511. [DOI] [PubMed] [Google Scholar]
- Franz EA, McCormick R ( 2010): Conceptual unifying constraints override sensorimotor interference during anticipatory control of bimanual actions. Exp Brain Res 205: 273–282. [DOI] [PubMed] [Google Scholar]
- Franz EA, Zelaznik HN, Mccabe G ( 1991): Spatial topological constraints in a bimanual task. Acta Psychol (Amst) 77: 137–151. [DOI] [PubMed] [Google Scholar]
- Franz EA, Zelaznik HN, Swinnen S, Walter C ( 2001): Spatial conceptual influences on the coordination of bimanual actions: When a dual task becomes a single task. J Motor Behav 33: 103–112. [DOI] [PubMed] [Google Scholar]
- Giedd JN, Rumsey JM, Castellanos FX, Rajapakse JC, Kaysen D, Vaituzis AC, Vauss YC, Hamburger SD, Rapoport JL ( 1996): A quantitative MRI study of the corpus callosum in children and adolescents. Dev Brain Res 91: 274–280. [DOI] [PubMed] [Google Scholar]
- Goldberg G ( 1985): Supplementary motor area structure and function—Review and hypotheses. Behav Brain Sci 8: 567–588. [Google Scholar]
- Hasan KM, Gupta RK, Santos RM, Wolinsky JS, Narayana PA ( 2005): Diffusion tensor fractional anisotropy of the normal‐appearing seven segments of the corpus callosum in healthy adults and relapsing‐remitting multiple sclerosis patients. J Magn Reson Imaging 21: 735–743. [DOI] [PubMed] [Google Scholar]
- Hasan KM, Kamali A, Iftikhar A, Kramer LA, Papanicolaou AC, Fletcher JM, Ewing‐Cobbs L ( 2009): Diffusion tensor tractography quantification of the human corpus callosum fiber pathways across the lifespan. Brain Res 1249: 91–100. [DOI] [PMC free article] [PubMed] [Google Scholar]
- Hecke WV, Nagels G, Leemans A, Vandervliet E, Sijbers J, Parizel P ( 2010): Correlation of cognitive dysfunction and diffusion tensor MRI measures in patients with mild and moderate multiple sclerosis. J Magn Reson Imaging 31: 1492–1498. [DOI] [PubMed] [Google Scholar]
- Hofer S, Frahm J ( 2006): Topography of the human corpus callosum revisited—Comprehensive fiber tractography using diffusion tensor magnetic resonance imaging. Neuroimage 32: 989–994. [DOI] [PubMed] [Google Scholar]
- Hsu JL, Van Hecke W, Bai CH, Lee CH, Tsai YF, Chiu HC, Jaw FS, Hsu CY, Leu JG, Chen WH, Leemans A ( 2010): Microstructural white matter changes in normal aging: A diffusion tensor imaging study with higher‐order polynomial regression models. Neuroimage 49: 32–43. [DOI] [PubMed] [Google Scholar]
- Huang H, Zhang JY, Jiang HY, Wakana S, Poetscher L, Miller MI, van Zijl PCM, Hillis AE, Wytik R, Mori S ( 2005): DTI tractography based parcellation of white matter: Application to the mid‐sagittal morphology of corpus callosum. Neuroimage 26: 195–205. [DOI] [PubMed] [Google Scholar]
- Ito S, Makino T, Shirai W, Hattori T ( 2008): Diffusion tensor analysis of corpus callosum in progressive supranuclear palsy. Neuroradiology 50: 981–985. [DOI] [PubMed] [Google Scholar]
- Ivry RB, Spencer RM, Zelaznik HN, Diedrichsen J ( 2002): The cerebellum and event timing. Ann N Y Acad Sci 978: 302–317. [DOI] [PubMed] [Google Scholar]
- Johansen‐Berg H, Della‐Maggiore V, Behrens TEJ, Smith SM, Paus T ( 2007): Integrity of white matter in the corpus callosum correlates with bimanual co‐ordination skills. Neuroimage 36: T16–T21. [DOI] [PMC free article] [PubMed] [Google Scholar]
- Kelso JAS ( 1984): Phase‐transitions and critical‐behavior in human bimanual coordination. Am J Physiol 246: R1000–R1004. [DOI] [PubMed] [Google Scholar]
- Kennerley SW, Diedrichsen J, Hazeltine E, Semjen A, Ivry RB ( 2002): Callosotomy patients exhibit temporal uncoupling during continuous bimanual movements. Nat Neurosci 5: 376–381. [DOI] [PubMed] [Google Scholar]
- Klapp ST, Hill MD, Tyler JG, Martin ZE, Jagacinski RJ, Jones MR ( 1985): On marching to two different drummers: Perceptual aspects of the difficulties. J Exp Psychol 11: 814–827. [DOI] [PubMed] [Google Scholar]
- Klein S, Staring M, Murphy K, Viergever MA, Pluim JPW ( 2010): Elastix: A toolbox for intensity‐based medical image registration. IEEE Trans Med Imaging 29: 196–205. [DOI] [PubMed] [Google Scholar]
- Kovacs AJ, Buchanan JJ, Shea CH ( 2010): Perceptual and attentional influences on continuous 2:1 and 3:2 multi‐frequency bimanual coordination. J exp Psychol Hum percept Perform 36: 936–954. [DOI] [PubMed] [Google Scholar]
- Lee TD, Swinnen SP, Verschueren S ( 1995): Relative phase alterations during bimanual skill acquisition. J Motor Behav 27: 263–274. [DOI] [PubMed] [Google Scholar]
- Leemans A, Jones DK ( 2009): The B‐matrix must be rotated when correcting for subject motion in DTI data. Magn Reson Med 61: 1336–1349. [DOI] [PubMed] [Google Scholar]
- Leemans A, Sijbers J, De Backer S, Vandervliet E, Parizel PM ( 2005): Affine coregistration of diffusion tensor magnetic resonance images using mutual information. Adv Concepts Intell Vis Syst Proc 3708: 523–530. [Google Scholar]
- Leemans A, Jeurissen B, Sijbers J, Jones DK ( 2009): ExploreDTI: A graphical toolbox for processing, analyzing, and visualizing diffusion MR data. In: 17th Annual Meeting of Intl Soc Mag Reson Med, Hawaii, USA. p 3537.
- Madden DJ, Whiting WL, Huettel SA, White LE, MacFall JR, Provenzale JM ( 2004): Diffusion tensor imaging of adult age differences in cerebral white matter: Relation to response time. Neuroimage 21: 1174–1181. [DOI] [PubMed] [Google Scholar]
- Marquardt DW ( 1963): An Algorithm for least‐squares estimation of nonlinear parameters. J Soc Ind Appl Math 11: 431–441. [Google Scholar]
- Meyer BU, Roricht S, Woiciechowsky C ( 1998): Topography of fibers in the human corpus callosum mediating interhemispheric inhibition between the motor cortices. Ann Neurol 43: 360–369. [DOI] [PubMed] [Google Scholar]
- Mori S, Oishi K, Jiang HY, Jiang L, Li X, Akhter K, Hua KG, Faria AV, Mahmood A, Woods R, Toga AW, Pike GB, Neto PR, Evans A, Zhang JY, Huang H, Miller MI, Zijl P, Mazziotta J ( 2008): Stereotaxic white matter atlas based on diffusion tensor imaging in an ICBM template. Neuroimage 40: 570–582. [DOI] [PMC free article] [PubMed] [Google Scholar]
- Mueller KLO, Marion SD, Paul LK, Brown WS ( 2009): Bimanual motor coordination in agenesis of the corpus callosum. Behav Neurosci 123: 1000–1011. [DOI] [PubMed] [Google Scholar]
- Muetzel RL, Collins PF, Mueller BA, Schissel AM, Lim KO, Luciana M ( 2008): The development of corpus callosum microstructure and associations with bimanual task performance in healthy adolescents. Neuroimage 39: 1918–1925. [DOI] [PMC free article] [PubMed] [Google Scholar]
- Oldfield RC ( 1971): Assessment and analysis of handedness—Edinburgh inventory. Neuropsychologia 9: 97–113. [DOI] [PubMed] [Google Scholar]
- Olsson CJ, Jonsson B, Larsson A, Nyberg L ( 2008): Motor representations and practice affect brain systems underlying imagery: An fMRI study of internal imagery in novices and active high jumpers. Open Neuroimaging J 2: 5–13. [DOI] [PMC free article] [PubMed] [Google Scholar]
- Ota M, Obata T, Akine Y, Ito H, Ikehira H, Asada T, Suhara T ( 2006): Age‐related degeneration of corpus callosum measured with diffusion tensor imaging. Neuroimage 31: 1445–1452. [DOI] [PubMed] [Google Scholar]
- Peper CE, Beek PJ, Vanwieringen PCW ( 1995a): Frequency‐induced phase‐transitions in bimanual tapping. Biol Cybern 73: 301–309. [DOI] [PubMed] [Google Scholar]
- Peper CE, Beek PJ, Vanwieringen PCW ( 1995b): Multifrequency coordination in bimanual tapping—Asymmetrical coupling and signs of supercriticality. J Exp Psychol Hum Percept Perform 21: 1117–1138. [Google Scholar]
- Peters M ( 1985): Constraints in the performance of bimanual tasks and their expression in unskilled and skilled subjects. Q J Exp Psychol A 37: 171–196. [Google Scholar]
- Pfefferbaum A, Sullivan EV ( 2003): Increased brain white matter diffusivity in normal adult aging: Relationship to anisotropy and partial voluming. Magn Reson Med 49: 953–961. [DOI] [PubMed] [Google Scholar]
- Preilowski BFB ( 1972): Possible contribution of anterior forebrain commissures to bilateral motor coordination. Neuropsychologia 10: 267–277. [DOI] [PubMed] [Google Scholar]
- Rajapakse JC, Giedd JN, Rumsey JM, Vaituzis AC, Hamburger SD, Rapoport JL ( 1996): Regional MRI measurements of the corpus callosum: A methodological and developmental study. Brain Dev 18: 379–388. [DOI] [PubMed] [Google Scholar]
- Robertson SD, Zelaznik HN, Lantero DA, Bojczyk KG, Spencer RM, Doffin JG, Schneidt T ( 1999): Correlations for timing consistency among tapping and drawing tasks: Evidence against a single timing process for motor control. J Exp Psychol Hum Percept Perform 25: 1316–1330. [DOI] [PubMed] [Google Scholar]
- Ronsse R, Puttemans V, Coxon JP, Goble DJ, Wagemans J, Wenderoth N, Swinnen SP ( 2011): Motor learning with augmented feedback: Modality‐dependent behavioral and neural consequences. Cereb Cortex 21: 1283–1294. [DOI] [PubMed] [Google Scholar]
- Sage CA, Van Hecke W, Peeters R, Sijbers J, Robberecht W, Parizel P, Marchal G, Leemans A, Sunaert S ( 2009): Quantitative diffusion tensor imaging in amyotrophic lateral sclerosis: Revisited. Hum Brain Mapp 30: 3657–3675. [DOI] [PMC free article] [PubMed] [Google Scholar]
- Semjen A, Summers JJ, Cattaert D ( 1995): Hand coordination in bimanual circle drawing. J Exp Psychol Hum Percept Perform 21: 1139–1157. [Google Scholar]
- Solodkin A, Hlustik P, Chen EE, Small SL ( 2004): Fine modulation in network activation during motor execution and motor imagery. Cereb Cortex 14: 1246–1255. [DOI] [PubMed] [Google Scholar]
- Sternad D, Wei KL, Diedrichsen J, Ivry RB ( 2007): Intermanual interactions during initiation and production of rhythmic and discrete movements in individuals lacking a corpus callosum. Exp Brain Res 176: 559–574. [DOI] [PubMed] [Google Scholar]
- Stucchi N, Viviani P ( 1993): Cerebral‐dominance and asynchrony between bimanual 2‐dimensional movements. J Exp Psychol Hum Percept Perform 19: 1200–1220. [DOI] [PubMed] [Google Scholar]
- Sullivan EV, Adalsteinsson E, Hedehus M, Ju C, Moseley M, Lim KO, Pfefferbaum A ( 2001): Equivalent disruption of regional white matter microstructure in ageing healthy men and women. Neuroreport 12: 99–104. [DOI] [PubMed] [Google Scholar]
- Summers JJ, Rosenbaum DA, Burns BD, Ford SK ( 1993): Production of polyrhythms. J Exp Psychol Hum Percept Perform 19: 416–428. [DOI] [PubMed] [Google Scholar]
- Summers JJ, Semjen A, Carson RG, Thomas J ( 1995): Going around in circles: The dynamics of bimanual circling. Adv Psychol 111: 231–253. [Google Scholar]
- Summers JJ, Davis AS, Byblow WD ( 2002): The acquisition of bimanual coordination is mediated by anisotropic coupling between the hands. Hum Mov Sci 21: 699–721. [DOI] [PubMed] [Google Scholar]
- Swinnen SP ( 2002): Intermanual coordination: From behavioral principles to neural‐network interactions. Nat Rev Neurosci 3: 350–361. [DOI] [PubMed] [Google Scholar]
- Swinnen SP, Wenderoth N ( 2004): Two hands, one brain: Cognitive neuroscience of bimanual skill. Trends Cogn Sci 8: 18–25. [DOI] [PubMed] [Google Scholar]
- Swinnen SP, Jardin K, Meulenbroek R ( 1996): Between‐limb asynchronies during bimanual coordination: Effects of manual dominance and attentional cueing. Neuropsychologia 34: 1203–1213. [DOI] [PubMed] [Google Scholar]
- Swinnen SP, Dounskaia N, Walter CB, Serrien DJ ( 1997a): Preferred and induced coordination modes during the acquisition of bimanual movements with a 2:1 frequency ratio. J Exp Psychol Hum Percept Perform 23: 1087–1110. [Google Scholar]
- Swinnen SP, Jardin K, Meulenbroek R, Dounskaia N, HofkensVanDenBrandt M ( 1997b): Egocentric and allocentric constraints in the expression of patterns of interlimb coordination. J Cogn Neurosci 9: 348–377. [DOI] [PubMed] [Google Scholar]
- Swinnen SP, Jardin K, Verschueren S, Meulenbroek R, Franz L, Dounskaia N, Walter CB ( 1998): Exploring interlimb constraints during bimanual graphic performance: Effects of muscle grouping and direction. Behav Brain Res 90: 79–87. [DOI] [PubMed] [Google Scholar]
- Swinnen SP, Dounskaia N, Duysens J ( 2002): Patterns of bimanual interference reveal movement encoding within a radial egocentric reference frame. J Cogn Neurosci 14: 463–471. [DOI] [PubMed] [Google Scholar]
- Swinnen SP, Puttemans V, Vangheluwe S, Wenderoth N, Levin O, Dounskaia N ( 2003): Directional interference during bimanual coordination: Is interlimb coupling mediated by afferent or efferent processes. Behav Brain Res 139: 177–195. [DOI] [PubMed] [Google Scholar]
- Temprado JJ, Zanone PG, Monno A, Laurent M ( 1999): Attentional load associated with performing and stabilizing preferred bimanual patterns. J Exp Psychol Hum Percept Perform 25: 1579–1594. [Google Scholar]
- Tournier D, Mori S, Leemans A ( 2011): Diffusion tensor imaging and beyond. Magn Reson Med 65: 1532–1556. [DOI] [PMC free article] [PubMed] [Google Scholar]
- Treffner PJ, Turvey MT ( 1993): Resonance constraints on rhythmic movement. J Exp Psychol Hum Percept Perform 19: 1221–1237. [Google Scholar]
- Van Hecke W, Leemans A, D'Agostino E, De Backer S, Vandervliet E, Parizel PM, Sijbers J ( 2007): Nonrigid coregistration of diffusion tensor images using a viscous fluid model and mutual information. IEEE Trans Med Imaging 26: 1598–1612. [DOI] [PubMed] [Google Scholar]
- Van Hecke W, Sijbers J, D'Agostino E, Maes F, De Backer S, Vandervliet E, Parizel PM, Leemans A ( 2008): On the construction of an inter‐subject diffusion tensor magnetic resonance atlas of the healthy human brain. Neuroimage 43: 69–80. [DOI] [PubMed] [Google Scholar]
- Van Hecke W, Sijbers J, De Backer S, Poot D, Parizel PM, Leemans A ( 2009): On the construction of a ground truth framework for evaluating voxel‐based diffusion tensor MRI analysis methods. Neuroimage 46: 692–707. [DOI] [PubMed] [Google Scholar]
- Verhoeven JS, Sage CA, Leemans A, Van Hecke W, Callaert D, Peeters R, De Cock P, Lagae L, Sunaert S ( 2010): Construction of a stereotaxic DTI atlas with full diffusion tensor information for studying white matter maturation from childhood to adolescence using tractography‐based segmentations. Hum Brain Mapp 31: 470–486. [DOI] [PMC free article] [PubMed] [Google Scholar]
- Wenderoth N, Puttemans V, Vangheluwe S, Swinnen SP ( 2003): Bimanual training reduces spatial interference. J Motor Behav 35: 296–308. [DOI] [PubMed] [Google Scholar]
- Witelson SF ( 1989): Hand and sex‐differences in the isthmus and genu of the human corpus‐callosum—A postmortem morphological‐study. Brain 112: 799–835. [DOI] [PubMed] [Google Scholar]