Abstract
Objective: Synchronization between distributed rhythms in the brain is commonly assessed by estimating the synchronization strength from simultaneous measurements. This approach, however, does not elucidate the phase dynamics that underlies synchronization. For this, an explicit dynamical model is required. Based on the assumption that the recorded rhythms can be described as weakly coupled oscillators, we propose a method for characterizing their phase‐interaction dynamics. Methods: We propose to model ongoing magnetoencephalographic (MEG) oscillations as weakly coupled oscillators. Based on this model, the phase interactions between simultaneously recorded signals are characterized by estimating the modulation in instantaneous frequency as a function of their phase difference. Furthermore, we mathematically derive the effect of volume conduction on the model and show how indices for strength and direction of coupling can be derived. Results: The methodology is tested using simulations and is applied to ongoing occipital–frontal MEG oscillations of healthy subjects in the alpha and beta bands during rest. The simulations show that the model is robust against the presence of noise, short observation times, and model violations. The application to MEG data shows that the model can reconstruct the observed occipital–frontal phase difference distributions. Furthermore, it suggests that phase locking in the alpha and beta band is established by qualitatively different mechanisms. Conclusion: When the recorded rhythms are assumed to be weakly coupled oscillators, a dynamical model for the phase interactions can be fitted to data. The model is able to reconstruct the observed phase difference distribution, and hence, provides a dynamical explanation for observed phase locking. Hum Brain Mapp, 2011. © 2011 Wiley‐Liss, Inc.
Keywords: functional interaction, synchronization, oscillatory activity, phase locking, coupled oscillators, EEG, MEG, volume conduction
INTRODUCTION
Throughout the mammalian nervous system, a wide variety of electrical rhythms can be recorded on different spatial and temporal scales. These rhythms and their interactions are known to be involved in a wide variety of cognitive and behavioral tasks [Buzsaki,2006]. In spite of many studies aiming to relate neuronal oscillations to cognitive and behavioral parameters, there is still no consensus on how neuronal oscillations encode information and how they fulfill their functional roles. An important task in this context is to characterize the phase‐interaction dynamics of spatially separated neuronal rhythms.
Current research on this issue is mainly conducted along two lines: the analysis of computational models [Deco et al.,2008] and the analysis of experimental data [Le Van Quyen and Bragin,2007]. In the present study, we combine these two approaches by modeling ongoing cortical rhythms as weakly coupled self‐sustained oscillators. Under this assumption, a phase‐interaction model can be fitted to experimental observations [Rosenblum and Pikovski,2001; Rosenblum et al.,2006]. These models have been applied successfully to physiological data, for example, to elucidate the dynamical mechanisms behind cardiorespiratory coupling [Rosenblum et al.,2002]. In this study, we apply them to ongoing cerebral oscillations as measured with MEG.
In this study, a specific version of the general phase‐interaction model [Rosenblum et al.,2006] is used for spontaneous MEG data, and an estimation method for this model is proposed. The performance of the method is tested using numerical simulations and the effects of model violations are explored. We formally describe the effect of volume conduction on the fitted models. The method is applied to human MEG recordings to study the phase‐interaction dynamics between ongoing occipital and frontal oscillations in the alpha and beta bands of healthy human subjects during an eyes‐closed resting state.
MATERIALS AND METHODS
Modeling Phase Interactions
Data model
To investigate whether the electrical activity between two brain regions is synchronized, it is customary to compute indices from simultaneously recorded signals that quantify to what extent the signals are coordinated [Lachaux et al.,1999]. In particular, coordination between the phases of the recorded signals is measured by quantifying the extent to which the distribution of instantaneous phase differences deviates from a flat distribution [Pereda et al.,2005; Tass,1998]. In this study, we aim at a data‐driven model for the instantaneous phases of the recorded signals that can explain the observed distribution of phase differences.
To describe the model, we need some terminology. The instantaneous phase of an oscillatory signal x(n) (n = 1,…,N) is a signal φx(n), such that x(n) = A x(n)cosφx(n) for a constant or slowly varying signal A x(n), the instantaneous amplitude of the signal. The relative phase ψ(n) between x(n) and y(n) is defined as the difference between their instantaneous phases: ψ(n) = φx(n) − φy(n) [Pikovski et al.,2001]. The instantaneous frequency of x(n) in Hertz is defined as the scaled time difference
| (1) |
and similarly for y(n), where Δt is the sampling period in seconds. We model the dynamics of the instantaneous phases by the following two coupled equations:
| (2) |
| (3) |
In these equations, M x and M y are the modulation functions, which are 2π periodic, and the terms ξx(n) and ξy(n) are the zero‐mean noise processes. The modulation functions describe how the relative phase modulates the instantaneous frequencies of both signals. Although there exist more general phase‐interaction models [Rosenblum et al.,2006], in Appendix A we show that the earlier model is general enough for applications to spontaneous MEG oscillations.
Synchronization behavior
A system satisfying Eqs. (2) and (3) can display three different kinds of dynamical behavior [Pikovski,2001]: (i) When the oscillators are uncoupled, that is, when M x and M y are constant, both systems oscillate at their intrinsic frequencies and their relative phase rotates with constant speed. As a consequence, the distribution of the relative phase is flat. (ii) When the oscillators are strongly coupled, they lock their phases and oscillate at a common frequency, and the relative phase is constant. As a consequence, the distribution of the relative phase concentrates in one point. (iii) When the coupling strength is intermediate, the oscillators influence each other but do not lock their phases entirely. The natural frequencies of the oscillators are modulated by their relative phase. As a consequence, the distribution of the relative phase is peaked, but the peak is smeared out over the interval [0,2π]. Situation (iii) is called intermittent and occurs when the oscillators are on the edge of synchrony. The modulation functions M x and M y can only be estimated when the system is intermittent.
Distribution of phase differences
Coupled oscillations can interact in different ways and still give rise to the same distribution of relative phases. To illustrate this, we consider Eqs. (2) and (3) with M x(ψ) = 10.2 − c x sin(ψ) and M y(ψ) = 9.8 + c y sin(ψ) for four different pairs of coupling strengths (c x, c y): (a): (0.2, 0); (b): (0, 0.2); (c): (0.1, 0.1); and (d): (0.15, 0.05). Figure 1a–d show the corresponding modulation functions. In each case, the oscillators display intermittent behavior, but they are coupled in different ways. In (a) the coupling is unidirectional, where the instantaneous frequency of x is decelerated by y, in (b) the coupling is also unidirectional, but now the instantaneous frequency of y is accelerated by x, in (c) the coupling is bidirectional and symmetrical, and in (d) the coupling is bidirectional but asymmetrical. However, the distribution of relative phases is identical in the four cases (Fig. 1e). Therefore, different interaction mechanisms can generate the same relative phase distribution, and as a consequence, no synchronization index that is derived from this distribution can uncover the different underlying mechanisms, rendering an analysis of the temporal fluctuations in the instantaneous frequencies of the recorded rhythms necessary.
Figure 1.
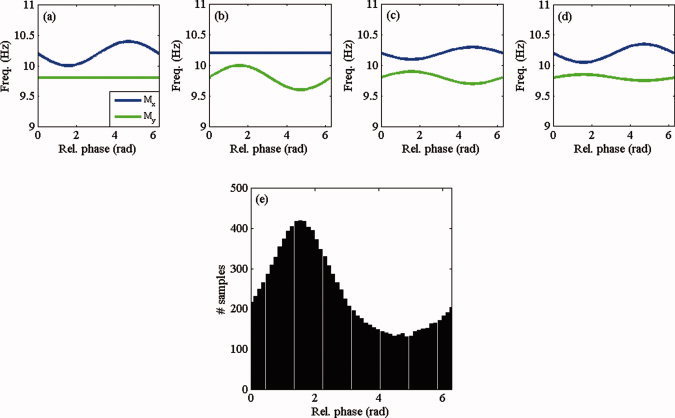
Synchronization mechanisms. Shown are four different pairs of sinusoidal modulation functions: (a) unidirectional decelerating coupling, (b) unidirectional accelerating coupling, (c) symmetrical coupling, and (d) asymmetrical coupling. These four different mechanisms, however, generate the same distribution of phase differences (e). [Color figure can be viewed in the online issue, which is available at wileyonlinelibrary.com.]
Estimation and Use of the Model
Fitting the modulation functions to data
Given discrete time signals x(n) and y(n) sampled with a period of Δt seconds, we extract their instantaneous phases by using the discrete Hilbert transformation [Pereda et al.,2005] and compute the instantaneous frequencies
 and
and
 according to Eq. (1). We estimate the modulation functions M
x and M
y in a nonparametric way by averaging
 and
and
 conditional on ψ. We divide the interval [0,2π] into B bins of equal size. The value of M
x at the center c
j of the jth bin is estimated by
| (4) |
where
 and #S
j,x is the number of samples in S
j,x. This means that M
x(ψ) is estimated for ψ in a given bin by averaging the instantaneous frequencies of x over those samples for which ψ falls into this bin. By replacing x by y we obtain
 . To reduce noise in the estimates, a least‐squares smoothing filter of order k and frame size f is applied to the estimated modulation functions. This smoothing procedure is also referred to as a Savitsky–Golay filter [Savitsky and Golay,1964]. It smoothes a discrete function in every sample by locally fitting a kth order polynomial through the f − 1 neighboring samples and replaces the sample by the corresponding value of the fitted polynomial. In the smoothing procedure, the boundaries are treated by extending them periodically. Our method of estimation is nonparametric in that it does not assume a particular form of the modulation functions. In Appendix B, this method is compared with a parametric estimation method. While both methods have theoretical advantages and disadvantages, they give comparable results when applied to ongoing MEG recordings.
Reconstruction of the distribution of the relative phase
The quality of the estimated modulation functions can be assessed by comparing the observed distribution of relative phases with the distribution that is generated by the estimated equations
| (5) |
| (6) |
We integrate this model with time step Δt and observation time equal to the recording time of x and y to obtain simulated relative phases ψsim(n) for n = 1,…, N, from which we compute the simulated histogram by binning them into B bins. To assess the appropriateness of the estimated model, the histograms of the observed and simulated relative phases are compared.
Measuring strength and direction in coupling
Besides providing a characterization of the phase interaction, modulation functions have the advantage that the strength and direction in coupling can be computed from them. We define the coupling strength κx by
| (7) |
where
 is the mean instantaneous frequency of x. This index measures the coupling from y to x in Hertz and is estimated by
| (8) |
where
 is the mean frequency of x over all time samples.
Following Rosenblum and Pikosvki [2001], we define a directionality index δ by
| (9) |
This index equals −1 for unidirectional coupling from y to x, 1 for unidirectional coupling from x to y, and assumes intermediate values for bidirectional coupling. In particular, δ equals zero for symmetrical coupling.
Surrogate data
We test for statistical significance of the coupling strength indices using Fourier randomized data [Pereda et al.,2005]. In this way, spurious detection of coupling due to bandpass filtering can be excluded. For two bandpass filtered signals x and y, we calculate their Fourier spectra S
x(ω) and S
y(ω), randomly shuffled the phases by adding for every frequency ω a random number between 0 and 2π, and apply the inverse Fourier transform to yield surrogate signals
 and
and
 . The coupling indices
 and
and
 computed from these signals can be used as surrogate values for κx and κy, since there is no phase coupling between
 and
and
 . In this way, we generate 99 surrogate values
 for κx and similarly for κy. The p value for an observed κx value is based on its position i in the ordered array of 100 p values, consisting of the 99 surrogate
 values and the observed κx value:
| (10) |
When we observe that the κx value exceeds all surrogate values, we have p = 0.01. p values for κy are obtained in a similar way. When the p values for both κx and κy do not exceed 0.05, we repeat the surrogate procedure for the direction index δ.
RESULTS
Numerical Simulations
Performance of the estimation method
To test the estimation method, we simulated two noisy limit‐cycle oscillators x and y that are weakly coupled through sinusoidal coupling functions:
| (11) |
| (12) |
We fixed f
x = 10 Hz, f
y = 9 Hz, and Δt = 0.005. The settings of the method were fixed at B = 32, f = 17, and k = 3. In the first simulation, we assessed the performance of the method to reconstruct the modulation function M
x(ψ) = f
x − c
x sin(ψ) as a function of observation time T and noise variance σ2. We chose c
x = 0.3 and c
y = 0, for which the system is intermittent. We simulated the system 1,000 times with random initial conditions for (i) fixed T = 5 s and σ2 running from 0 to 2 in steps of 0.05 and (ii) for fixed σ2 = 0.5 and T running from 2 to 20 in steps of 2. For each simulation, we computed the estimate
 and the sum of squared errors (SSE) over the points where
 was estimated [see Eq. (4)].
The results are summarized in Figure 2. Figure 2a shows that the mean and standard deviation of the SSE gradually increase with increasing noise variance. Figure 2b shows that both the mean and standard deviation of the SSE can be reduced by increasing the observation time.
Figure 2.
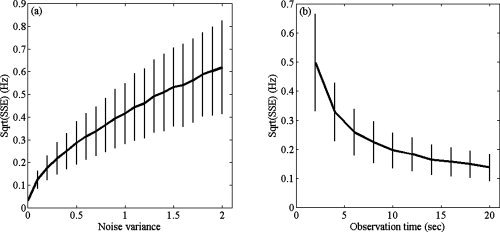
Estimation of the modulation functions. (a) Shown is the square root of the sum of squared errors (SSE) as a function of noise variance. (b) Shown is the square root of the (SSE) as a function of observation time. The curves give the mean of the square roots of the SSEs over 1,000 simulations and the vertical bars denote one standard deviation.
In a third simulation, we tested the performance of the indices to estimate the strength and direction in coupling. We chose c
y = 0.25 and let c
x run from 0 to 0.5 in steps of 0.05. For every value of c
x, the estimated coupling strength
 and coupling direction
 were computed for 1,000 realizations with observation time T = 5 s, noise variance σ2 = 0.1, and random initial conditions. The results are summarized in Figure 3. Figure 3a demonstrates that
 is unbiased over the entire range of c
x, except when c
x is almost zero, in which case the coupling strength is slightly overestimated. Moreover, the standard variation of
 is constant over the entire range of c
x. Figure 3b shows that
 is also unbiased over the entire range of c
x, except for one‐directional coupling, and the standard deviation is constant over the range of c
x. This is to be expected, given the definition of
 in terms of
 and
and
 [Eq. (9)].
Figure 3.
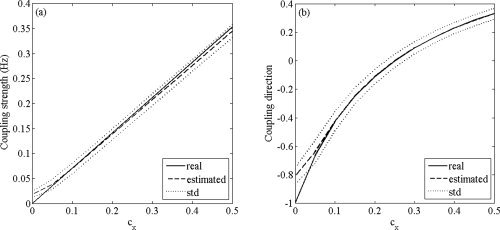
Estimation of strength and direction in coupling. (a) True and estimated coupling strength as function of c x. (b) True and estimated coupling direction as function of c x. In (a) and (b), the solid lines denote the true values of coupling strength and direction, respectively, the dashed lines denote the estimated values, and the dotted lines denote one standard deviation above and below the estimated values (based on 1,000 simulations).
Volume conduction effects
Mixing of signals from different neuronal sources due to volume conduction is a well‐known problem when interpreting EEG or MEG data. To test how volume conduction affects the modulation functions of the presented model, we simulated uncoupled (c x = c y = 0) oscillatory source signals s 1 and s 2 from Eqs. (11) and (12), respectively, with f 1 = 10 Hz and f 2 = 9 Hz and mixed them to obtain observed signals m 1 and m 2:
| (13) |
where α1, α2, α3, and α4 are real coefficients. The coefficients α1 and α2 quantify the strength with which s 1 and s 2, respectively, are recorded in m 1 and α3 and α4 quantify the magnitude with which s 1 and s 2, respectively, are recorded in m 2. In EEG and MEG recordings, the coefficients can be both positive and negative, depending on the orientation of the sources. We fixed α1 = 0.9 and α4 = 0.7 and selected four different pairs of mixing coefficients, leading to the following mixing matrices:
We applied the method described in “Fitting the Modulation Functions to Data” section to estimate the modulation functions between the mixed sources, i.e., between m
1 and m
2. We set T = 30 s and Δt = 0.005. In the first case (Fig. 4a), s
1 and s
2 are not mixed and
 and
and
 indeed show that m
1 and m
2 are uncoupled. As Figure 4b–d show, mixing of sources gives rise to nonconstant modulation functions. Irrespective of the signs of the mixing coefficients, however, the modulation functions always are symmetrical around π (and hence around 0). Moreover, the signs of the mixing coefficients determine how the instantaneous frequencies of the mixed sources are modulated: when s
2 is positively mixed into m
1, the instantaneous frequency of m
1 is attracted toward the natural frequency of s
1 around 0 and is repelled from the natural frequency of s
1 around π (Fig. 4b–d). As a consequence, when both mixing coefficients are positive as in the second case (Fig. 4b), the instantaneous frequencies of m
1 and m
2 are attracted toward each other around 0 and the phase difference clusters around 0. When both mixing coefficients are negative, as in the third case (Fig. 4c), the instantaneous frequencies of m
1 and m
2 are attracted toward each other around π, and, hence, the phase difference clusters around π. When the mixing coefficients have different signs as in the fourth case (Fig. 4d), a simultaneous attraction and repulsion occurs both around 0 and π. Whether the phase difference clusters around 0 or π depends on the relative strength of the mixing coefficients.
Figure 4.
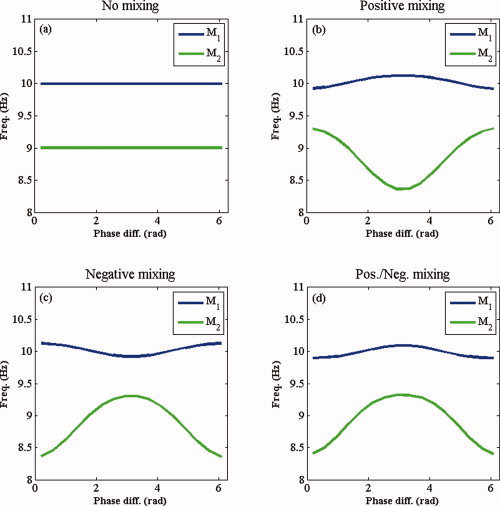
Volume‐conduction effects. Shown are the modulation functions of uncoupled oscillatory sources for (a) no mixing, (b) positive mixing, (c) negative mixing, and (d) combined positive and negative mixing. In each of the four cases, the modulation functions are symmetric around 0 and π. [Color figure can be viewed in the online issue, which is available at wileyonlinelibrary.com.]
From these simulations, we draw the conclusion that the modulation functions between mixed, uncoupled sources are symmetrical. A mathematical proof for this statement is provided in Appendix C. We also experimented with mixed, coupled sources and found that the resulting modulation functions are superpositions of the true modulation functions and the modulation functions as just described for the uncoupled case. To conclude, asymmetrical modulation functions imply coupling of the underlying sources.
Sources with time‐varying frequencies
The instantaneous frequencies of cortical rhythms as measured with MEG are unlikely to be constant over time. In the phase model [Eqs. (2) and (3)], the instantaneous frequencies of the sources are allowed to be noisy, since this kind of variation is incorporated into the noise terms. Ongoing cortical oscillations, however, also display slow and correlated fluctuations in their instantaneous frequencies, which are reflected in a broad power spectrum. Therefore, for applications to real MEG data, it is necessary that the method does not spuriously detect coupling due to time‐varying frequencies of the sources. To test this, we simulated the following system:
| (14) |
| (15) |
where the instantaneous frequencies f x(n) and f y(n) vary slowly over time. Equations (14) and (15) describe uncoupled and noisy sources with time‐varying intrinsic frequencies. We tested whether the estimation method spuriously detects coupling due to the fluctuations in f x and f y.
To simulate time‐varying frequencies f
x(n) and f
x(n), we proceeded as follows. We simulated two uniformly random processes and lowpass filtered them at 1 Hz. By adding constants 9.8 and 10.2 to the respective filtered signals, we obtained time‐varying frequencies f
x(n) and f
x(n) with means 10.2 Hz and 9.8 Hz, respectively. The observation time was set to 30 s. We simulated 20 pairs of nonstationary time series. For each pair, we computed the modulation index
 and computed its p value using surrogate data. None of the 20 p values dropped below 0.05 as is to be expected in the absence of coupling. We repeated the analysis using coupled sources rather than uncoupled sources and found that coupling can still be detected in the presence of time‐varying frequencies. Thus, the method's ability to discriminate coupled from uncoupled sources is not impaired when the sources display time‐varying instantaneous frequencies.
Application to Spontaneous MEG Recordings
Recordings and preprocessing
We used data recorded with a 151‐MEG system with axial gradiometers (VSM Medtech‐CTF Systems, Vancouver, Canada). The data were part of a data set from Integrated Cognition Project Grant 051‐04‐010 and was funded by the Netherlands Organization of Scientific Research (NWO), The Hague, and consisted of 2‐min recordings from nine healthy subjects in an eyes‐closed resting condition. Artifacts were removed semiautomatically using independent component analysis [Hyvarinen et al.,2001].
We applied the method to assess frontal‐occipital coupling in both the alpha and beta band. The data were filtered offline in the alpha (7–13 Hz) and beta bands (17–23 Hz) using an eighth‐order zero‐phase Butterworth bandpass filter. After filtering, instantaneous phases were estimated via the discrete Hilbert transformation. The parameter settings for the estimation method were set to B = 16, f = 11, and k = 2.
Extraction of oscillatory activity
For an accurate estimation of the modulation functions, reliable estimates of the instantaneous phases are required. However, instantaneous phases are poorly estimated for low signal strengths [Hurtado et al.,2004]. Moreover, spontaneous MEG oscillations typically occur in bursts. Therefore, in the estimation of the modulation functions, only those instantaneous phases were used for which the amplitude of both signals exceeded some threshold. Given ongoing oscillatory signals x and y, we computed their instantaneous amplitudes a x and a y as the absolute values of their discrete Hilbert transformations and selected the instantaneous phases only at those samples for which both a x and a y exceeded the 2.5‐th percentile of the set of instantaneous amplitudes of x and y, respectively.
Channel selection
Since in the coupled oscillator model [Eqs. (2) and (3)] synchronization is a result of the compromise between slightly different natural frequencies of the oscillators and coupling, we fitted the model to channel pairs with different frequencies. Figure 5 shows the mean instantaneous frequencies over the oscillatory periods in the alpha band, averaged over all subjects. The largest difference in frequency appears to exist in the anterior–posterior direction. This can also be observed for the beta band (Fig. 6). These observations also hold for individual subjects. Therefore, for the analysis, we selected occipital–frontal channel pairs. To minimize volume‐conduction effects, we chose a fixed pair of channels for which the intersensor distance is large (MZF02 and MZO01, which both lie on the lateral axis).
Figure 5.
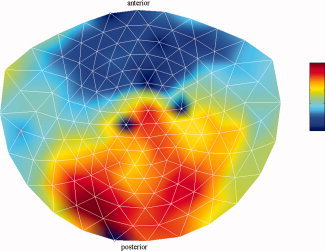
Mean frequencies of spontaneous alpha oscillations. Shown is the mean instantaneous frequency in the alpha band (7–13 Hz) per channel and averaged over the 2‐min recording time and over all subjects. The color bar ranges from 9.2 to 11.0 Hz. The four white dots represent bad channels and were excluded from the analysis. [Color figure can be viewed in the online issue, which is available at wileyonlinelibrary.com.]
Figure 6.
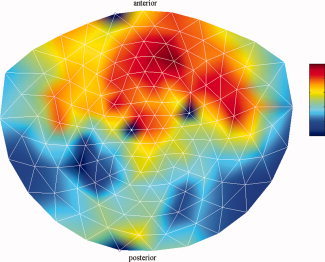
Mean frequencies of spontaneous beta oscillations. Shown is the mean instantaneous frequency in the beta band (17–23 Hz) per channel and averaged over the 2‐min recording time and over all subjects. The color bar ranges from 19.3 to 20.5 Hz. The four white dots represent bad channels and were excluded from the analysis. [Color figure can be viewed in the online issue, which is available at wileyonlinelibrary.com.]
Although the observed differences in the mean instantaneous frequencies are only in the order of tenths of Hertz, they are not an artifact of the frequency extraction method (which depends on the amplitude variations in the signals). We checked this by multiplying the amplitude envelopes of all MEG channels from one of the subjects with an oscillatory signal with a constant frequency of 10 Hz. For each signal, we estimated its mean instantaneous frequency. The estimates centered at 10 Hz with a spread of 10−3 Hz without any spatial bias. Thus, the observed frequency differences are not caused by the extraction method.
Coupling between spontaneous alpha oscillations
Figure 7 shows the estimated modulation functions
 and
and
 in the alpha band (7–13 Hz) for each of the nine subjects. In eight of the nine subjects, the occipital modulation function has a higher mean frequency than the frontal modulation function. In Table I, the estimated coupling strength indices
 and
and
 are listed, together with their p values. In subjects 4–6, occipital–frontal coupling was found with p ≤ 0.05 and in subject four frontal–occipital coupling was found with p ≤ 0.05, yielding subject 4 as the only subject with significant bidirectional coupling. In the latter subject, the coupling direction index
 had a p value of 0.09. Note that the modulation functions corresponding to significant indices have similar shapes. To check consistency, we cut the data into two equal and nonoverlapping parts and estimated the modulation functions on both parts. The resulting modulation functions were—to a good approximation—equal and also highly resembled the modulation functions estimated on the total recording length.
Figure 7.
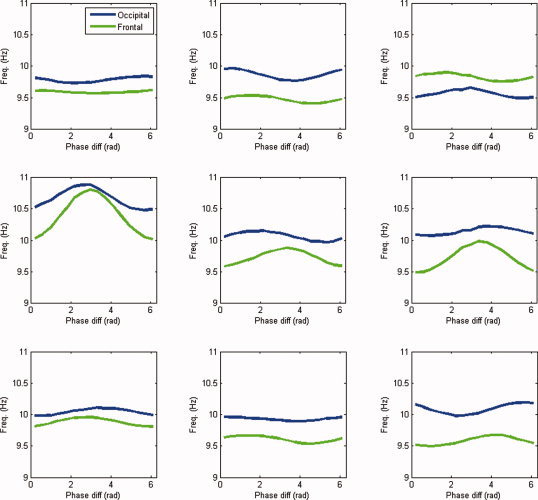
Frequency modulation in the alpha band. Shown are the estimated modulation functions in the alpha band (7–13 Hz) for all nine subjects. Blue lines denote the occipital modulation functions (
 ) and green lines the frontal modulation functions (
 ). [Color figure can be viewed in the online issue, which is available at wileyonlinelibrary.com.]
Table I.
Coupling strengths in the alpha band
| Subject |
 (Hz)
(Hz) |
p value |
 (Hz)
(Hz) |
p value |
|---|---|---|---|---|
| 1 | 0.04 | 0.41 | 0.02 | 0.88 |
| 2 | 0.07 | 0.21 | 0.05 | 0.49 |
| 3 | 0.05 | 0.41 | 0.05 | 0.44 |
| 4 | 0.14 | 0.01* | 0.28 | 0.01* |
| 5 | 0.06 | 0.28 | 0.10 | 0.05* |
| 6 | 0.05 | 0.26 | 0.17 | 0.01* |
| 7 | 0.04 | 0.51 | 0.05 | 0.37 |
| 8 | 0.02 | 0.76 | 0.04 | 0.41 |
| 9 | 0.07 | 0.32 | 0.06 | 0.39 |
The table lists the estimated coupling strength indices
 and
and
 in the alpha band (7–13 Hz) with their corresponding p values for all subjects.
*Denotes p ≤ 0.05.
Figure 8 shows the group average of the observed relative phase distribution and estimated modulation functions. The frontal alpha rhythm, which has a slightly lower frequency than the occipital alpha rhythm, is upmodulated at π. Moreover, the frequency of the occipital rhythm tends to be upmodulated at 0, but this effect is much less pronounced. In sum, the fitted model suggests that phase locking of spontaneous MEG rhythms in the alpha band is a consequence of the upmodulation at π of the frontal rhythm by the occipital rhythm.
Figure 8.
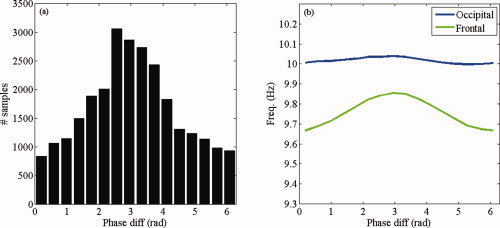
Group‐average results in the alpha band. (a) Observed distribution of phase differences in the alpha band (7–13 Hz) averaged over all subjects. (b) Estimated modulation functions averaged over all subjects. [Color figure can be viewed in the online issue, which is available at wileyonlinelibrary.com.]
The observed phase difference distributions and their reconstructions are shown in Figure 9. Although the reconstructed distributions are a bit flattened when compared with the observed distributions, they capture the shape of the observed distributions including their symmetries. In this sense, the proposed phase‐interaction model accounts for the observed phase difference distributions.
Figure 9.
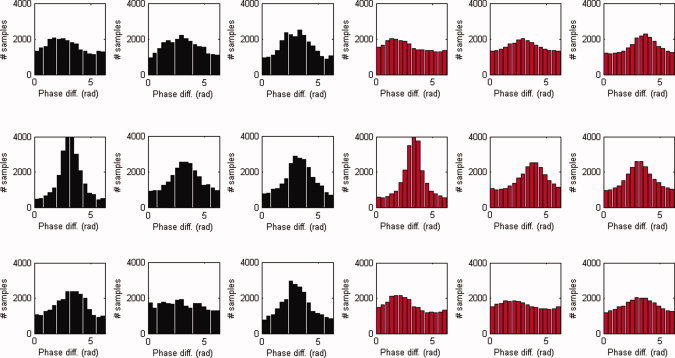
Phase difference distributions in the alpha band. Shown are the observed (black) and reconstructed (red) distributions of phase differences in the α band (7–13 Hz) for all nine subjects. [Color figure can be viewed in the online issue, which is available at wileyonlinelibrary.com.]
Coupling between spontaneous beta oscillations
We repeated the earlier analysis in the beta band (17–23 Hz). Figure 10 shows the estimated modulation functions
 and
and
 for all subjects. In eight of nine subjects, the frontal oscillations have a higher frequency than the occipital oscillations in contrast with alpha band oscillations. In Table II, the computed coupling‐strength indices
 and
and
 are listed, together with their p values. In subjects 4 and 6, occipital–frontal coupling was found with p ≤ 0.05. Although the modulation functions corresponding to significant indices do not have the same shape, their shapes were consistent when estimating them on two nonoverlapping epochs.
Figure 10.
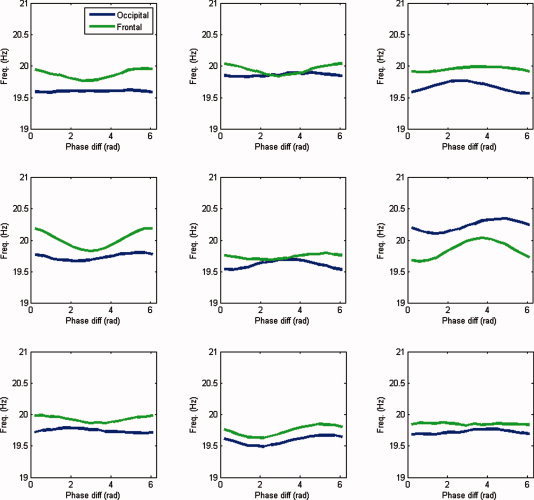
Frequency modulation in the beta band. Shown are the estimated modulation functions in the beta band (17–23 Hz) for all nine subjects. Blue lines denote the occipital modulation functions (
 ) and green lines denote the frontal modulation functions (
 ). [Color figure can be viewed in the online issue, which is available at wileyonlinelibrary.com.]
Table II.
Coupling strengths in the beta band
| Subject |
 (Hz)
(Hz) |
p value |
 (Hz)
(Hz) |
p value |
|---|---|---|---|---|
| 1 | 0.01 | 0.99 | 0.07 | 0.16 |
| 2 | 0.02 | 0.91 | 0.07 | 0.31 |
| 3 | 0.07 | 0.38 | 0.03 | 0.82 |
| 4 | 0.04 | 0.67 | 0.13 | 0.05* |
| 5 | 0.06 | 0.41 | 0.03 | 0.77 |
| 6 | 0.08 | 0.09 | 0.13 | 0.02* |
| 7 | 0.03 | 0.75 | 0.04 | 0.54 |
| 8 | 0.06 | 0.32 | 0.08 | 0.17 |
| 9 | 0.03 | 0.78 | 0.01 | 0.99 |
The table lists the estimated coupling strength indices
 and
and
 in the beta band (17–23 Hz) with their corresponding p values for all subjects.
*Denotes p ≤ 0.05.
The group average is shown in Figure 11. Both the frontal and occipital modulation functions are asymmetric around π and have a sinusoidal shape. Even though both modulation functions are asymmetric around π, the phase difference clusters around π. Furthermore, the frontal oscillations are stronger modulated than the occipital oscillations. Thus, the model suggests that phase locking between spontaneous occipital and frontal beta oscillations is a result of a mutual asymmetrical modulation of their instantaneous frequencies by their instantaneous phase difference. Moreover, the relative shapes of the modulation functions force the oscillations to be in antiphase, which is reflected in the location of the peak in the distribution of phase differences.
Figure 11.
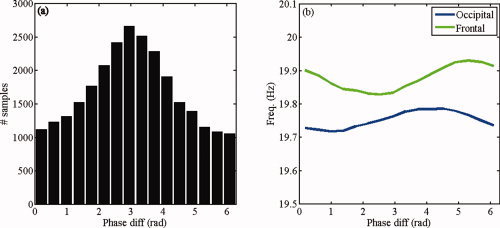
Group average results in the beta band. (a) Observed distribution of phase differences in the beta band (17–23 Hz) averaged over all subjects. (b) Estimated modulation functions averaged over all subjects. [Color figure can be viewed in the online issue, which is available at wileyonlinelibrary.com.]
Figure 12 shows the observed and reconstructed distributions of phase differences for all subjects. The resemblance between the reconstructed and observed distributions is comparable to the resemblance in the alpha band analysis. In subject 2, the estimated modulation functions touch each other, yielding a stable fixed point in the estimated model [Eqs. (5) and (6)]. Consequently, the dynamics of the estimated model is not intermittent, but the signals are fully phase locked, resulting in an extremely peaked reconstructed distribution.
Figure 12.
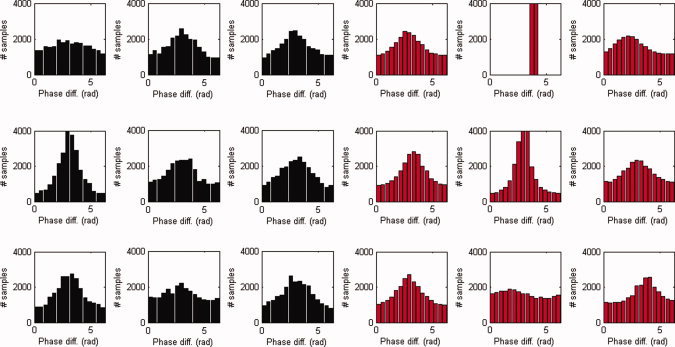
Phase difference distributions in the beta band. Shown are the observed (black) and reconstructed (red) distributions of phase differences in the beta band (17–23 Hz) for all nine subjects. [Color figure can be viewed in the online issue, which is available at wileyonlinelibrary.com.]
Dynamical interpretation
While on the basis of the observed phase difference distributions (Figs. 8a and 11a), it is impossible to distinguish between the phase‐interaction dynamics in alpha and beta bands, the estimated modulation functions suggest that, in the alpha and beta bands, the observed phase locking is caused by qualitatively different dynamical mechanisms (Figs. 8b and 11b). The fitted models suggest that in the alpha band, phase locking between frontal and occipital oscillations is caused by an acceleration of the slower frontal rhythm. This acceleration is modulated by the phase difference between the rhythms and is strongest when the rhythms are in antiphase. The consequence of this dynamical process is a clustering of phases at π, which is reflected in the peak in the distribution of phase differences. In contrast, the fitted models suggest that, in the beta band, phase locking is caused by an acceleration of the slower occipital rhythm and a simultaneous deceleration of the faster frontal rhythm. While the occipital rhythm is accelerated strongest when the phase difference is smaller than π, the frontal deceleration is strongest when the phase difference is larger than π. The interplay between these influences results in phase clustering at π, which is again reflected in the peak in the distribution of phase differences. Thus, while the distributions of phase differences in the alpha and beta bands are similar, the underlying dynamical processes are different, as revealed by the estimated phase‐interaction model.
DISCUSSION
In this study, we modeled the phase interaction between bivariate ongoing MEG oscillations by assuming that they can be described by weakly coupled self‐sustained oscillators. We proposed a method to fit the model to data and defined indices for measuring the strength and direction in coupling. Furthermore, using simulated data, we tested the method's performance, described the effect of volume conduction on the fitted model, and showed that the model is robust against model violations. We fitted the model to spontaneous (eyes‐closed resting state) occipital–frontal MEG oscillations, recorded from nine healthy subjects in the alpha (7–13 Hz) and beta bands (17–23 Hz). The model can reconstruct the observed phase difference distributions between occipital and frontal oscillations reasonably well, and hence, can account for observed values of phase synchronization indices derived from this distribution. Moreover, it suggests that, in the alpha and beta bands, phase locking is a result of qualitatively different coupling mechanisms. In contrast to the commonly used interaction indices, the model‐based approach followed in this study does not merely quantify the interaction strength but also characterizes how the instantaneous phases influence the frequencies of the recorded rhythms. Statistical testing confirmed the existence of coupling in three of nine subjects. This suggests that the phase dynamics following a coupled oscillator model correspond to a specific type of interaction that is not always present. When it is present, we found that it is consistent in form over different epochs.
The computed occipital–frontal coupling indices in the alpha band tend to be higher than the frontal–occipital coupling indices (Table I). These findings suggest that the occipital rhythm drives the frontal rhythm stronger than vice versa. This seems to be in contradiction with the results reported in Nolte et al. [2008]. In that study, a directionality index was applied to spontaneous (eyes‐closed resting state) EEG data of 88 subjects using all EEG sensors, and the results suggested for the alpha band a stronger coupling in the front‐to‐back direction than vice versa. The direction of coupling was based on an average over all channel pairs. Although a large number of subjects was studied in Nolte et al. [2008], substantial intersubject variability was found. Therefore, the results of the present study, using a smaller number of subjects, do not necessarily contradict the earlier findings. An important difference between the methods is that the coupling measure and directionality index used in Nolte et al. [2008] is insensitive to volume conduction. In our study, we mostly found symmetric modulation functions in the alpha band (see Fig. 7), which may be partly due to volume conduction. Following the idea used in Nolte et al. [2008], initially introduced in Nolte et al. [2004] and varied upon in Stam et al. [2007], the method presented in the current study can be extended by deriving coupling indices from the asymmetric part of the estimated modulation functions. Such indices will be insensitive to volume conduction, which only affects the symmetric part of the modulation functions. Another possible approach to the volume conduction problem is to attempt to unmix the source signals by applying an appropriate transformation to the sensor signals [Meinecke et al.,2005].
As described in the “Synchronization Behavior” section, weakly coupled oscillators can display intermittent dynamics, where episodes of (almost) phase locking are interwoven by periods called phase slips, where the phase of one of the oscillators advances relative to the other. Intermittent phenomena are observed in a number of other studies and a conceptual framework is provided in Friston [2000]. In Freeman and Rogers [2002], phase slips in gamma‐band EEG oscillations in rabbit sensory cortices were observed and interpreted as state transitions, which are assumed to play a role in converting sensory input to conceptual output. In Freeman et al. [2003], related findings are described in human EEG experiments. In Breakspear [2002], transient phase desynchronization was proposed to play a role in the generation of human alpha oscillations. In Breakspear [2004] and Ito et al. [2007], the spatial structure of instantaneous phase patterns was investigated in human EEG studies and was suggested to play a role in perception and cognition. In Thatcher et al. [2008], a human EEG study was performed, where it was found that the duration of phase resettings positively correlates with IQ.
In this study, we tested for significance of the coupling strength indices using surrogate data [Pereda et al.,2005). The idea is to generate signals that are identical to the recorded signals, except that they are uncoupled, i.e., have constant modulation functions. Besides the method described in this study, we also investigated an alternative randomization procedure, namely randomizing the instantaneous frequencies of the recorded signals [Hurtado et al.,2004]. Although this produced signals with constant modulation functions, it detected significant coupling between two independent and bandpass‐filtered Gaussian noise processes, which is clearly undesirable. The cause for this deficit is that randomizing the instantaneous frequencies of a signal can only be performed after the signals have been bandpass filtered. To avoid the detection of spurious coupling due to bandpass filtering, a randomization procedure should be applied to the raw broadband signals. The difficulty now exists in the fact that instantaneous phases and, hence, frequencies cannot be defined for broadband signals. Since phase randomization by means of the Fourier transformation destroys the nonlinear relationship between the phases of both signals, and since, coupling through modulation function is a special kind of nonlinear relationship between the phases of both signals, we used this to generate surrogate signals. We note, however, that an optimal randomization procedure does not exist and that this applies to every synchronization index [Schreiber and Schmitz,2000].
Although the phase‐interaction model proposed in this study provides a dynamical account for observed phase locking between ongoing occipital and frontal MEG oscillations in the alpha and beta bands, most likely, it is a simplification of the actual dynamics of the ongoing alpha and beta rhythms. For example, the model ignores other sources of influence such as common driving signals (see [Perkel et al.,1967] for common‐driving signals in spike trans), the existence of time delays in coupling, the effects of amplitude dynamics, and dynamical noise. Incorporating these aspects in the model will be the objective of future studies.
APPENDIX A: REDUCTION OF THE GENERAL PHASE MODEL
In the literature, more general phase interaction models have been proposed (Rosenblum et al., 2006). Again, let φx and φy be the instantaneous phases of two weakly coupled oscillators x and y. Then in general, the phase interactions can be described by the following equations:
| (A1) |
| (A2) |
where M x and M y are 2π‐periodic in both arguments. These models have been proposed in the general context of weakly coupled oscillators. For ongoing MEG oscillations, we can, without compromising the data, reduce this model to the more restricted model described in this study [Eqs. (2) and (3)]. The reduction is based on the following empirical findings regarding the dynamics of spontaneous MEG oscillations.
First, the distribution of (φx, φy) is to a reasonable approximation a function of the phase difference ψ = φx − φy, as illustrated in Figure A1a. This observation is consistent over all nine subjects and, hence, makes it reasonable to model the phase interaction by a one‐dimensional modulation function, that is, to let M x and M y only depend on the instantaneous phase difference between x and y. Thus, we can replace the model described Eqs. (A1) and (A2) by
| (A3) |
| (A4) |
Figure A1.

Observed characteristics of spontaneous MEG oscillations. (a) Histogram in color of the occipital–frontal phases (φ0,φF). (b) Histogram of the pair (φ0,ψ). (c) Estimates of  and f
F + N
F. (a–c) were computed for a single subject in the alpha band (7–13 Hz). The observed features are however, constant over subjects and frequency bands. [Color figure can be viewed in the online issue, which is available at wileyonlinelibrary.com.]
By an averaging argument, one can also theoretically show that when the natural frequencies of the coupled oscillators are close, then their modulation functions depend only on their phase difference (Pikovski et al., 2001).
If one would still wish to account for nonlinearities in the model, 2π‐periodic modulation functions N x and N y with mean zero could be included, leading to the following equations:
| (A5) |
| (A6) |
Since φx and φy are distributed independently of their phase difference ψ, as illustrated in Figure A1b, information on the value of φx (or φy) does not disclose the value of ψ and vice versa. Again, this finding is consistent over subjects. Theoretically, this can be explained by the fact that when the natural frequencies of two coupled oscillators are close, the dynamics of both oscillators are much faster than the dynamics of their phase difference (Pikovski et al., 2001). This allows to estimate N x and M x (and N y and M y) independent from each other.
The functions N x and N y however, turn out to be more or less constant (zero), at least when compared to M x and M y as illustrated in Figure A1c. Again, this observation is consistent over subjects and reflects the fact that the instantaneous frequencies of MEG oscillations are not modulated by their own instantaneous phases. This observation allows us to discard N x and N y and reduces the model described by Eqs. (A1) and (A2) to the specific phase model given by Eqs. (A3) and (A4).
APPENDIX B: COMPARISON OF ESTIMATION METHODS
In the literature, other methods have been proposed to estimate the modulation functions from data. The method described in Rosenblum et al. (2006) parameterizes the modulation functions M x and M y by a finite Fourier series (remember that M x and M y are 2π‐periodic in ψ):
| (B1) |
where αk and βk (j = 0,…, p) are the Fourier coefficients and p is the model order. The Fourier coefficients are estimated from the pairs of observations
 ,
,
 via least‐squares regression. We compared the performance of this parametric method to the nonparametric method described in this study, which we refer to as conditional averaging (because the modulation functions are estimated by averaging the instantaneous frequencies of the signals conditional on their phase difference).
We first compare the performance of both methods as a function of noise intensity. We simulated the system described by Eqs. (11) and (12) for 10 s (again, using an integration interval of 0.005 s) with f x = 10 Hz, f y = 9 Hz, c x = 0.2, and c y = 0. For these choices, the oscillators are in the intermittent regime. For the conditional averaging method, we fixed the settings B = 16, f = 11, and k = 2, and for the Fourier method, we fixed p = 1. We let the noise intensity vary from 0 to 1 in steps of 0.05, and for every value, we simulate the system 1,000 times with random initial conditions. The performance of both methods to estimate M x is quantified by the SSEs taken over the B points at which M x is estimated. The results of the simulation are summarized in Figure B1. As the figure shows, the performance of both methods gradually decreases with increasing noise strength. Furthermore, the Fourier approximation method performs better in reducing noise.
Figure B1.
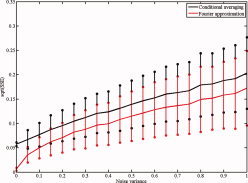
Performance as a function of noise intensity. Shown are the square root of the sum of squared errors (SSE) as a function of noise variance for both methods. The black and red curves denote the square root of the sum of squared errors (SSE). The vertical bars with circles denote one standard deviation (based on 1,000 simulations). [Color figure can be viewed in the online issue, which is available at wileyonlinelibrary.com.]
We compared the robustness of both methods against changes in the settings of the method. As modulation functions, we chose M x(ψ) = 10 − 0.2 sin(4ψ) and M y constant (9 Hz), and we set the noise intensity to zero. Both methods were applied for multiple settings of their parameters. For the conditional averaging method, we performed three simulations, where in each simulation two parameters were held constant and the third parameter was varied. We chose the following values: (i) B = 32, k = 3, f = 5, 9, 13, 17, 21, (ii) B = 32, f = 5, k = 4, 3, 2, 1, 0, and (iii) f = 5, k = 3, B = 32, 25, 18, 11, 4. For the Fourier approximation method, we chose p = 4, 3, 2, 1, 0. For every choice of values for (B, k, f), we estimated M x. The results of the simulations are illustrated in Figure B2. As Figure B2a shows, the Fourier approximation method is very sensitive to the choice of the model order; when the true order is higher than the estimation order the estimate distorts the shape of the modulation function. As Figure B2b–d shows, the conditional averaging method is more robust against parameter changes; although the amplitude of M x is underestimated, the shape remains undistorted.
Figure B2.
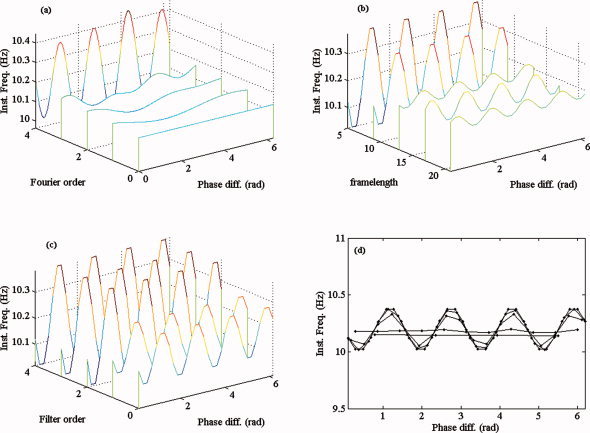
Stability against parameter changes. (a) Estimates of M x via Fourier approximation for Fourier orders 4, 3, 2, 1, 0. (b–d) Estimates of M x via conditional averaging where in each case one of the parameters was varied: In (b), the frame length f, in (c) the filter order k, and in (d) the number of bins B. [Color figure can be viewed in the online issue, which is available at wileyonlinelibrary.com.]
APPENDIX C: UNCOUPLED BUT MIXED SOURCES YIELD SYMMETRICAL MODULATION FUNCTIONS
Let s 1(t) = cos(ω1 t + φ0,1) and s 2(t) = cos(ω2 t + φ0,2) be source signals with initial phases φ0,1 and φ0,2 respectively, and with ω1 ≠ ω2. Furthermore, let m 1(t) and m 2(t) be the signals recorded at sensors 1 and 2, respectively, thus
| (C1) |
for certain mixing coefficients α1,1, α1,2, α2,1, α2,2 ≥ 0. We assume that α1,1 ≥ α1,2 and α2,1 ≤ α1,2 reflecting that s 1 is recorded at sensor 1 stronger than s 2 is and that s 2 is recorded stronger at sensor 2 than s 1 is. The analytic signals of m 1 and m 2 are given by (see Mallat, 1998, p. 85)
| (C2) |
The instantaneous phases φ1(t) and φ2(t) of m 1 and m 2 are defined by φj(t) = arg m (t). Let ψ(t) = φ1(t) − φ2(t) (mod2π) denote the relative phase between m 1 and m 2. We will argue that there exist real‐valued functions
which are symmetrical, that is, they satisfy M 1(2π − ψ) = M 1(ψ) and M 2(2π − ψ) = M 2(ψ) for all ψ ∈ [0, 2π], and such that
| (C3) |
It suffices to prove the existence of M 1; the existence of M 2 follows by symmetry.
By straightforward algebra, we can write
for Δω = ω1 − ω2 the frequency mismatch between s 1 and s 2, Δφ = φ0,1 − φ0,2 the initial phase difference, and the function h : C/{−d} → C, defined by
| (C4) |
where C denote the complex numbers, c = α1,1/α1,2, d = α2,1/α2,2, and * denotes complex conjugation. Similarly, the function φ1(t) can be written in the form


Using the facts that c > 1 and d < 1, we show below that the function h induces an orientation‐preserving diffeomorphism between the unit circle S
1 ⊆ C and a closed curve h(S
1) ⊆ C that encloses the origin and has the property that h(e
i(2π−t)) = h*(e
it) for t ∈ [0,2π]. It follows that the map γ : [0,2π] → [0,2π] defined by γ(t) = arg h(e
it) is a diffeomorphism satisfying γ(2π − t) = 2π − γ(t). Hence, the derivative of any smooth map μ : [0,2π] → R can be written in the form μ′(t) = M(γ(t)), for the function
 . If μ′ is symmetrical about π, then it can be checked that the map M is symmetrical about π as well. One function with these properties is given by μ(t) = arg(c + e
−it). Now φ1(t) = ω1
t + φ0,1 + μ(Δωt + Δφ) and hence,
which proves the assertion with M 1 = ω1 + ΔωM
It remains to establish the asserted properties of the map h. When z runs counterclockwise along the unit circle with constant angular velocity (z = e
it for t increasing from 0 to 2π), then d + z* runs through a unit circle around d clockwise. Since d < 1 this circle contains the origin. Because arg(z
−1) = −arg(z) and |z
−1| = 1/|z|, the inverse 1/(d + z*) traces out a closed curve counterclockwise, which also contains the origin in its interior. This curve crosses the positive real axis at time t = 0 at the point 1/(d + 1) > 0 and crosses the negative real axis at t = π at 1/(d − 1) < 0. Multiplication by c − d > 0 changes the size of the curve, and adding 1 moves it one unit to the right. Because (c − d)/(d − 1) < 1 the resulting curve
 is a closed curve that circles the origin counterclockwise. The identity h(e
i(2π−t)) = h*(e
it) follows from the algebraic definition of h or from the preceding geometric description.
REFERENCES
- Breakspear M ( 2002): Nonlinear phase desynchronization in human electroencephalographic data. Hum Brain Mapp 15: 175–198. [DOI] [PMC free article] [PubMed] [Google Scholar]
- Breakspear M ( 2004): A novel method for the topographic analysis of neural activity reveals formation and dissolution of dynamic cell assemblies. J Comput Neurosci 16: 49–68. [DOI] [PubMed] [Google Scholar]
- Buzsaki G ( 2006): Rhythms of the Brain. Oxford University Press: New York. [Google Scholar]
- Deco G, Jirsa VK, Robinson PA, Breakspear M, Friston K ( 2008): The dynamic brain: From spiking neurons to neural masses and cortical fields. PLoS Comput Biol 4(8): e1000092. doi:10.1371/journal.pcbi.1000092. [DOI] [PMC free article] [PubMed] [Google Scholar]
- Freeman WJ, Rogers LJ ( 2002): Fine temporal resolution of analytic phase reveals episodic synchronization by state transitions in gamma EEGs. J Neurophysiol 87: 937–945. [DOI] [PubMed] [Google Scholar]
- Freeman WJ, Burke BC, Holmes MD ( 2003): Aperiodic phase resetting in scalp EEG of beta‐gamma oscillations by state transitions at alpha‐theta rates. Hum Brain Mapp 19: 248–272. [DOI] [PMC free article] [PubMed] [Google Scholar]
- Friston KJ ( 2000): The labile brain. 1. Neuronal transients and nonlinear coupling. Philos Trans R Soc Lond Biol Sci 355: 215–236. [DOI] [PMC free article] [PubMed] [Google Scholar]
- Hurtado JM, Rubchinsky LL, Sigvardt KA ( 2004): Statistical method for detection of phase‐locking episodes in neural oscillations. J Neurophysiol 91: 1883–1898. [DOI] [PubMed] [Google Scholar]
- Hyvarinen A, Karhunen J, Oja E ( 2001): Independent Component Analysis. New York: Wiley. [Google Scholar]
- Ito J, Nikolaev AR, van Leeuwen C ( 2007): Dynamics of spontaneous transitions between global brain states. Hum Brain Mapp 28: 904–913. [DOI] [PMC free article] [PubMed] [Google Scholar]
- Lachaux JP, Rodriguez E, Martinerie J, Varela FJ ( 1999): Measuring phase synchrony in brain signals. Hum Brain Mapp 8: 194–208. [DOI] [PMC free article] [PubMed] [Google Scholar]
- Le Van Quyen M, Bragin A ( 2007): Analysis of dynamic brain oscillations: Methodological advances. Trends in Neurosci 30: 365–373. [DOI] [PubMed] [Google Scholar]
- Mallat S ( 1998): A Wavelet Tour of Signal Processing. Academic Press. [Google Scholar]
- Meinecke FC, Ziehe A, Kurths J, Muller KR ( 2005): Measuring phase synchronization of superimposed signals. Phys Rev Lett 94: 084102. [DOI] [PubMed] [Google Scholar]
- Nolte G, Bai O, Wheaton L, Mari Z, Vorbach S, Hallett M ( 2004): Identifying true brain interaction from EEG data using the imaginary part of coherency. Clin Neurophys 115: 2292–2307. [DOI] [PubMed] [Google Scholar]
- Nolte G, Ziehe A, Nikulin VV, Schlogl A, Kramer N, Brismar T, Muller KR ( 2008): Robustly estimating the flow direction of information in complex physical systems. Phys Rev Lett 100: 234101. [DOI] [PubMed] [Google Scholar]
- Pereda E, Quiroga RQ, Bhattacharya J ( 2005): Nonlinear multivariate analysis of neurophyiological signals. Prog Neurobiol 77: 1–37. [DOI] [PubMed] [Google Scholar]
- Perkel DH, Gerstein GL, Moore GP ( 1967): Neuronal spike trains and stochastic point processes. Biophys J 7: 391–418. [DOI] [PMC free article] [PubMed] [Google Scholar]
- Pikovski A, Rosenblum M, Kurths J ( 2001): Synchronization: A Universal Concept in Nonlinear Sciences (Cambridge Nonlinear Science Series 12). Cambridge: Cambridge University Press. [Google Scholar]
- Rosenblum MG, Pikovski AS ( 2001): Detecting direction of coupling in interacting oscillators. Phys Rev E 64: 045202(R). [DOI] [PubMed] [Google Scholar]
- Rosenblum MG, Cimponeriu L, Bezerianos A, Patzak A, Mrowka R ( 2002): Identification of coupling direction: Application to cardiorespiratory interaction. Phys Rev E 65: 041909. [DOI] [PubMed] [Google Scholar]
- Rosenblum M, Cimponeriu L, Pikovski A ( 2006): Coupled oscillators approach in analysis of bivariate data In: Schelter, B, Winterhalder M, Timmer J, editors. Handbook of Time Series Analysis. Weinheim, Germany: Wiley‐VCH; pp 159–180. [Google Scholar]
- Savitsky A, Golay MJE ( 1964): Smoothing and differentiation of data by simplified least squared procedures. Anal Chem 36: 1627–1639. [DOI] [PubMed] [Google Scholar]
- Schreiber T, Schmitz A ( 2000): Surrogate time series. Phys D 142: 346–382. [Google Scholar]
- Stam CJ, Nolte G, Daffertshofer A ( 2007): Phase lag index: Assessment of functional connectivity from multi channel EEG and MEG with diminished bias from common sources. Hum Brain Mapp 28: 1178–1193. [DOI] [PMC free article] [PubMed] [Google Scholar]
- Tass P, Rosenblum MG, Weule J, Kurths J, Pikovski A, Volkmann J, Schnitzler A, Freund HJ ( 1998): Detection of n:m phase locking from noisy data: Application to magnetoencephalography. Phys Rev Lett 81 (15)/3191(4). [Google Scholar]
- Thatcher RW, North DM, Biver CJ ( 2008): Intelligence and EEG phase reset: A two compartment model of phase shift and lock. Neuroimage 42: 1639–1953. [DOI] [PubMed] [Google Scholar]


