

Abstract
In this communication, we extended a previously described and validated diffusion tensor imaging (DTI) method for segmenting whole brain cerebrospinal fluid (CSF) and gray and white matter (WM) tissue to provide regional volume and DTI metrics of WM tract and cortical and subcortical gray matter. This DTI‐based regional segmentation was implemented using the statistical parametric mapping (SPM) toolbox and used the international consortium for brain mapping atlases and Montreal Neurological Institute brain templates. We used our DTI‐based segmentation approach to calculate the left putamen volume in a cohort of 136 healthy right‐handed males and females aged 15.8–62.8 years. We validated our approach by demonstrating its sensitivity to age‐related changes of the putamen. Indeed, our method found that the putamen volume decreased with age (r = −0.30; P < 0.001) while the corresponding fractional anisotropy (FA) increased with advancing age (r = 0.5; P < 0.00001). It is then demonstrated, on a subset of our cohort (n = 31), that the putamen volume obtained by our method correlated with measurements obtained from FreeSurfer (r = 0.396, P < 0.05). Our novel approach increases the information obtained with a DTI examination by providing routine volumetry measure, thereby eliminating separate scans to obtain volumetry data. In addition, the labeled volumes obtained with our method have the potential to increase the accuracy of fiber tracking. In the future, this new approach can be automated to analyze large data sets to help discover noninvasive neuroimaging markers for clinical trials and brain‐function studies in both health and disease. Hum Brain Mapp, 2010. © 2010 Wiley‐Liss, Inc.
Keywords: DTI, segmentation, Icosa21, ICBM, MNI, FreeSurfer, atlas, basal ganglia, putamen, lifespan
INTRODUCTION
Magnetic resonance imaging (MRI) methods provide several tissue contrast mechanisms that can be used to assess the micro‐ and macrostructure of living tissue in health and disease. There are several applications that can benefit from the availability of robust methods for estimating cortical and subcortical gray matter (GM) volume and their corresponding quantitative relaxation or diffusion tensor metrics [Fjell et al., 2008; Hasan et al., 2009; Lawes et al., 2008; Mabbott et al., 2006; Makris et al., 2007; Wakana et al., 2004]. In general, current MRI methods for tissue volume assessment use high‐spatial resolution T1‐weighted, or multimodal T2‐weighted, fluid‐attenuated, and proton density volumes for regional tissue segmentation. Tissue segmentation using T1‐ or T2‐weighted volumes require image intensity correction [Ahsan et al., 2007], whereas multimodal MRI methods require coalignment of all data sets before segmentation [Ali et al., 2005; Hasan et al., 2008a; Liu et al., 2006; Pham et al., 2000]. To obtain intrinsic tissue relaxation or diffusion tensor imaging (DTI) metrics from certain manually or automatically segmented regions, the acquisition of separate data sets is needed along with perfect multimodal data coregistration and fusion with the T1‐weighted volume [Mabbott et al., 2006; Thottakara et al., 2006].
In a previous publication, we presented and validated a DTI‐based tissue contrast method that was used to obtain whole brain cerebrospinal fluid (CSF), GM, and white matter (WM) volumes from typically developing children [Hasan et al., 2007a]. This DTI‐based method was applied to obtain well‐documented developing and aging trends of whole brain CSF, GM, and WM across the human lifespan [Hasan et al., 2007b]. These DTI‐based segmentation methods were validated and extended further to the semiautomated segmentation of WM regions such as the corpus callosum [Hasan et al., 2008b, c].
In this work, we extended the whole brain DTI segmentation approach to provide regional volumetry of cortical and subcortical structures using the DTI data in combination with commonly used human brain templates and anatomically labeled atlases. For validation, we have applied our methods on a large healthy cohort of right‐handed adolescents and adults to demonstrate this method's sensitivity to well‐documented age and gender effects of the left putamen nucleus, which has been used as a marker of deep subcortical GM atrophy in both health [Giedd et al., 1996, Greenberg et al., 2006; Vernaleken, 2007; see Table I] and disease [Bramilla et al., 2001; de Jong et al., 2008; Jacobsen et al., 2001; Keshavan et al., 1998; Rosas et al., 2001; Teicher et al., 2000]. We have also compared our results on the left putamen with the segmentation results using FreeSurfer and published trends.
Table I.
A summary of published normative putamen right, left volume in milliliters and computed asymmetry index of the putamen volume using several manual and automated methods along with the control population demographics
| Author and year | N(H/S) controls | Age (years) | Delineation methods | Right PUT Vol (mL) | Left PUT Vol (mL) | AI | Age r(p) |
|---|---|---|---|---|---|---|---|
| Ahsan et al., 2007 | 30 (15M; 25Rh) | 31 (median) 20–54 | Rater no. 1 | 4.54 ± 0.63 | 4.61 ± 0.63 | −1.5 | |
| Rater no. 2 | 4.34 ± 0.61 | 4.26 ± 0.50 | 1.9 | ||||
| Automatic | 6.72 ± 0.64 | 7.03 ± 0.70 | −4.5 | ||||
| Anastasi et al., 2006 | 35 Rh (21M) | 34 (mean) 22–43 | Automatic (NURBS) | 3.43 ± 0.14 | 3.37 ± 0.19 | 3.4 | |
| Brambilla et al., 2001 | 22 (14M) | 38 ± 10 | Manual | 2.43 ± 0.93 | 3.18 ± 0.92 | −26.7 | −0.33 (0.14) |
| de Jong et al., 2008 | 35 (M) | 65 ± 13 | FSL‐FIRST (SIENAX) | 6.47 ± 0.86 | 5.90 ± 0.77 | 12.3 | |
| 35 (F) | 67 ± 12 | 5.56 ± 0.75 | 5.24 ± 0.61 | 5.9 | |||
| Greenberg et al., 2006 | 138 (38M) | 71 ± 6 | Automatic GRID | 3.58 ± 0.67 | 3.56 ± 0.62 | 0.6 | −0.22 |
| 60–85 | 0.32 ± 0.06 | 0.32 ± 0.06 | −0.37 | ||||
| Gunning‐Dixon et al., 1998 | 148 (Rh) | 46.5 ± 17.2 | Manual | 4.36 ± 0.61 | 4.02 ± 0.60 | 8.1 | −0.41 |
| 82 (W) | 47.4 ± 18.1(W) | 4.19 ± 0.53(W) | 3.88 ± 0.54 (W) | 7.7 | −0.43 | ||
| 66 (M) | 45.7 ± 16.5(M) | 4.56 ± 0.64(M) | 4.18 ± 0.62 (M) | 8.7 | −0.43 | ||
| 18–77 | |||||||
| Jacobsen et al., 2001 | 20 (9M) | 35.0 ± 6.8 | ANALYZE | 4.0 | 3.7 | 9.0 | −0.40 |
| 22–48 | 0.291 ± 0.034 | 0.266 ± 0.030 | |||||
| Jovicich et al., 2009 | 15 | 69.5 ± 4.8 | FreeSurfer | 4.35 ± 0.70 | 4.65 ± 0.85 | −6.6 | |
| 4 | 34 ± 3 | 5.64 ± 0.89 | 5.88 ± 0.83 | −4.2 | |||
| Keshavan et al., 1998 | 17 (12M) | 22.9 ± 5.1 | Manual | 2.91 ± 0.89 | 2.37 ± 1.13 | 20.5 | |
| Mcdonald et al., 2008 | 21 (10M) | 33.0 ± 10.2 | FreeSurfer ICV‐cov | 5.07 ± 0.11 | 5.26 ± 0.11 | −3.7 | |
| Peran et al., 2009 | 30 (16M) | 29.3 ± 5.7 | FSL‐FIRST | 6.66 ± 0.61 | 6.47 ± 0.73 | 2.9 | −0.43 |
| 20–41 | −0.43 | ||||||
| Rosas et al., 2001 | 24 (12M) | 41.2 ± 9.8 | Automatic | 4.5 ± 0.7 | 4.7 ± 0.7 | −4.3 | −0.36 |
| 29–62 | |||||||
| Shattuck et al., 2008 | 40 (20F) | 29.2 ± 6.3 | Manual | 4.22 ± 0.49 | 4.25 ± 0.52 | −0.7 | |
| 19.3–39.5 | LPBA40/AIR | 5.13 ± 0.61 | 5.17 ± 0.73 | −0.8 | |||
| FLIRT | 5.83 ± 0.63 | 5.87 ± 0.69 | −0.7 | ||||
| SPM5 | 5.77 ± 0.62 | 5.69 ± 0.68 | 1.4 | ||||
| Vernaleken et al., 2007 | 18 (M) | 35.6 ± 10.4 | Manual | 4.85 ± 0.56 | 4.64 ± 0.86 | 4.4 | −0.61 |
| Rh | 24–60 | −0.43 |
The putamen volume vs. age correlation coefficient was listed whenever provided in the original papers.
Notes:
1. Papers are alphabetized by leading author last name and year. Tabulated putamen volume (PUTV) values are mean ± standard deviation. The values are taken from healthy controls.
2. Putamen volume asymmetry index, AI = 2*(RPUTV − LPUTV)/(LPUTV + LPUTV) × 100%, where RPUTV, right putamen volume in mL; LPUTV, left putamen volume in mL; Rh, right handed; M, males; F, females.
3. The age correlation (p) is the Pearson's correlation coefficient, which corresponds to the linear model: y = a + β * x, where x is age in years and y may correspond to the absolute, covaried or ICV‐normalized putamen right or left volume. Note that the slope of regression or atrophy annual rate is related to the Pearson linear correlation coefficient by the relation: β = r*s(y)/s(x).
4. Underlined values are putamen volumes to ICV percentage (e.g., covaried with ICV).
5. Tabulated putamen volume versus age correlations are all significant (P < 0.01).
MATERIALS AND METHODS
Subjects
The participants included 136 right‐handed healthy adolescents, young and older adults aged 15.8–62.8 years. The healthy volunteer cohort was pooled from two ongoing studies. The cohort consisted of 65 males (age mean ± SD = 31.2 ± 11.5 years) and 71 females (age mean ± S.D = 34.8 ± 11.7 years). All volunteers were identified as neurologically normal by review of medical history and were medically stable at the time of the assessments. Written informed consent was obtained from the guardians and adolescents and assent from the children participating in these studies per the University of Texas Health Science Center at Houston institutional review board regulations for the protection of human research subjects.
Conventional MRI Data Acquisition
We acquired whole‐brain data using a Philips 3.0 T Intera system with a SENSE parallel imaging receive head coil. The conventional MRI data acquisition protocol included a 2D dual spin‐echo T E1/T E2/T R = 10/90/5,000 ms, in the axial plane (3‐mm slice thickness, square field‐of‐view = 240 mm × 240 mm @ 44 sections) and a high‐spatial resolution spoiled gradient echo sequence acquired using ∼180 sagittal sections covering the whole brain with isotropic voxel dimensions 0.9375 mm × 0.9375 mm × 0.9375 mm (e.g., field‐of‐view 240 mm × 240 mm and image matrix = 256 × 256).
Diffusion Tensor Acquisition
The diffusion‐weighted data were acquired using a single‐shot spin echo diffusion sensitized echo‐planar imaging (EPI) sequence with the balanced Icosa21 encoding scheme (Hasan and Narayana, 2003), a diffusion sensitization of b = 1,000 s mm−2, and a repetition and echo times of T R = 6.1 s and T E = 84 ms, respectively. EPI image distortion artifacts were reduced by using a SENSE acceleration factor or k‐space undersampling of two. The slice thickness was 3 mm with 44 axial slices covering the whole‐brain (foramen magnum to vertex), a square field‐of‐view = 240 mm × 240 mm, and an image matrix of 256 × 256 that matched the 2D dual spin echo sequence described earlier. The number of nondiffusion weighted or b ∼ 0 magnitude image averages was eight. Each encoding was repeated twice and magnitude‐averaged to enhance the signal‐to‐noise ratio (SNR); thus, effectively 50 images were acquired for each of the 44 axial sections to cover the whole‐brain. The total DTI acquisition time was ∼7 min and resulted in SNR‐independent DTI‐metric estimation [Hasan et al., 2007a]
Conventional MRI Data Processing and Tissue Segmentation
The whole‐brain cMRI data were converted into ANALYZE formatted volumes, resliced to isotropic voxels (Ahsan et al., 2007), and skull stripped using the brain extraction tool (BET) of the MRIcro software package (http://www.sph.sc.edu/comd/rorden/mricro.html).
DTI Data Processing
Although the DTI raw images were acquired with fat suppression, all image volumes were semiautomatically stripped to remove nonparenchymal tissue. Diffusion‐weighted data were distortion‐corrected using the mutual information maximization approach [Netsch and Van Muisvinkel, 2004]. After image distortion correction, the nondiffusion volume was masked using the BET. All b0 and diffusion‐weighted data were resliced to attain isotropic voxels (Hasan et al., 2008c). The diffusion‐weighted data were decoded, and the diffusion tensor volumes were diagnolized for subsequent quantitative steps. The details of the DTI processing are provided elsewhere [Hasan et al., 2007a, 2008c].
DTI‐Based Tissue Segmentation
All DTI pre‐ and postprocessing stages resulted in ANALYZE volumes. These volumes were subjected to subsequent steps that included tissue segmentation [Ashburner and Friston, 2005], nonlinear registration [Ashburner and Friston, 1997], spatial normalization [Allen et al., 2008; Good et al., 2001] and brain atlas labeling [Collins et al. 1995, 1999; Desikan et al., 2006; Evans et al., 1994; Hammers et al., 2002; Tzourio‐Mazoyer et al., 2002] implemented in the individual brain atlases using statistical parametric mapping (SPM) [Aleman‐Gomez et al., 2007; Tae et al., 2008; Tzarouchi et al., 2009] toolbox (http://www.thomaskoenig.ch/Lester/ibaspm.htm). All original and modified programs were developed in MATLAB (http://www.mathworks.com) based on SPM2 and SPM5 (Wellcome Department of Cognitive Neurology, London, UK; http://www.fil.ion.ucl.ac.uk/spm).
A pictorial of the main steps used in the atlas‐based DTI segmentation procedure is shown in Figure 1. Using DTI‐based clustering, the brain was segmented into WM, GM, and CSF. The method uses a feature space obtained from a large training set (see Fig. 1 in Hasan et al. [ 2007a]). The contrast in fractional anisotropy (FA) (Fig. 1a) maps between CSF, WM, and GM and the cluster separability and discriminability of WM and GM based on the principal diffusivity indices (Fig 1b). The CSF was segmented based on its high diffusivity and low anisotropy [Cercignani et al., 2001; Freidlin et al., 2007; Hadjiprocopis et al., 2005; Hasan et al., 2007a; Jones et al., 2000; Pierpaoli et al., 1996; Wiegell et al., 2003]. Subsequent steps used the DTI‐segmented volumes (Fig 1c) normalized (Fig 1d) to the Montreal Neurological Institute template (http://www.mrccbu.cam.ac.uk/Imaging/Common/mnispace.shtml) (see Fig 1e) and the international consortium for brain mapping human brain probabilistic atlases [Mazziotta et al., 1995; Mori et al., 2008; Van Essen and Dierker, 2007]. The anatomically labeled brain atlases had a voxel size = 1 mm × 1 mm × 1 mm and matrix = 181 × 217 × 181 (http://www.loni.ucla.edu/Atlases/). A representative output is shown in Figure 1f, which shows multiplanar views. Qualitative segmentation results on the cortical lobes, and subcortical structures were examined using available interactive atlases such as http://www9.biostr.washington.edu/da.html and http://www.radnet.ucla.edu/sections/DINR/index.html.
Figure 1.

A pictorial illustration of the DTI‐based atlas‐driven method for regional volume estimation (a) the fractional anisotropy and (b) diffusivity maps are used to (c) cluster brain tissues into GM, white matter, and CSF. The tissue map is normalized (d) using the ICBM/MNI (e) templates and (f) labeled atlases and then transformed back in SPM to each subject's original space (g). The results shown in (g) are viewed in both sagittal and coronal planes. Note that the ICBM atals used in this illustration contains both lobar cortical regions and subcortical structures. The CSF is assigned a yellow color in (c) and white color in (g).
Because the segmented volumes (∼200 subcortical and cortical regions) were obtained in the DTI native space as labeled volume masks, we were able to obtain directly the corresponding volume‐averaged mean values of the corresponding DTI metrics (e.g., FA and mean diffusivity).
Validation of Regional GM Segmentation Results
For quantitative analyses, we compared the absolute volume obtained using the DTI‐based methods with those published previously using manual or automated methods ([Ahsan et al., 2008; see Table I). To reduce the number of comparisons and avoid controversial issues related to laterality (see Table I), we only examined the results of the left putamen. This structure was chosen as a representative deep GM structure, because its gender‐related developmental and aging trends have been studied extensively using MRI volumetric (Greenberg et al., 2008; Shattuck et al., 2008; see Table I) and DTI region‐of‐interest (Lebel et al., 2008; Pfefferbaum et al., 2009] or voxel‐based [Cámara et al., 2007] methods. All participants were used to examine age trends.
Comparison of DTI Atlas‐Based Segmentation and 3D T1w
We compared the volume results of the 2D DTI‐based segmentation with those obtained using the FreeSurfer analysis pipeline on the 3D high‐resolution T1‐weighted data (Fischl et al., 2002). A subset of 31 right‐handed adolescents and young adults (18 males and 13 females of equivalent age; age range, 15.83–28.83 years) were used for this analysis. The details of the application and validation of FreeSurfer (http://surfer.nmr.mgh.harvard.edu/) tissue segmentation to cortical and subcortical structures are described elsewhere [Jovicich et al., 2009; MaCdonald et al., 2008].
Because FreeSurfer results are obtained using a high‐resolution 3D data set that is acquired sagittaly, and the DTI‐based segmentation results are obtained using 2D axially acquired data set. Therefore, we did not attempt in this work to fuse the results into one common space as this would have required additional nonlinear registration and warping procedures that could have biased the results obtained by each analysis pipeline [Allen et al., 2008; Lacester et al., 2007; Shattuck et al., 2008]. The absolute volumetry results relative and the volume relative to the intracranial volume (ICV) obtained by each method are reported in this manuscript.
Statistical Analysis
Group mean comparisons between males and females were made using the t‐test for unpaired groups. Within‐group comparisons were conducted using paired t‐tests. Correlations with age were based on the Pearson coefficient [Glantz, 2002]. Statistical comparisons between regression coefficients and Bland‐Altman bias analysis of methods were conducted as described elsewhere [Glantz, 2002]. A P‐value <0.05 (two‐tailed) was considered statistically significant.
Data Quality and Reproducibility
Because the data from all healthy controls were collected over a 4‐year span at high SNR, we collected, using identical protocols a database of water phantom measurements, and adult controls to assure the field uniformity and stability of the MRI scanner. The diffusion encoding (Icosa21b) provided three levels of SNR [Hasan and Narayana, 2003], and hence the SNR dependence of the DTI‐metrics and estimates reported in this work were also studied on all subjects [Hasan et al., 2008a].
RESULTS
We validated the DTI‐based segmentation results in our previous publication [Hasan et al., 2007a] using the whole brain CSF, WM, and GM [Hasan et al., 2007b] and on regional structures such as the corpus callosum [Hasan et al., 2008c]. Because this manuscript is more concerned with the GM atlas‐based DTI segmentation results, we used the left putamen volume as a representative benchmark to evaluate the accuracy and sensitivity of the new approach to age and gender. The use of age and gender as useful and sensitive variables to test and compare segmentation results has been recommended [Hasan and Pedraza, 2009].
Comparison of DTI‐Based and FreeSurfer Results on the Left Putamen Volume
The volume of the left putamen using FreeSurfer was 6.080 ± 0.671 mL, whereas the DTI‐based approach provided 4.815 ± 0.766 mL. The volume of the left putamen obtained using FreeSurfer and the DTI‐based approach correlated (r = 0.40; P = 0.03; N = 31; see Fig. 2a). There was a significant difference between the two approaches (P = 1 × 10⁻⁷). A Bland–Altman bias analysis (Fig 2b) shows that FreeSurfer left putamen volumes are larger than the DTI‐based method. The FreeSurfer or T1‐weighted ICV and 2D‐based estimated ICV were not significantly different (e.g., 1559.255 ± 178.421 mL vs. 1569.948 ± 138.596 mL; P = 0.715). The left putamen volume‐to‐ICV percentage (LPUT Vol/ICV *100) was significantly larger using FreeSurfer compared to the DTI‐based approach (e.g., 0.392 ± 0.044 vs. 0.308 ± 0.063; P = 6 × 10⁻¹⁰ paired t‐test).
Figure 2.
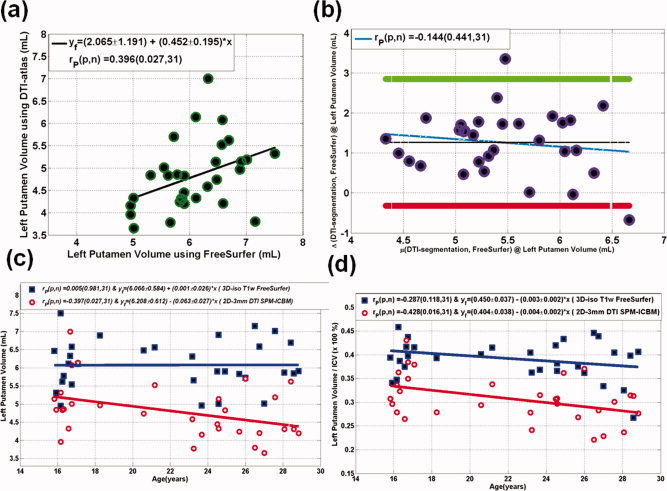
Comparison of DTI‐segmentation and FreeSurfer volume estimation on the left putamen volume on the N = 31 sample. (a) A scatter plot along with the linear regression analysis, (b) a bias analysis using the Bland–Altman method, (c) scatter plots and regression analysis of the dependency of the estimated left putamen volume on age, and (d) scatter plots and regression analysis of the scatter plots and regression analysis of the dependency of the estimated left putamen volume on age. [Color figure can be viewed in the online issue, which is available at wileyonlinelibrary.com.]
The sensitivity of the estimated left putamen absolute volume and volume‐to‐ICV ratio to age is plotted in Figure 2c,d, respectively. Note that the DTI‐segmentation approach predicts that left putamen volume‐to‐ICV percentage decreases with age (r = −0.43, P = 0.02), whereas FreeSurfer results seem to be less sensitive to age effects (r = −0.29, P = 0.12). A further statistical comparison [Glantz, 2002] shows that the left putamen annual volume loss rates obtained by FreeSurfer and DTI‐segmentation are not statistically different (P = 0.54).
DTI‐Based Left Putamen Normalized Volume and FA Gender and Age Effects
Males had larger ICV (ICV = 1607.9 ± 124.2 mL; N = 65) when compared with females (ICV = 1462.8 ± 115.5 mL; N = 71; P < 1 × 10⁻¹⁰). The DTI‐segmented left putamen average volumes were significantly larger in males (5.108 ± 0.811 mL) when compared with females (4.641 ± 0.932 mL; P < 1 × 10⁻⁶). The left putamen volume‐to‐ICV percentage was not significantly different between males and females (0. 317 ± 0.056 vs. 0.318 ± 0.043; P = 0.954).
The left putamen volume‐to‐ICV percentage and corresponding mean FA values are plotted and compared in Figure 3a on both males and females and the entire sample (N = 136). Note that the putamen volume‐to‐ICV percentage decreased with advancing age for both males (r = −0.267; P = 0.03) and females (r = −0.336; P = 0.004; Fig 3a). The annual putamen volume loss rate did not differ between males and females (P = 0.67) and hence males and females were pooled together. Figure 3b shows that for the entire cross‐sectional cohort (N = 136), the putamen volume‐to‐ICV percentage significantly decreased with age (r = −0.3; P = 0.0003). Figure 3c shows that the FA of the left putamen significantly increased with age in both males (r = 0.42; P = 0.0005) and females (r = 0.55; P < 0.000001). The rate of FA increase with age did not differ between males and females (P = 0.34). A strong positive correlation between left putamen mean FA and age was found on the entire cohort and is shown in Figure 3d (r = 0.49; P = 1.6 × 10⁻⁹).
Figure 3.
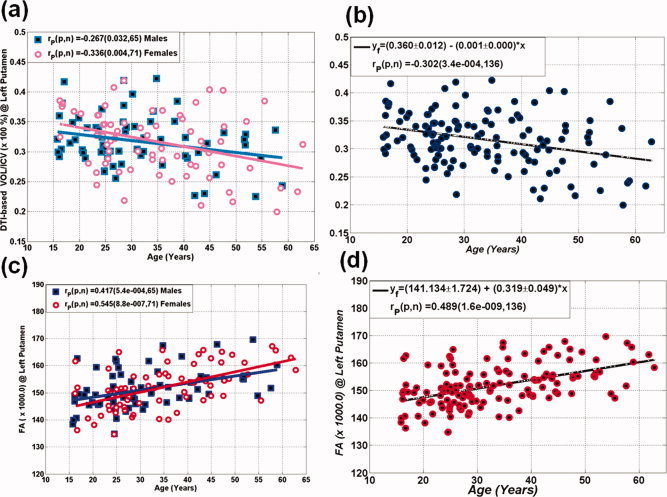
(a) Scatter plots of the DTI segmentation results of the left putamen volume‐to‐ICV for (a) both the 65 males and 71 females, (b) the entire cohort (N = 136). The average fractional anisotropy values of the left putamen volume is shown in (c) for both males and females and (d) the entire population. Note the gender‐independent effects, the decrease in putamen volume and the increase in putamen FA with advancing age. [Color figure can be viewed in the online issue, which is available at wileyonlinelibrary.com.]
Application of the DTI‐Segmentation
Figure 4 illustrates one novel application of the DTI regional segmentation in the DTI native space. The segmented GM volumes obtained using the new DTI‐based approach were fused with the DTI color‐coded maps (FA‐modulated principal eigenvector) to enhance the accuracy of quantitative DTI measurements using region‐of‐interest or fiber tracking [Wakana et al., 2004].
Figure 4.
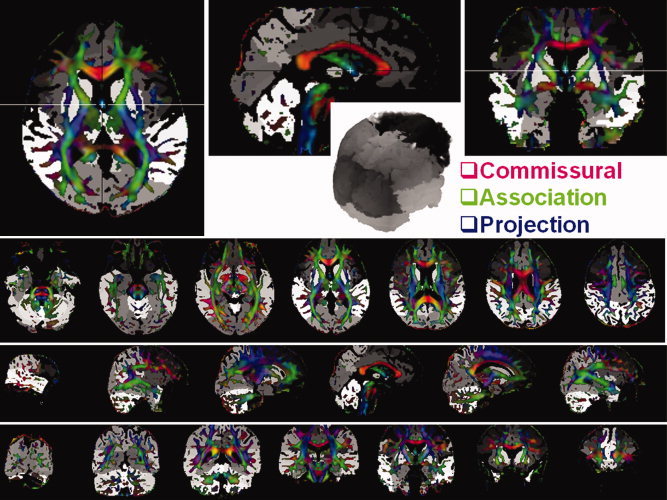
Illustration of the application of DTI‐based segmentation of gray matter volumes to build a teaching brain digital atlas and to improve the accuracy of quantitative DTI measurements (e.g., fiber tracking and region‐of‐interest). The figure shows in 3D multiplanar views a fusion of color‐coded and FA‐modulated principal eigenvector map with the regional gray matter volume segmentation also shown in 3D. The different shades of gray correspond to deep subcortical and lobar regions while red is assigned to commissural fibers oriented right‐to‐left (e.g. corpus callosum), green is assigned to association fibers oriented anterior‐to‐posterior (e.g. cingulum), and blue is assigned to projection pathways oriented superior‐to‐inferior (e.g. corticospinal tract).
DISCUSSION
In this report, we described and applied for the first time a novel DTI‐based and automated regional approach for tissue segmentation that is based on intrinsic and coregistered volumes derived from DTI data in each subject's native space. In contrast to other approaches, we did not warp the DTI data to the T1w‐volumes acquired from each subject [Liu et al., 2006; Mabbott et al., 2006; Thottakara et al., 2006]. The approach is based on a trained feature space (see Fig. 1 in Hasan et al. [ 2007a]) derived on a population of subjects using the same high‐SNR DT‐MRI protocol. This high SNR provided accurate estimation of anisotropy and mean diffusivity in both WM and GM [Hasan et al., 2007a]. In this report, we adapted our whole brain tissue segmentation methodology to handle regional cortical and subcortical tissue segmentation that incorporated well‐established statistical and probabilistic atlases [Collins et al., 1995; Maziotta et al., 1995; Mori et al., 2008] as we proposed in our previous manuscript [Hasan et al., 2007a].
In this manuscript, we have presented the DTI‐based regional segmentation results using the left putamen volume and its corresponding age and gender effects on a large cohort of healthy right‐handed males and females. For validation in this Technical Report, we have avoided laterality effects as this seems to be controversial in published literature ([Ahasan et al., 2007; Ifthikharuddin et al., 2000; see Table I). The absolute and ICV‐normalized left putamen volumetry values and gender effects obtained using the DTI approach are comparable to those published using different populations and analysis methods [Ahsan et al., 2007; Gunning‐Dixon et al., 1998; Ifthikharuddin et al., 2000; Péran et al., 2009; Raz et al., 2003; Walhovd et al., 2005]. The age trends results using the young adults (N = 31) and the entire cohort (N = 136) are consistent with published literature on the putamen ([MacDonald et al., 1991]; see Table I).
The increase in the entire left putamen volume FA with advancing age has been reported in DTI literature using voxel‐based [Camara et al., 2007] or DTI‐ROI measurements [Lebel et al., 2008; Pfefferbaum et al., 2009]. The gender‐independent and commensurate decrease in putamen volume and increase in corresponding FA with advancing age has been also reported on other basal ganglia such as the caudate nuclei [Hasan et al., 2008a]. The decrease in basal ganglia GM volume has been hypothesized to be related to neuronal and dendrite loss [Raz et al., 2003], which is also related to cortical GM tissue loss and the loss of corresponding WM connections (see Hasan et al. [ 2008a] and references therein).
Our results on the volumetry of the left putamen indicate some discrepancy with FreeSurfer, which provided a 26.3% overestimation that is not explained by scaling due to ICV. The differences across methods cannot be attributed to the automated DTI approach alone. The “unedited” FreeSurfer volumetry results have been reported to be overestimated with respect to manually delineated values in a recent publication [Tae et al., 2008]. Discrepancies between manual and atlas‐based segmentation methods have been reported on several brain structures including the putamen [Shattuck et al., 2008].
To help readers further, we compiled Table I from publications that tabulated the putamen right and left volumes on healthy controls in addition to putamen volume versus age trends whenever documented. Table I shows some discrepancy in reported normative putamen absolute volume and asymmetry [Brambilla et al., 2001; Keshavan et al., 1998] using both manual and automated methods that are not primarily explained by age or gender effects (e.g., cf. Rosas et al. [2001] and Vernaleken et al. 2007]). For example, Shattuck et al. [ 2008] reported a 21–39% overestimation in left putamen volume using three automated T1w and atlas‐based methods compared to manual delineation.
Some major differences between our approach and those commonly adopted for tissue segmentation should be noted. The DTI approach used 2D EPI data with 3‐mm axial acquisitions, whereas the FreeSurfer used the high resolution T1‐weighted data with 0.9375 isotropic voxels. DTI approach uses intrinsic contrast metrics such as tensor anisotropy and mean diffusivity, which are decoupled from the original intensity of the raw data (see Hasan et al. [ 2007a]). The average values of left putamen FA obtained using our approach indicate minimal contamination with neighboring WM as confirmed by careful section‐by‐section visual inspection of the segmentation results (see Fig. 4). The FA in addition to mean diffusivity values provided important and sensitive microstructural quality control metrics to assess macrostructural tissue segmentation fidelity.
Our study shows that the left putamen volume decreases with age in both males and females using a linear regression model (see Fig. 2). Our results while being consistent with several studies on children [Caviness et al., 1996; Giedd et al., 1996], young adults ([Gunning‐Dixon, 1998; Peran et al., 2009; see Table I) and older adults [Greenberg et al., 2008] need also be compared with the age trends reported in other studies across the human lifespan. For example, Walhovd et al. [ 2005] reported a cubic putamen volume relation with age, and Zimmerman et al. [ 2006] reported a quadratic trend which contradicts the trends of steadily decreasing putamen volume in a large study of older adults [Greenberg et al., 2006] and a longitudinal study by Raz et al. [ 2003].
A more comprehensive compilation and analysis of published putamen volumetry is beyond the scope of this communication and will be pursued in a future meta‐analysis study that will also discuss laterality.
The current work shows that DTI data in combination with brain templates and anatomically labeled brain atlases can be used to provide cortical and subcortical volumetry that can be used to regularize or improve the accuracy of several additional applications such as fiber tracking [see Fig. 4; Hasan et al., 2009a].
CONCLUSION
The approach presented in this manuscript extends the information content of the ∼6‐min DTI exam, which can now be used for both macro and microstructural regional evaluations of both gray and WM. Future advancements in high field and data acquisition procedures to reduce DTI limitations and challenges that include image distortions [Gui et al., 2008], partial volume averaging at tissue boundaries [Alexander et al., 2001; Papadakis et al., 2002], crossing fibers [Wiegell et al., 2000; Tuch et al., 2002], and improvements in spatial resolution [Hasan et al., 2009] would help mitigate some of the challenges encountered when using EPI for DTI. Because the segmentation approach uses the DTI data in native space, the approach basically provides a labeled anatomical atlas (∼200 regions; see Figs. 1 and 4) for each subject that can be used to reduce errors associated with ROI placement needed for cortical or subcortical parcellations. In this report, only the left Putamen was selected as a quantitative benchmark of deep GM. The presentation and summary of all available cortical and deep GM will be presented in future manuscripts across the human lifespan to tackle subtle issues related to laterality using even larger normative populations (additional data will be presented if requested).
The fusion of these subject‐customized gray or WM atlases with additional functional MRI [Van Essen and Dierker, 2007], magnetoencephalography [Kamada et al., 2007], metabolic [Kochunov et al., 2009], perfusion, or relaxation measurements [Teicher et al., 2000] for studies of brain‐function relations in both health and disease would help advance system‐driven approaches in human brain research and future clinical trials.
Acknowledgements
We thank Vipul Kumar Patel for helping in data acquisition.
REFERENCES
- Ahsan RL, Allom R, Gousias IS, Habib H, Turkheimer FE, Free S, Lemieux L, Myers R, Duncan JS, Brooks, DJ , Koepp MJ, Hammers A ( 2007): Volumes, spatial extents and a probabilistic atlas of the human basal ganglia and thalamus. NeuroImage 38: 261–270. [DOI] [PubMed] [Google Scholar]
- Alemán‐Gómez Y, Melie‐García, L , Valdés‐Hernandez P ( 2007): IBASPM: Toolbox for automatic parcellation of brain structures. Human Brain Mapping, Proceedings of the 12th Annual Meeting, Florence, Italy.
- Alexander AL, Hasan KM, Lazar M, Tsuruda JS, Parker DL ( 2001): Analysis of partial volume effects in diffusion‐tensor MRI. Magn Reson Med 45: 770–780. [DOI] [PubMed] [Google Scholar]
- Ali AA, Dale AM, Badea A, Johnson GA ( 2005): Automated segmentation of neuroanatomical structures in multispectral MR microscopy of the mouse brain. NeuroImage 27: 425–435. [DOI] [PubMed] [Google Scholar]
- Allen JS, Bruss J, Mehta S, Grabowski T, Brown CK, Damasio H ( 2008): Effects of spatial transformation on regional brain volume estimates. NeuroImage 42: 535–547. [DOI] [PMC free article] [PubMed] [Google Scholar]
- Anastasi G, Cutroneo G, Tomasello F, Lucerna S, Vitetta A, Bramanti P, Di Bella P, Parenti A, Porzionato A, Macchi V, De Caro R ( 2006): In vivo basal ganglia volumetry through application of NURBS models to MR images. Neuroradiology 48: 338–345. [DOI] [PubMed] [Google Scholar]
- Ashburner J, Friston K ( 1997): Multimodal image coregistration and partitioning—A unified framework. NeuroImage 6: 209–217. [DOI] [PubMed] [Google Scholar]
- Ashburner J, Friston KJ ( 2005). Unified segmentation. NeuroImage 26: 839–851. [DOI] [PubMed] [Google Scholar]
- Brambilla P, Harenski K, Nicoletti MA, Mallinger AG, Frank E, Kupfer DJ, Keshavan MS, Soares JC ( 2001): Anatomical MRI study of basal ganglia in bipolar disorder patients. Psychiatry Res 10: 65–80. [DOI] [PubMed] [Google Scholar]
- Càmara E, Bodammer N, Rodríguez‐Fornells A, Tempelmann C ( 2007): Age‐related water diffusion changes in human brain: A voxel‐based approach. NeuroImage 34: 1588–1599. [DOI] [PubMed] [Google Scholar]
- Caviness VS Jr., Kennedy DN, Richelme C, Rademacher J, Filipek PA ( 1996): The human brain age 7–11 years: A volumetric analysis based on magnetic resonance images. Cereb Cortex 6: 726–736. [DOI] [PubMed] [Google Scholar]
- Cercignani M, Inglese M, Siger‐Zajdel M, Filippi, M ( 2001): Segmenting brain white matter, gray matter and cerebro‐spinal fluid using diffusion tensor‐MRI derived indices. Magn Reson Imaging 19: 1167–1172. [DOI] [PubMed] [Google Scholar]
- Collins DL, Holmes C, Peters T, Evans A ( 1995): Automatic 3D model‐based neuroanatomical segmentation. Human Brain Mapp 3: 190–208. [Google Scholar]
- Collins DL, Zijdenbos AP, Barré WFC, Evans AC ( 1999): ANIMAL+INSECT: Improved cortical structure segmentation. Proceedings of the Annual Symposium on Information Processing in Medical Imaging In: Kuba A, Samal M, Todd‐Pokropek A, editors. LNCS, Vol. 1613 Berlin: Springer; pp. 210–223. [Google Scholar]
- de Jong LW, van der Hiele K, Veer IM, Houwing JJ, Westendorp RG, Bollen EL, de Bruin PW, Middelkoop HA, van Buchem MA, van der Grond J ( 2008): Strongly reduced volumes of putamen and thalamus in Alzheimer's disease: An MRI study. Brain 131: 3277–3285. [DOI] [PMC free article] [PubMed] [Google Scholar]
- Desikan RS, Ségonne F, Fischl B, Quinn BT, Dickerson BC, Blacker D, Buckner RL, Dale AM, Maguire RP, Hyman BT, Albert MS, Killiany RJ ( 2006): An automated labeling system for subdividing the human cerebral cortex on MRI scans into gyral based regions of interest. NeuroImage 31: 968–980. [DOI] [PubMed] [Google Scholar]
- Evans AC, Kamber M, Collins DL, MacDonald D ( 1994): An MRI based probabilistic atlas of neuroanatomy In: Shorvon SD, Fish DR, Andermann F, Bydder GM, Stefan H, editors. Magnetic Resonance Scanning and Epilepsy. New York: Plenum; pp. 263–274. [Google Scholar]
- Fischl B, Salat DH, Busa E, Albert M, Dieterich M, Haselgrove C, van der Kouwe A, Killiany R, Kennedy D, Klaveness S, Montillo A, Makris N, Rosen B, Dale AM ( 2002): Whole brain segmentation: Automated labeling of neuroanatomical structures in the human brain. Neuron 33: 341–355. [DOI] [PubMed] [Google Scholar]
- Fjell AM, Westlye LT, Greve DN, Fischl B, Benner T, van der Kouwe AJ, Salat D, Bjørnerud A, Due‐Tønnessen P, Walhovd KB ( 2008): The relationship between diffusion tensor imaging and volumetry as measures of white matter properties. NeuroImage 42: 1654–1668. [DOI] [PMC free article] [PubMed] [Google Scholar]
- Freidlin RZ, Ozarslan E, Komlosh ME, Chang LC, Koay CG, Jones DK, Basser PJ ( 2007): Parsimonious model selection for tissue segmentation and classification applications: A study using simulated and experimental DTI data. IEEE Trans Med Imaging 26: 1576–1584. [DOI] [PubMed] [Google Scholar]
- Giedd JN, Snell JW, Lange N, Rajapakse JC, Casey BJ, Kozuch PL, Vaituzis AC, Vauss YC, Hamburger SD, Kaysen D, Rapoport JL ( 1996): Quantitative magnetic resonance imaging of human brain development: Ages 4–18. Cereb Cortex 6: 551–560. [DOI] [PubMed] [Google Scholar]
- Glantz SA ( 2002): Primer of Biostatistics, 5th ed. New York: McGraw‐Hill. [Google Scholar]
- Good CD, Johnsrude IS, Ashburner J, Henson RN, Friston KJ, Frackowiak RS ( 2001): A voxel‐based morphometric study of ageing in 465 normal adult human brains. NeuroImage 14: 21–36. [DOI] [PubMed] [Google Scholar]
- Greenberg DL, Messer DF, Payne ME, Macfall JR, Provenzale JM, Steffens DC, Krishnan RR ( 2008): Aging, gender, and the elderly adult brain: An examination of analytical strategies. Neurobiol Aging 29: 290–302. [DOI] [PMC free article] [PubMed] [Google Scholar]
- Gui M, Peng H, Carew JD, Lesniak MS, Arfanakis K ( 2008): A tractography comparison between turboprop and spin‐echo echo‐planar diffusion tensor imaging. NeuroImage 42: 1451–1462. [DOI] [PMC free article] [PubMed] [Google Scholar]
- Gunning‐Dixon FM, Head D, McQuain J, Acker JD, Raz N ( 1998): Differential aging of the human striatum: A prospective MR imaging study. AJNR Am J Neuroradiol 19: 1501–1507. [PMC free article] [PubMed] [Google Scholar]
- Hadjiprocopis A, Rashid W, Tofts PS ( 2005): Unbiased segmentation of diffusion‐weighted magnetic resonance images of the brain using iterative clustering. Magn Reson Imaging 23: 877–885. [DOI] [PubMed] [Google Scholar]
- Hammers A, Koepp MJ, Free SL, Brett M, Richardson MP, Labbe C, Cunningham VJ, Brooks DJ, Duncan JS ( 2002): Implementation and application of a brain template for multiple volumes of interest. Hum Brain Mapp 15: 165–174. [DOI] [PMC free article] [PubMed] [Google Scholar]
- Hasan KM, Narayana PA ( 2003): Computation of the fractional anisotropy and mean diffusivity maps without tensor decoding and diagonalization: Theoretical analysis and validation. Magn Reson Med 50: 589–598. [DOI] [PubMed] [Google Scholar]
- Hasan KM, Pedraza O ( 2009): Improving the reliability of manual and automated methods for hippocampal and amygdala volume measurements. NeuroImage 48: 497–498. [DOI] [PMC free article] [PubMed] [Google Scholar]
- Hasan KM, Halphen C, Sankar A, Eluvathingal TJ, Kramer L, Stuebing KK, Fletcher JM, Ewing‐Cobbs L ( 2007a): Diffusion tensor imaging‐based tissue segmentation: Validation and application to the developing child and adolescent brain. NeuroImage 34: 1497–1505. [DOI] [PMC free article] [PubMed] [Google Scholar]
- Hasan KM, Sankar A, Halphen C, Kramer LA, Brandt ME, Juranek J, Cirino PT, Fletcher JM, Papanicolaou AC, Ewing‐Cobbs L ( 2007b): Development and organization of the human brain tissue compartments across the lifespan using diffusion tensor imaging. Neuroreport 18: 1735–1739. [DOI] [PubMed] [Google Scholar]
- Hasan KM, Halphen C, Boska MD, Narayana PA ( 2008a): Diffusion tensor metrics, T2 relaxation, and volumetry of the naturally aging human caudate nuclei in healthy young and middle‐aged adults: Possible implications for the neurobiology of human brain aging and disease. Magn Reson Med 59: 7–13. [DOI] [PubMed] [Google Scholar]
- Hasan KM, Ewing‐Cobbs L, Kramer LA, Fletcher JM, Narayana PA ( 2008b): Diffusion tensor quantification of the macrostructure and microstructure of human midsagittal corpus callosum across the lifespan. NMR Biomed 21: 1094–1101. [DOI] [PMC free article] [PubMed] [Google Scholar]
- Hasan KM, Kamali A, Kramer LA, Papanicolaou AC, Fletcher JM, Ewing‐Cobbs L ( 2008c): Diffusion tensor quantification of the human midsagittal corpus callosum subdivisions across the lifespan. Brain Res 1227: 52–67. [DOI] [PMC free article] [PubMed] [Google Scholar]
- Hasan KM, Kamali A, Kramer LA ( 2009): Mapping the human brain white matter tracts relative to cortical and deep gray matter using diffusion tensor imaging at high spatial resolution. Magn Reson Imaging 27: 631–636. [DOI] [PubMed] [Google Scholar]
- Jacobsen LK, Giedd JN, Gottschalk C, Kosten TR, Krystal JH ( 2001): Quantitative morphology of the caudate and putamen in patients with cocaine dependence. Am J Psychiatry 158: 486–489. [DOI] [PubMed] [Google Scholar]
- Jones DK, Dardis R, Ervine M, Horsfield MA, Jeffree M, Simmons A, Jarosz J, Strong AJ ( 2000): Cluster analysis of diffusion tensor magnetic resonance images in human head injury. Neurosurgery 47: 306–313. [DOI] [PubMed] [Google Scholar]
- Jovicich J, Czanner S, Han X, Salat D, van der Kouwe A, Quinn, B , Pacheco J, Albert M, Killiany R, Blacker D, Maguire P, Rosas D, Makris N, Gollub R, Dale A, Dickerson BC, Fischl B ( 2009): MRI‐derived measurements of human subcortical, ventricular and intracranial brain volumes: Reliability effects of scan sessions, acquisition sequences, data analyses, scanner upgrade, scanner vendors and field strengths. NeuroImage 46: 177–192. [DOI] [PMC free article] [PubMed] [Google Scholar]
- Ifthikharuddin SF, Shrier DA, Numaguchi Y, Tang X, Ning R, Shibata DK, Kurlan R ( 2000): MR volumetric analysis of the human basal ganglia: Normative data. Acad Radiol 7: 627–634. [DOI] [PubMed] [Google Scholar]
- Kamada K, Todo T, Masutani Y, Aoki S, Ino K, Morita A, Saito N ( 2007): Visualization of the frontotemporal language fibers by tractography combined with functional magnetic resonance imaging and magnetoencephalography. J Neurosurg 106: 90–98. [DOI] [PubMed] [Google Scholar]
- Keshavan MS, Rosenberg D, Sweeney JA, Pettegrew JW ( 1998): Decreased caudate volume in neuroleptic‐naive psychotic patients. Am J Psychiatry 155: 774–778. [DOI] [PubMed] [Google Scholar]
- Kochunov P, Ramage AE, Lancaster JL, Robin DA, Narayana S, Coyle T, Royall DR, Fox P ( 2009): Loss of cerebral white matter structural integrity tracks the gray matter metabolic decline in normal aging. NeuroImage 45: 17–28. [DOI] [PMC free article] [PubMed] [Google Scholar]
- Lancaster JL, Tordesillas‐Gutierrez D, Martinez M, Salinas F, Evans A, Zilles K, Mazziotta JC, Fox PT ( 2007): Bias between MNI and Talairach coordinates analyzed using the ICBM‐152 brain template. Hum Brain Mapp 28: 1194–1205. [DOI] [PMC free article] [PubMed] [Google Scholar]
- Lawes IN, Barrick TR, Murugam V, Spierings N, Evans DR, Song M, Clark CA ( 2008): Atlas‐based segmentation of white matter tracts of the human brain using diffusion tensor tractography and comparison with classical dissection. NeuroImage 39: 62–79. [DOI] [PubMed] [Google Scholar]
- Lebel C, Walker L, Leemans A, Phillips L, Beaulieu C ( 2008): Microstructural maturation of the human brain from childhood to adulthood. NeuroImage 40: 1044–1055. [DOI] [PubMed] [Google Scholar]
- Liu T, Young G, Huang L, Chen NK, Wong ST ( 2006): 76‐space analysis of grey matter diffusivity: Methods and applications. NeuroImage 31: 51–65. [DOI] [PubMed] [Google Scholar]
- Mabbott DJ, Noseworthy M, Bouffet E, Laughlin S, Rockel C ( 2006): White matter growth as a mechanism of cognitive development in children. NeuroImage 33: 936–946. [DOI] [PubMed] [Google Scholar]
- Makris N, Papadimitriou GM, Sorg S, Kennedy DN, Caviness VS, Pandya DN ( 2007): The occipitofrontal fascicle in humans: A quantitative, in vivo, DT‐MRI study. NeuroImage 37: 1100–1111. [DOI] [PMC free article] [PubMed] [Google Scholar]
- Mazziotta J, Toga A, Evans A, Fox P, Lancaster J ( 1995): A probabilistic atlas of the human brain: Theory and rationale for its development. The International Consortium for Brain Mapping. NeuroImage 2: 89–101. [DOI] [PubMed] [Google Scholar]
- McDonald WM, Husain M, Doraiswamy PM, Figiel G, Boyko O, Krishnan KR ( 1991): A magnetic resonance image study of age‐related changes in human putamen nuclei. Neuroreport 2: 57–60. [DOI] [PubMed] [Google Scholar]
- McDonald CR, Hagler DJ, Ahmadi ME, Tecoma E, Iragui V, Dale AM, Halgren E ( 2008). Subcortical and cerebellar atrophy in mesial temporal lobe epilepsy revealed by automatic segmentation. Epilepsy Res 79: 130–138. [DOI] [PMC free article] [PubMed] [Google Scholar]
- Mori S, Oishi K, Jiang H, Jiang L, Li X, Akhter K, Hua K, Faria AV, Mahmood A, Woods R, Toga AW, Pike GB, Neto PR, Evans A, Zhang J, Huang H, Miller MI, van Zijl P, Mazziotta J ( 2008): Stereotaxic white matter atlas based on diffusion tensor imaging in an ICBM template. NeuroImage 40: 570–582. [DOI] [PMC free article] [PubMed] [Google Scholar]
- Netsch T, Van Muiswinkel A ( 2004): Quantitative evaluation of image‐based distortion correction in diffusion tensor imaging. IEEE‐TME 23: 789–798. [DOI] [PubMed] [Google Scholar]
- Papadakis NG, Martin KM, Mustafa MH, Wilkinson ID, Griffiths PD, Huang CL, Woodruff PW ( 2002): Study of the effect of CSF suppression on white matter diffusion anisotropy mapping of healthy human brain. Magn Reson Med 48: 394–398. [DOI] [PubMed] [Google Scholar]
- Péran P, Cherubini A, Luccichenti G, Hagberg G, Démonet JF, Rascol O, Celsis P, Caltagirone C, Spalletta G, Sabatini U ( 2009): Volume and iron content in basal ganglia and thalamus. Hum Brain Mapp 30: 2667–2675. [DOI] [PMC free article] [PubMed] [Google Scholar]
- Pfefferbaum A, Adalsteinsson E, Rohlfing T, Sullivan EV ( 2010): Diffusion tensor imaging of deep gray matter brain structures: Effects of age and iron concentration. Neurobiol Aging 31: 482–493. [DOI] [PMC free article] [PubMed] [Google Scholar]
- Pham DL, Xu C, Prince JL ( 2000): Current methods in medical image segmentation. Annu Rev Biomed Eng 2: 315–337. [DOI] [PubMed] [Google Scholar]
- Pierpaoli C, Jezzard P, Basser PJ, Barnett A, Di Chiro G ( 1996): Diffusion tensor MR imaging of the human brain. Radiology 201: 637–648. [DOI] [PubMed] [Google Scholar]
- Raz N, Rodrigue KM, Kennedy KM, Head D, Gunning‐Dixon F, Acker JD ( 2003): Differential aging of the human striatum: Longitudinal evidence. AJNR Am J Neuroradiol 241: 1849–1856. [PMC free article] [PubMed] [Google Scholar]
- Rosas HD, Goodman J, Chen YI, Jenkins BG, Kennedy DN, Makris N, Patti M, Seidman LJ, Beal MF, Koroshetz WJ ( 2001): Striatal volume loss in HD as measured by MRI and the influence of CAG repeat. Neurology 57: 1025–1028. [DOI] [PubMed] [Google Scholar]
- Shattuck DW, Mirza M, Adisetiyo V, Hojatkashani C, Salamon G, Narr KL, Poldrack RA Bilder RM, Toga AW ( 2008): Construction of a 3D probabilistic atlas of human cortical structures. Neuroimage 39: 1064–1080. [DOI] [PMC free article] [PubMed] [Google Scholar]
- Tae W, Kim S, Lee K, Nam EC, Kim K ( 2008): Validation of hippocampal volumes measured using a manual method and two automated methods (FreeSurfer and IBASPM) in chronic major depressive disorder. Neuroradiology 50: 569–581. [DOI] [PubMed] [Google Scholar]
- Teicher MH, Anderson CM, Polcari A, Glod CA, Maas LC, Renshaw PF ( 2000): Functional deficits in basal ganglia of children with attention‐deficit/hyperactivity disorder shown with functional magnetic resonance imaging relaxometry. Nat Med 6: 470–473. [DOI] [PubMed] [Google Scholar]
- Thottakara P, Lazar M, Johnson SC, Alexander AL ( 2006): Application of Brodmann's area templates for ROI selection in white matter tractography studies. NeuroImage 29: 868–878. [DOI] [PubMed] [Google Scholar]
- Tuch DS, Reese TG, Wiegell MR, Makris N, Belliveau JW, Wedeen VJ ( 2002): High angular resolution diffusion imaging reveals intravoxel white matter fiber heterogeneity. Magn Reson Med 48: 577–582. [DOI] [PubMed] [Google Scholar]
- Tzarouchi LC, Astrakas LG, Xydis V, Zikou A, Kosta P, Drougia A, Andronikou S, Argyropoulou MI ( 2009): Age‐related related grey matter changes in preterm infants: An MRI study. NeuroImage 47: 1148–1153. [DOI] [PubMed] [Google Scholar]
- Tzourio‐Mazoyer N, Landeau B, Papathanassiou D, Crivello F, Etard O, Delcroix N, ( 2002): Automated anatomical labelling of activations in spm using a macroscopic anatomical parcellation of the MNI MRI single subject brain. Neuroimage 15: 273–289. [DOI] [PubMed] [Google Scholar]
- Van Essen DC, Dierker DL ( 2007): Surface‐based and probabilistic atlases of primate cerebral cortex. Neuron 56: 209–225 (Review). [DOI] [PubMed] [Google Scholar]
- Vernaleken I, Weibrich C, Siessmeier T, Buchholz HG, Rösch F, Heinz A, Cumming P, Stoeter P, Bartenstein P, Gründer G ( 2007): Asymmetry in dopamine D(2/3) receptors of caudate nucleus is lost with age. NeuroImage 34: 870–878. [DOI] [PubMed] [Google Scholar]
- Wakana S, Jiang H, Nagae‐Poetscher LM, van Zijl PC, Mori S ( 2004): Fiber tract‐based atlas of human white matter anatomy. Radiology 23: 77–87. [DOI] [PubMed] [Google Scholar]
- Walhovd KB, Fjell AM, Reinvang I, Lundervold A, Dale AM, Eilertsen DE, Quinn BT, Salat D, Makris N, Fischl B ( 2005): Effects of age on volumes of cortex, white matter and subcortical structures. Neurobiol Aging 26: 1261–1270. [DOI] [PubMed] [Google Scholar]
- Wiegell MR, Larsson HB, Wedeen VJ ( 2000): Fiber crossing in human brain depicted with diffusion tensor MR imaging. Radiology 217: 897–903. [DOI] [PubMed] [Google Scholar]
- Wiegell MR, Tuch DS, Larsson HB, Wedeen VJ ( 2003): Automatic segmentation of thalamic nuclei from diffusion tensor magnetic resonance imaging. NeuroImage 19: 391–401. [DOI] [PubMed] [Google Scholar]
- Zimmerman ME, Brickman AM, Paul RH, Grieve SM, Tate DF, Gunstad J, Cohen RA, Aloia MS, Williams LM, Clark CR, Whitford, TJ , Gordon E ( 2006): The relationship between frontal gray matter volume and cognition varies across the healthy adult lifespan. Am J Geriatr Psychiatry 14: 823–833. [DOI] [PubMed] [Google Scholar]