

Abstract
Ischemic small vessel disease (SVD) is a common finding on routine scans in older people, but cognitive sequelae vary considerably. To improve understanding of mechanisms underlying decline or preservation of cognitive function in this condition, we assessed cognition and cortical plasticity in 20 elderly subjects with severe SVD and 20 age‐matched controls without SVD, as rated on conventional MRI. Cognitive status was determined with a neuropsychological test battery, cortical plasticity induced with a paired associative stimulation protocol. Microstructural white matter changes were further analyzed for fractional anisotrophy using diffusion tensor imaging. We found that cortical plasticity as well as memory functions were preserved in severe SVD, while executive functions showed trendwise or significant decreases. Within the SVD group, lower white matter integrity in parahippocampal regions and posterior parts of the corpus callosum was associated with larger cortical plasticity, an association not seen for prefrontal white matter tracts. Enhanced cortical plasticity in subjects with lower white matter integrity in memory‐relevant areas might thus indicate a compensatory mechanism to counteract memory decline in severe SVD. Hum Brain Mapp, 2013. © 2012 Wiley Periodicals, Inc.
Keywords: transcranial magnetic stimulation, diffusion tensor imaging, paired associative stimulation, white matter hyperintensities
INTRODUCTION
Ischemic small vessel disease (SVD) is associated with common vascular risk factors such as arterial hypertension, smoking, and diabetes [O'Brien et al., 2003; Rosenberg, 2009], and can be frequently observed in the aging brain [Arsava et al., 2009]. The direct impact of ischemic SVD on cognitive performance is known to be comparatively mild [O'sullivan, 2008] and mainly associated with decline in executive functions [Geerlings et al., 2009]. But even cases of excellent cognitive and motor function in the presence of severe SVD have been reported [Duning et al., 2005]. Thus, there are obvious discrepancies in cognitive scores between older individuals with a given burden of ischemic SVD. Mechanisms underlying this discrepancy are not well understood so far. Endogenous compensatory mechanisms have been proposed, including neuronal reorganization on the cellular level by synaptic strengthening and formation of new neural connections [Park and Reuter‐Lorenz, 2009] as well as large scale network reorganization, for example, increased recruitment of adjacent or connected cortical areas (e.g., ipsilateral premotor and primary motor areas in simple unimanual motor task) [Reddy et al., 2002]
Even though not necessarily leading to dementia by itself, ischemic SVD seems to lower the threshold for developing cognitive decline [Black et al., 2009]. In fact, fewer pathological findings like cortical or hippocampal atrophy of Alzheimer's disease (AD) are needed in patients with ischemic SVD for the clinical manifestation of dementia [Vermeer et al., 2003]. Hence, ischemic SVD is known to be an individual risk factor for the development of dementia during lifetime [Barnes et al., 2009; Dufouil et al., 2009].
To investigate neurophysiological changes in SVD compared to controls, transcranial magnetic stimulation (TMS) has been widely used, and a pattern of hyperexcitability with changes in resting motor threshold (rMT), short‐afferent inhibition (SAI), and short‐interval cortical inhibition, indicating abnormalities in glutamatergic, cholinergic, and GABAergic systems has been documented [Pennisi et al., 2011a].
Neuronal plasticity refers to the ability of the brain to change as a result of experience, and may mediate compensatory changes in the presence of SVD. In the process of long‐term reorganization due to learning or after brain damage, rapid‐onset cortical plasticity is proposed to be a rate‐limiting step [Kleim and Jones, 2008], and has been identified as one important aspect in formation of memory by strengthening of existing synaptic connections [Rioult‐Pedotti et al., 2000]. On a systems level, rapid‐onset cortical plasticity can be assessed using the paired associative stimulation protocol (PAS) in TMS [Stefan et al., 2000]. Neurophysiologically, PAS induces spike timing‐dependent plasticity, and has been widely used as a model of Hebbian associative long‐term potentiation [LTP; Buonomano and Merzenich, 1998] of synaptic efficacy to study disease conditions in humans [e.g., Frantseva et al., 2008; Weise et al., 2006]. In severe SVD, rapid‐onset cortical plasticity has been proposed to serve as one possible mechanism to preserve cognition [List et al., 2011].
In the present study, we investigated the impact of ischemic SVD on cognitive function and rapid‐onset cortical plasticity in elderly individuals. In 20 subjects with severe ischemic SVD and 20 subjects without ischemic SVD, white matter integrity were further quantified using voxel‐based analyses of fractional anisotrophy (FA) on diffusion tensor imaging (DTI). In all subjects, we employed PAS to examine cortical plasticity. Cognitive functions were assessed with an extensive neuropsychological test battery.
We hypothesized that in patients with severe SVD that show preserved memory functions, rapid‐onset cortical plasticity would likewise be preserved, possibly indicating a compensatory mechanism.
MATERIALS AND METHODS
The study was approved by the local Institutional Review Board in accordance with the declaration of Helsinki on the use of human subjects in experiments. Each participant gave written informed consent.
Subjects With SVD and Controls
Twenty subjects (aged 72 + 4 years, range 63–78 years, 11 female) with severe ischemic SVD (i.e., modified Fazekas scale score [Pantoni et al., 2010] 2 or 3, for details see below; SVD group) and 20 controls without SVD (aged 71 + 4 years, range 60–77 years, 10 female; modified Fazekas scale score 0; control group), matched to the SVD group with regard to age, sex, and years of education, were recruited from the register of the SEARCH‐Health study (University Hospital Münster) [Knecht et al., 2008]. Inclusion criteria encompassed absence of prior stroke, neurodegenerative disease, or major psychiatric and medical disorders, as seen on medical history, neurological examination (NIH‐Stroke‐Scale [NIH‐SS; Lyden et al., 1999]), and modified Rankin Scale Score [mRS, van Swieten et al., 1988]. Subjects were further required to reach a score ≥27 on the Mini Mental State Examination [MMSE; Folstein et al., 1975] to exclude severe cognitive deficits, and were not allowed to take CNS‐active drugs. Also, Beck's depression inventory [Hautzinger et al., 1994] was administered to assess depressive symptoms (cut‐off value ≥ 13 points). Moreover, all participants had to be right‐handed according to the Edinburgh Handedness Inventory (score > 70) [Oldfield, 1971]. After inclusion, patients and controls participated in neuropsychological testing, MRI scans, and PAS‐protocol. Experimental sessions were conducted between March and December, 2009.
Experimental Procedures
Neuropsychological testing
A comprehensive neuropsychological test battery [see Lezak, 2004] was administered to each participant (see Table I). Processing speed and executive functions/set shifting were assessed with the trail‐making‐test [versions A+B; Tombaugh, 2004], verbal fluency with the Regensburger Verbal Fluency Test [RWT; Aschenbrenner et al., 2001], phonemic fluency with “S‐words” and “G‐R‐words,” and semantic fluency (simple fluency and category switching) with the categories “food” and “clothes‐flowers.” The German version of the Auditory Verbal Learning Test was used to examine verbal learning capacity across five trials and the retrieval from verbal memory by delayed recall (30 min) [VLMT‐A; Helmstaedter et al., 2001]. Rey figure copy and recall assessed visuospatial skills and nonverbal memory [Osterrieth, 1944]; digit span and block tapping [part of the revised Wechsler Memory Scale; Lezak, 2004], both forward and backward, individual working memory performance.
Table I.
Neuropsychological tests and cognitive domains
| Cognitive domain | ||||
|---|---|---|---|---|
| Executive function | Verbal fluency | Verbal memory | Visuospatial skills | Working memory |
| TMT‐A | RWT‐S‐words | AVLT, trial 1 | ROCF | WMS‐digit‐span, forward |
| TMT‐B | RWT‐G‐ and R‐words | AVLT trail 5 | ROCF, delayed recall | WMS‐digit‐span, backward |
| RWT‐food | AVLT, sum trial 1–5 | WMS‐block‐span, forward | ||
| RWT‐clothes‐flowers | AVLT trial 7 | WMS‐block‐span, backward | ||
| AVLT, delayed recall | ||||
TMT: trail making test; RWT: Regensburger Wortflüssigkeits test; AVLT: auditory verbal learning test; ROCF: Rey‐Osterrieth complex figure test; WMS: Wechsler memory scale.
TMS
Participants were seated comfortably in an armchair. Focal TMS was performed using a Magstim 200 stimulator (Magstim, Whitland, Dyfed, UK) connected to a figure‐of‐eight shaped coil (9‐cm outer diameter of each wing) with the handle pointing backward at an angle of 45° to the interhemispheric fissure. Optimal position (“hot spot”) of the coil was the cortical representation area of the right abductor digiti minimi (ADM) muscle leading to visible abduction of the little finger at a moderately suprathreshold stimulation intensity. The “hot spot” was then marked with a waterproof pen on the scalp of the subject. Motor‐evoked potentials (MEP) of the ADM muscle were recorded via surface EMG activity using Ag/AgCl surface electrodes. The active electrode was placed on the muscle belly, the inactive electrode over the base of the metacarpophalangeal joint of the little finger. The MEP‐signals were amplified and digitized and then stored on a laboratory computer for later offline analysis. The bandpass filter was from 100 Hz to 10 kHz (Portable Keypoint, Dantec, Bristol, UK). Data were digitized at an analog‐to‐digital rate of 5 kHz.
At optimal position of the coil, rMT was determined as stimulator intensity required to produce a MEP of the ADM muscle of at least 50 μV in at least 5 of 10 consecutive trails. Intensity of stimulation was quoted as percentage of maximal stimulator output.
Paired‐associative stimulation (PAS)
All subjects underwent the PAS‐protocol similar to the one initially described by Stefan et al. [2000]. PAS consisted of 90 pairs of electrical stimulation of the ulnar nerve (300% of individual sensory threshold) at the wrist combined with suprathreshold TMS‐impulse over the “hot spot” of the ADM over the contralateral hemisphere at a rate of 0.05 Hz. The stimulator output was set to induce MEP values of 0.5–1 mV. Interstimulus interval was set to 25 ms, which has been shown to induce LTP‐like increase in MEP amplitude [Stefan et al., 2000]. MEP amplitude measurements (average of 20 responses) were performed at baseline, and at time points 0 (T0), 15 (T15), and 30 (T30) min after PAS. MEP amplitudes of each time point were then normalized to the MEP amplitude at baseline for each subject. To maintain a standardized level of attention during the PAS intervention, subjects were instructed to stay alert, voluntarily relax the ADM of the dominant arm, and count the number of ulnar nerve stimulations. Muscle relaxation was continuously monitored by visual feedback from the surface EMG.
Magnetic resonance imaging (MRI)
MRI acquisition
Image data were obtained on a 3.0 T system (Gyroscan Intera T30, Philips Medical System) with a high resolution structural T1‐weighted 3D turbo‐field‐echo sequence for brain volumetry (field‐of‐view of 25.6 × 20.5 × 16 cm3, reconstructed after zero filling to 512 × 410 × 320 cubic voxels with an edge length of 0.5 mm), as well as T2‐weighted (TR 4,459 ms/TE 100 ms) and fluid‐attenuated inversion recovery (FLAIR) imaging (TE 126 ms/TR 10 s/TI 2,200 ms).
For DTI, we employed echo planar imaging (EPI; TR/TE/TI = 10 s/90 ms/2.4 s) with two b factors (0 and 1,000 s/mm2) in six directions, selective averaging of signals obtained at high b (n = 3). Data were acquired with a multislice technique in 72 axial slices 1.8‐mm thick with no gap, field of view 230 × 230 mm, reconstructed to 256 × 256 pixels after zero filling, and voxel edge length of 1.80 × 1.81 × 1.80 mm.
Image analysis.
Quantification of WMH.
Structural MRI analysis was performed by a single experienced observer blinded to clinical data. White matter hyperintensities (WMH) were identified on FLAIR scans. For semiquantitative grading of severity of WMH, we used the modified version [Pantoni et al., 2010] of the scale originally proposed by Fazekas et al. [1987]: 0 = absence of WMH; 1 = punctuate foci below 10 mm, areas of grouped lesions must be smaller than 20 mm in any diameter; 2 = single lesions between 10 and 20 mm, areas of “grouped” lesions more than 20 mm in any diameter; 3 = large confluence of foci, single lesions of more than 20 mm in diameter.
Global volumetric measurements.
Brain tissue volumes, normalized for subject head size, were calculated from the high‐resolution T1‐weighted images, using the cross‐sectional version of the Structural Imaging Evaluation of Normalized Atrophy software [SIENAx; Smith et al., 2002]. After tissue estimation of volumes of gray matter, white matter, and cerebrospinal fluid, a white matter fraction and a gray matter fraction were calculated by dividing the white/gray matter volume by intracranial volume.
Diffusion tensor imaging.
Diffusion tensor and FA field maps were calculated from spatially normalized images after correction for eddy currents, following an optimized procedure. The method was described in detail previously [Deppe et al., 2007, 2008; Mohammadi et al., 2010]. The voxel‐by‐voxel analyses of spatially registered whole brain FA maps were performed using Matlab software (Mathworks, Natick, MA) and Statistical Parametric Mapping (SPM5; Wellcome Department, London; http://www.fil.ion.ucl.ac.uk/spm/). To assess the magnitude of regional FA alterations, we also performed additional quantitative region‐of‐interest (ROI) analyses. Mean FA values were calculated within defined ROIs, which were derived from an averaged and symmetrized (x‐axis) mask of spatially registered FA maps of 160 healthy individuals with FA values >0.4 by deleting voxels not associated with the respective structures. In particular, the internal capsule, corona radiata, corticospinal tract, corpus callosum, genu, splenium, frontal lobe, temporal lobe and occipital lobe, brainstem, cerebellum, and the whole white matter were defined as ROIs (Fig. 1).
Figure 1.

Defined regions of interest (ROI; in red), superimposed on an average FA template of 160 healthy individuals (not shown: ROI of the parietal lobes). [Color figure can be viewed in the online issue, which is available at wileyonlinelibrary.com.]
Statistical Analysis
Differences between the SVD group and controls in neuropsychological test results, imaging data (mean FA values in ROIs, brain volumes, and WMH), and demographic characteristics were assessed either with unpaired t‐tests or with Mann–Whitney U‐tests, as appropriate. Effect of PAS within each group (baseline MEP vs. MEP at time points T0, T15, T30) was tested using paired t‐tests.
Neuropsychological testing
Each single test result was Z‐transformed in correlation to the control group (mean score of 0 and standard deviation of 1). Meaningful composite scores were determined, and each neuropsychological test was assigned to one cognitive domain [see Table I; adapted after Knecht et al., 2008; Peters et al., 2005]. Mean Z‐scores of cognitive domains were subsequently calculated by using the mean Z‐score of each individual test. For timed tests, the sign of the Z‐score was reversed so that improved performance resulted in a higher score in all tests.
PAS‐induced plasticity
MEP amplitudes were measured peak‐to‐peak in each trial before (baseline) and at time points T0, T15, and T30 after intervention. For each time point, they were averaged and normalized to baseline. Repeated measures ANOVAs (ANOVARM) were employed with TIME as the repeated measure (pre, T0, T15, T30) and the between‐subject factor GROUP (SVD group, control group) to test the effects of PAS. Posthoc testing was conducted using unpaired t‐tests. PAS‐induced plasticity was assessed by taking mean of the MEPs measured at time points T0, T15, and T30 (MEAN‐LTP) [Müller‐Dahlhaus et al., 2008]. Values > 1 indicate responders to PAS, whereas values ≤ indicate nonresponders to PAS.
Association between MRI‐data, neuropsychological testing, and PAS‐induced plasticity
To quantify associations between PAS and imaging data (ROI‐FA values, brain volumes), as well as PAS and neuropsychological test scores, Pearson's correlations coefficients were calculated.
Voxelwise differences in FA values between the SVD group and controls were statistically evaluated by analysis of covariance (ANCOVA), modeling age as a covariate to account for the age dependency of FA. Statistical threshold for the voxelwise analysis was set at P < 0.001, corrected for multiple comparison using the false discovery rate method (FDR‐correction), which is a standard approach in Statistical Parametric Mapping (minimum cluster size 25 voxels).
In addition, the regression tool of the SPM5 software was used to correlate FA values across the entire brain on a voxel‐by‐voxel basis with MEAN‐LTP‐values as well as with neuropsychological data. This approach allows for a data‐driven analysis of associations between indicators of brain integrity (i.e., FA values) and clinical variables that does not require an a priori definition of ROIs. Statistical threshold for the correlation analysis was set at P < 0.001 for multiple comparisons (FDR).
Statistical analyses outside of SPM5 were performed using the statistical software R [R Development Core Team, 2010; http://www.r-project.org]. All data are reported as mean ± standard error of the mean and P‐values for statistical significance were set to P < 0.05, unless stated otherwise.
RESULTS
Demographic and clinical characteristics of the SVD and controls are summarized in Table II. The two groups did not differ significantly with regard to age, gender, years of education, MMSE, and BDI scores.
Table II.
Differences in demographics and clinical characteristics between SVD group and controls
| SVD group (mean ± SD) | Control group (mean ± SD) | P | |
|---|---|---|---|
| Age | 72.3 ± 4.3 | 70.6 ± 3.6 | 0.17 |
| Gender | 11 F, 9 M | 10 F, 10 M | |
| YoE | 13 ± 2.6 | 13.45 ± 3.3 | 0.64 |
| MMSE | 29.1 ± 0.9 | 28.7 ± 0.9 | 0.15 |
| BDI | 5.5 ± 4.2 | 4.7 ± 3.6 | 0.6 |
| WMH (Fazekas) | 2.5 ± 0.5 | 0 | <0.001 |
| NIH‐SS | 0 | 0 | 1 |
| mRS | 0 | 0 | 1 |
YoE: years of education; MMSE: mini‐mental‐state‐examination; BDI: Becks depression inventory; WMH: white matter hyperintensities; NIH‐SS: NIH‐Stroke‐Scale; mRS: modified Rankin scale; F = female; M = male. Groups were compared using unpaired t‐tests.
Neuropsychological Testing
Detailed results of the neuropsychological tests of the SVD and control group are shown in Table III. Results of patients and controls were comparable in most cognitive domains; for executive functions, a trendwise decline in function was evident in the SVD group, reaching significance in the Regensburg word fluency test (RWT) for semantic category switching
Table III.
Mean Z‐scores of neuropsychological test results in SVD‐ and control group
| Test domain (Neuropsychological test) | SVD group (mean ± SD) | Control group (mean ± SD) | P |
|---|---|---|---|
| Executive function | −0.87 ± 1.8 | 0.09 ± 0.90 | 0.10 |
| TMT‐A | −0.9 ± 2.05 | 0 ± 1 | 0.07 |
| TMT‐B | −0.79 ± 2.13 | 0 ± 1 | 0.15 |
| Verbal fluency | −0.18 ± 0.72 | 0.02 ± 0.54 | 0.35 |
| RWT‐S‐words | 0.02 ± 0.98 | 0.05 ± 1.15 | 0.94 |
| RWT‐G‐ and R‐words | −0.18 ± 0.93 | 0 ± 1 | 0.57 |
| RWT‐food | 0.18 ± 0.76 | 0 ± 1 | 0.51 |
| RWT‐clothes‐flowers | −0.73 ± 1.10 | 0 ± 1 | 0.03 |
| Verbal memory | 0.11 ± 1.06 | 0 ± 0.77 | 0.71 |
| AVLT. trial 1 | 0.18 ± 1.20 | 0 ± 1 | 0.61 |
| AVLT trail 5 | 0.21 ± 1.41 | 0 ± 1 | 0.58 |
| AVLT. sum trial 1−5 | −0.10 ± 1.77 | 0 ± 1 | 0.82 |
| AVLT trial 7 | 0.31 ± 1.01 | 0 ± 1 | 0.33 |
| AVLT. delayed recall | 0.12 ± 0.96 | 0 ± 1 | 0.71 |
| Visuospatial skills | −0.25 ± 1 | 0.04 ± 0.81 | 0.33 |
| ROCF | −0.40 ± 1.55 | 0 ± 1 | 0.34 |
| ROCF. delayed recall | −0.24 ± 00.77 | 0.08 ± 0.91 | 0.24 |
| Working memory | 0.02 ± 0.83 | −0.01 ± 0.63 | 0.97 |
| WMS‐digit‐span. forward | 0.08 ± 1.88 | 0 ± 1 | 0.86 |
| WMS‐digit‐span. backward | −0.41 ± 1.12 | 0 ± 1 | 0.23 |
| WMS‐block‐span. forward | 0.06 ± 0.87 | 0 ± 1 | 0.84 |
| WMS‐block‐span. backward | 0.36 ± 1.12 | −0.06 ± 1 | 0.14 |
TMT: trail making test; RWT: Regensburger Wortflüssigkeitstest; AVLT: auditory verbal learning test; ROCF: Rey‐Osterrieth complex figure test; WMS: Wechsler memory scale; SD = standard deviation. Groups were compared using unpaired t‐tests.
TMS
rMT at baseline was 43.8% ± 1.30% of maximum stimulator output in the SVD group, and 47.5% ± 1.68% in the control group (diff. n.s.). Baseline MEP were 0.84 ± 0.08 mV in the SVD group and 0.69 ± 0.07 mV in the control group (diff. n.s.). Sixteen subjects of the control group (80%) and 10 subjects of the SVD group (50%) responded to PAS with expected MEP‐increase (as indicated by mean MEP‐changes following PAS, MEAN‐LTP, Fig. 2). PAS induced significant increase in MEP amplitudes in the control group at time points T0 (t (19) = 2.16, P = 0.04) and T15 (t (19) = 2.87, P < 0.01), and at time point T15 (t (19) = 2.17, P = 0.43) in the SVD group (Fig. 3). ANOVARM did not reveal a significant GROUP × TIME‐Interaction, not a significant main effect of GROUP, but a significant main effect on TIME (F (1;36) = 5.55, P = 0.001). Posthoc analysis revealed significant increase of MEP for time points T0 and T15 compared to baseline in the control group, and for time point T15 in the SVD group.
Figure 2.

Mean MEP‐changes (MEAN‐LTP) following PAS in the SVD group and controls. MEAN‐LTP was assessed by the grand average of MEPs at time points T0 to T30, normalized to the baseline MEP. Values > 1 indicate responders to PAS, whereas values ≤ 1 indicate nonresponders to PAS. Although 16 of 20 responded to PAS, only 10 of 20 subjects of the SVD group were responders to PAS.
Figure 3.

Rapid‐onset plasticity in patients and controls. Error bars indicate standard error of the mean. No significant differences between both groups could be observed at each time point. * indicate significant changes in MEPs following PAS within a group, as compared to baseline. * = P < 0.05.
MRI Data
All subjects of the SVD group exhibited extensive WMH (Fazekas Score 2 in 10 subjects, Fazekas Score 3 in 10 subjects; see Table II), whereas no WMH could be detected in the control group.
Differences between groups for global brain volume
There were no differences in brain volumes of subjects of the SVD group (gray matter, WM, relative and normalized brain volumes) compared with controls (Table IV). More WMH were associated with less brain parenchyma volumes in the SVD group; however, these correlations were not significant (all P's > 0.05).
Table IV.
Mean tissue volumes (± SD), obtained from high‐resolution 3D T1‐weighted images
| SVD group | Control group | P | |
|---|---|---|---|
| Normalized total brain volume (ml) | 1,388 ± 75.1 | 1,461 ± 81.2 | >0.05 |
| White matter (ml) | 559.3 ± 43.8 | 566.4 ± 41.4 | >0.05 |
| Gray matter (ml) | 704.3 ± 46.3 | 727.5 ± 37.7 | >0.05 |
| Cerebrospinal fluid (ml) | 284.7 ± 38.5 | 277.1 ± 40.9 | >0.05 |
| Brain percentage (%) | 79.8 ± 1.8 | 80.3 ± 2.1 | >0.05 |
Brain percentage: proportion of GM plus WM to the total intracranial volume.
ml = milliliters.
Differences between groups for global microstructural white matter integrity
Posthoc t‐tests of the SPM‐ANCOVA revealed significant FA reductions in the SVD group, as compared to controls, which covered widespread parts of the brain. FA reductions in the SVD group were most prominent in the corticospinal tracts and commissural fibers (corpus callosum). Posterior circulation territory (cerebellum, brainstem) was less severely affected (Fig. 4). In general, the clusters of FA reductions significantly extended beyond the white matter lesions that showed up on conventional MRI.
Figure 4.

Differences in microstructural white matter integrity. SPM “glass brain” representation (left) and statistical FA maps that were superimposed on an averaged FA template (left) showing clusters of decreased FA in the SVD group compared to controls (ANCOVA, modeling age as a covariate; P < 0.001, corrected for multiple comparison; minimum of 25 contiguous voxels). Colored bars represent t‐values; display threshold is set at t‐value > 3.16. FA values of the SVD group were significantly reduced in white matter areas covering widespread parts of the brain, indicating structural white matter changes extending beyond the white matter lesions that showed up on conventional MRI. [Color figure can be viewed in the online issue, which is available at wileyonlinelibrary.com.]
In ROI analysis, FA values of all brain areas, except the cerebellum, the SVD group differed significantly from the control subjects, indicating widespread microstructural white matter damage. Mean FA values across the entire brain and for the different ROIs are presented in Table V.
Table V.
Fractional anisotrophy of defined regions of interest
| Region of interest | SVD group (mean ± SD) | Control group (mean ± SD) | P |
|---|---|---|---|
| Whole brain | 0.234 ± 0.014 | 0.243 ± 0.009 | 0.02 |
| Internal capsule | 0.388 ± 0.016 | 0.409 ± 0.012 | <0.01 |
| Cerebellum | 0.305 ± 0.018 | 0.316 ± 0.018 | 0.05 |
| Corona radiata | 0.305 ± 0.017 | 0.329 ± 0.010 | <0.01 |
| Corpus callosum | 0.448 ± 0.028 | 0.485 ± 0.025 | <0.01 |
| Corticospinal tract | 0.350 ± 0.016 | 0.368 ± 0.013 | <0.01 |
| Genu | 0.407 ± 0.035 | 0.447 ± 0.037 | <0.01 |
| Brainstem | 0.381 ± 0.021 | 0.396 ± 0.017 | 0.02 |
| Frontal lobe | 0.293 ± 0.019 | 0.313 ± 0.013 | <0.01 |
| Parietal lobe | 0.300 ± 0.017 | 0.323 ± 0.013 | <0.01 |
| Left temporal lobe | 0.326 ± 0.021 | 0.355 ± 0.015 | <0.01 |
| Right temporal lobe | 0.327 ± 0.020 | 0.357 ± 0.018 | <0.01 |
| Occipital lobe | 0.299 ± 0.022 | 0.327 ± 0.015 | <0.01 |
SD = standard deviation; Groups were compared using unpaired t‐tests.
Associations Between MRI‐Data, Neuropsychological Testing, and PAS‐Induced Plasticity
Associations between PAS‐induced measurements and cognitive performance
MEAN‐LTP did not show associations with cognitive domains in the SVD‐ or the control group.
Associations between PAS‐induced measurements and MRI data
Voxelwise regression analysis of FA values and MEAN‐LTP in the SVD group revealed significant clusters of a negative correlation (i.e., more pronounced white matter damage in these areas predicted increased rapid onset cortical plasticity) bilaterally in the parahippocampal area, in the posterior part of the corpus callosum, and in corticospinal tracts (Fig. 5). No positive correlations were found.
Figure 5.

Statistical FA maps that were superimposed on an averaged FA template showing clusters of correlation between MEP changes after PAS and decreased FA values in the SVD group (P < 0.001, minimum of 50 continuous voxels; corrected for multiple comparisons). Colored bars represent t‐values; display threshold is set at t‐value > 3.71. Low FA values particularly in clusters bilaterally in the parahippocampal area, in connecting fibers of the corpus callosum (mainly the posterior part), and parts of the corticospinal tract were associated with greater rapid‐onset cortical plasticity, whereas prefrontal regions did not show this association. [Color figure can be viewed in the online issue, which is available at wileyonlinelibrary.com.]
To test if the association between FA values in parahippocampal areas and MEAN‐LTP could be accounted for by the association between corticospinal tract and MEAN‐LTP, we entered “FA of corticospinal tract” (derived from mean FA values of the corresponding ROI) as a fixed variable into the model. Here, we still found significant clusters of negative correlations between greater rapid‐onset cortical plasticity and lower FA values in the parahippocampal areas and in the posterior part of the corpus callosum, indicating that the association between FA values related to memory impairment and MEAN‐LTP was not only mediated by corticospinal tract deficits (Supporting Information Fig. 1).
Associations between cognitive performance and MRI data
The results of a whole‐brain, voxel‐based analysis of white matter demonstrated significant regions of reduced FA associated with decreased cognitive test results in three of the five tested domains. FA maps showing clusters of correlation between decreased FA and reduced test performance in “working memory” (P < 0.005, > 25 continuous voxels; corrected for multiple comparisons), in “verbal memory,” and in “executive functions” (P < 0.001, > 50 continuous voxels; corrected for multiple comparisons; seeFig. 6). No correlation between FA values and test results of the domains “verbal fluency” and visuospatial skills” were found. None of the voxels exhibited a significant positive correlation between FA scores and neuropsychological test results in any cognitive domain.
Figure 6.
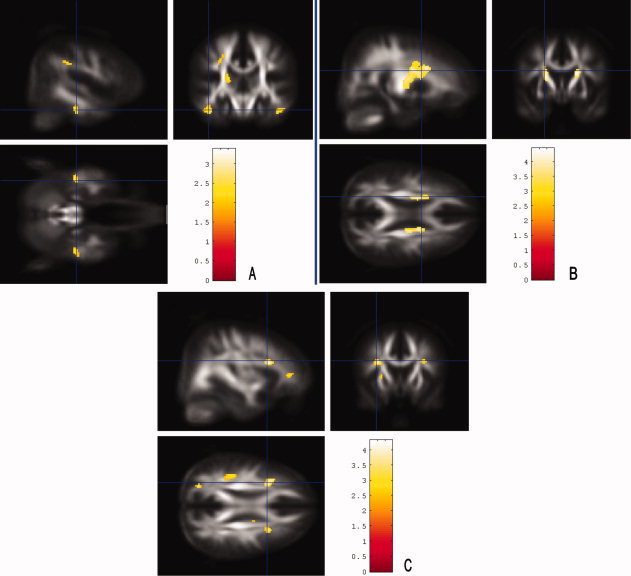
Brain regions in which a reduced FA was associated with decreased cognitive test results in the SVD group. Statistical FA maps that were superimposed on an averaged FA template. Colored bars represent t‐values; display threshold is set at t‐value > 3.71 (B and C) and > 2.34 (A), respectively. A: FA maps showing clusters of correlation between decreased FA and reduced performance in “working memory” (P < 0.005, > 25 continuous voxels; corrected for multiple comparisons). FA values were lower with decreased test results mainly in bilateral parahippocampal clusters. B: Lower FA values were associated with decreased “verbal memory” test results in frontal parts of the corticospinal tract (P < 0.001, > 50 continuous voxels; corrected for multiple comparisons). C: FA values were lower with decreased “executive function” test results in prefrontal regions and in a cluster in the left parietal region (P < 0.001, > 50 continuous voxels; corrected for multiple comparisons). [Color figure can be viewed in the online issue, which is available at wileyonlinelibrary.com.]
DISCUSSION
Two main findings emerged from the present study. First, in our sample of patients with severe SVD, we found both preserved memory functions and relatively preserved rapid‐onset cortical plasticity, as compared to a control group without SVD. Executive functions showed trendwise or significant decreases, in line with previous studies [for review, see O'sullivan, 2010].
Second, within the SVD group, lower integrity in parahippocampal white matter and in posterior parts of the corpus callosum were associated with larger rapid‐onset cortical plasticity.
Rapid‐Onset Cortical Plasticity in Elderly Individuals With Severe Ischemic SVD
Influence of SVD on cortical excitability is still controversial [for review, see Pennisi et al., 2011a]. A relatively consistent result is a reduction of rMT and SAI in SVD with dementia, suggesting a pattern of global increased cortical excitability [Di Lazzaro et al., 2008; Pennisi et al., 2010], similar to what is known in dementia of the Alzheimer type [Pennisi et al., 2011b]. This hyperexcitability has been attributed to enhanced glutamatergic neurotransmission [Bütefisch et al., 2003] and changes in cholinergic transmission [Pennisi et al., 2011a], possibly due to the excitotoxicity that is a major cause of neuronal loss after hypoxic ischemic damage [Won et al., 2002]. Moreover, Di Lazzaro et al. [2008] found a reduction of SAI in a subgroup of their SVD patients with dementia, possibly indicating a reduction of GABAergic intracortical inhibitory mechanism. The impairment in GABAergic function is further supported by studies that showed a bilateral reduction of benzodiazepine receptors in several cortical regions in SVD patients with dementia [Ihara et al., 2004].
A recent study demonstrated that even in SVD patients without dementia, a significant enhancement of intracortical facilitation, as assessed by TMS, was observed [Bella et al., 2011]. The authors hypothesized that this phenomenon may indicate plasticity‐related processes, mediated by glutamate‐dependent NMDA receptor activation. Short intracortical inhibition and cortical silent period, both affected by GABA‐ergic neurotransmission [see review by Pennisi et al., 2011a] were not reduced, though, and SAI not assessed, so further evidence for a reduction of GABAergic function in SVD without dementia was not provided in this study. In our SVD patients that are most comparable to the patients in Bella et al. [2011], more prominent deficits in GABAergic systems are therefore unlikely; however, since there is certainly a continuum of cognitive impairments in SVD, incipient changes in GABAergic systems may well exist.
So far, rapid‐onset cortical plasticity as induced by PAS has not been assessed in SVD with or without dementia. In dementia of the Alzheimer type [Battaglia et al., 2007], rapid‐onset cortical plasticity was reduced. As PAS‐induced cortical plasticity shares distinct physiologic properties with synaptic LTP, it is assumed to be the synaptic basis of memory and learning [Bliss and Collingridge, 1993]. On a systemic level, it has likewise been shown that learning occurs through LTP‐like mechanisms, and can be assessed by the PAS‐protocol [Ziemann et al., 2004].
Our study is the first to report on rapid‐onset cortical plasticity in severe SVD. Here, an interesting pattern emerged. Global ability to induce plasticity was largely preserved in nondemented SVD patients. Furthermore, in those individuals that displayed more severe decreases in white matter integrity of areas known to be associated with memory functions [Rogalski et al., 2009; Stoub et al., 2006; Voineskos et al., 2010], PAS‐induced plasticity was even relatively higher, indicating a possible compensatory mechanism with regard to function. Note that a trend for difference between groups in response to PAS is evident, and responses to PAS vary considerably within the SVD group. Thus, future studies must clarify if larger cohorts would actually reveal a significant difference between groups.
Enhanced Rapid‐Onset Plasticity and Decrease in Specific White Matter Fiber Tracts
The declarative memory system consists of medial temporal lobe structures, mainly hippocampal and parahippocampal areas, and anatomically connected structures [Squire and Zola‐Morgan, 1991]. The medial temporal lobe is known to be affected at an early stage in patients with dementia of the AD type, where impairment of memory encoding is a prominent finding [Frisoni et al., 2010].
In patients with memory deficits who do not reach the criteria for dementia, decrease of structural integrity of white matter in the parahippocampal area have previously been observed. In a voxel‐based morphometry study, Stoub et al. [2006] showed that parahippocampal white matter volume was a significant predictor of declarative memory performance. In a DTI‐Study, Rogalski et al. [2009] reported similar correlations between declarative memory and mean diffusivity in the parahippocampal white matter. For the connecting fibers of the posterior part of the corpus callosum, a recent study by Voineskos et al. [2010] found an association between decline in this fiber tract and reduced memory capacities, as well as some executive functions.
In our patients with SVD and pronounced decreases in white matter integrity in both parahippocampal and posterior corpus callosum fiber tracts, we did not observe a decline in memory functions, compared to patients with less microstructural white matter changes. At the same time, the participants with pronounced decrease in white matter integrity displayed enhanced rapid‐onset cortical plasticity. One intriguing explanation is that an upregulation of cortical plasticity in these subjects may help to prevent decline in memory functions. On the other hand, microstructural changes of prefrontal regions were not correlated with increased rapid‐onset cortical plasticity, and executive functions showed trendwise or significant decreases compared to controls. Thus, rapid‐onset cortical plasticity, assumed to be the synaptic basis of memory and learning [Bliss and Collingridge, 1993], might be an endogenous mechanism to preserve memory functions in the presence of decreased white matter integrity. However, it seems to be less successful in preserving frontal‐executive functions, probably due to the fact that these functions are less dependent on LTP‐like mechanisms [Eisenberg and Berman, 2010; Khan and Muly, 2011].
The mechanisms underlying increased plasticity may include release of neurotrophic factors like BDNF [Mattson et al., 2004], reported previously for activated astrocytes around lacunar lesions [Sato et al., 2009]. In fact, Castel‐Lacanal et al. [ 2007, 2009] demonstrated enhanced cortical plasticity during the recovery phase from lacunar infarctions. Thus, increased BDNF‐levels triggered by small incomplete or complete infarctions may possibly underlie enhanced cortical plasticity, a hypothesis that remains to be tested in future studies though.
Rapid‐Onset Cortical Plasticity in Younger Individuals With Severe Ischemic SVD
Recently, we investigated the impact of ischemic SVD on rapid‐onset cortical plasticity in young to middle‐aged patients with Cerebral Autosomal Dominant Arteriopathy with Subcortical Infarctions and Leucoencephalopathy (CADASIL), a genetically defined variant of SVD. Because of the early age of onset, comorbid conditions from age‐related pathologies in CADASIL are rare, making CADASIL a model for pure ischemic SVD [Dichgans, 2009]. In these patients, we found that—despite widespread decreased white matter integrity—rapid‐onset cortical plasticity was even increased, compared to age‐matched controls. Cognitive as well as motor function were largely preserved [List et al., 2011], likewise suggesting rapid‐onset cortical plasticity as a compensatory mechanism with regard to functional abilities.
The present study in elderly patients thus supports our previous findings with regard to cortical plasticity as a compensatory mechanism in severe SVD. However, cortical plasticity was not enhanced in the elderly group compared to controls, possibly due to an age‐related attenuation of this mechanism. As age‐related decline in cortical plasticity has been well‐documented in animal [Rosenzweig and Barnes, 2003] and human [Müller‐Dahlhaus et al., 2008; Sawaki et al., 2003] studies, a compensatory mechanism of cortical plasticity might be less distinct in older individuals. Also, cognitive decline will be more prominent in patients with severe SVD in the presence of additional neurodegenerative pathology [Black et al., 2009]. In fact, fewer AD‐specific pathological changes are needed for clinical manifestation of dementia in these patients [Vermeer et al., 2003].
Conclusions and Further Implications
By integration of structural and neurophysiological measurements, the present findings corroborate previous studies by showing that even severe decreases in white matter integrity do not necessarily lead to overall cognitive decline. We further provide evidence that increased rapid‐onset plasticity may play an important role in mediating preservation of memory functions. However, cortical plasticity, while being one important means to preserve cognitive functions, will not be the only one. Other mechanisms may include reorganization within large‐scale networks, for example, formation of new connections and recruitment of alternative networks [Park and Reuter‐Lorenz, 2009].
Strategies known to enhance cortical plasticity, including endogenous upregulation of plasticity like physical activity or dietary interventions [Cirillo et al., 2009; Flöel et al., 2010; van Praag, 2009], as well as pharmacological means [Kuo et al., 2008], may serve to ward off memory decline in SVD patients. This hypothesis should now be tested in SVD patients with and without memory decline. Future studies should also assess if reduction of GABAergic‐activity after stroke by interventions like noninvasive brain stimulation [Stagg et al., 2009] would lead to improvement of outcome after stroke and improvement of cognitive performance in vascular cognitive decline.
Supporting information
Additional Supporting Information may be found in the online version of this article.
Supplementary Figure 1: SPM “glass brain” representation (A) and statistical FA maps superimposed on an average FA template (B and C) showing clusters of correlations between MEP changes after PAS and decreased FA values in the SVD group (p < 0.001, minimum of 20 continuous voxels, corrected for multiple comparison). The analysis was adjusted for age and the mean FA of the ROI “corticospinal tract” to rule out an unspecific effect, e.g. a causal relationship between FA deficits of areas more closely related to motor cortex plasticity. Although the significant clusters were less distinct and widespread after the adjustment for corticospinal FA changes, the association between greater rapid‐onset cortical plasticity and lower FA values symmetrically in the parahippocampal area and in the posterior part of the corpus callosum (red circles) was still preserved [using the same p‐values for statistical significance].
REFERENCES
- Arsava EM, Rahman R, Rosand J, Lu J, Smith EE, Rost NS, Singhal AB, Lev MH, Furie KL, Koroshetz WJ, Sorensen AG, Ay H ( 2009): Severity of leukoaraiosis correlates with clinical outcome after ischemic stroke. Neurology 72: 1403–1410. [DOI] [PMC free article] [PubMed] [Google Scholar]
- Aschenbrenner S, Tucha O, Lange K ( 2001): Regensburger Wortflüssigkeitstest (RWT). Göttingen, Bern: Hogrefe‐Verlag GmbH & Co. KG. [Google Scholar]
- Barnes DE, Covinsky KE, Whitmer RA, Kuller LH, Lopez OL, Yaffe K ( 2009): Predicting risk of dementia in older adults: The late‐life dementia risk index. Neurology 73: 173–179. [DOI] [PMC free article] [PubMed] [Google Scholar]
- Battaglia F, Wang HY, Ghilardi MF, Gashi E, Quartarone A, Friedman E, Nixon RA ( 2007): Cortical plasticity in Alzheimer's Disease in humans and rodents. Biol Psychiatry 62: 1405–1412. [DOI] [PubMed] [Google Scholar]
- Bella R, Ferri R, Pennisi M, Cantone M, Lanza G, Malaguarnera G, Spampinato C, Giordano D, Alagona G, Pennisi G ( 2011): Enhanced motor cortex facilitation in patients with vascular cognitive impairment‐no dementia. Neurosci Lett 503: 171–175. [DOI] [PubMed] [Google Scholar]
- Black S, Gao F, Bilbao J ( 2009): Understanding white matter disease: Imaging pathological correlations in vascular cognitive impairment. Stroke 40: S48–S52. [DOI] [PubMed] [Google Scholar]
- Bliss TV, Collingridge GL ( 1993): A synaptic model of memory: Long‐term potentiation in the hippocampus. Nature 361: 31–39. [DOI] [PubMed] [Google Scholar]
- Buonomano DV, Merzenich MM ( 1998): Cortical plasticity: From synapses to maps. Annu Rev Neurosci 21: 149–186. [DOI] [PubMed] [Google Scholar]
- Bütefisch CM, Netz J, Wessling M, Seitz RJ, Hömberg V ( 2003): Remote changes in cortical excitability after stroke. Brain 126: 470–481. [DOI] [PubMed] [Google Scholar]
- Castel‐Lacanal E, Gerdelat‐Mas A, Marque P, Loubinoux I, Simonetta‐Moreau M ( 2007): Induction of cortical plastic changes in wrist muscles by paired associative stimulation in healthy subjects and post‐stroke patients. Exp Brain Res 180: 113–122. [DOI] [PubMed] [Google Scholar]
- Castel‐Lacanal E, Marque P, Tardy J, de Boissezon X, Guiraud V, Chollet F, Loubinoux I, Moreau MS ( 2009): Induction of cortical plastic changes in wrist muscles by paired associative stimulation in the recovery phase of stroke patients. Neurorehabil Neural Repair 23: 366–372. [DOI] [PubMed] [Google Scholar]
- Cirillo J, Lavender AP, Ridding MC, Semmler JG ( 2009): Motor cortex plasticity induced by paired associative stimulation is enhanced in physically active individuals. J Physiol 587: 5831–5842. [DOI] [PMC free article] [PubMed] [Google Scholar]
- Deppe M, Duning T, Mohammadi S, Schwindt W, Kugel H, Knecht S, Ringelstein EB ( 2007): Diffusion‐tensor imaging at 3 T: Detection of white matter alterations in neurological patients on the basis of normal values. Invest Radiol 42: 338–345. [DOI] [PubMed] [Google Scholar]
- Deppe M, Kellinghaus C, Duning T, Moddel G, Mohammadi S, Deppe K, Schiffbauer H, Kugel H, Keller SS, Ringelstein EB. Knecht S ( 2008): Nerve fiber impairment of anterior thalamocortical circuitry in juvenile myoclonic epilepsy. Neurology 71: 1981–1985. [DOI] [PubMed] [Google Scholar]
- Di Lazzaro V, Pilato F, Dileone M, Profice P, Marra, C , Ranieri F, Quaranta D, Gainotti G, Tonali PA ( 2008): In vivo functional evaluation of central cholinergic circuits in vascular dementia. Clin Neurophysiol 119: 2494–2500. [DOI] [PubMed] [Google Scholar]
- Dichgans M ( 2009): Cognition in CADASIL. Stroke 40: S45–S47. [DOI] [PubMed] [Google Scholar]
- Dufouil C, Godin O, Chalmers J, Coskun O, MacMahon S, Tzourio‐Mazoyer N, Bousser MG, Anderson C, Mazoyer B, Tzourio C, PROGRESS MRI Substudy Investigators ( 2009): Severe cerebral white matter hyperintensities predict severe cognitive decline in patients with cerebrovascular disease history. Stroke 40: 2219–2221. [DOI] [PubMed] [Google Scholar]
- Duning T, Kugel H, Knecht S ( 2005): Excellent cognitive performance despite massive cerebral white matter changes. Neuroradiology 47: 749–752. [DOI] [PubMed] [Google Scholar]
- Eisenberg DP, Berman KF ( 2010): Executive function, neural circuitry, and genetic mechanisms in schizophrenia. Neuropsychopharmacology 35: 258–277. [DOI] [PMC free article] [PubMed] [Google Scholar]
- Fazekas F, Chawluk JB, Alavi A, Hurtig HI, Zimmerman RA ( 1987): MR signal abnormalities at 1.5 T in Alzheimer's dementia and normal aging. AJR Am J Roentgenol 149: 351–356. [DOI] [PubMed] [Google Scholar]
- Flöel A, Ruscheweyh R, Krüger K, Willemer C, Winter B, Völker K, Lohmann H, Zitzmann M, Mooren F, Breitenstein C, Knecht S ( 2010): Physical activity and memory functions: Are neurotrophins and cerebral gray matter volume the missing link? Neuroimage 49: 2756–2763. [DOI] [PubMed] [Google Scholar]
- Folstein MF, Folstein SE, McHugh PR ( 1975): “Mini‐mental state”. A practical method for grading the cognitive state of patients for the clinician. J Psychiatr Res 12: 189–198. [DOI] [PubMed] [Google Scholar]
- Frantseva MV, Fitzgerald PB, Möller B, Daigle M, Daskalakis ZJ ( 2008): Evidence for impaired long‐term potentiation in schizophrenia and its relationship to motor skill learning. Cereb Cortex 18: 990–996. [DOI] [PubMed] [Google Scholar]
- Frisoni GB, Fox NC, Jack CR, Scheltens P, Thompson PM ( 2010): The clinical use of structural MRI in Alzheimer disease. Nat Rev Neurol 6: 67–77. [DOI] [PMC free article] [PubMed] [Google Scholar]
- Geerlings MI, Appelman AP, Vincken KL, Mali WP, van der Graaf Y ( 2009): Association of white matter lesions and lacunar infarcts with executive functioning: The SMART‐MR study. Am J Epidemiol 170: 1147–1155. [DOI] [PubMed] [Google Scholar]
- Hautzinger M, Bailer M, Worall H, Keller F ( 1994): Beck‐Depressions‐Inventar (BDI). Bern: Huber. [Google Scholar]
- Helmstaedter C, Lendt M, Lux M ( 2001): Verbaler Lern und Merkfähigkeitstest. Göttingen (Germany): Beltz. [Google Scholar]
- Ihara K, Tomimoto H, Ishizu M, Mukai T, Yoshida H, Sawamoto N, Inoue M, Doi T, Hashikawa K, Konishi J, Shibasaki H, Fukuyama H ( 2004): Decrease in cortical benzodiazepine receptors in symptomatic patients with leukoaraiosis: A positron emission tomography study. Stroke 35: 942–947. [DOI] [PubMed] [Google Scholar]
- Khan ZU, Muly EC ( 2011): Molecular mechanisms of working memory. Behav Brain Res 219: 329–341. [DOI] [PubMed] [Google Scholar]
- Kleim JA, Jones TA ( 2008): Principles of experience‐dependent neural plasticity: Implications for rehabilitation after brain damage. J Speech Lang Hear Res 51: S225–S239. [DOI] [PubMed] [Google Scholar]
- Knecht S, Wersching H, Lohmann H, Bruchmann M, Duning T, Dziewas R, Berger K, Ringelstein EB ( 2008): High normal blood pressure is adapted with poor cognitive performance. Hypertension 51: 663–668. [DOI] [PubMed] [Google Scholar]
- Kuo MF, Paulus W, Nitsche MA ( 2008): Boosting focally‐induced brain plasticity by dopamine. Cereb Cortex 18: 648–651. [DOI] [PubMed] [Google Scholar]
- Lezak MD ( 2004): Neuropsychological Assessment. New York, Oxford: Oxford University Press. [Google Scholar]
- List J, Duning T, Meinzer M, Kürten J, Schirmacher A, Deppe M, Evers S, Young P, Flöel A ( 2011): Enhanced rapid‐onset cortical plasticity in CADASIL as a possible mechanism for preserved cognition. Cereb Cortex 21: 2774–2787. [DOI] [PubMed] [Google Scholar]
- Lyden P, Lu M, Jackson C, Marler J, Kothari R, Brott T, Zivin J ( 1999): Underlying structure of the National Institutes of Health Stroke Scale: Results of a factor analysis. NINDS tPA Stroke Trial Investigators. Stroke 30: 2347–2354. [DOI] [PubMed] [Google Scholar]
- Mattson MP, Maudsle S, Martin B ( 2004): BDNF and 5‐HT: A dynamic duo in age‐related neuronal plasticity and neurodegenerative disorders. Trends Neurosci 27: 589–594. [DOI] [PubMed] [Google Scholar]
- Mohammadi S, Moller HE, Kugel H, Muller DK, Deppe M ( 2010): Correcting eddy current and motion effects by affine whole‐brain registrations: Evaluation of three‐dimensional distortions and comparison with slicewise correction. Magn Reson Med 64: 1047–1056. [DOI] [PubMed] [Google Scholar]
- Müller‐Dahlhaus JF, Orekhov Y, Liu Y, Ziemann U ( 2008): Interindividual variability and age‐dependency of motor cortical plasticity induced by paired associative stimulation. Exp Brain Res 187: 467–475. [DOI] [PubMed] [Google Scholar]
- O'Brien JT, Erkinjuntti T, Reisberg B, Roman G, Sawada T, Pantoni L, Bowler JV, Ballard C, DeCarli C, Gorelick PB, Rockwood K, Burns A, Gauthier S, DeKosky ST ( 2003): Vascular cognitive impairment. Lancet Neurol 2: 89–98. [DOI] [PubMed] [Google Scholar]
- O'sullivan M ( 2008): Leukoaraiosis. Pract Neurol 8: 26–38. [DOI] [PubMed] [Google Scholar]
- O'sullivan M ( 2010): Imaging small vessel disease: Lesion topography, networks, and cognitive deficits investigated with MRI. Stroke 41: S154–S158. [DOI] [PubMed] [Google Scholar]
- Oldfield RC ( 1971): The assessment and analysis of handedness: The Edinburgh inventory. Neuropsychologia 9: 97–113. [DOI] [PubMed] [Google Scholar]
- Osterrieth P ( 1944): Le test de copie d'une figure complexe. Arch Psychol 30: 286–350. [Google Scholar]
- Pantoni L, Pescini F, Nannucci S, Sarti C, Bianchi S, Dotti MT, Federico A, Inzitari D ( 2010): Comparison of clinical, familial, and MRI features of CADASIL and NOTCH3‐negative patients. Neurology 74: 57–63. [DOI] [PubMed] [Google Scholar]
- Park DC, Reuter‐Lorenz P ( 2009): The adaptive brain: Aging and neurocognitive scaffolding. Annu Rev Psychol 60: 173–196. [DOI] [PMC free article] [PubMed] [Google Scholar]
- Pennisi G, Ferri R, Alagona G, Pennisi M, Malaguarnera G, Motta M, Bella R ( 2011): Motor cortex hyperexcitability in subcortical ischemic vascular dementia. Arch Gerontol Geriatr 53: e111–e113. [DOI] [PubMed] [Google Scholar]
- Pennisi G, Ferri R, Cantone M, Lanza G, Pennisi M, Vinciguerra L, Malaguarnera G, Bella R ( 2011a): A review of transcranial magnetic stimulation in vascular dementia. Dement Geriatr Cogn Disord 31: 71–80. [DOI] [PubMed] [Google Scholar]
- Pennisi G, Ferri R, Lanza G, Cantone M, Pennisi M, Puglisi V, Malaguarnera G, Bella R ( 2011b): Transcranial magnetic stimulation in Alzheimer's Disease: A neurophysiological marker of cortical hyperexcitability. J Neural Transm 118: 587–598. [DOI] [PubMed] [Google Scholar]
- Peters N, Opherk C, Danek A, Ballard C, Herzog J, Dichgans M ( 2005): The pattern of cognitive performance in CADASIL: A monogenic condition leading to subcortical ischemic vascular dementia. Am J Psychiatry 162: 2078–2085. [DOI] [PubMed] [Google Scholar]
- R Development Core Team ( 2010): R: a language and environment for statistical computing. Vienna (Austria): R Foundation for Statistical Computing.
- Reddy H, Stefano ND, Mortilla M, Federico A, Matthews PM ( 2002): Functional reorganization of motor cortex increases with greater axonal injury from CADASIL. Stroke 33: 502–508. [DOI] [PubMed] [Google Scholar]
- Rioult‐Pedotti MS, Friedman D, Donoghue JP ( 2000): Learning‐induced LTP in neocortex. Science 290: 533–536. [DOI] [PubMed] [Google Scholar]
- Rogalski EJ, Murphy CM, deToledo‐Morrell L, Shah RC, Moseley ME, Bammer R, Stebbins GT ( 2009): Changes in parahippocampal white matter integrity in amnestic mild cognitive impairment: a diffusion tensor imaging study. Behav Neurol 21: 51–61. [DOI] [PMC free article] [PubMed] [Google Scholar]
- Rosenberg GA ( 2009): Inflammation and white matter damage in vascular cognitive impairment. Stroke 40: S20–S23. [DOI] [PMC free article] [PubMed] [Google Scholar]
- Rosenzweig ES, Barnes CA ( 2003): Impact of aging on hippocampal formation: Plasticity, network dynamics and cognition. Prog Neurobiol 69: 143–179. [DOI] [PubMed] [Google Scholar]
- Sato Y, Chin Y, Kato T, Tanaka Y, Tozuka Y, Mase M, Ageyama N, Ono F, Terao K, Yoshikawa Y, Hisatsune T ( 2009): White matter activated glial cells produce BDNF in a stroke model of monkeys. Neurosci Res 65: 71–78. [DOI] [PubMed] [Google Scholar]
- Sawaki L, Yaseen Z, Kopylev L, Cohen LG ( 2003): Age‐dependent changes in the ability to encode a novel elementary motor memory. Ann Neurol 53: 521–524. [DOI] [PubMed] [Google Scholar]
- Smith SM, Zhang Y, Jenkinson M, Chen J, Matthews PM, Federico A, Stefano ND ( 2002): Accurate, robust, and automated longitudinal and cross‐sectional brain change analysis. Neuroimage 17: 479–489. [DOI] [PubMed] [Google Scholar]
- Squire LR, Zola‐Morgan S ( 1991): The medial temporal lobe memory system. Science 253: 1380–1386. [DOI] [PubMed] [Google Scholar]
- Stagg CJ, Best JG, Stephenson MC, O'Shea J, Wylezinska M, Kincses ZT, Morris PG, Matthews PM, Johansen‐Berg H ( 2009): Polarity‐sensitive modulation of cortical neurotransmitters by transcranial stimulation. J Neurosci 29: 5202–5206. [DOI] [PMC free article] [PubMed] [Google Scholar]
- Stefan K, Kunesch E, Cohen LG, Benecke R, Classen J ( 2000): Induction of plasticity in the human motor cortex by paired associative stimulation. Brain 123: 572–584. [DOI] [PubMed] [Google Scholar]
- Stoub TR, deToledo‐Morrell L, Stebbins GT, Leurgans S, Bennett DA, Shah RC ( 2006): Hippocampal disconnection contributes to memory dysfunction in individuals at risk for Alzheimer's disease. Proc Natl Acad Sci USA 103: 10041–10045. [DOI] [PMC free article] [PubMed] [Google Scholar]
- Tombaugh TN ( 2004): Trail Making Test A and B: normative data stratified by age and education. Arch Clin Neuropsychol 19: 203–214. [DOI] [PubMed] [Google Scholar]
- van Praag H ( 2009): Exercise and the brain: Something to chew on. Trends Neurosci 32: 283–290. [DOI] [PMC free article] [PubMed] [Google Scholar]
- van Swieten JC, Koudstaal PJ, Visser MC, Schouten HJ, van Gijn J ( 1988): Interobserver agreement for the assessment of handicap in stroke patients. Stroke 19: 604–607. [DOI] [PubMed] [Google Scholar]
- Vermeer SE, Prins ND, den Heijer T, Hofman A, Koudstaal PJ, Breteler MM ( 2003): Silent brain infarcts and the risk of dementia and cognitive decline. N Engl J Med 348: 1215–1222. [DOI] [PubMed] [Google Scholar]
- Voineskos AN, Rajji TK, Lobaugh NJ, Miranda D, Shenton ME, Kennedy JL, Pollock BG, Mulsant BH ( 2012): Age‐related decline in white matter tract integrity and cognitive performance: A DTI tractography and structural equation modeling study. Neurobiol Aging 33: 21–34. [DOI] [PMC free article] [PubMed] [Google Scholar]
- Weise D, Schramm A, Stefan K, Wolters A, Reiners K, Naumann M, Classen J ( 2006): The two sides of associative plasticity in writer's cramp. Brain 129: 2709–2721. [DOI] [PubMed] [Google Scholar]
- Won SJ, Kim DY, Gwag BJ ( 2002): Cellular and molecular pathways of ischemic neuronal death. J Biochem Mol Biol 35: 67–86. [DOI] [PubMed] [Google Scholar]
- Ziemann U, Ilíc TV, Pauli C, Meintzschel F, Ruge D ( 2004): Learning modifies subsequent induction of long‐term potentiation‐like and long‐term depression‐like plasticity in human motor cortex. J Neurosci 24: 1666–1672. [DOI] [PMC free article] [PubMed] [Google Scholar]
Associated Data
This section collects any data citations, data availability statements, or supplementary materials included in this article.
Supplementary Materials
Additional Supporting Information may be found in the online version of this article.
Supplementary Figure 1: SPM “glass brain” representation (A) and statistical FA maps superimposed on an average FA template (B and C) showing clusters of correlations between MEP changes after PAS and decreased FA values in the SVD group (p < 0.001, minimum of 20 continuous voxels, corrected for multiple comparison). The analysis was adjusted for age and the mean FA of the ROI “corticospinal tract” to rule out an unspecific effect, e.g. a causal relationship between FA deficits of areas more closely related to motor cortex plasticity. Although the significant clusters were less distinct and widespread after the adjustment for corticospinal FA changes, the association between greater rapid‐onset cortical plasticity and lower FA values symmetrically in the parahippocampal area and in the posterior part of the corpus callosum (red circles) was still preserved [using the same p‐values for statistical significance].