

Abstract
During the first 6–7 years of life children undergo a period of major neurocognitive development. Higher‐order cognitive functions such as executive control of attention, encoding and retrieving of stored information and goal‐directed behavior are present but less developed compared to older individuals. There is only very limited information from functional magnetic resonance imaging (fMRI) studies about the level of organization of functional networks in children in the early school period. In this study we perform continuous resting‐state functional connectivity MRI in 5‐ to 8‐year‐old children in an awake state to identify and characterize resting‐state networks (RSNs). Temporal concatenation independent component analysis (ICA) approach was applied to analyze the data. We identified 14 components consisting of regions known to be involved in visual and auditory processing, motor function, attention control, memory, and the default mode network (DMN). Most networks, in particular those supporting basic motor function and sensory related processing, had a robust functional organization similar to mature adult patterns. In contrast, the DMN and other RSNs involved in higher‐order cognitive functions had immature characteristics, revealing incomplete and fragmented patterns indicating less developed functional connectivity. We therefore conclude that the DMN and other RSNs involved in higher order cognitive functioning are detectable, yet in an immature state, at an age when these cognitive abilities are mastered. Hum Brain Mapp, 2011. © 2011 Wiley‐Liss, Inc.
Keywords: children, development, resting state, functional connectivity, functional MRI, resting state networks
INTRODUCTION
Functional neuroimaging studies in infants and adolescents have demonstrated that age‐related improvement in sensorimotor and cognitive performance parallel the development of functional networks within the brain [Crone et al., 2004; Durston et al., 2006; Konrad et al., 2005; Lin et al., 2008; Liu et al., 2008; Rubia et al., 2006]. During the first 6–7 years of life children undergo a period of major neurocognitive development. By the time children reach school age, important cognitive functions such as attention and the ability to encode and recollect past experiences are acquired [Davidson et al., 2006; Schneider et al., 2004]. In contrast, other cognitive functions such as the executive control of attention, the ability to suppress inappropriate responses and thoughts, cognitive flexibility, and working memory are present but less well developed compared to older individuals [Crone et al., 2004; Davidson et al., 2006; Rubia et al., 2006]. Unfortunately, there is only very limited information from functional MRI studies regarding the level of organization of functional networks in children in the early school period.
A number of structural magnetic resonance imaging (MRI) studies in this age group have demonstrated that maturation of primary sensory and motor areas precedes maturation of association areas involved in cognitive functioning [Giedd et al., 1999; Gogtay et al., 2004; Volpe, 2000]. Diffusion tensor imaging (DTI) MRI studies have shown a similar trend in the myelination of white matter tracts [Hermoye et al., 2006; Huang et al., 2006; Lebel et al., 2008]. This sequence of structural brain development parallels the order of achieving important developmental milestones, during which sensory and motor function skills are obtained before the mastering of major cognitive abilities.
Although functional MRI (fMRI) studies have been performed in children as young as 4‐years old, investigating brain function with fMRI in these children is complex [Bunge and Wright, 2007; De Bie et al., 2010a]. Children in this age group can be anxious and unwilling to enter the MRI scanner [Bunge and Wright, 2007; Davidson et al., 2006]. Additionally, limited attention span and low accuracy with respect to task performance together with excessive head motion are potential complicating factors affecting the quality of the data and ultimately complicating its interpretation. In contrast to task‐related fMRI studies, resting state fMRI does not require a task which is a significant benefit in young children.
Resting‐state functional connectivity MRI (rs‐fcMRI) measures correlations in spontaneous low‐frequency (<0.1 Hz) blood oxygenation level dependent (BOLD) signal fluctuations in anatomically distant cortical regions generated in the absence of salient stimuli or cognitive goal‐driven behavior i.e., a cognitive task [Biswal et al., 1995; Fox and Raichle, 2007]. Correlated patterns of BOLD signal fluctuations between spatially remote brain regions generally indicate coherent neuronal activity underlying interregional communication [Auer, 2008]. These regions are said to be functionally connected, and are regarded as intrinsic connectivity networks or resting state networks (RSNs) [Seeley et al., 2007]. Remarkably, most RSNs show a striking spatial correspondence with known functional systems activated in task‐based fMRI paradigms [Biswal et al., 1995]. Therefore, rs‐fcMRI is a promising tool to study the basal activity of the brain and the development of functional brain networks in young children [Bunge and Wright, 2007].
Multiple RSNs have been identified in the adult population involved in a wide array of brain functions [Beckmann et al., 2005; Damoiseaux et al., 2006; De Luca et al., 2006; Mantini et al., 2007; Van den Heuvel et al., 2008]. One of these networks is the default mode network (DMN) [Greicius et al., 2003; Raichle et al., 2001]. The DMN is active when individuals do not focus on the external environment. In contrast to other networks, the DMN shows suspended instead of increased activity during goal directed tasks [Raichle et al., 2001]. Several perspectives have been provided regarding the role of the DMN in cognition including self‐referential thought, episodic memory and mentalizing [Greicius et al., 2003; Gusnard et al., 2001; Mason et al., 2007]. Other RSNs comprise attention control networks and networks involved in sensory‐ and motor‐related processing have been identified [Beckmann et al., 2005; Damoiseaux et al., 2006; Dosenbach et al., 2007; Seeley et al., 2007; Sridharan et al., 2008].
To date, few rs‐fcMRI studies have been performed in children. Data in 0‐ to 2‐year‐old children have been obtained during natural sleep or with mild sedation [Fransson et al., 2007, 2010; Gao et al., 2009; Kiviniemi et al., 2000; Lin et al., 2008; Liu et al., 2008; Smyser et al., 2010]. Under these conditions, several RSNs have been identified. Importantly, some but not all adult RSNs could be demonstrated in these young children. RSNs identified in young children include sensorimotor, primary visual and auditory networks and precursors of the DMN. Functional connectivity in the infant brain is largely confined to interhemispheric homotopic connections [Fransson et al., 2010; Gao et al., 2009; Smyser et al., 2010]. In contrast, RSNs in adults show both interhemispheric and intrahemispheric connectivity along the anterior–posterior direction, reflecting long‐range cortico‐cortical connectivity [Fair et al., 2007].
In older children, around 8 years of age, resting‐state studies indicate that these networks have a robust functional organization but still show immature characteristics [Fair et al., 2009; Jolles et al., 2010; Supekar et al., 2009]. These immature characteristics concern incomplete or redundant architecture of the RSNs, weaker within‐network connectivity and the presence of bridge connections between regions of separate networks. In general, the development of RSNs into mature patterns from childhood throughout adolescence toward adulthood follows a regionally specific maturation process. This maturation process is characterized by functional integration (development of long‐range functional connections and increase in connection strength of these long‐range connections) and segregation (selective decrease of connections between anatomically clustered regions and increased connectivity within such regions) [Fair et al., 2007].
The identification of RSNs is of specific interest in children who are 5–8 years, a time period when major cognitive abilities are being acquired. To our knowledge, such studies have not been published. In the present study we performed continuous rs‐fcMRI in an awake non‐sedated state in this age group. Data were analyzed using independent component analysis (ICA). ICA is a data‐driven multivariate analysis method that decomposes the four‐dimensional (brain volume over time) BOLD signal into a set of spatial maps (components) of distinct brain regions with similar temporal patterns of haemodynamic signal fluctuation [Beckmann et al., 2005; Calhoun et al., 2008; McKeown et al., 1998].
On the basis of neurocognitive abilities present in this group, we hypothesized that most RSNs are already present in 5‐ to 8‐year‐old children. Furthermore, we expected the organization of networks to be less mature compared to older children and adults.
MATERIALS AND METHODS
Subjects
The present study is part of a longitudinal study on effects of growth hormone therapy on brain development and cognition in children born small for gestational age (SGA) (Dutch Trial Register: NTR 865). In the longitudinal study short SGA children with persistent short stature are receiving growth hormone and are compared to two control groups: (1) SGA born children with postnatal catch‐up growth (SGA+) and (2) children born appropriate for gestational age (AGA). For the purpose of the present study we included only children belonging to either one of the control groups. The children born SGA with persistent short stature were excluded. Twenty‐three healthy children participated in this study. Data from five children were excluded because of excessive motion (see below for further details). Mean age of the remaining 18 subjects was 6.7 years (standard deviation 0.8; range 5.1–8.1, 12 girls, 6 boys) of whom 6 children belonged to the AGA group and twelve to the SGA+ group. Boys and girls were equally divided over the groups. Mean IQ was 110 (range 89–132) and did not differ significantly between the two control groups [AGA: 115 (SD ± 12.4) vs. SGA+: 107 (SD ± 14.4)] nor did the ages (AGA: 6.7 years (SD ± 0.8) vs. SGA+: 6.8 years (SD ± 0.8)).
A group of 18 sex matched healthy adults (mean age 30.2 years, range 24.2–36.1 years; 12 women, 6 men) described previously as a healthy control group by Roosendaal et al. was used as a reference group [Roosendaal et al., 2010]. Scans were acquired on the same MRI scanner and analyzed using identical pre and post processing tools.
The study was approved by the ethics committee of the VU University Medical Center, Amsterdam, The Netherlands. Written informed consent was obtained from the parents or guardians of each child. The study was performed at the VU University Medical Center.
Mock Scanner Training Session
Movement artifacts are a fundamental source of noise when acquiring magnetic resonance images in this young population. To ensure good quality of the data throughout the relatively long scanning session, children practiced the scanning session in a mock scanner under supervision of a pediatrician or a neuropsychologist [De Bie et al., 2010a]. Closely resembling the MRI scanner used for the image acquisition, the mock scanner is equipped with a manually operated patient table, head coil, foam cushions, headphones, and earplugs. Speakers inside the bore reproduce the sounds of various scan sequences that can be heard during actual MRI investigations. Children that performed well during the training session also performed well during the actual scanning session.
Imaging Methods
All subjects underwent an fMRI session of ∼30 min. In this session the children underwent a picture encoding task and a high resolution anatomical scan prior to resting‐state investigation. Results of this part of the study will not be reported in this article. For resting‐state acquisition, children were instructed to lie as still as possible with their eyes closed and not fall asleep, while the light was switched off—this procedure was extensively trained in the mock scanning session. To ensure the child's comfort, a parent and a pediatrician or neuropsychologist sat next to the child in the scanner room during the scanning session. Children wore earplugs and headphones to reduce noise. Head movement was minimized by placing soft pads at the sides of the head. Functional and anatomical images were acquired on a 1.5‐T Sonata scanner (Siemens, Erlangen, Germany). For the resting‐state sequence, 200 whole‐brain echo‐planar imaging (EPI) images sensitive to BOLD contrast were acquired in 6.08 min with the following sequence parameters: 23 slices; repetition time (TR) 1,820 ms; echo time (TE) 60 ms; voxel size 3.0 × 3.0 × 4.0 mm3; flip angle 90°. A high‐resolution T1‐weighted scan using a 3D Magnetization Prepared Rapid Gradient Echo (MPRAGE) sequence was acquired to enable anatomical registration of functional data [Mugler and Brookeman, 1990]. The sequence parameters of the T1‐weighted images were TR 2,700 ms; TE 3.97 ms; voxel size 1.0 × 1.0 × 1.5 mm3; flip angle 8°; 160 coronal slices.
Data Analysis
Pre‐processing
Scans were visually inspected by a radiologist for structural abnormalities (FB). For pre‐processing of the functional images of each subject, FSL (FMRIB's Software Library, http://www.fmrib.ox.ac.uk/fsl) was used [Smith et al., 2004]. The following pre‐statistics processing was applied; motion correction using MCFLIRT [Jenkinson et al., 2002]; removal of non‐brain structures from the echo planar imaging volumes using BET [Smith, 2002]; spatial smoothing using a Gaussian kernel of FWHM 4.0 mm; grand‐mean intensity normalization of the entire 4D dataset by a single multiplicative factor; high pass temporal filtering (100 s). Children were excluded if maximum displacement exceeded 4 mm; relative mean displacement and absolute mean displacement of the remaining children were 0.1 mm (range 0.06–0.18) and 0.38 mm (range 0.1–0.92), respectively.
Custom pediatric template
There is no reference brain as a standard for children's brains in this age group. The use of adult reference data has the potential of introducing severe bias into pediatric imaging data [Hoeksma et al., 2005; Wilke et al., 2002]. It is therefore recommended to use a custom template [Fonov et al., 2010; Wilke et al., 2002; Yoon et al., 2009]. To create a custom template for this study we used a similar technique as has been previously described in patients with Alzheimer's disease [Good et al., 2001; Senjem et al., 2005]. First, we performed an affine registration of each subject's T1 image to the MNI‐space T1 standard brain template, using FLIRT (FMRIB version 5.92, Oxford, UK). Next, a pediatric custom template incorporating average size and shape characteristics of this children population was created using the group mean inverse transformation matrix. Finally, each subject's T1 was registered to this new custom template.
Statistical analysis
First, we performed a single‐subject ICA [Beckmann and Smith, 2004] to detect different types of signal fluctuations without a time series model [Beckmann and Smith, 2004; McKeown et al., 1998]. This analysis results in different spatiotemporal components. In addition to the standard motion correction approach described in the pre‐processing section we performed an additional artifact removal approach [Foerde et al., 2006]. Spatiotemporal components corresponding to motion‐related artifacts were identified based on spatial patterns and temporal characteristics [Beckmann et al., 2000, 2005]. The corresponding signals were removed from the original sequences (fsl regfilt, FSL functions library). For the group analysis, a multi‐session temporal concatenation ICA approach was applied on the pre‐processed data [Calhoun et al., 2001]. Twenty‐eight components were estimated of which 14 were selected by visual inspection as anatomically relevant areas across subjects, potentially reflecting functionally relevant RSNs. The remaining 14 components were discarded as largely reflecting head motion, physiological noise, or image fluctuations in cerebral spinal fluid.
Posthoc Analysis
Subgroup analysis
Subgroup analysis was performed with a factorial analysis using a group‐level GLM in Melodic (FMRIB Version 5.92,Oxford, UK; FSL).
Dual Regression Analysis
To allow statistical generalization of the results to the entire study population a dual regression analysis was performed using the group ICA estimates and the single‐subject data sets, to identify the effect size of each component in subject‐specific data [Beckmann et al., 2009; Filippini et al., 2009; Zuo et al., 2010]. The dual regression procedure consists of a spatial regression using the ICA maps as regressors and yielding representative time courses for each component, followed by temporal regression using the representative time courses as regressors [Beckmann et al., 2009]. The resulting maps are voxelwise regression coefficients of each component's representative time course. The dual regression procedure as implemented in FSL is followed by a nonparametric significance test, but this test is based on random permutation of patient group labels, which cannot be used in a single‐sample test. Therefore, we subsequently produced a group T‐map from each component's dual regression map, which was then thresholded at P = 0.05 using Bonferroni correction for multiple comparisons.
RESULTS
Structural abnormalities were absent. Spatial maps of the coherent resting fluctuations are shown in Figure 1. The 14 components showed slow‐wave oscillations with a strong power in the range of 0.01–0.1 Hz. The panels are ordered based on the percentage of explained variance (Table I). Detailed information regarding the major clusters of coherent resting fluctuations is summarized in Table I. MNI coordinates of the clusters are included in Table I. The spatial maps of the resting‐state fluctuations are described below.
Figure 1.
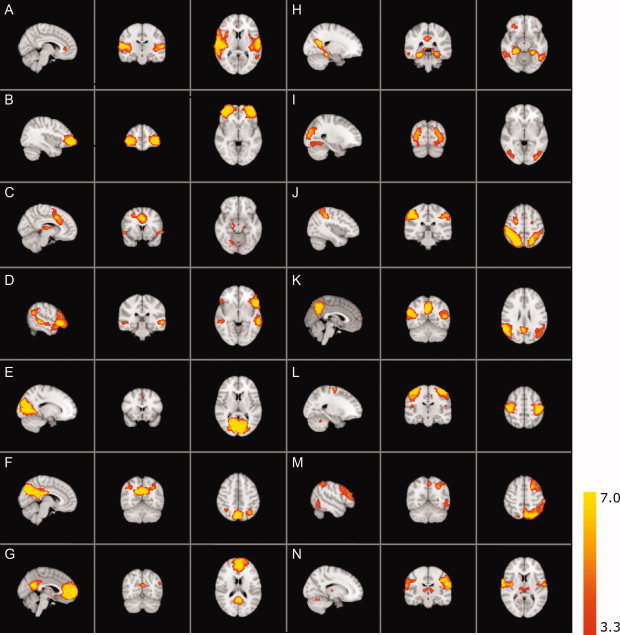
Resting‐state networks. Resting‐state networks estimated with ICA: Images are Z statistics overlaid on the high resolution children's reference brain. The connectivity maps are thresholded at P < 0.001. The connectivity Z scores, values ranging from 3.3 to 7.0, are displayed in red‐to‐yellow (see color scale). Images are presented in radiological convention. [Color figure can be viewed in the online issue, which is available at wileyonlinelibrary.com.]
Table I.
Major clusters with MNI coordinates, Z scores, and corresponding anatomical regions of the RSNs as shown in Figure 1
| Explained variancea (%) | Total varianceb (%) | Cluster | Voxels (mm) | Z max | x (mm) | y (mm) | z (mm) | Anatomical regionc | |
|---|---|---|---|---|---|---|---|---|---|
| RSN A | 7.53 | 2.99 | 1 | 6,454 | 9.63 | 60 | −12 | 8 | Central opercular cortex, superior temporal gyrus, anterior division through posterior |
| 2 | 42 | 4.07 | 6 | 36 | 4 | Cingulate gyrus, anterior division R | |||
| 3 | 8 | 3.77 | 2 | −8 | 52 | Supplementary motor area | |||
| RSN B | 6.49 | 2.58 | 1 | 3,481 | 10.4 | −34 | 60 | −2 | Inferior frontal gyrus, polar part extending into the middle frontal gyrus |
| 2 | 3 | 3.51 | 42 | 18 | −4 | Insular cortex R | |||
| RSN C | 6.23 | 2.47 | 1 | 3,459 | 8.25 | 2 | 14 | 40 | Cingulate gyrus, anterior division, paracingulate gyrus, supplementary motor cortex |
| 2 | 947 | 5.77 | 2 | −18 | 12 | Thalamus | |||
| 3 | 746 | 5.43 | 30 | −70 | −24 | Cerebellum | |||
| 4 | 220 | 4.66 | −32 | 38 | 36 | Middle frontal gyrus | |||
| 5 | 219 | 5.25 | −56 | 12 | −4 | Operculum of the inferior frontal gyrus | |||
| 6 | 55 | 3.94 | −2 | −64 | 56 | precuneus cortex† | |||
| 7 | 35 | 4.22 | −2 | −78 | −10 | Lingual gyrus | |||
| 8 | 34 | 4.39 | −26 | 0 | 44 | Precentral gyrus L† | |||
| 9 | 28 | 3.92 | 16 | −26 | −10 | Parahippocampal gyrus | |||
| 10 | 14 | 3.73 | −38 | −74 | −42 | Cerebellum L | |||
| 11 | 21 | 3.61 | −38 | 20 | 0 | Insular cortex | |||
| 12 | 9 | 3.61 | 16 | −14 | −14 | Hippocampus R† | |||
| 13 | 6 | 3.58 | −10 | −4 | 62 | Superior frontal gyrus | |||
| RSN D | 5.77 | 2.29 | 1 | 5,298 | 9.43 | −54 | 22 | −4 | Inferior frontal gyrus, pars triangularis, orbitofrontal cortex |
| 2 | 2,671 | 7.04 | −6 | 44 | 40 | Paracingulate gyrus | |||
| 3 | 194 | 4.66 | 54 | −34 | −4 | Middle temporal gyrus, mid and posterior division including temporoparietal junction and superior temporal sulcus | |||
| 4 | 83 | 4.19 | −8 | −44 | 30 | Precuneus L | |||
| 5 | 34 | 4.2 | −2 | −14 | 36 | Cingulate gyrus, posterior division L | |||
| RSN E | 4.81 | 1.91 | 1 | 11,158 | 12.9 | 12 | −74 | 8 | Intracalcarine cortex (visual cortex) |
| 2 | 24 | 3.88 | −2 | 18 | 44 | Paracingulate gyrus | |||
| RSN F | 4.59 | 1.82 | 1 | 7,258 | 15.6 | 4 | −74 | 38 | Posterior cingulate cortex/ precuneus |
| 2 | 232 | 4.83 | 42 | −56 | 40 | Angular gyrus | |||
| RSN G | 4.17 | 1.66 | 1 | 8,829 | 11.3 | −2 | 56 | 2 | Pregenual cingulate gyrus, frontal pole, medial and dorsal prefrontal cortex |
| 2 | 1,942 | 7.47 | 2 | −52 | 24 | Precuneus | |||
| 3 | 141 | 4.21 | −42 | −74 | 34 | Inferior parietal cortex | |||
| 4 | 39 | 4.02 | 20 | 34 | 48 | Superior frontal gyrus | |||
| 5 | 9 | 3.57 | 28 | −46 | 60 | Superior parietal cortex R | |||
| 6 | 2 | 3.48 | 60 | −18 | −18 | Middle temporal gyrus | |||
| RSN H | 4 | 1.59 | 1 | 7,462 | 10.3 | −10 | −56 | 12 | Precuneus continuous with parahippocampal gyrus bilateral. The right hemisphere activity also incudes posterior hippocampus |
| 2 | 1,925 | 7.25 | 46 | 34 | 18 | Middle frontal gyrus R | |||
| 3 | 1,738 | 9.19 | −38 | −78 | 26 | Lateral occipital cortex, superior division, Inferior parietal cortex | |||
| 4 | 533 | 6.21 | −50 | −58 | −10 | Inferior temporal gyrus, temporooccipital part | |||
| 5 | 171 | 4.93 | 32 | 36 | −10 | Orbitofrontal cortex | |||
| 6 | 69 | 4.12 | −24 | 30 | 40 | Superior frontal gyrus, dorsolateral prefrontal cortex | |||
| 7 | 18 | 3.62 | −50 | 42 | 0 | Inferior frontal gyrus | |||
| 8 | 4 | 3.38 | 2 | 16 | −10 | Subcallosal cortex | |||
| RSN I | 3.56 | 1.41 | 1 | 2,440 | 7.06 | −32 | −84 | 8 | Lateral occipital cortex |
| 2 | 92 | 4.27 | 26 | −60 | −10 | Temporal occipital fusiform cortex | |||
| RSN J | 2.87 | 1.14 | 1 | 6,860 | 11.1 | 46 | −38 | 52 | Supramarginal gyrus, posterior division, superior parietal lobule |
| 2 | 503 | 5.98 | 28 | −4 | 54 | Superior frontal gyrus, precentral gyrus | |||
| 3 | 378 | 5.89 | 54 | −54 | −10 | Inferior temporal gyrus, temporooccipital part | |||
| 4 | 144 | 4.92 | 46 | 44 | 18 | Lateral prefrontal cortex R | |||
| 5 | 138 | 4.29 | 56 | 10 | 12 | Precentral gyrus | |||
| RSN K | 2.54 | 1.01 | 1 | 3,111 | 7.92 | 58 | −52 | 24 | Angular gyrus |
| 2 | 2,524 | 9.37 | 2 | −58 | 38 | Precuneus | |||
| 3 | 355 | 5.19 | 26 | 34 | 44 | Superior frontal gyrus R† | |||
| 4 | 56 | 4.08 | 46 | −30 | −8 | Middle temporal gyrus, temporooccipital part R | |||
| 5 | 11 | 3.58 | −30 | −36 | 38 | Superior parietal lobule L | |||
| 6 | 1 | 3.3 | 2 | 52 | 10 | Paracingulate gyrus R† | |||
| RSN L | 2.17 | 0.86 | 1 | 3,123 | 8.96 | 46 | −26 | 60 | Postcentral gyrus and precentral gyrus |
| 3 | 46 | 3.86 | −22 | −54 | −30 | Cerebellum | |||
| 4 | 33 | 3.93 | 50 | −18 | 14 | Parietal operculum cortex | |||
| 7 | 2 | 3.48 | −12 | −18 | 48 | Supplementary motor cortex | |||
| 8 | 2 | 3.34 | 50 | 14 | 32 | Middle frontal gyrus R† | |||
| RSN M | 0.24 | 0.1 | 1 | 4,311 | 6.36 | −24 | 12 | 54 | Superior and middle frontal gyrus L |
| 2 | 4,324 | 7.53 | −28 | −70 | 52 | Lateral occipital cortex, superoir division continuous with dorsal parietal lobule along the supramarginal gyrus | |||
| 3 | 336 | 4.68 | −54 | −62 | −10 | Inferior and middle yemporal gyrus, temporooccipital part L | |||
| RSN N | 0.16 | 0.06 | 1 | 3,546 | 16 | 56 | −4 | 26 | Precentral gyrus, postcentral gyrus |
| 2 | 173 | 4.42 | 10 | −18 | 8 | Thalamus | |||
| 3 | 115 | 5.69 | 20 | −62 | −22 | Cerebellum | |||
| 4 | 42 | 3.94 | 2 | −56 | 30 | Precuneus R† | |||
| 5 | 3 | 3.64 | −50 | −66 | 30 | Superior occipital cortex L† |
RSN, resting state networks; R, right hemisphere; L, left hemisphere.
Explained variance: variations captured by the ICA model.
Total variance: intensity variations from various sources in the image time series.
Clusters exist bilateral unless mentioned otherwise; If clusters exist bilateral, side with highest Z score is reported.
: at P = 0.05 this cluster is bilateral.
Figure 1A shows the bilateral central opercular cortex and anterior through posterior divisions of the superior temporal gyrus. Involvement of the cingulate gyrus is also present; this connectivity pattern is continuous from the pregenual cingulate cortex to the supplementary motor area (SMA) region at P < 0.05. This network has been described in adults where it encompasses the auditory cortex and is involved in language processing [Beckmann et al., 2005; Damoiseaux et al., 2006; De Luca et al., 2006; Mantini et al., 2007; Van den Heuvel et al., 2008].
Figure 1B mainly involves a single region consisting of the inferior frontal gyrus (IFG) extending into the middle frontal gyrus bilaterally. This region has not previously been described as a single component but resembles the frontal part of the cingulo‐opercular network in adults. Figure 1C shows a network consisting of the cingulate gyrus extending into the medial superior frontal gyrus, bilateral insula/frontal operculum of the IFG, and bilaterally in the superior frontal gyrus, thalamus, and cerebellum. Finally, involvement of the precuneus was found. Taken together, Figure 1B,C form a cluster of brain regions that can be attributed to the cingulo‐opercular network. This network is involved in goal directed behavior, salience processing and cognitive flexibility [Dosenbach et al., 2007; Seeley et al., 2007; Sridharan et al., 2008; Van den Heuvel et al., 2008].
Figure 1D encompasses a wide area in the frontal lobe extending across the IFG, pars triangularis, and orbitofrontal cortex. It includes medial frontal paracingulate area, the posterior cingulate cortex (PCC) and precuneus. This component also shows the superior temporal sulcus and the posterior division of the temporal lobe connecting the middle temporal gyrus with the angular gyrus. This network is reported as a language network [Gernsbacher and Kaschak, 2003; Papathanassiou et al., 2000]. In addition it has also been reported to play a role in the reorientation of attention toward relevant stimuli and is known as the ventral attention system [Corbetta and Shulman, 2002; Damoiseaux et al., 2006; Fox et al., 2006].
Figure 1E shows the striate and part of the peristriate cortex representing the primary visual areas [Beckmann et al., 2005; Damoiseaux et al., 2006; De Luca et al., 2006].
Figure 1F–H,K all show parts of the adult DMN [Beckmann et al., 2005; Buckner et al., 2008; Damoiseaux et al., 2006; Raichle and Snyder, 2007]. When overlaying these components, the complete DMN emerges as depicted in Figure 2. Figure 1F shows a pattern that consists of the PCC, the precuneus and the angular gyrus within the superior parietal cortex bilaterally. This network is comparable to the posterior part of the DMN. Figure 1G predominantly shows the pregenual cingulate gyrus extending to the anterior cingulate cortex (ACC), as well as the PCC/precuneus. Caudally, it is composed of both inferior through superior parietal cortex. Other areas include bilateral superior frontal gyrus and the middle temporal gyrus. Figure 1H shows a part of the DMN centered on the PCC and precuneus. Importantly, this connectivity pattern is continuous with the parahippocampal cortices as well as inferior temporal gyrus. In addition, the parietal cortex and the superior division of the lateral occipital cortex are shown. Frontal functional coherence spans through inferior, middle and superior frontal gyrus and the orbitofrontal cortex. At a lower threshold of P < 0.05 the frontal parts of the DMN are also observed, including the ACC. Figure 1K shows similarities with Figure 1F. This network corresponds to the caudal part of the DMN, medially including the precuneus and the angular gyrus and paracingulate gyrus. Other areas include the right superior frontal gyrus, middle temporal gyrus, and bilateral parietal cortex.
Figure 2.
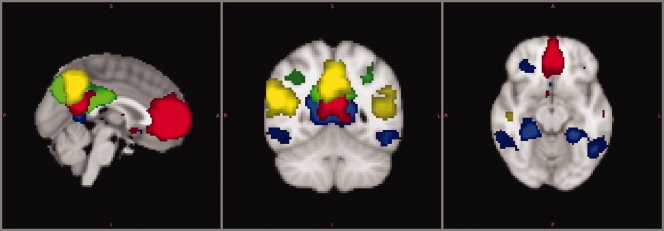
Default mode network. Four different components representing independent Functional networks of resting state brain activity in children overlaid onto the reference brain. The patterns depicted correspond to the components shown in Figures 1F (green), 1G (red), 1H (blue), and 1K (yellow). Each of these components represent a different part within the DMN to demonstrate complementary and partially overlapping parts conforming the final adult DMN pattern. Although the regions showing the highest connectivity change between these components, all share core DMN regions—in particular, the precuneus region. Connectivity maps are thresholded at P < 0.001. Image is presented in radiological convention. [Color figure can be viewed in the online issue, which is available at wileyonlinelibrary.com.]
To investigate whether our analysis is able to detect the DMN in a single component, we analysed fMRI scans from a group of 18 sex matched healthy adults acquired on the same MRI scanner using identical pre and postprocessing tools. In contrast to this decomposition of the DMN in the children, the DMN appeared in one single component in adults (Supporting Information Fig. 1). However, the medial temporal lobe subsystem was not included in the group analysis.
Figure 1I shows the lateral and superior occipital regions encompassing the secondary visual areas [Beckmann et al., 2005; Damoiseaux et al., 2006]. This pattern continues into the temporal occipital fusiform cortex, representing the origin of the ventral visual stream, involved in visual processing [Damoiseaux et al., 2006]. The visual cortex is apparent in two separate components (Fig. 1E,I) and has been reported previously in adults in an identical manner [Damoiseaux et al., 2006].
Figure 1J shows the posterior division of the supramarginal gyrus bilaterally, extending into the superior parietal cortex, as well as the temporo‐occipital part of the inferior temporal gyrus. Frontally, this component includes the precentral gyrus, superior frontal gyrus and right lateral prefrontal cortex. This network roughly corresponds to the dorsal visual stream involved in visual processing [Beckmann et al., 2005; Damoiseaux et al., 2006].
Figure 1L,N both depict sensorimotor networks. Figure 1L shows the pre‐and postcentral gyrus, encompassing the somatomotor and somatosensory cortex [Beckmann et al., 2005; Damoiseaux et al., 2006; De Luca et al., 2006]. Other motor‐related areas like bilateral SMA and cerebellum are functionally connected as well. Additionally the parietal operculum is involved. Figure 1N shows the inferior part of the pre‐and postcentral gyrus, as well as the thalamus and cerebellum. Precuneus (right hemisphere) and superior occipital cortex (left) also appear functionally connected. These last two regions were found to be bilaterally involved at a lower threshold of P < 0.05.
Figure 1M shows the left middle and superior frontal gyrus and inferior through parietal cortex as well as a similar but much smaller cluster on the right hemisphere. In addition, the occipitotemporal part of the middle/inferior temporal gyrus is shown. This RSN is strongly lateralized and represents the left frontoparietal network reported in alerting and maintenance of selective attention and memory processes [Damoiseaux et al., 2006; Dosenbach et al., 2007; Fox et al., 2006; Van den Heuvel et al., 2008].
A dual regression was performed using the group ICA estimates and the single‐subject data to identify the effect size of each component in subject‐specific data. Subsequently, a group T‐map of each component was created and group level significance testing showed the regions that correlated significantly with the component's time courses. Figure 3 shows thresholded T‐maps of components F,G, H, and K, components previously identified as parts of the DMN. Results are strikingly similar to Figure 2, indicating that these networks are present in all study subjects. Comparison of the population specific T‐maps of the remaining components (A–E, I,J, L–N) yielded similar results, as can be viewed in Supporting Information Figure 2.
Figure 3.
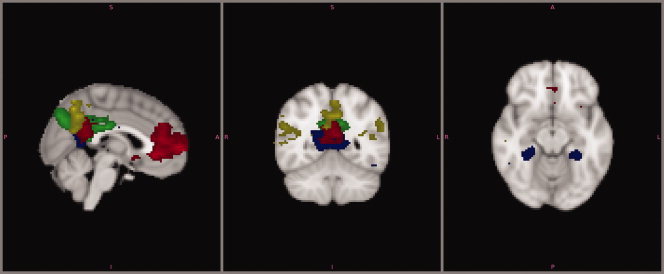
Dual regression analysis. Group T maps of component F–H and K, representing the DMN. Maps are thresholded at P = 0.05, using Bonferroni correction for multiple comparisons. Values ranging from this threshold, approximately from 7 to 20 are displayed in red to yellow. The image is presented in radiological convention. [Color figure can be viewed in the online issue, which is available at wileyonlinelibrary.com.]
DISCUSSION
In the present study we employed continuous rs‐fcMRI to identify RSNs in early childhood. The 18 children in this study were 5‐ to 8‐years old, which is to date the youngest group studied in an awake state at rest. Children were prepared in a mock MRI scanner prior to the scanning session which allowed us to gather reliable data from fully awake children while reducing motion artifacts due to stress or anxiety [De Bie et al., 2010a]. Data were analyzed using a temporal concatenation ICA approach. The group ICA approach identified 14 components reflecting previously described RSNs with known functional relevance. Subsequently, a dual regression analysis was performed to estimate each subject's contribution to these components. Results of this additional analysis show striking similarity with results from the temporal concatenation group ICA. This indicates that RSNs were present in all 18 children, allowing generalization from the data to the entire population.
We identified RSNs including primary sensorimotor, auditory, visual, extra‐striate visual and attention networks, and the DMN. Networks involved in motor function and sensory related processing are similar to adult RSNs, whereas RSNs supporting higher‐order cognitive functions demonstrate immature characteristics.
Default Mode Network
A major difference between adults and children is the decomposition of the DMN in several independent components in children. In studies performed in adults the DMN generally appears as a single component [Beckmann et al., 2005; Damoiseaux et al., 2006]. In our study population, all components engaged the precuneus, reportedly serving as a main hub within the DMN [Fransson and Marrelec, 2008; Fransson et al., 2010; Gao et al., 2009], but differed in their functional integration with other regions, each component having connections with distinct areas of the DMN. A possible explanation is that the DMN is composed of several distinct subsystems instead of one cohesive interconnected network. Although the existence of subsystems within the DMN has been described earlier in adult populations, this distinction mainly concerned the medial temporal lobe subsystem [Buckner et al., 2008; Damoiseaux et al., 2006]. This part of the DMN shows the least consistency across different studies. Another possibility is that the decomposition of the DMN into different components reflects the immature fragmented state of the DMN in this young age group. Development toward adulthood should then result in age‐related increases in connection strength and functional integration of the initial subsystems into a more coherent network, as is suggested by the presence of the DMN in one single component in adults [Stevens, 2009; Supekar et al., 2009; this study]. This suggestion is in line with previous studies, in which the DMN in children is fragmented into several components whereas in young adults the DMN is commonly represented in one single component [Beckmann et al., 2005; De Luca et al., 2006; Fair et al., 2008; Gao et al., 2009; Mantini et al., 2007; Stevens et al., 2009]. Remarkably, subsequent aging also affects the integrity of the DMN, as a similar decomposition of the DMN has been related to cognitive decline in an elderly population (two components) [Damoiseaux et al., 2008].
Attention networks
In addition to the presence of the DMN, this study also identified three other networks comprising regions involved in higher‐order cognitive functioning. Figure 1B,C together show the cingulo‐opercular network. Figure 1D resembles the ventral frontoparietal network. Finally, Figure 1M reflects the left dorsal frontoparietal network. These distinct attention control networks are considered to be involved in different aspects of attention but act together in close concert during cognitively demanding tasks [Fan et al., 2005].
In line with the observations on the DMN, the architecture of attention control networks in this young age group also showed immature characteristics. First, the cingulo‐opercular network presents itself fragmented into two components. Second, in our subjects the right hemisphere part of the dorsal frontoparietal network was lacking. Third, we identified additional regions within attention control networks that appear in separate networks in adults. This is exemplified by the presence of the PCC/precuneus within the ventral frontoparietal network. The presence and the subsequent disappearance of these additional regions during development can be interpreted in the context of functional pruning, i.e., removing redundant connections [Huttenlocher et al., 1982]. In 7‐ to 9‐year old children similar immature attention control networks with weak connections between involved regions have been described [Fair et al., 2007]. Comparing our results in 5‐ to 8‐year old children with younger children in this respect is problematic because previous studies in children under the age of five have not reported the existence of attention control networks but focused primarily on the development of other networks [Gao et al., 2009; Lin et al., 2008; Liu et al., 2008].
Our results demonstrate incomplete and fragmented patterns of networks supporting higher‐order cognitive functions (DMN and attentional networks). This finding fits earlier reports that by middle childhood important cognitive functions and control processes are present but are to improve with age [Crone et al., 2004; Davidson et al., 2006; Rubia et al., 2006; Schneider et al., 2004]. This indicates that in order to meet cognitive requirements in 5‐ to 8‐year old children, attention and default mode networks not yet need to be fully matured. The development towards adult patterns of these higher order networks, may parallel improvement in cognitive efficacy and control that has been associated with these networks.
Remaining networks
Remaining networks identified in these children are mainly involved in basic functions such as sensory and motor‐related processing. We identified primary auditory, primary visual and extrastriate regions, dorsal visual stream, and sensorimotor networks. In contrast to the DMN and attention networks involved in higher‐order cognitive functioning, the sensory and sensorimotor networks in our study group are characterized by mature patterns of connectivity between all critical regions. These connections include established thalamo‐cortical, cerebello‐cortical, and long‐range subcortical‐cortical and cortico‐cortical connections.
In this study we used ICA to analyze the data because of its potential to identify all RSNs present. The theoretical strength of ICA is the lack of selection bias because no a priori hypothesis is required. ICA is frequently used to analyze rs‐fcMRI data and has been proven to show large consistency [Correa et al., 2007; Ylipaavalniemi and Vigario, 2008].
Several factors may have influenced our findings. We scanned 18 healthy children of whom 12 were born SGA. Being born SGA is associated with subtle impairments in intelligence and cognition, especially in children without postnatal catch‐up growth [De Bie et al., 2010b]. It seems likely that children born SGA have subtle differences in brain functioning. However, all 12 SGA children demonstrated catch‐up growth and mean intelligence quotients (IQ) did not differ from the children born appropriate for gestational age. Subgroup analyses between the 12 SGA children and 6 healthy controls did not reveal significant differences. Therefore, it seems unlikely that the nature of our study population heavily influenced our findings.
An additional remark concerns the order of data‐acquisition. The children in our study population performed a picture encoding task 10 min before acquisition of rs‐fcMRI data. Activation of the DMN is increased following cognitive challenge and this effect may have affected the detection of the DMN in our study [Pyka et al., 2009].
Finally, in this study we performed a manual artifact removal approach. The level of noise due to motion artifacts in fMRI data of children is likely to be large when compared to an adult population, which was also the case in the current study population. Although the strength of ICA is its potential to separate signal related components from artifacts‐related components [McKeown et al., 1998], previous work has also shown that ICA will perform incomplete separation of sources if there is any spatial or temporal overlap in the components [Beall and Lowe, 2007]. We chose to manually remove those components representing solely motion artifact or physiologic noise. Components which possibly reflected a combination of noise and fMRI BOLD signal were not removed to reduce the risk of false‐negatives. We are aware of automated methods for artifact removal published in the literature [Beall and Lowe, 2007; Thomas et al., 2002; Tohka et al., 2008], but to our knowledge such methods have not been used in study groups of non‐sedated children in this age range.
In conclusion, our results demonstrate for the first time the presence of RSNs in awake children aged 5‐ to 8‐years old. Most networks, in particular those supporting basic motor function and sensory related processing, have a robust functional organization similar to mature adult patterns. In contrast, RSNs supporting higher‐order cognitive functions show immature characteristics. These immature RSNs are characterized by incomplete and fragmented patterns indicating insufficiently developed functional connectivity. We therefore conclude that the DMN and other RSNs involved in higher order cognitive functioning are detectable, yet in an immature state, at an age when these cognitive abilities are mastered.
Supporting information
Additional Supporting Information may be found in the online version of this article.
Supporting Information Figure 1.
Acknowledgements
T. Schweigmann and Ms J. Jeltes are greatly acknowledged for help with data acquisition.
REFERENCES
- Auer DP ( 2008): Spontaneous low‐frequency blood oxygenation level‐dependent fluctuations and functional connectivity analysis of the “resting” brain. Magn Reson Imaging 26: 1055–1064. [DOI] [PubMed] [Google Scholar]
- Beall EB, Lowe MJ ( 2007): Isolating physiologic noise sources with independently determined spatial measures. Neuroimage 37: 1286–1300. [DOI] [PubMed] [Google Scholar]
- Beckmann CF, DeLuca M, Devlin JT, Smith SM ( 2005): Investigations into resting‐state connectivity using independent component analysis. Philos Trans R Soc Lond B Biol Sci 360: 1001–1013. [DOI] [PMC free article] [PubMed] [Google Scholar]
- Beckmann CF, Mackay C, Filipini N, Smith SM ( 2009): Group comparison of resting‐state FMRI data using multi‐subject ICA and dual regression: Organization for Human Brain Mapping 2009 Annual Meeting. Neuroimage 47 ( Suppl 1): S148. [Google Scholar]
- Beckmann CF, Noble JA, Smith SM ( 2000): Artefact detection in FMRI data using independent component analysis. Neuroimage 11: S614. [Google Scholar]
- Beckmann CF, Smith SM ( 2004): Probabilistic independent component analysis for functional magnetic resonance imaging. IEEE Trans Med Imaging 23: 137–152. [DOI] [PubMed] [Google Scholar]
- Biswal B, Yetkin FZ, Haughton VM, Hyde JS ( 1995): Functional connectivity in the motor cortex of resting human brain using echo‐planar MRI. Magn Reson Med 34: 537–541. [DOI] [PubMed] [Google Scholar]
- Buckner RL, Andrews‐Hanna JR, Schacter DL ( 2008): The brain's default network: Anatomy, function, and relevance to disease. Ann N Y Acad Sci 1124: 1–38. [DOI] [PubMed] [Google Scholar]
- Bunge SA, Wright SB ( 2007): Neurodevelopmental changes in working memory and cognitive control. Curr Opin Neurobiol 17: 243–250. [DOI] [PubMed] [Google Scholar]
- Calhoun VD, Adali T, Pearlson GD, Pekar JJ ( 2001): A method for making group inferences from functional MRI data using independent component analysis. Hum Brain Mapp 14: 140–151. [DOI] [PMC free article] [PubMed] [Google Scholar]
- Calhoun VD, Kiehl KA, Pearlson GD ( 2008): Modulation of temporally coherent brain networks estimated using ICA at rest and during cognitive tasks. Hum Brain Mapp 29: 828–838. [DOI] [PMC free article] [PubMed] [Google Scholar]
- Corbetta M, Shulman GL ( 2002): Control of goal‐directed and stimulus‐driven attention in the brain. Nat Rev Neurosci 3: 201–215. [DOI] [PubMed] [Google Scholar]
- Correa N, Adali T, Calhoun VD ( 2007): Performance of blind source separation algorithms for fMRI analysis using a group ICA method. Magn Reson Imaging 25: 684–694. [DOI] [PMC free article] [PubMed] [Google Scholar]
- Crone EA, Ridderinkhof KR, Worm M, Somsen RJ, van der Molen MW ( 2004): Switching between spatial stimulus‐response mappings: A developmental study of cognitive flexibility. Dev Sci 7: 443–455. [DOI] [PubMed] [Google Scholar]
- Damoiseaux JS, Rombouts SA, Barkhof F, Scheltens P, Stam CJ, Smith SM, Beckmann CF ( 2006): Consistent resting‐state networks across healthy subjects. Proc Natl Acad Sci USA 103: 13848–13853. [DOI] [PMC free article] [PubMed] [Google Scholar]
- Damoiseaux JS, Beckmann CF, Arigita EJ, Barkhof F, Scheltens P, Stam CJ, Smith SM, Rombouts SA ( 2008): Reduced resting‐state brain activity in the “default network” in normal aging. Cereb Cortex 18: 1856–1864. [DOI] [PubMed] [Google Scholar]
- Davidson MC, Amso D, Anderson LC, Diamond A ( 2006): Development of cognitive control and executive functions from 4 to 13 years: Evidence from manipulations of memory, inhibition, and task switching. Neuropsychologia 44: 2037–2078. [DOI] [PMC free article] [PubMed] [Google Scholar]
- De Bie HMA, Boersma M, Wattjes MP, Adriaanse S, Vermeulen RJ, Oostrom KJ, Huisman J, Veltman DJ, Delemarre‐Van de Waal HA ( 2010a): Preparing children with a mock scanner training protocol results in high quality structural and functional MRI scans. Eur J Pediatr 169: 1079–1085. [DOI] [PMC free article] [PubMed] [Google Scholar]
- De Bie HMA, Oostrom KJ, Delemarre‐Van de Waal HA ( 2010b): Brain development, intelligence and cognitive outcome in children born small for gestational age. Horm Res Paediatr 73: 6–14. [DOI] [PubMed] [Google Scholar]
- De Luca M, Beckmann CF, De SN, Matthews PM, Smith SM ( 2006): fMRI resting state networks define distinct modes of long‐distance interactions in the human brain. Neuroimage 29: 1359–1367. [DOI] [PubMed] [Google Scholar]
- Dosenbach NU, Fair DA, Miezin FM, Cohen AL, Wenger KK, Dosenbach RA, Fox MD, Snyder AZ, Vincent JL, Raichle ME, Schlaggar BL, Petersen SE ( 2007): Distinct brain networks for adaptive and stable task control in humans. Proc Natl Acad Sci USA 104: 11073–11078. [DOI] [PMC free article] [PubMed] [Google Scholar]
- Durston S, Davidson MC, Tottenham N, Galvan A, Spicer J, Fossella JA, Casey BJ ( 2006): A shift from diffuse to focal cortical activity with development. Dev Sci 9: 1–8. [DOI] [PubMed] [Google Scholar]
- Fair DA, Dosenbach NU, Church JA, Cohen AL, Brahmbhatt S, Miezin FM, Barch DM, Raichle ME, Petersen SE, Schlaggar BL ( 2007): Development of distinct control networks through segregation and integration. Proc Natl Acad Sci USA 104: 13507–13512.17679691 [Google Scholar]
- Fair DA, Cohen AL, Dosenbach NU, Church JA, Miezin FM, Barch DM, Raichle ME, Petersen SE, Schlaggar BL ( 2008): The maturing architecture of the brain's default network. Proc Natl Acad Sci USA 105: 4028–4032. [DOI] [PMC free article] [PubMed] [Google Scholar]
- Fair DA, Cohen AL, Power JD, Dosenbach NU, Church JA, Miezin FM, Schlaggar BL, Petersen SE ( 2009): Functional brain networks develop from a “local to distributed” organization. PLoS Comput Biol 5: e1000381. [DOI] [PMC free article] [PubMed] [Google Scholar]
- Fan J, McCandliss BD, Fossella J, Flombaum JI, Posner MI ( 2005): The activation of attentional networks. Neuroimage 26: 471–479. [DOI] [PubMed] [Google Scholar]
- Filippini N, MacIntosh BJ, Hough MG, Goodwin GM, Frisoni GB, Smith SM, Matthews PM, Beckmann CF, Mackay CE ( 2009): Distinct patterns of brain activity in young carriers of the APOE‐epsilon4 allele. Proc Natl Acad Sci USA 106: 7209–7214. [DOI] [PMC free article] [PubMed] [Google Scholar]
- Foerde K, Knowlton BJ, Poldrack RA ( 2006): Modulation of competing memory systems by distraction. Proc Natl Acad Sci USA 103: 11778–11783. [DOI] [PMC free article] [PubMed] [Google Scholar]
- Fonov V, Evans AC, Botteron K, Almli CR, McKinstry RC, Collins DL ( 2011): Unbiased average age‐appropriate atlases for pediatric studies. Neuroimage 54: 313–327. [DOI] [PMC free article] [PubMed] [Google Scholar]
- Fox MD, Raichle ME ( 2007): Spontaneous fluctuations in brain activity observed with functional magnetic resonance imaging. Nat Rev Neurosci 8: 700–711. [DOI] [PubMed] [Google Scholar]
- Fox MD, Corbetta M, Snyder AZ, Vincent JL, Raichle ME ( 2006): Spontaneous neuronal activity distinguishes human dorsal and ventral attention systems. Proc Natl Acad Sci USA 103: 10046–10051. [DOI] [PMC free article] [PubMed] [Google Scholar]
- Fransson P, Marrelec G ( 2008): The precuneus/posterior cingulate cortex plays a pivotal role in the default mode network: Evidence from a partial correlation network analysis. Neuroimage 42: 1178–1184. [DOI] [PubMed] [Google Scholar]
- Fransson P, Skiold B, Horsch S, Nordell A, Blennow M, Lagercrantz H, Aden U ( 2007): Resting‐state networks in the infant brain. Proc Natl Acad Sci USA 104: 15531–15536. [DOI] [PMC free article] [PubMed] [Google Scholar]
- Fransson P, Aden U, Blennow M, Lagercrantz H ( 2011): The functional architecture of the infant brain as revealed by resting‐state fMRI. Cereb Cortex. 21: 145–154 [DOI] [PubMed] [Google Scholar]
- Gao W, Zhu H, Giovanello KS, Smith JK, Shen D, Gilmore JH, Lin W ( 2009): Evidence on the emergence of the brain's default network from 2‐week‐old to 2‐year‐old healthy pediatric subjects. Proc Natl Acad Sci USA 106: 6790–6795. [DOI] [PMC free article] [PubMed] [Google Scholar]
- Gernsbacher MA, Kaschak MP ( 2003): Neuroimaging studies of language production and comprehension. Annu Rev Psychol 54: 91–114. [DOI] [PMC free article] [PubMed] [Google Scholar]
- Giedd JN, Blumenthal J, Jeffries NO, Castellanos FX, Liu H, Zijdenbos A, Paus T, Evans AC, Rapoport JL ( 1999): Brain development during childhood and adolescence: A longitudinal MRI study. Nat Neurosci 2: 861–863. [DOI] [PubMed] [Google Scholar]
- Gogtay N, Giedd JN, Lusk L, Hayashi KM, Greenstein D, Vaituzis AC, Nugent TF III, Herman DH, Clasen LS, Toga AW, Rapoport JL, Thompson PM ( 2004): Dynamic mapping of human cortical development during childhood through early adulthood. Proc Natl Acad Sci USA 101: 8174–8179. [DOI] [PMC free article] [PubMed] [Google Scholar]
- Good CD, Johnsrude IS, Ashburner J, Henson RN, Friston KJ, Frackowiak RS ( 2001): A voxel‐based morphometric study of ageing in 465 normal adult human brains. Neuroimage 14: 21–36. [DOI] [PubMed] [Google Scholar]
- Greicius MD, Krasnow B, Reiss AL, Menon V ( 2003): Functional connectivity in the resting brain: A network analysis of the default mode hypothesis. Proc Natl Acad Sci USA 100: 253–258. [DOI] [PMC free article] [PubMed] [Google Scholar]
- Gusnard DA, Akbudak E, Shulman GL, Raichle ME ( 2001): Medial prefrontal cortex and self‐referential mental activity: Relation to a default mode of brain function. Proc Natl Acad Sci USA 98: 4259–4264. [DOI] [PMC free article] [PubMed] [Google Scholar]
- Hermoye L, Saint‐Martin C, Cosnard G, Lee SK, Kim J, Nassogne MC, Menten R, Clapuyt P, Donohue PK, Hua K, Wakana S, Jiang H, van Zijl PC, Mori S ( 2006): Pediatric diffusion tensor imaging: Normal database and observation of the white matter maturation in early childhood. Neuroimage 29: 493–504. [DOI] [PubMed] [Google Scholar]
- Hoeksma MR, Kenemans JL, Kemner C, van EH ( 2005): Variability in spatial normalization of pediatric and adult brain images. Clin Neurophysiol 116: 1188–1194. [DOI] [PubMed] [Google Scholar]
- Huang H, Zhang J, Wakana S, Zhang W, Ren T, Richards LJ, Yarowsky P, Donohue P, Graham E, van Zijl PC, Mori S ( 2006): White and gray matter development in human fetal, newborn and pediatric brains. Neuroimage 33: 27–38. [DOI] [PubMed] [Google Scholar]
- Huttenlocher PR, de Court, Garey LJ, Van der LH ( 1982): Synaptogenesis in human visual cortex—Evidence for synapse elimination during normal development. Neurosci Lett 33: 247–252. [DOI] [PubMed] [Google Scholar]
- Jenkinson M, Bannister P, Brady M, Smith S ( 2002): Improved optimization for the robust and accurate linear registration and motion correction of brain images. Neuroimage 17: 825–841. [DOI] [PubMed] [Google Scholar]
- Jolles DD, van Buchem MA, Crone EA, Rombouts SA ( 2010): A comprehensive study of whole‐brain functional connectivity in children and young adults. Cereb Cortex 21: 385–391. [DOI] [PubMed] [Google Scholar]
- Kiviniemi V, Jauhiainen J, Tervonen O, Paakko E, Oikarinen J, Vainionpaa V, Rantala H, Biswal B ( 2000): Slow vasomotor fluctuation in fMRI of anesthetized child brain. Magn Reson Med 44: 373–378. [DOI] [PubMed] [Google Scholar]
- Konrad K, Neufang S, Thiel CM, Specht K, Hanisch C, Fan J, Herpertz‐Dahlmann B, Fink GR ( 2005): Development of attentional networks: An fMRI study with children and adults. Neuroimage 28: 429–439. [DOI] [PubMed] [Google Scholar]
- Lebel C, Walker L, Leemans A, Phillips L, Beaulieu C ( 2008): Microstructural maturation of the human brain from childhood to adulthood. Neuroimage 40: 1044–1055. [DOI] [PubMed] [Google Scholar]
- Lin W, Zhu Q, Gao W, Chen Y, Toh CH, Styner M, Gerig G, Smith JK, Biswal B, Gilmore JH ( 2008): Functional connectivity MR imaging reveals cortical functional connectivity in the developing brain. AJNR Am J Neuroradiol 29: 1883–1889. [DOI] [PMC free article] [PubMed] [Google Scholar]
- Liu WC, Flax JF, Guise KG, Sukul V, Benasich AA ( 2008): Functional connectivity of the sensorimotor area in naturally sleeping infants. Brain Res 1223: 42–49. [DOI] [PubMed] [Google Scholar]
- Mantini D, Perrucci MG, Del GC, Romani GL, Corbetta M ( 2007): Electrophysiological signatures of resting state networks in the human brain. Proc Natl Acad Sci USA 104: 13170–13175. [DOI] [PMC free article] [PubMed] [Google Scholar]
- Mason MF, Norton MI, Van Horn JD, Wegner DM, Grafton ST, Macrae CN ( 2007): Wandering minds: The default network and stimulus‐independent thought. Science 315: 393–395. [DOI] [PMC free article] [PubMed] [Google Scholar]
- McKeown MJ, Makeig S, Brown GG, Jung TP, Kindermann SS, Bell AJ, Sejnowski TJ ( 1998): Analysis of fMRI data by blind separation into independent spatial components. Hum Brain Mapp 6: 160–188. [DOI] [PMC free article] [PubMed] [Google Scholar]
- Mugler JP III, Brookeman JR ( 1990): Three‐dimensional magnetization‐prepared rapid gradient‐echo imaging (3D MP RAGE). Magn Reson Med 15: 152–157. [DOI] [PubMed] [Google Scholar]
- Papathanassiou D, Etard O, Mellet E, Zago L, Mazoyer B, Tzourio‐Mazoyer N ( 2000): A common language network for comprehension and production: A contribution to the definition of language epicenters with PET. Neuroimage 11: 347–357. [DOI] [PubMed] [Google Scholar]
- Pyka M, Beckmann CF, Schoning S, Hauke S, Heider D, Kugel H, Arolt V, Konrad C ( 2009): Impact of working memory load on FMRI resting state pattern in subsequent resting phases. PLoS ONE 4: e7198. [DOI] [PMC free article] [PubMed] [Google Scholar]
- Raichle ME, Snyder AZ ( 2007): A default mode of brain function: A brief history of an evolving idea. Neuroimage 37: 1083–1090. [DOI] [PubMed] [Google Scholar]
- Raichle ME, MacLeod AM, Snyder AZ, Powers WJ, Gusnard DA, Shulman GL ( 2001): A default mode of brain function. Proc Natl Acad Sci USA 98: 676–682. [DOI] [PMC free article] [PubMed] [Google Scholar]
- Roosendaal SD, Schoonheim MM, Hulst HE, Sanz‐Arigita EJ, Smith SM, Geurts JJ, Barkhof F ( 2010): Resting state networks change in clinically isolated syndrome. Brain 133: 1612–1621. [DOI] [PubMed] [Google Scholar]
- Rubia K, Smith AB, Woolley J, Nosarti C, Heyman I, Taylor E, Brammer M ( 2006): Progressive increase of frontostriatal brain activation from childhood to adulthood during event‐related tasks of cognitive control. Hum Brain Mapp 27: 973–993. [DOI] [PMC free article] [PubMed] [Google Scholar]
- Schneider W, Kron V, Hunnerkopf M, Krajewski K ( 2004): The development of young children's memory strategies: First findings from the Wurzburg Longitudinal Memory Study. J Exp Child Psychol 88: 193–209. [DOI] [PubMed] [Google Scholar]
- Seeley WW, Menon V, Schatzberg AF, Keller J, Glover GH, Kenna H, Reiss AL, Greicius MD ( 2007): Dissociable intrinsic connectivity networks for salience processing and executive control. J Neurosci 27: 2349–2356. [DOI] [PMC free article] [PubMed] [Google Scholar]
- Senjem ML, Gunter JL, Shiung MM, Petersen RC, Jack CR Jr. ( 2005): Comparison of different methodological implementations of voxel‐based morphometry in neurodegenerative disease. Neuroimage 26: 600–608. [DOI] [PMC free article] [PubMed] [Google Scholar]
- Smith SM ( 2002): Fast robust automated brain extraction. Hum Brain Mapp 17: 143–155. [DOI] [PMC free article] [PubMed] [Google Scholar]
- Smith SM, Jenkinson M, Woolrich MW, Beckmann CF, Behrens TE, Johansen‐Berg H, Bannister PR, De Luca M, Drobnjak I, Flitney DE, Niazy RK, Saunders J, Vickers J, Zhang Y, De Stefano N, Brady JM, Matthews PM ( 2004): Advances in functional and structural MR image analysis and implementation as FSL. Neuroimage 23(supp 1): S208–219. [DOI] [PubMed] [Google Scholar]
- Smyser CD, Inder TE, Shimony JS, Hill JE, Degnan AJ, Snyder AZ, Neil JJ ( 2010): Longitudinal analysis of neural network development in preterm infants. Cereb Cortex 20: 2852–2862. [DOI] [PMC free article] [PubMed] [Google Scholar]
- Sridharan D, Levitin DJ, Menon V ( 2008): A critical role for the right fronto‐insular cortex in switching between central‐executive and default‐mode networks. Proc Natl Acad Sci USA 105: 12569–12574. [DOI] [PMC free article] [PubMed] [Google Scholar]
- Stevens MC ( 2009): The developmental cognitive neuroscience of functional connectivity. Brain Cogn 70: 1–12. [DOI] [PubMed] [Google Scholar]
- Stevens MC, Pearlson GD, Calhoun VD ( 2009): Changes in the interaction of resting‐state neural networks from adolescence to adulthood. Hum Brain Mapp 30: 2356–2366. [DOI] [PMC free article] [PubMed] [Google Scholar]
- Supekar K, Musen M, Menon V ( 2009): Development of large‐scale functional brain networks in children. PLoS Biol 7: e1000157. [DOI] [PMC free article] [PubMed] [Google Scholar]
- Thomas CG, Harshman RA, Menon RS ( 2002): Noise reduction in BOLD‐based fMRI using component analysis. Neuroimage 17: 1521–1537. [DOI] [PubMed] [Google Scholar]
- Tohka J, Foerde K, Aron AR, Tom SM, Toga AW, Poldrack RA ( 2008): Automatic independent component labeling for artifact removal in fMRI. Neuroimage 39: 1227–1245. [DOI] [PMC free article] [PubMed] [Google Scholar]
- Van den Heuvel M, Mandl R, Hulshoff PH ( 2008): Normalized cut group clustering of resting‐state FMRI data. PLoS ONE 3: e2001. [DOI] [PMC free article] [PubMed] [Google Scholar]
- Volpe JJ ( 2000): Overview: Normal and abnormal human brain development. Ment Retard Dev Disabil Res Rev 6: 1–5. [DOI] [PubMed] [Google Scholar]
- Wilke M, Schmithorst VJ, Holland SK ( 2002): Assessment of spatial normalization of whole‐brain magnetic resonance images in children. Hum Brain Mapp 17: 48–60. [DOI] [PMC free article] [PubMed] [Google Scholar]
- Ylipaavalniemi J, Vigario R ( 2008): Analyzing consistency of independent components: An fMRI illustration. Neuroimage 39: 169–180. [DOI] [PubMed] [Google Scholar]
- Yoon U, Fonov VS, Perusse D, Evans AC ( 2009): The effect of template choice on morphometric analysis of pediatric brain data. Neuroimage 45: 769–777. [DOI] [PubMed] [Google Scholar]
- Zuo XN, Kelly C, Adelstein JS, Klein DF, Castellanos FX, Milham MP ( 2010): Reliable intrinsic connectivity networks: Test–retest evaluation using ICA and dual regression approach. Neuroimage 49: 2163–2177. [DOI] [PMC free article] [PubMed] [Google Scholar]
Associated Data
This section collects any data citations, data availability statements, or supplementary materials included in this article.
Supplementary Materials
Additional Supporting Information may be found in the online version of this article.
Supporting Information Figure 1.