

Abstract
It is generally considered that hand amputation changes primary motor cortex (M1) stump muscle representations. Transcranial magnetic stimulation (TMS) studies show that the corticospinal excitability of a stump muscle and its homologous muscle on the intact side is not equivalent, and that the resting level of excitability is higher in the stump muscle. Since changes in M1 stump muscle map characteristics (e.g., size and location) are identified by comparing stump and intact muscle maps, such changes might reflect between‐side differences in corticospinal excitability rather than a true reorganization of the stump muscle's map. In eight above‐elbow amputees we used TMS to map the M1 representation of a stump muscle and its homologous muscle on the intact side during rest and contraction. Importantly, the same relative stimulation intensity was used to construct each map; stimulation was performed at 120% of the motor threshold of each muscle (intact/amputated limb) measured in each condition (rest/active contraction). Resting motor threshold was lower in the stump muscle, but active motor thresholds did not differ. Motor‐evoked potential amplitudes increased between the rest and muscle contraction conditions, but this increase was smaller for the stump muscle because its at‐rest corticospinal excitability was higher than that of the intact muscle. When the between‐side difference in excitability was considered no interhemispheric difference was found for map areas or for their medio‐lateral locations. The present results challenge the view that after an upper limb amputation the stump representation moves laterally and occupies a larger M1 territory. Hum Brain Mapp, 2011. © 2010 Wiley‐Liss, Inc.
Keywords: transcranial magnetic stimulation, primary motor cortex, plasticity, corticospinal excitability, human
INTRODUCTION
Following amputation, extensive reorganization occurs in the sensorimotor cortex as a result of the deafferentation and deefferentation [see for example Cohen et al.,1991; Flor et al.,1995; Lotze et al.,2001]. Reorganization within the primary sensory (S1) and motor (M1) cortices is often thought to be driven by two closely related processes evolving in parallel, but the reorganization seen in the motor system does not always match that seen in the sensory system. For example, during neurosurgery performed on an amputee who suffered from epileptic seizures, Ojemann and Silbergeld [1995] directly stimulated both S1 and M1 contralateral to the amputated upper limb. They observed that stimulation of the expected S1 hand area continued to evoke sensations related to the amputated hand, but that stimulation of the expected M1 hand area evoked motor responses in more proximal muscles and did not evoke sensations of movement in the phantom hand. These results differ from those reported by studies that examine S1 activity evoked by peripheral stimulation (as opposed to sensations evoked by S1 stimulation), the general consensus of which is that body parts that are adjacent to the missing body part in the cortical somatotopic sensory map shift their cortical representation toward that of the missing body part. In particular, in the case of upper limb amputation, the face's representation shifts medially [Elbert et al.,1997; Flor et al.,1995; Grusser et al.,2001; Karl et al.,2001]. Studies on M1 reorganization have produced more variable results, however. In line with what has been described in S1, data have been reported that show that after an upper‐limb amputation, M1 representations of the face and the remaining stump muscles enlarge and shift toward the missing hand's representation. A few imaging studies (using various techniques including functional magnetic resonance imaging, electroencephalography, and positron emission tomography) examining face or stump movement‐related activity have indeed shown displacements toward the former M1/S1 hand representation [Karl et al.,2004; Lotze et al.,2001], as well as increases in M1/S1 activity compared with the intact side [Kew et al.,1994]. However, these studies examined activity during the execution of voluntary movements, which produce both motor and sensory activations. Since the activity of the motor cortex is modulated by sensory reafferences it is difficult to know whether these observations reflect purely motor reorganization.
Transcranial magnetic stimulation (TMS) offers a way to directly assess changes in the cortical motor representation of face and stump muscles following hand amputation. Evidence for changes in the cortical representation of face muscles with TMS exists but remains limited [Karl et al.,2001; Pascual‐Leone et al.,1996]. In contrast, many TMS studies have documented changes in the cortical representation of the remaining stump muscles. Corticospinal excitability of stump muscles is increased when measured from M1 contralateral to the amputated limb (M1amp), as a given stimulation intensity produces motor evoked potential (MEP) amplitudes that are larger in stump muscles than in homologous muscles on the intact side. Further evidence for a change in corticospinal excitability comes from the fact that the resting motor threshold (rMT) of stump muscles in M1amp is lower than the rMT of intact homologous muscles measured in M1 contralateral to the intact limb (M1intact) [Chen et al.,1998; Cohen et al.,1991; Dettmers et al.,1999; Karl et al.,2001], although not all studies report such a difference [Capaday et al.,2000; Schwenkreis et al.,2001]. Chen et al. [1998] showed that the threshold for evoking MEPs with transcranial electrical stimulation did not differ between the two sides, suggesting that the between‐side differences observed with TMS arise from changes at the cortical rather than the spinal level. Other TMS studies have reported that the area of a stump muscle's cortical map is larger than that of the homologous muscle on the intact side [Dettmers et al.,1999; Irlbacher et al.,2002; Ridding and Rothwell1995], and that the medio‐lateral position of the map's center of gravity (CoG) differs for M1amp and M1intact [Dettmers et al.,1999; Irlbacher et al.,2002]. In keeping with the conclusions drawn from studies using techniques other than TMS, this latter result has often been interpreted as evidence for an invasion of the former hand representation by the adjacent stump muscle representations. A closer look, however, suggests that this view is not consistently supported by the data; while some studies found that the stump muscle representation had “invaded” the hand representation and was more lateral than the homologous muscle's representation [Dettmers et al.,1999; Irlbacher et al.,2002; Schwenkreis et al.,2001], others found it was more medial [Karl et al.,2001], or that there was no difference [Roricht et al.,1999].
Three key methodological aspects of TMS studies investigating postamputation reorganization are critical when interpreting the results of existing studies. First, in most studies the same absolute TMS intensity (a percentage of the maximal stimulator output) was used to test both hemispheres [Cohen et al.,1991; Irlbacher et al.,2002; Ridding and Rothwell1995; Roricht et al.,1999]. But since the rMT in M1amp is lower than in M1intact, in these studies the relative TMS intensity (the percentage of the rMT) was higher for M1amp. Consequently, reporting an increased map area does not necessarily mean that the neurons that project to the muscle of interest occupy a larger territory in M1amp. It could instead reflect the fact that stimulation at a higher percentage of rMT means that this motor representation is easier to recruit at more remote locations [Ridding and Rothwell,1995; Siebner and Rothwell,2003].
Second, TMS allows assessment of the cortical representation of a given target muscle (although reference is often made to “face” or “stump” cortical representations). Previous studies used various muscle targets, sometimes very close to the amputation level, and sometimes more proximal (for example, above‐elbow muscles in a wrist amputee). We recently showed that voluntary production of different phantom limb movements leads to different EMG patterns in the stump muscles [Gagné et al.,2009; Reilly et al.,2006], and that it is the muscles situated just above the amputation level that exhibit the strongest activation and the most movement‐related modulation [Gagné et al.,2009]. This suggests that reorganizational changes observed in muscles close to the amputation level will not necessarily be the same as those observed in more proximal muscles.
Finally, almost all studies were performed with the target muscle at rest. In a very interesting report, although limited to two amputees, Ridding and Rothwell [1995] showed preliminary evidence that when both hemispheres were tested using a constant absolute TMS intensity (the same percentage of maximal stimulator output (MSO) for both hemispheres) there was an imbalance between the area of the motor maps of the stump muscle and its homologous intact muscle when the muscles were at rest but not when the muscles were tested with a slight sustained contraction. This suggests that in order to understand the mechanisms underlying amputation‐induced reorganization of the motor system it is important to examine TMS variables measured at rest and those measured during muscle contraction.
The aim of the present study was to examine motor reorganization in above‐elbow traumatic amputees by comparing both the corticospinal excitability and the motor map measured at rest with those measured during active contraction. It is important to contrast observations made at rest with those made under sustained activity. Indeed, muscle contraction recruits cortical neurons functionally linked to the preactivated muscle and those neurons become more sensitive to the TMS pulse. As a consequence, TMS data obtained during contraction have the potential to provide a more functional picture of M1 organization. Other aspects distinguish the approach used in this study from the methods employed in previous studies. First, we specifically targeted the stump muscle exhibiting the largest and most consistent modulation during the execution of phantom hand movements. Second, the TMS intensity was adjusted for each M1 in each condition (rest and active) in order to use a constant relative TMS intensity. This approach allowed us to differentiate between postamputation changes in corticospinal excitability and postamputation changes in the cortical map. In addition to examining between‐hemisphere differences at rest and during a slight contraction, we also examined whether the M1amp map of the stump muscle differed during a voluntary contraction of the target muscle versus an attempt to move the phantom hand, with both contractions being an equivalent percentage of the electromyographic activity recorded during the maximum voluntary contraction (MVC).
We hypothesized that motor thresholds would differ between sides in the rest but not in the active conditions. Furthermore, given that the intensity of stimulation was set relative to the threshold for each hemisphere and each condition, we expected to find no difference in the size or location of the motor maps for the stump and intact muscles. Finally, we hypothesized that the position of the stump muscle's CoG would differ between the two active conditions (i.e. contracting the stump or moving the phantom hand), and that it would be more lateral when the subject intended to move his hand. This hypothesis is based upon the idea that, despite the fact that both conditions result in the same contraction level in the stump muscle, the population of neurons recruited when the intention is to move the phantom hand is different from that responsible for the simple voluntary contraction of the stump muscle.
METHODS
Ethical Approval
The nature of the experimental procedures was explained to all subjects. All subjects gave their written informed consent prior to participating in the experiment, which was approved by the Ethics Committee of the Institut de Réadaptation en Déficience Physique de Québec and conformed with the ethical aspects of the Declaration of Helsinki.
Subjects
To have a sample as homogeneous as possible (as different amputation levels likely lead to different degrees of cortical reorganization), only above‐elbow, chronic, traumatic amputees were recruited. Eight subjects participated in the study (seven males/one female, aged 19–70, 1–54 years postamputation, 6/8 amputated on the right (dominant) side). Clinical characteristics of each subject are given in Table I. According to their medical file, subjects had no apparent history of neurological lesion, epilepsy, or metallic implants presenting a contraindication for MRI or TMS. All participated in a previous experiment in which stump EMG activity associated with phantom movements was investigated [Gagné et al.,2009].
Table I.
Individual clinical and neurophysiological data
| Subject number | Age | Time since amputation (years) | Amputated side/dominant side | Phantom pain intensity | Medication | Prosthesis type (% time) | rMT (amputated/ intact) | aMT (amputated/ intact) |
|---|---|---|---|---|---|---|---|---|
| S1 | 51 | 6 | R/R | 7 | Gabapentine | Mechanical (25–50%) | 55/100 | 45/58 |
| S2 | 70 | 54 | R/R | 4 | — | — | 63/68 | 52/38 |
| S3 | 45 | 4 | R/R | 2 | — | Mechanical (75–95%) | 42/80 | 37/48 |
| S4 | 35 | 11 | R/R | 0 | — | Stabilizing prosthesis (cycling) | 46/69 | 43/53 |
| S5 | 66 | 7 | R/R | 0 | — | Mechanical (0–25%) | 35/38 | 25/29 |
| S6 | 48 | 1 | L/R | 4 | Gabapentine/ venlafaxine | Mechanical (0–25%) | 79/>100 | 72/>100 |
| S7 | 57 | 7 | L/R | 5 | Clomipramine Hcl | — | 70/78 | 63/62 |
| S8 | 19 | 3 | R/R | 0 | — | — | 56/64 | 48/52 |
Subjects were questioned in a semi‐structured interview [Kooijman et al.,2000] about the amputation, nonpainful, and painful phantom limb sensations, stump pain, as well as treatment received for pain. In six subjects, the accident leading to the amputation involved only the amputated arm. Seven subjects had a trauma limited to the upper limb (with minor damage to the contralateral limb in one case). The other (S4) suffered polytrauma including a head injury as a result of a motor vehicle accident but, with the exception of his amputation, he fully recovered and is now an elite athlete. All eight subjects had a vivid sensation of their phantom limb and reported that they were able to move it voluntarily. Five of the eight subjects had phantom limb pain ranging from 2 to 7 on a visual analog scale and all had the sensation of being able to make at least one, but more often many different movements with their phantom [for more details about phantom limb motor control in these patients see Gagné et al.,2009]. Only four subjects used prostheses and all used mechanical prostheses. One subject used his prosthesis for more than 75% of the time, another between 25 and 50% of the time, while two others used theirs for less than 25% of the time. Two of the subjects took medication to control phantom limb pain (Gabapentine) and two took an antidepressant (Clomipramine, Venlafaxine). Gabapentine is known to alter cortical excitability [Michelucci et al.,1996; Rizzo et al.,2001], but since only intrasubject analyses were used to compare TMS responses from both hemispheres, this factor likely did not affect the results.
Experimental Procedures
The M1 representation of a stump muscle (biceps for seven subjects, deltoid for one subject) and the representation of the homologous intact muscle were mapped with image‐guided TMS using a 70 mm figure‐of‐eight coil connected to a Magstim 200® stimulator. Prior to the TMS session, an anatomical MRI was obtained for each subject to use a frameless stereotaxy neuronavigation system (Brainsight, Rogue Research) to ensure accurate positioning of the coil over the same sites between conditions. A 15‐point grid (points spaced by 10 mm, with five rows in the medio‐lateral axis and three columns in the antero‐posterior axis) was implemented over the precentral and postcentral gyri of each hemisphere on the three‐dimensional brain reconstruction (see Fig. 1). Before the mapping, the optimal location on the grid for stimulating the target muscle (hotspot) was identified as the cortical site where motor evoked potentials were evoked at the lowest stimulation intensity. If the hotspot was located on the border of the grid we displaced the grid to ensure that it contained the true hotspot, and that the hotspot was at the center of the grid. The motor threshold at rest (rMT) was determined as the minimal intensity of stimulation required to elicit motor evoked potentials (MEPs) larger than 50 μV in at least 6 out of 12 trials at the hotspot. The active motor threshold (aMT) was defined as the minimal TMS intensity that produced MEP amplitudes of at least 120% of background EMG in at least 6 out of 12 trials, and was determined during an active muscle contraction maintained between 5 and 10% of the maximal voluntary contraction (MVC). Visual feedback of EMG activity from the muscle and of the target level of contraction was provided on a computer screen placed in front of the subject. Cortical mapping was then performed in three different conditions: (1) at rest; (2) during a slight voluntary contraction of the tested muscle; and (3) during a phantom movement recruiting the tested stump muscle (this third condition was performed only for the amputated side). The level of contraction was maintained between 5 and 10% MVC in both active conditions.
Figure 1.
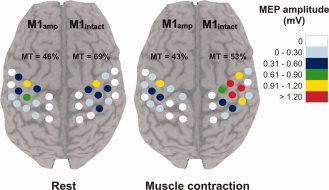
Cortical map obtained in one subject (S4) during rest and during active muscle contraction. Each dot represents a stimulated site. Each site was stimulated four times and the color code indicates the size of the mean MEP amplitude at that site. MT corresponds to the motor threshold measured in each hemisphere in a given condition and is expressed as a percentage of the maximal stimulator output.
The phantom hand movement performed was selected on a subject‐by‐subject basis using data collected for a previous experiment [Gagné et al.,2009]. The criteria for the selected movement were that it had to be accompanied by a specific and reproducible phase‐dependent activation of the studied muscle. For the two active conditions on the amputated side the visual feedback was always the same, but the motor intention of the subject differed (for example to contract the stump muscle vs. to close the phantom hand). During mapping, each point was stimulated with four successive TMS pulses separated by 4–6 s. All points on the grid were stimulated in every condition in a pseudo‐randomized order. The rest condition was tested with a TMS intensity set at 120% rMT and the two active conditions were tested at 120% aMT.
EMG recordings were made with surface Ag/AgCl electrodes, placed over the muscle belly in a bipolar montage. EMG signals were amplified and band pass filtered (20–1,000 Hz) and then digitized at a sampling rate of 1,000 Hz (CED 1401 interface; Cambridge Electronic Design, Cambridge, UK). For the visual feedback, the digitized EMG signal was smoothed and fed to the computer screen placed in front of the subject.
Variables and Data Analysis
A site on the grid was considered active if at least two out of the four TMS pulses generated a discernable MEP, and the average peak‐to‐peak amplitude of MEPs at that site was then calculated (sum of all 4 MEP amplitudes/4). To assess the corticospinal excitability of the tested muscles in each condition we extracted the maximal MEP amplitude (maxMEP), corresponding to the highest average MEP amplitude recorded from any one of the 15 stimulation sites. The raw maximal MEP amplitudes were analyzed on an intrahemispheric basis. This decision was motivated by the fact that raw EMG amplitudes should not be compared directly between sides, especially in this case given that the target stump muscle was damaged by the amputation in most patients. Thus, the maxMEP recorded in one muscle was compared across each tested condition, but not across hemispheres. To assess whether the increase in MEP size between rest and voluntary contraction was the same or different for the two hemispheres we calculated, in each hemisphere, the percent increase of the maxMEP amplitude between rest and active conditions as « % increase = [(maxMEPactive/maxMEPrest) × 100 ] − 100 ». Using this calculation, values greater than zero indicate that the maxMEPactive was greater than the maxMEPrest, and a % increase of 200 (for example) means that the difference between the maxMEPrest and the maxMEPactive was 200% of the maxMEPrest.
Motor threshold differences were assessed in two ways. First, a comparison was made between rMT and aMT on each side. Second, a comparison between sides was performed for both rMT and aMT.
For each of the three conditions, the area of the map was calculated as the number of active sites. The map area obtained in a given condition was then compared between hemispheres. The medio‐lateral coordinates of the center of gravity (CoG) of the map were computed using the formula: CoG = (Σx i × MEPi)/ΣMEPi, where x i is the coordinate referred to a point placed in the interhemispheric space (corresponding to the point on the surface of the brain where the interaural line intersects with the interhemispheric sulcus) identified on the MRI of each subject's brain, and MEPi refers to the average MEP amplitude at the point with coordinate x i. Between‐hemisphere comparisons of CoG position were examined in two ways. The position of the CoG measured on M1amp was subtracted from the CoG position measured on M1intact. First, the sign of the difference was used to indicate the position of one CoG relative to the other CoG; negative values indicate that the CoG in M1amp is positioned more laterally with reference to the midline than the CoG in M1intact (and conversely for positive values). Second, the absolute difference between M1amp and M1intact CoG positions indicates whether the two CoGs are equidistant from the midline or if there is an asymmetry between their medio‐lateral locations, regardless of the direction of the asymmetry.
Analyses were done with nonparametric statistics computed with Statistica (V 5.1, StatSoft). All comparisons were paired and the Wilcoxon matched pair test was used with statistical significance set at P < 0.05. All group data presented in the text are displayed as median (25th and 75th percentiles).
RESULTS
Motor Thresholds
Figure 2 shows the TMS motor thresholds for the stump and the intact arm muscles when fully relaxed (rMT) and when slightly contracted (aMT). Unsurprisingly, rMT was higher than aMT in both the stump and intact arm muscles (for both stump and intact P = 0.02). In all subjects the rMT of the stump muscle was lower than the rMT of the intact muscle (P = 0.02). In contrast, aMT of the stump and the intact muscles were not statistically different (P = 0.31). Note that analyses were conducted on seven subjects as both rMT and aMT were above 100% MSO on the intact side in S6.
Figure 2.
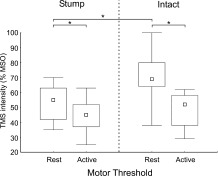
Resting and active motor thresholds measured in stump and intact muscles. Motor threshold is expressed as a percentage of Maximal Stimulator Output (MSO). In the rest condition, the muscles were fully relaxed. In the active condition, a slight contraction ranging between 5 and 10% of the muscle's maximal voluntary contraction was maintained. The small square indicates the median, the boxes indicate the 25th and 75th percentile and the error bars indicate the minimal and the maximal values. * P < 0.05
Maximal MEP Amplitude
Figure 3 shows the maximal MEP amplitude measured in both the stump and intact muscles when tested at rest and during a voluntary contraction. For the intact side, two subjects were excluded from the analysis; for S1 the rMT was equal to 100% MSO, thus it was not possible to stimulate at 120% rMT, for S6 both rMT and aMT were above 100% MSO. It is noteworthy that these two subjects were those taking Gabapentine, which is known to alter cortical excitability [Michelucci et al.,1996; Rizzo et al.,2001]. For the other subjects, the maximal MEP amplitude recorded on the intact side during muscle contraction was greater than that recorded at rest (P = 0.046). For the stump muscle, both rMT and aMT were sufficiently low in all subjects to permit stimulation at a TMS intensity of 120% of the threshold. Thus the results from all subjects were included in the stump muscle analyses. The maximal MEP amplitude did not differ between the two active conditions tested on the amputated side (i.e., during a muscle contraction and during a phantom movement that led to muscle contraction, P = 0.30), and both tended to be higher than the maximal MEP amplitude recorded at rest, although these differences did not reach statistical significance (rest vs. stump muscle contraction P = 0.07; rest vs. phantom movement P = 0.09].
Figure 3.
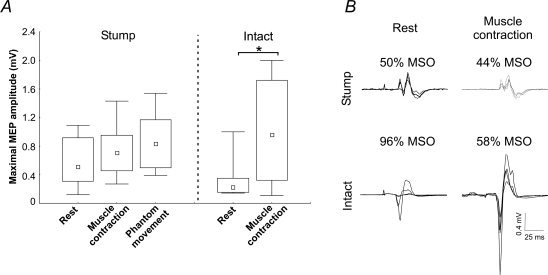
Maximal MEP amplitude recorded from the stump and intact muscles in all tested conditions. (A) Shows group results. Note that the results for the intact muscle contain data from only 6 subjects as the motor thresholds for S1 and S6 were too high to permit stimulation at 120% of the motor threshold. The small square indicates the median, the boxes indicate the 25th and 75th percentile and the error bars indicate the minimal and the maximal values, *P < 0.05. (B) Shows raw data from one subject (S3). Each panel is composed of four superimposed traces. Above each trace is the TMS intensity used in each condition expressed as a percentage of the maximal stimulator output (MSO). This example illustrates that going from rest to contraction resulted in a much larger increase in MEP amplitudes for the intact side, despite the fact that there was a much larger decrease in the intensity of stimulation used. Therefore differences in MEP amplitudes cannot be accounted for by differences in motor thresholds.
Although a direct comparison of the MEP modulation between the two hemispheres is complicated by the incomplete dataset on the intact side, the percentage increase in MEP amplitude from rest to activity was much smaller on the stump side. Indeed, the MEP amplitude increase on the stump side was 34% (1, 89; n = 8) between rest and the stump muscle contraction, and 49% (−12, 103; n = 8) between rest and the phantom hand movement. On the intact side, the MEP increase between rest and the intact muscle contraction was 166% (91, 351; n = 6). This asymmetry between hemispheres in the rest and active conditions is also well illustrated by the example of individual maps presented in Figure 1.
Center of Gravity of Motor Maps
Comparisons of the medio‐lateral position of the CoG of the motor maps between hemispheres in both rest and active conditions are presented in Figure 4. Data from S6 is omitted as it was impossible to perform a mapping of the intact side given that both rMT and aMT were above 100% MSO. Note that although S1 had a rMT of 100% MSO, it was possible to perform a mapping at this intensity and to obtain an average MEP amplitude above 50 μV at four map sites. The validity of the CoG obtained with these small MEPs is supported by the congruence of this CoG's location with that obtained in the active contraction condition (in which larger MEPs were obtained) (see comparison of Panels A and B for S1 in Fig. 4). For both rest and active conditions between‐hemisphere comparisons revealed that the distance from the midline of the stump CoG did not differ from that of the intact arm CoG (paired comparisons: at rest P = 1.0; active P = 0.87). At rest, the M1amp CoG position relative to the M1intact CoG position varied; M1intact − M1amp ranged between −19.7 and 9.4 mm [negative values indicate that the stump muscle's CoG was situated more laterally], with a median difference of 2.1 mm (−5.6, 3.8). The absolute difference (i.e., without taking into account the direction of the difference) was 5.1 mm (2.3, 9.5). When the muscles were voluntarily contracted, the M1amp CoG position relative to the M1intact CoG position varied between −16.0 and 9.2 mm with a median difference of −0.5 mm (−4.3, 2.7). The absolute difference in CoG positions was 3.5 mm (1.3, 8.5). When measured across conditions in a given hemisphere, the CoG position was highly stable for both M1intact and M1amp. This is evidenced by the fact that the biggest absolute mean difference in CoG position, which was obtained between rest and phantom hand conditions on M1amp, was only 1.6 mm (0.8, 2.4).
Figure 4.
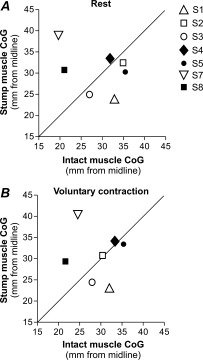
Medio‐lateral position of the CoGs of the cortical maps. In (A) the results from the rest condition are shown and in (B) the results obtained during a muscle contraction are shown. The stump muscle's CoG coordinate is reported on the y‐axis and the intact muscle's CoG is reported on the x‐axis. The oblique line indicates that both CoGs are situated at the same distance from the midline. Thus, if a point is located above the oblique line then the CoG in M1amp is further from the midline (more lateral) than the CoG in M1intact. Conversely, points located below the oblique line illustrate a more medial M1amp CoG. Each subject is identified with a different symbol. This allows one to see the relationship between their neurophysiological and clinical data (e.g., prosthesis use, phantom limb pain, etc.) and to assess any potential relationship with M1 reorganisation. Note that the filled symbols indicate subjects without phantom limb pain. Notably, only S7 and S8 (for both the rest and voluntary contraction conditions) showed a lateral shift of the stump CoG similar to that expected if the stump representation had moved laterally towards the hand representation.
Area of Motor Maps
The number of active sites of the map recorded at rest and during a contraction was compared between hemispheres. At rest, no difference was found in the map area (P = 1.0), the number of active sites being 10 (9, 10) on M1amp and 10 (8, 11) on M1intact. There was also no difference during muscle contraction (P = 0.6), the number of active sites being 9 (8.5, 10) on M1amp and 10 (7.5, 10.5) on M1intact. The number of active sites during phantom hand movement (M1amp) was 8.5 (8, 9.5).
DISCUSSION
The present study compared the M1 map of a stump muscle with the M1 map of the homologous muscle on the intact side during rest and muscle contraction in above‐elbow amputees. The results clearly show that: (1) the stump muscle map area is not different from that of the intact muscle and (2) the medio‐lateral locations of the stump and intact muscle maps are not always symmetric, but the direction of this asymmetry varies across subjects. While the present results differ from those of previous TMS studies of amputation‐induced changes in stump muscle maps, a direct comparison is difficult, because previous studies did not take into consideration interhemispheric imbalances in corticospinal excitability. The experimental design used here corrected for interhemispheric differences in corticospinal excitability by using a constant relative TMS intensity across tested muscles and conditions (i.e., TMS intensity was adjusted relative to the motor threshold of each tested muscle in each tested condition). This is crucial, since rMT was lower in the stump muscle compared with the intact muscle. Hence, had we used the same procedure as previous studies, that is, used a constant absolute TMS intensity (i.e., a TMS intensity equal in terms of MSO) to map both hemispheres, we would likely have recruited sites at more remote locations in the resting stump muscle representation as a result of the higher relative stimulation intensity. Here, using a more complete experimental design than that used in previous studies, we found no support for the often reported view that amputation‐induced plasticity leads to an expansion and lateral shift of stump muscle representations.
One limitation of the cortical mapping procedure employed in the present experiment is that maps were constructed using fixed dimension grids. Although this could potentially result in some active cortical sites not being stimulated, thereby influencing map size, the fact that maps contained on average 5.5 nonresponsive sites suggests that this was unlikely. Also, we focused on the medio‐lateral CoG coordinates since previous studies have reported medio‐lateral changes in motor representations [Irlbacher et al.,2002; Pascual‐Leone et al.,1996; Schwenkreis et al.,2001]. Once again, the influence of a fixed‐dimension grid on the CoG coordinate is likely to be minor as only a few very small amplitude MEPs were recorded at the medial and lateral borders of our maps.
Nonetheless, our data clearly show that there are plastic changes in stump muscle representations after amputation. This is supported by the interhemispheric difference in the corticospinal excitability of the tested muscles. Indeed, all subjects had a rMT that was lower on the stump side than on the intact side, a result concordant with previous reports [Chen et al.,1998; Cohen et al.,1991; Dettmers et al.,1999; Karl et al.,2001]. Such a systematic interhemispheric bias is not observed in healthy humans [Civardi et al.,2000], and while some authors have also reported no interhemispheric bias in amputees [Irlbacher et al.,2002; Schwenkreis et al.,2000,2001] this result is most likely related to the choice of the target muscle. Here, the target muscle was situated immediately above the amputation level and most importantly, was activated during movement of the phantom hand. In a previous study, we showed that the EMG activity in muscles immediately above the amputation level exhibited more modulation during phantom movements when compared with more proximal muscles [Gagné et al.,2009]. As muscle activity during phantom movements is an indicator of motor system reorganization, neurophysiological changes in M1 are likely to be maximal in the representations of those muscles activated during phantom movements and might be less obvious in more proximal stump muscles. Further support for this view comes from the observation that the more distal a muscle is relative to a spinal cord injury the more its cortical representation is reorganized [Lotze et al.,2006].
The interhemispheric differences we observed were not only limited to differences in rMT, the change in corticospinal facilitation when going from rest to contraction was also clearly different between the two hemispheres. The evidence for this comes first from the fact that the interhemispheric asymmetry observed for rMT was no longer present when motor thresholds were tested during muscle contraction (aMT). Thus, the corticospinal facilitation induced by the muscle contraction (measured via the motor threshold) was smaller for the stump muscle (M1amp) than for the intact muscle (M1intact). The second piece of evidence for a between‐hemisphere difference in corticospinal facilitation when going from rest to contraction comes from the observation that the amount by which the MEP amplitude increased during muscle contraction was smaller for the stump muscle. To illustrate this point it is interesting to contrast the two sides in terms of the facilitation of the MEP induced by contraction and the stimulation intensity used (c.f. Fig. 3B). Indeed, on the intact side the intensity of the stimulator, in terms of %MSO, was substantially lower during contraction than during rest (on average 56% MSO versus 79% MSO) and yet, on average, a 150% increase in MEP amplitude was observed during contraction. In contrast, on the amputated side, the stimulator intensity used during contraction was only moderately lower than that used during rest (on average 54% MSO versus 62% MSO). If the net facilitation induced by the stump contraction was the same as on the intact side, an increase in MEP amplitude greater than 150% would be expected (since the stimulation intensity during stump contraction was close to that used during the rest condition, as opposed to the intact side where it was substantially lower). Instead, for the stump muscle, MEP amplitude only increased by about 50% between the rest and active conditions. These results are congruent with those reported previously by Ridding and Rothwell [1995], who observed that the maxMEP amplitude and the area of the M1 map were greater for the resting stump muscle than for the resting homologous intact muscle, but that these differences vanished when the muscles were slightly contracted. Together, these results suggest that during voluntary contraction the corticospinal excitability of the stump and the intact muscles is similar. Thus, the fact that less facilitation is observed when going from rest to contraction on the stump side than on the intact side can be attributed to an increased excitability of the resting stump muscle motor representation.
The results of animal studies that used microstimulation to map M1 of chronically amputated monkeys [Schieber and Deuel,1997; Wu and Kaas,1999] give some ideas about the possible neural mechanisms underlying the increased corticospinal excitability observed in the resting stump muscle in the absence of an interhemispheric difference in corticospinal excitability during muscle contraction. These studies showed that stump movements could be elicited from additional sites in M1amp but that the thresholds required to evoke such movements were either equivalent or higher than those for the intact side or for normal controls. These new high‐threshold sites indicate that after an amputation new populations of neurons now have active projections to stump muscles. This agrees with a recent idea proposing that neurons formerly related to hand muscles remain functional in M1 after an upper limb amputation [Reilly and Sirigu,2008; Reilly et al.,2006; Roricht and Meyer,2000], but that these neurons now project to stump muscles [Mercier et al.,2006] (either through new projections or through “unmasking” of existing but formerly inactive cortico‐spinal connections), and are implicated in phantom movements [Gagné et al.,2009; Mercier et al.,2006; Reilly et al.,2006]. At rest, it is conceivable that TMS recruits a mixture of hand‐related and stump‐related neurons which together generate a sufficient corticospinal drive to activate the stump muscle with a lower TMS intensity than on the intact side. In contrast, if only one of the two neuron populations is recruited during an active contraction (according to whether the intention is to contract the stump or to move the phantom) only a subset of the neurons projecting to the stump would have an increased excitability. Consequently, the TMS intensity necessary to evoke an MEP in the contracting stump muscle might be, as observed in the present study, equivalent to that required to produce MEPs in the contracting muscle on the intact side. Although this interpretation is consistent with the results of the present study as well as with those of animal studies, the spatial resolution of the TMS pulse is much wider than that of a microstimulation pulse and we cannot, therefore, use TMS to test this hypothesis directly.
No systematic shift of the stump muscles CoGs was found relative to the intact side, despite the classical view that the CoG of motor representations adjacent to the former hand representation should “shift” toward it. Several clinical factors might influence the extent of motor cortex reorganisation such as the level of amputation, the intensity of phantom limb pain and intensive prosthesis use, especially a myoelectric prosthesis. Our sample was very homogeneous in terms of amputation level, as all patients had an above‐elbow amputation. Results of previous studies suggest that patients suffering from phantom limb pain [Karl et al.,2001; Lotze et al.,2001] and patients that do not intensively use a prosthesis [Lotze et al.,1999] generally exhibit more cortical reorganization. As the majority of patients in our sample suffered from phantom limb pain and did not intensively used a prosthesis, it appears unlikely that clinical factors account for fact that we did not observe a systematic shift in CoG position. Moreover, examination of individual displacements of CoGs (see Fig. 4) does not suggest larger displacements for patients with phantom limb pain or without prosthesis. Given the small sample size, however, no definitive conclusions should be drawn regarding the relationship between clinical variables and CoG shifts. It is noteworthy that some of the studies that have shown shifts in motor representations after amputation looked at changes in face muscle representations [Karl et al.,2001,2004; Lotze et al.,2001]. Changes affecting the face representation might be easier to observe than changes affecting stump muscles since, as shown in animal studies, there is a much clearer spatial segregation of the hand representation from the face representation than from stump muscle representations [Park et al.,2001]. A lateral shift of the stump muscle's CoG has nevertheless been reported in a few studies [Dettmers et al.,1999; Irlbacher et al.,2002; Pascual‐Leone et al.,1996], two of these being single‐case studies, while other authors have reported no shift in CoG position but a medial shift in the “hotspot” for evoking MEPs [Karl et al.,2001]. Our results suggest that there is an asymmetry in the cortical map location between the intact and amputated side but that it is not necessarily a systematic shift in a given direction. Mapping studies in animal models show a dense overlap of distal and proximal upper‐limb muscle representations in M1 [Park et al.,2001; Rathelot and Strick2006]. As this overlap is likely present in humans as well [Sanes et al.,1995], it might explain the intersubject variation in the direction of the postamputation displacement of the CoG in M1. In addition, a recent study conducted in stroke patients reported that changes in CoG location induced by therapy were not oriented toward a constant direction (relative to anatomical landmarks) but were instead oriented towards the cortical regions with the lowest amount of intracortical inhibition [Liepert et al.,2006]. A similar factor might also underlie the change in CoG location observed after amputation, as there is evidence for a down‐regulation of inhibitory activity in the region of M1amp that previously controlled the now‐amputated limb [Capaday et al.,2000; Chen et al.,1998].
The amplitude of MEPs evoked using single pulse TMS depends on both cortical and spinal excitability. Thus, the definitive site in the neuraxis where amputation‐induced changes influence TMS variables cannot be unequivocally assessed from the present results. However, changes at the cortical level likely make a major contribution to the TMS response modulation, as previous studies using peripheral nerve stimulation, which probes spinal excitability, have observed patterns of muscle responses on the amputated side similar to those on the intact side [Cohen et al.,1991; Fuhr et al.,1992]. Nevertheless, a contribution from spinal reorganization cannot be ruled out, as evidence from animal models suggests that motoneurons formerly supplying the now amputated muscles now target the muscles situated just above the amputation level [Wu and Kaas,2000], and that these motoneurons likely continue to receive corticospinal input from M1 [Wu and Kaas,1999].
CONCLUSION
The results of the present study call into question the often reported view that upper limb amputation‐induced plasticity in M1 leads to the enlargement of stump muscle representations at the expense of the more laterally located representation of the now missing hand. This concept likely arose from the results of imaging experiments that showed an enlargement of the face's sensory representation into the upper limb's sensory representation, but clear indications of a similar enlargement of the face representation in the motor domain remain rare. Moreover, the observation of a medial shift of the face representation should not lead to the conclusion that stump muscles should reciprocally shift laterally, as prior to the amputation the segregation between face and hand representations is much clearer than that between hand and proximal arm muscle representations, making it easier to observe representational shifts between the face and the hand than between the hand and the proximal arm.
Acknowledgements
The authors thank Dr. Angela Sirigu, Joëlle Dubé, and Pierre‐Olivier Lauzon for their valuable contributions to this work.
REFERENCES
- Capaday C, Richardson MP, Rothwell JC, Brooks DJ ( 2000): Long‐term changes of GABAergic function in the sensorimotor cortex of amputees. A combined magnetic stimulation and 11C‐flumazenil PET study. Exp Brain Res 133: 552–556. [DOI] [PubMed] [Google Scholar]
- Chen R, Corwell B, Yaseen Z, Hallett M, Cohen LG ( 1998): Mechanisms of cortical reorganization in lower‐limb amputees. J Neurosci 18: 3443–3450. [DOI] [PMC free article] [PubMed] [Google Scholar]
- Civardi C, Cavalli A, Naldi P, Varrasi C, Cantello R ( 2000): Hemispheric asymmetries of cortico‐cortical connections in human hand motor areas. Clin Neurophysiol 111: 624–629. [DOI] [PubMed] [Google Scholar]
- Cohen LG, Bandinelli S, Findley TW, Hallett M ( 1991): Motor reorganization after upper limb amputation in man. A study with focal magnetic stimulation. Brain 114( Part 1B): 615–627. [DOI] [PubMed] [Google Scholar]
- Dettmers C, Liepert J, Adler T, Rzanny R, Rijntjes M, van Schayck R, Kaiser W, Bruckner L, Weiller C ( 1999): Abnormal motor cortex organization contralateral to early upper limb amputation in humans. Neurosci Lett 263: 41–44. [DOI] [PubMed] [Google Scholar]
- Elbert T, Sterr A, Flor H, Rockstroh B, Knecht S, Pantev C, Wienbruch C, Taub E ( 1997): Input‐increase and input‐decrease types of cortical reorganization after upper extremity amputation in humans. Exp Brain Res 117: 161–164. [DOI] [PubMed] [Google Scholar]
- Flor H, Elbert T, Knecht S, Wienbruch C, Pantev C, Birbaumer N, Larbig W, Taub E ( 1995): Phantom‐limb pain as a perceptual correlate of cortical reorganization following arm amputation. Nature 375: 482–484. [DOI] [PubMed] [Google Scholar]
- Fuhr P, Cohen LG, Dang N, Findley TW, Haghighi S, Oro J, Hallett M ( 1992): Physiological analysis of motor reorganization following lower limb amputation. Electroencephalogr Clin Neurophysiol 85: 53–60. [DOI] [PubMed] [Google Scholar]
- Gagné M, Reilly KT, Hétu S, Mercier C ( 2009): Motor control over the phantom limb in above‐elbow amputees and its relationship with phantom limb pain. Neuroscience 162: 78–86. [DOI] [PubMed] [Google Scholar]
- Grusser SM, Winter C, Schaefer M, Fritzsche K, Benhidjeb T, Tunn P, Schlag PM, Flor H ( 2001): Perceptual phenomena after unilateral arm amputation: A pre‐post‐surgical comparison. Neurosci Lett 302: 13–16. [DOI] [PubMed] [Google Scholar]
- Irlbacher K, Meyer BU, Voss M, Brandt SA, Roricht S ( 2002): Spatial reorganization of cortical motor output maps of stump muscles in human upper‐limb amputees. Neurosci Lett 321: 129–132. [DOI] [PubMed] [Google Scholar]
- Karl A, Birbaumer N, Lutzenberger W, Cohen LG, Flor H ( 2001): Reorganization of motor and somatosensory cortex in upper extremity amputees with phantom limb pain. J Neurosci 21: 3609–3618. [DOI] [PMC free article] [PubMed] [Google Scholar]
- Karl A, Muhlnickel W, Kurth R, Flor H ( 2004): Neuroelectric source imaging of steady‐state movement‐related cortical potentials in human upper extremity amputees with and without phantom limb pain. Pain 110: 90–102. [DOI] [PubMed] [Google Scholar]
- Kew JJ, Ridding MC, Rothwell JC, Passingham RE, Leigh PN, Sooriakumaran S, Frackowiak RS, Brooks DJ ( 1994): Reorganization of cortical blood flow and transcranial magnetic stimulation maps in human subjects after upper limb amputation. J Neurophysiol 72: 2517–2524. [DOI] [PubMed] [Google Scholar]
- Kooijman CM, Dijkstra PU, Geertzen JHB, Elzinga A, Van der Schans CP ( 2000): Phantom pain and phantom sensations in upper limb amputee: An epidemiological study. Pain 7: 33–41. [DOI] [PubMed] [Google Scholar]
- Liepert J, Haevernick K, Weiller C, Barzel A ( 2006): The surround inhibition determines therapy‐induced cortical reorganization. Neuroimage 32: 1216–1220. [DOI] [PubMed] [Google Scholar]
- Lotze M, Grodd W, Birbaumer N, Erb M, Huse E, Flor H ( 1999): Does use of a myoelectric prosthesis prevent cortical reorganization and phantom limb pain? Nat Neurosci 2: 501–502. [DOI] [PubMed] [Google Scholar]
- Lotze M, Flor H, Grodd W, Larbig W, Birbaumer N ( 2001): Phantom movements and pain. An fMRI study in upper limb amputees. Brain 124: 2268–2277. [DOI] [PubMed] [Google Scholar]
- Lotze M, Laubis‐Herrmann U, Topka H ( 2006): Combination of TMS and fMRI reveals a specific pattern of reorganization in M1 in patients after complete spinal cord injury. Restor Neurol Neurosci 24: 97–107. [PubMed] [Google Scholar]
- Mercier C, Reilly KT, Vargas CD, Aballea A, Sirigu A ( 2006): Mapping phantom movement representations in the motor cortex of amputees. Brain 129: 2202–2210. [DOI] [PubMed] [Google Scholar]
- Michelucci R, Passarelli D, Riguzzi P, Buzzi AM, Gardella E, Tassinari CA ( 1996): Transcranial magnetic stimulation in partial epilepsy: Drug‐induced changes of motor excitability. Acta Neurol Scand 94: 24–30. [DOI] [PubMed] [Google Scholar]
- Ojemann JG, Silbergeld DL ( 1995): Cortical stimulation mapping of phantom limb rolandic cortex. Case report. J Neurosurg 82: 641–644. [DOI] [PubMed] [Google Scholar]
- Park MC, Belhaj‐Saif A, Gordon M, Cheney PD ( 2001): Consistent features in the forelimb representation of primary motor cortex in rhesus macaques. J Neurosci 21: 2784–2792. [DOI] [PMC free article] [PubMed] [Google Scholar]
- Pascual‐Leone A, Peris M, Tormos JM, Pascual AP, Catala MD ( 1996): Reorganization of human cortical motor output maps following traumatic forearm amputation. Neuroreport 7: 2068–2070. [DOI] [PubMed] [Google Scholar]
- Rathelot JA, Strick PL ( 2006): Muscle representation in the macaque motor cortex: An anatomical perspective. Proc Natl Acad Sci USA 103: 8257–8262. [DOI] [PMC free article] [PubMed] [Google Scholar]
- Reilly KT, Sirigu A ( 2008): The motor cortex and its role in phantom limb phenomena. Neuroscientist 14: 195–202. [DOI] [PubMed] [Google Scholar]
- Reilly KT, Mercier C, Schieber MH, Sirigu A ( 2006): Persistent hand motor commands in the amputees' brain. Brain 129: 2211–2223. [DOI] [PubMed] [Google Scholar]
- Ridding MC, Rothwell JC ( 1995): Reorganisation in human motor cortex. Can J Physiol Pharmacol 73: 218–222. [DOI] [PubMed] [Google Scholar]
- Rizzo V, Quartarone A, Bagnato S, Battaglia F, Majorana G, Girlanda P ( 2001): Modification of cortical excitability induced by gabapentin: A study by transcranial magnetic stimulation. Neurol Sci 22: 229–232. [DOI] [PubMed] [Google Scholar]
- Roricht S, Meyer BU ( 2000): Residual function in motor cortex contralateral to amputated hand. Neurology 54: 984–987. [DOI] [PubMed] [Google Scholar]
- Roricht S, Meyer BU, Niehaus L, Brandt SA ( 1999): Long‐term reorganization of motor cortex outputs after arm amputation. Neurology 53: 106–111. [DOI] [PubMed] [Google Scholar]
- Sanes JN, Donoghue JP, Thangaraj V, Edelman RR, Warach S ( 1995): Shared neural substrates controlling hand movements in human motor cortex. Science 268: 1775–1777. [DOI] [PubMed] [Google Scholar]
- Schieber MH, Deuel RK ( 1997): Primary motor cortex reorganization in a long‐term monkey amputee. Somatosens Mot Res 14: 157–167. [DOI] [PubMed] [Google Scholar]
- Schwenkreis P, Witscher K, Janssen F, Dertwinkel R, Zenz M, Malin JP, Tegenthoff M ( 2000): Changes of cortical excitability in patients with upper limb amputation. Neurosci Lett 293: 143–146. [DOI] [PubMed] [Google Scholar]
- Schwenkreis P, Witscher K, Janssen F, Pleger B, Dertwinkel R, Zenz M, Malin JP, Tegenthoff M ( 2001): Assessment of reorganization in the sensorimotor cortex after upper limb amputation. Clin Neurophysiol 112: 627–635. [DOI] [PubMed] [Google Scholar]
- Siebner HR, Rothwell J ( 2003): Transcranial magnetic stimulation: New insights into representational cortical plasticity. Exp Brain Res 148: 1–16. [DOI] [PubMed] [Google Scholar]
- Wu CW, Kaas JH ( 1999): Reorganization in primary motor cortex of primates with long‐standing therapeutic amputations. J Neurosci 19: 7679–7697. [DOI] [PMC free article] [PubMed] [Google Scholar]
- Wu CW, Kaas JH ( 2000): Spinal cord atrophy and reorganization of motoneuron connections following long‐standing limb loss in primates. Neuron 28: 967–978. [DOI] [PubMed] [Google Scholar]