

Abstract
Previous studies have shown that healthy anatomical as well as functional brain networks have small‐world properties and become less optimal with brain disease. During sleep, the functional brain network becomes more small‐world‐like. Here we test the hypothesis that the functional brain network during wakefulness becomes less optimal after sleep deprivation (SD). Electroencephalography (EEG) was recorded five times a day after a night of SD and after a night of normal sleep in eight young healthy subjects, both during eyes‐closed and eyes‐open resting state. Overall synchronization was determined with the synchronization likelihood (SL) and the phase lag index (PLI). From these coupling strength matrices the normalized clustering coefficient C (a measurement of local clustering) and path length L (a measurement of global integration) were computed. Both measures were normalized by dividing them by their corresponding C‐s and L‐s values of random control networks. SD reduced alpha band C/C‐s and L/L‐s and theta band C/C‐s during eyes‐closed resting state. In contrast, SD increased gamma‐band C/C‐s and L/L‐s during eyes‐open resting state. Functional relevance of these changes in network properties was suggested by their association with sleep deprivation‐induced performance deficits on a sustained attention simple reaction time task. The findings indicate that SD results in a more random network of alpha‐coupling and a more ordered network of gamma‐coupling. The present study shows that SD induces frequency‐specific changes in the functional network topology of the brain, supporting the idea that sleep plays a role in the maintenance of an optimal functional network. Hum Brain Mapp, 2013. © 2011 Wiley Periodicals, Inc.
Keywords: sleep, synchronization, functional connectivity, small‐world network, graph theory, EEG
INTRODUCTION
Sleep deprivation (SD) affects brain function and cognitive processing [see e.g., Peigneux et al.,2001; Stickgold,2005; Van Der Werf et al.,2009; Walker,2009]. Decreased cognitive performance after SD suggests that sleep is involved in the restoration and preservation of an optimal neural network for information processing during wakefulness. This maintenance could involve restoration of energy metabolism [Benington and Heller,1995], synaptic homeostasis [Tononi and Cirelli,2003,2006], and adaptation of memory traces to maintain encoding capacity in the neuronal network [Yoo et al.,2007]. Numerous recent studies have shown that graph theory provides an excellent tool to characterize neuronal network capacities from coupling parameters of signals obtained during resting state electroencephalography (EEG), magnetoencephalography (MEG) or functional magnetic resonance imaging (fMRI), [see e.g., Ferri et al.,2008; Leistedt et al.,2009; Micheloyannis et al.,2006; Rubinov et al.,2009; Stam et al.,2009; Van den Heuvel et al.,2009; Wang et al.2008].
In graph theory, a network is represented as nodes that are connected by edges. Simple examples of network topologies are regular and random networks. In a regular network, each node is connected to an equal number of its closest neighbours, forming a lattice like network. In a random network, nodes are randomly connected to each other. Watts and Strogatz proposed a model that uses two characteristics to define the position of a network between the extremes of an ordered and a random network [Watts and Strogatz,1998]. The first measure is the clustering coefficient C which provides information about the local connectivity of a graph. The clustering coefficient is the probability that the neighbours of a node are also connected to each other. The second measure is the path length L, which is the average minimal number of edges it takes to go from one node to any other node. The path length provides information about the global integration of a network. When studying networks, C and L are often normalized by dividing them by the corresponding C and L values of ensembles of random networks that have the same number of nodes and edges. These normalized values, C/C‐s and L/L‐s, are thus relative to a random network.
Watts and Strogatz discovered that an ordered network with a few random connections combined the advantages of both extreme topologies: a high local connectivity (high C, seen in an ordered, not in a random network) as well as few long range connections that ensured global integration (small L, seen in a random, not in an ordered network) [Watts and Strogatz1998]. The authors called this a small‐world network. The combination of high C and small L has been suggested to be optimal for information processing and network building costs [Lago‐Fernández et al.,2000; Latora and Marchiori,2001]. This small‐world architecture has been found to describe networks ranging from the nervous system of C. elegans to metabolic networks, the Internet and social networks [Boccaletti et al.,2006; Strogatz,2001].
The complex network of the brain can be studied with the above mentioned network characteristics. A node is a brain region or an EEG or MEG channel, and an edge is present when there is an anatomical connection or functional correlation between two nodes. It has been found that the structural [Gong et al.,2009; He et al.,2007; Iturria‐Medina et al.,2007] (see also review by [Sporns and Zwi,2004]) as well as the functional brain network [Achard et al.,2006; Bassett et al.,2006; Stam,2004] can be described as a small‐world network (see reviews by [Bassett and Bullmore,2006; Bullmore and Sporns,2009]. Several studies have investigated the change in network topology in brain disease. In patients with Alzheimer's disease [Stam et al.,2009], schizophrenia [Micheloyannis et al.,2006; Rubinov et al.,2009], and during sleep of depressed patients [Leistedt et al.,2009] the functional network is more random than the network of a healthy brain. A shift to a more regular network has been found in boys with attention/hyperactivity disorder [Wang et al.,2008]. Though different brain diseases show different changes in topology, the above mentioned studies illustrate that the topology of the functional network of a diseased brain can be regarded as less optimal because it deviates from the small‐world network topology.
During sleep, the topology of the functional brain network becomes more small‐world‐like as described by an increase in C/C‐s, whereas L/L‐s remains roughly the same [Ferri et al.,2008]. This is seen in frequency bands below 15 Hz during light, slow wave, and REM sleep. The authors suggested that these changes represent a shift towards a more optimal network and could be involved in the memory consolidation processes thought to take place during sleep. Moreover, Ferri et al. hypothesized that during wakefulness the coupling network drifts to a more random configuration because of sensory input and formation of new memory traces. During sleep, neuronal plasticity processes might recover the optimal organization of the network. This is in agreement with the hypothesis of Tononi and Cirelli [2003,2006], which states that daytime input results in an excess of synaptic potentiation whereas sleep ensures synaptic downscaling to increase the signal‐to‐noise ratio. If the sleeping brain processes wake‐induced network changes and thereby promotes restoration of the small‐world properties, a night of sleep deprivation is predicted to induce the next day's network to deviate from the small‐world optimum seen after a normal night of sleep.
In this study, we aimed to address this hypothesis. To investigate the effect of sleep deprivation on the functional brain network, high‐density EEG of eight healthy subjects was recorded during eyes‐closed and eyes‐open resting state five times a day after a normal night of sleep and after a night of sleep deprivation (SD). Furthermore, the functional relevance of possible sleep deprivation‐induced changes in network properties was assessed by associating them with changes in performance on a sustained attention task that immediately followed each resting state EEG recording. We hypothesized the network to be less optimal after a sleepless night because of the lack of an opportunity for the functional brain network to be “reset” to its optimal state. More specifically, we expected changes in the network of theta band because this frequency band is involved in working memory which is critical to executive functions [Klimesch et al.,2005; Sarnthein et al.,1998; Stam et al.,2002] and is found to be affected by SD [Habeck et al.,2004; Thomas et al.,2000]. Furthermore, because attenuated memory function and lapses of conscious attention are both typical of sleep deprived people, we expected changes in the network of beta and gamma band because these frequency bands are involved in memory processing [Axmacher et al.,2008; Herrmann et al.,2004] and in the binding process necessary for stimuli to reach consciousness [Gray et al.,1989; Nase et al.,2003] see for a review [Tallon‐Baudry and Bertrand,1999].
MATERIALS AND METHODS
Subjects
Of the 12 healthy, nonsmoking volunteers who were enrolled in this study, two were excluded because of insufficient compliance to the sleep deprivation requirements, one because she had undergone brain surgery, and one because he deviated from all other subjects by showing an inversed alpha attenuation. Subjects (n = 8, five males, mean age ± standard deviation: 22.00 ± 1.77 years, range 20–26) were free from medication, including hormonal contraceptives, and did not suffer from psychiatric or sleep disorders. All female subjects participated between Days 4 and 12 of their menstrual cycle (follicular phase). The study protocol was approved by the Medical Ethics Committee of the VU University Medical Center. All participants gave their written informed consent.
Behavioural Procedures
Participants were instructed to keep a regular sleep‐wake pattern during the week preceding the study. This was verified with a sleep diary and actigraphy (Actiwatch, Cambridge Neuro‐Technology, Cambridge, UK). Actigraphic recordings during the sleep deprivation nights were scored in an automated and objective way using the proprietary Actiware software version 5.59.0015 (Philips Respironics, Bend, Oregon). In two subjects that were excluded from all analyses, sleep could not be excluded. In all subjects included in the present report, sleep was clearly present in the normal nights while the sleep deprivation nights did not contain a single interval that could be recognized as sleep period. This suggests adherence to the instructions and successful deprivation. During an introductory session a week prior to the experimental procedure, the experimental protocol was explained to the subjects. Participants had to refrain from alcohol and caffeine intake a day prior to and during the experiment. They also had to refrain from eating at least four hours before arriving at the sleep laboratory at 08.30 h in the morning.
The experiment consisted of 2 days with a minimum interval of two nights of normal sleep. Prior to each experimental day, subjects either had a night of normal sleep (NS) or a night of total sleep deprivation (SD). Absence of sleep was verified by actigraphy. The order of the conditions was randomized and counterbalanced across subjects.
After arrival at the laboratory, subjects were inquired about compliance to instructions of the experimental protocol and subsequently prepared for high density EEG measurements. Both experimental days consisted of five consecutive blocks with a duration of 1.5 h each. Each block consisted of the same procedures (see Fig. 1). The present analyses concern eyes‐closed and eyes‐open resting state EEG data as recorded during the Alpha Attenuation Test (AAT; [Stampi et al.,1995]) as well as the subsequent performance on a sustained attention simple reaction time task (the Brief Stimulus Reaction Time Task, BSRT [Romeijn and Van Someren,2011]) was used for the present investigation. During the AAT, participants alternatively kept their eyes opened and closed for a minute for a total duration of four minutes. During eyes‐open, they were required to fixate on a black circle on a computer screen. The time points of the EEG recordings were ∼10.30—12.00—13.30—15.00—16.30 h. The average reaction speed (inverse of reaction time) and the number of lapses on the BSRT, which immediately followed the AAT, were used as behavioural measures of vigilance.
Figure 1.
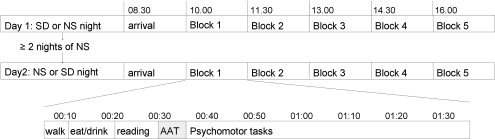
Schematic time course of experimental procedures. Blocks were all similar and consisted of the following procedures. Each block started with a 10‐min walk to the bathroom. This was followed by a period of another 10 min for the consumption of an isocaloric meal (230 kcal) and drink (70 kcal). Subjects were seated behind a 17‐in. computer screen on which the tasks were projected under dim‐light conditions (<15 lux). The series of computer tasks started with a 10‐min reading period for the subjects to become habituated to the experimental room and the equipment. This was followed by the AAT and several psychomotor tasks, of which the first was the BSRT. Time of recording of eyes‐closed and eyes‐open resting state during AAT was ∼10.30—12.00—13.30—15.00—16.30 h, the BSRT started 5 min later.
Brief stimulus reaction time task (BSRT)
Sustained attention tasks have shown to be of value for vigilance monitoring in numerous studies. While the most familiar implementation may be the psychomotor vigilance task [PVT, Dinges and Powell,1985], several other simple and more complex reaction time tasks have successfully been applied, for example to demonstrate subtle abnormalities in vigilance in insomnia [Altena et al.,2008]. We recently reported on a novel sustained attention task [Romeijn and Van Someren,2011] that increases the likelihood of lapses as well as the range and average of reaction times, thus better allowing for subtle fluctuations in vigilance that occur even during rested conditions [Peiris et al.,2006]. As compared to the PVT, our BSRT has a longer duration (PVT: 10 min, BSRT: 19 min); a shorter stimulus presentation duration (PVT: maximally 999 ms, BSRT: 25 ms); relatively long random interstimulus intervals (PVT: 1–10 s, BSRT: 4–14 s); a small stimulus size; and a low contrast between the stimulus and fixation cross. Participants were instructed to fixate at a black crosshair (“+”), displayed against a gray background, and to respond as fast as possible if they saw the fixation cross change into a hyphen (“−”), by pressing a button with the index finger of their dominant hand. The hyphen was presented for only 25 ms and occurred after a random interval lasting between 4 and 14 s (84 ms step resolution). Reaction times (RT) were recorded with millisecond precision. In accordance with previous recommendations, an individual lapse threshold was defined [Santhi et al.,2007]. Thus, a lapse was recorded in case of an omission or if the reaction time exceeded the 90th percentile of the distribution of all recorded RTs on the day following a normal night's sleep.
EEG Acquisition
EEG was obtained with a 61‐equidistant channel EEG‐cap (M10, Easycap, Munich, Germany). Inter‐electrode distance was 37 ± 3 mm, given a head circumference of 58 cm. EEG signals were recorded with a Micromed SD‐LTM64 recorder and SystemPlus software (Micromed, Mogliano Veneto, Italy). Impedance was kept below 10 kOhm. EEG data were digitized at a sampling rate of 1,024 Hz.
EEG Analysis
Preprocessing
Off‐line EEG analysis was done using EEGlab (v2008b, [Delorme and Makeig2004]) and Fieldtrip (http://www.ru.nl/neuroimaging/fieldtrip) in MatLab 7.6 (The MathWorks, Natick, MA). Data were down‐sampled from 1,024 to 512 Hz and bad channels were interpolated with use of the triangle‐based linear interpolation method in MatLab 7.6. We chose not to discard assessments that contained at least one bad channel, which occurred in 23 out of the 80 assessments, since this would unduly reduce our statistical power while being overconservative. Because different channels could be bad in different assessments, systematic rejection from all recordings of all channels that were bad at least once, would reduce our dataset by 13 channels (i.e., 21%). Thus, interpolation appeared reasonable since it had to be done for at most four channels in any single assessment (average 0.38 channels). We moreover verified that there was no systematic difference in the number of interpolated channels between recordings made after sleep deprivation and those after normal sleep (χ2 = 2.33, df = 4, P = 0.68). As a final check, ancillary analyses including the number of interpolated channels as a regressor in the mixed effect regression analyses never revealed any significant effect, nor notable changes in the effect estimates of the regressors of interest. EEG recordings were re‐referenced from the common reference at Cz to an average reference. EEG data were filtered with a 1 Hz high pass filter and a 50 Hz Notch filter. Independent component analysis (ICA) was applied to remove artefacts due to blinks and eye movements [Jung et al.,2000]. Epochs were selected with visual inspection (MK) to exclude epochs containing large muscle artefacts. Analyses were performed on four epochs with a duration of 8 s each (4,096 samples) for each of the five blocks on both the NS and SD days, for each subject. For each subject, on each of the 2 days and within each of the five blocks, four epochs of 8 s (4,096 samples) were selected for both the eyes‐open and eyes‐closed conditions. Thus the total duration of EEG analysed for each subject equalled 640 s (2 days of five blocks with two eye‐conditions of four 8‐s epochs each). Coupling analyses were computed on digital zero‐phase shift filtered standard frequency bands (delta: 1–4 Hz, theta: 4–8 Hz, alpha: 8–13 Hz, beta: 13–30 Hz, and gamma: 30–48 Hz).
Spectral analysis
Power spectral density was calculated by means of fast Fourier transformation using DIGEEGXP (version 2.0), software written by one of the authors (CS). Signals were bandpass filtered at 1–200 Hz before relative power was computed per channel per 8‐s epoch. Afterward, values were averaged over all channels and epochs to result in an average spectral power value in each frequency band for each of the ten (5 NS and 5 SD) time points per person.
Computation of synchronization likelihood (SL)
SL quantifies coupling between pairs of time series [Stam and van Dijk,2002]. SL is a measure of generalized synchronization in state space and is sensitive to both linear and nonlinear interdependencies. The basic principle is to search for recurrence of patterns within time series. SL represents the chance that recurrence of a pattern in time series X coincides with recurrence of another pattern in time series Y. The lower bound of SL is P ref, the likelihood of coincident pattern recurrence in case of independent time series. Here, P ref was set at 0.01. The higher bound of SL in case of maximally synchronous signals is 1. Parameters for the SL computation were based upon the frequency content of the recordings as described in Montez et al. [Montez et al.,2006]. For a complete mathematical description of SL, see Appendix A.
Computation of phase lag index (PLI)
Another measurement of synchronization is the PLI which calculates the phase relation between two signals [Stam et al.,2007]. It reflects the consistency of the phase difference between two time series that is observed when two signals have the same pattern but are shifted by a time lag (phase difference). Because zero phase lags are ignored, correlations due to volume conduction are excluded. For a complete description, see Appendix B.
Computation of the clustering coefficient C and characteristic path length L
A graph is based on the synchronization matrix that contains the synchronization values of all pairwise channel combinations. In a weighted graph, edges represent the strength of the coupling given by the N × N synchronization matrix. Once the synchronization matrix is converted to a graph, its clustering coefficient C and characteristic path length L can be determined. We used the definition of weighted analysis proposed by Stam et al. [2009]. This definition only requires the weight (i.e., the coupling strength derived form the synchronization matrix) between nodes i and j to be symmetrical (w ij = w ji), and that 0 ≤ w ij ≤ 1 holds. Both conditions are fulfilled when SL or PLI are used as coupling measures.
In a graph, C is the ratio of the number of edges between the neighbours of a node and the maximum possible edges between these neighbours. It gives the probability that the neighbours of a node are also connected to each other and hereby reflects the local clustering of a network. In a weighted graph, C for node i is defined as:
| (1) |
In case w ij equals 0 or 1, this definition is equivalent to the classical definition for unweighted graphs [Watts and Strogatz,1998].
C is computed for each node in the graph and then averaged for the entire network. C w for the entire network can be determined via Eq. (1) as:
| (2) |
L is computed as the average minimal number of edges that have to be crossed to travel from any one node to any other node. This average shortest pathway between any two nodes reflects the global integration of a network. In a weighted graph, the shortest pathway between two nodes is defined by the sum of the lengths of the edges in this path. The length of an edge is defined as the inverse of the edge weight (edge weight is coupling strength; L ij = 1/w ij, with w ij ≠ 0). L is computed for each pair of nodes and subsequently averaged. The average weighted path length of the entire graph is computed as:
| (3) |
The graph characteristics C and L were normalized by dividing them by the average C‐s and L‐s values obtained from 1,000 random graphs in which all initially obtained edge weights were randomly assigned to an equal number of nodes. Computation of all variables (pairwise SL and PLI, graph characteristics C/C‐s and L/L‐s) was done with DIGEEGXP.
Behavioural Analysis
To obtain a normal distribution for the recorded responses, the inverse of reaction times in the BSRT was taken, denoted as “speed” (s−1). For each block, an individual's average speed and number of lapses was calculated.
Statistical Analysis
To determine the effects of SD on the variables mentioned above, mixed effect regression modelling was applied with use of MLwiN software (Centre for Multilevel Modelling, Institute of Education, London, UK). This analysis takes into account the interdependency of the data points inherent to the hierarchical structure of the design: five time points (i) a day were nested in 2 days (j) that were nested once more within subjects (k). We secondarily evaluated spectral power as a covariate in the regression models to account for the possible confounding influence of SD‐induced changes in power on the effect that SD has on overall synchronization and graph characteristics. Two‐tailed significance levels were set at 0.05 for all analyses.
RESULTS
An overview of grand averages of power, synchronization and network characteristics per time block after NS and SD can be found in exhaustive tables provided online as Supporting Information.
Spectral Analysis
Mixed effect regression analysis showed significant changes in the relative power spectrum after SD. SD attenuated eyes‐closed alpha power (Z= −5.09, P < 0.00001) and increased eyes‐closed delta (Z = 5.12, P < 0.00001) and theta power (Z = 3.44, P = 0.0006). SD also attenuated eyes‐open alpha power (Z = −2.23, P= 0.03). Other frequency bands were not significantly different after SD compared to NS.
Overall Functional Connectivity
SD affected the overall SL and PLI synchronization strength in different frequency bands. SD attenuated the average eyes‐closed alpha band SL (Z= −3.15, P < 0.002) and PLI (Z= −4.12, P < 0.0001) and reduced the SL of the eyes‐closed beta band (Z= −2.00, P = 0.05). SD also decreased the eyes‐open theta band SL (Z = −2.00, P = 0.05), but increased eyes‐open gamma band PLI (Z = 2.71, P = 0.007).
When spectral power of the corresponding frequency band was included as a covariate in the regression models on the effect of SD on overall PLI and SL, the following effects remained significant: the attenuation of the eyes‐closed beta band SL; the attenuation of eyes‐open theta band SL (in fact this became even more significant: Z = −3.00, P = 0.003); the increase in eyes‐open gamma band PLI. The effects of SD on alpha synchronization lost their significance.
In summary, SD induced a decrease in synchronization in the eyes‐closed alpha and beta band and in the eyes‐open theta band. An increase was seen in the eyes‐open gamma band synchronization. Changes in the alpha band synchronization were no longer significant when alpha power was included as a covariate in the regression models.
Graph Characteristics
Weighted network characteristics were calculated with both SL and PLI synchronization values as a template for the functional network. Figure 2 shows the network characteristics after NS and SD of the eyes‐closed network. For both synchronization measures, SD caused a decrease in C/C‐s and L/L‐s of the functional network of the eyes‐closed alpha band (SL‐based C/C‐s: Z = −3.40, P < 0.001, L/L‐s: Z = −3.13, P = 0.002; PLI‐based C/C‐s: Z = −4.20, P < 0.0001, L/L‐s: Z = −6.08, P < 0.00000001). Figure 3 visualizes the network characteristics in the eyes‐open network after NS and SD, here, gamma band C/C‐s (Z = 2.66, P = 0.008) and L/L‐s (Z = 2.67, P = 0.008) of the SL‐based network were increased after SD.
Figure 2.
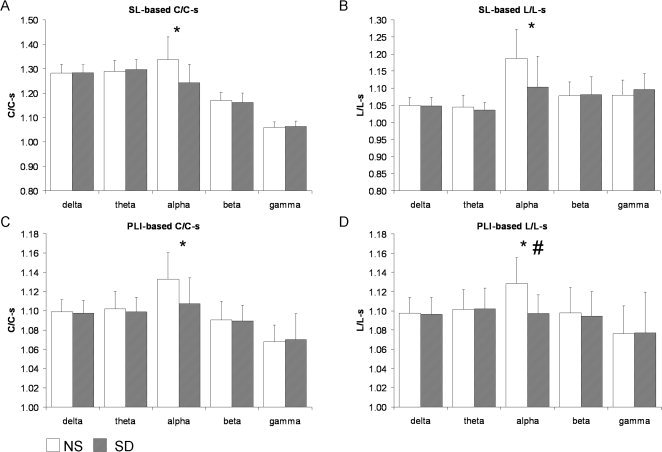
Eyes‐closed grand averages over all subjects and all five blocks in the normal sleep versus sleep deprivation conditions. (A) Graph characteristics C/C‐s and (B) L/L‐s of the SL‐based network; and (C) C/C‐s and (D) L/L‐s of the PLI‐based network. In the alpha band, C/C‐s and L/L‐s were significantly lower after SD (*) as measured with both synchronization techniques. Note that error bars represent standard deviation of between subject variance while statistical analyses test within‐subject changes. # represents changes that remained significant after correcting for power.
Figure 3.
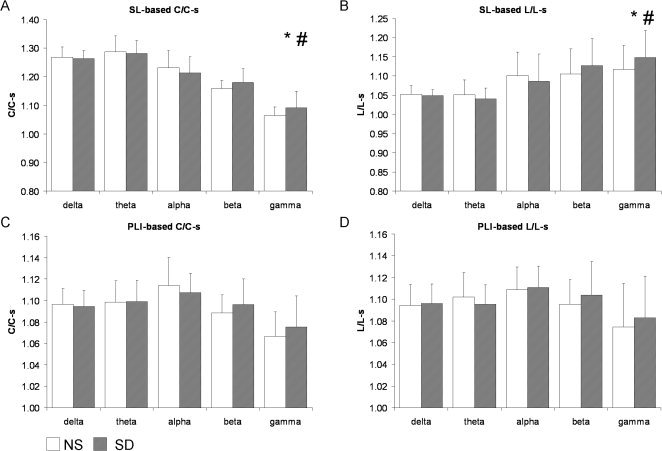
Eyes‐open grand averages over all subjects and all five blocks in the normal sleep versus sleep deprivation conditions. (A) Graph characteristics C/C‐s and (B) L/L‐s of the SL‐based network; and (C) C/C‐s, and (D) L/L‐s of the PLI‐based network. In the gamma band, C/C‐s and L/L‐s of the SL‐based network were significantly increased after SD (*). In the theta band, C/C‐s of the SL‐based network was only significantly decreased when the theta power was included as a covariate in the regression model. SD did not affect PLI‐based eyes‐open networks. Note that error bars represent standard deviation of between subject variance while statistical analyses test within‐subject changes. # represents changes that remained significant after correcting for power.
When relative power in the corresponding frequency band was included as a covariate in the regression models on the effect of SD on C/C‐s and L/L‐s in different frequency bands, some significant effects disappeared in the eyes‐closed networks. The decrease in eyes‐closed PLI‐based L/L‐s in the alpha band (Z = −4.11, P < 0.0001) remained significant. In the eyes‐open network, the increase in gamma SL‐based C/C‐s (Z = 2.40, P = 0.02) and L/L‐s (Z = 2.31, P = 0.02) also remained significant. In addition, a decrease in SL‐based C/C‐s in the theta band of the eyes‐open network became significant (Z = −2.10, P = 0.04).
In summary, SD induced a more random network in the alpha band during eyes‐closed resting state, and a more ordered network in the gamma band during eyes‐open resting state. When controlling for SD‐induced changes in power, SD induced a decrease in eyes‐closed alpha L/L‐s and theta C/C‐s (both reflecting a more random network). In the eyes‐open network, SD induced a more ordered network (reflected by an increase in C/C‐s and L/L‐s) in the gamma band.
Behavioural Results
SD attenuated reaction speed (Z = −3.77, P = 0.0002) and increased the number of lapses (Z = 3.80, P = 0.0001). Regarding the association of this performance drop with overall functional connectivity, multilevel regression analyses showed that the SD‐induced decrease in eyes‐closed alpha band SL and PLI both appeared to be significantly associated with the SD‐induced decrease in reaction speed (SL: Z = 2.37, P = 0.02; PLI: Z = 2.53, P = 0.01). However, addition of alpha power as a second regressor (covariate), rendered these associations of alpha SL and PLI with speed insignificant. The theta band SL and gamma PLI measured in the eyes‐open condition showed no significant correlation with reaction speed. Furthermore, no significant associations between number of lapses and SL or PLI were found in any of the frequency bands.
With regard to graph characteristics, multilevel regression analyses showed that the SD‐induced decrease in alpha band C/C‐s and L/L‐s during eyes‐closed resting state was significantly associated with the SD‐induced decrease in reaction speed (SL‐based C/C‐s: Z = 3.47, P = 0.0005; L/L‐s: Z = 2.51, P = 0.02). However, addition of alpha power as a covariate rendered these associations of alpha SL C/C‐s and L/L‐s with speed insignificant. The associations of PLI‐based C/C‐s and L/L‐s with reaction speed were nonsignificant. The C/C‐s and L/L‐s of both the theta and gamma band measured during eyes‐open resting state were also not significantly correlated to reaction speed (both SL‐ and PLI‐based). With respect to lapses, the SD‐induced decrease in C/C‐s of the eyes‐closed functional network of the alpha band appeared to be associated with the SD‐induced increase in lapses (SL‐based, Z = −2.21, P = 0.03). However, addition of alpha power as a covariate rendered these associations of alpha SL‐based C/C‐s with lapse rate insignificant. Alpha band L/L‐s was not significantly associated with lapses, and nor were PLI‐based C/C‐s and L/L‐s. The C/C‐s and L/L‐s of both the theta and gamma band measured in the eyes‐open condition were also not significantly correlated to the number of lapses (both SL‐ and PLI‐based).
In summary, SD reduced reaction speed and increased the number of lapses in the BSRT. SD‐induced changes in synchronization and graph characteristics in the alpha band during eyes‐closed resting state (as presented in Overall Functional Connectivity and Graph Characteristics sections) were correlated with the decreased reaction speed and increased number of lapses after SD.
DISCUSSION
The present study is the first, to our knowledge, to demonstrate that SD affects, in addition to spectral power, both the overall synchronization and the topology of networks based on functional connectivity strength in the wake resting state EEG. After SD, the eyes‐closed network was more random in the alpha band reflected by a decrease in both C/C‐s and L/L‐s. In the gamma band, a more ordered network (reflected by an increase in both C/C‐s and L/L‐s) was found in eyes‐open resting state EEG. Synchronization was decreased in the eyes‐closed alpha and beta band. With eyes‐open, theta synchronization was decreased and gamma synchronization was increased. SD increased eyes‐closed spectral power of frequencies below 8 Hz and attenuated eyes‐open and eyes‐closed alpha power. It proved to be informative to investigate the effect of SD on functional network for both eyes‐closed and eyes‐open resting states because changes in the alpha band coupling network were most pronounced in the eyes‐closed condition, while changes in the gamma band surfaced more in the eyes‐open condition.
An increase in spectral power of the lower frequency bands and a decrease in alpha power during eyes‐closed resting state after SD is in agreement with previous studies [Ferreira et al.,2006; Lorenzo et al.,1995; Strijkstra et al.,2003]. However, whereas other studies found SD to enhance eyes‐open alpha power [Cajochen et al.,1995; Stampi et al.,1995], we found a decrease. It should be noted that the increase reported in previous studies was rather small, or limited in spectral or topographical range: in one study the increase was limited to the 6.5–9 Hz range [Cajochen et al.,1995], whereas in another study a nonsignificant increase was mainly seen on central channels [Lorenzo et al.,1995]. In contrast to these studies, our results are based on the average alpha power as obtained from 61 EEG‐channels covering the entire scalp. Together, the findings urge further study to characterize topology‐ and frequency‐specific eyes‐open alpha power changes after SD.
After SD, alpha synchronization was decreased during eyes‐closed resting state. A decrease in alpha coherence has been related to drowsiness [Cantero et al.,1999,2000]. However, one has to realize that the methodology of the studies by Cantero et al. are systematically different from ours: (1) they acquired the different vigilance states (awake—drowsiness—REM sleep) while the subjects went to sleep; this setting is different from the AAT in our study where subjects sit upright and have to fixate on a black circle on a computer screen; (2) drowsiness was specifically specified when “slow eye movements appeared simultaneously with alpha activity,” whereas in our current study we excluded epochs with slow eye movements; (3) the decrease in alpha coherence during drowsiness was found in frontal‐occipital and intra‐frontal channels, not overall on all channels as we report in the current study. Thus, we find similar results after SD as have been found during drowsiness, in spite of quite different methodologies.
Synchronization decreased after SD in the theta, alpha and beta band, and increased in the gamma band. In part, these changes may have resulted from SD‐induced changes in power because after including power as a covariate in the regression model, the effect of SD on alpha synchronization was no longer significant. However, the covariation of power and synchronization does not mean that a decrease in synchronization is necessarily caused by a decrease in power. The loss of significant changes in synchronization and graph characteristics after inclusion of power in the regression model merely indicates that SD did not induce changes in overall synchronization strength independent of the changes in synchronization strength associated with changes in power. This could come about when both power and synchronization change in parallel after SD (see previous paragraphs). In addition, SL is theoretically not affected by power [cf., Stam and de Bruin,2004]; see also Appendix A). Besides, the relation between power and synchronization is not clear, though a recent study suggests that local changes in coherence rather than amplitude (i.e., power) are the mechanisms underlying event‐related synchronization and desynchronization [Naruse et al.,2010]. The inclusion of power in the regression model was done to show that changes in synchronization and graph characteristics are not necessarily secondary to changes in power, but can change independently. This was the case for all eyes‐open synchronization and network characteristics and eyes‐closed decreased SL in the beta band and decreased PLI‐based L/L‐s in the alpha band. This, however, does not mean that only the network changes with statistically independence of power changes are functionally relevant.
Analysis of graph characteristics revealed a more random topology after SD in the eyes‐closed alpha band reflected by a decrease in C/C‐s and L/L‐s. A more ordered topology after SD was seen in the eyes‐open gamma band reflected by an increase in C/C‐s and L/L‐s. (Note that a more ordered network does not indicate a better network, the topology of an optimal network lies, as mentioned in the Introduction, between ordered and random.) SD thus influences the functional network of the brain in different directions. This could be related to the different cognitive processes in which the different frequency bands are involved [von Stein and Sarnthein,2000]. The alpha band has been proposed to reflect idling of the brain or top‐down processing, whereas the gamma band is related to memory and binding processes. The different results in the different conditions (eyes‐open vs. eyes‐closed) may reflect these different ongoing processes: more emphasis on the top‐down processes in the alpha band with eyes‐closed (because of the absence of bottom‐up processes) and more emphasis on memory and binding of the gamma band during eyes‐open. The functional meaning of the shift in network topology is not straightforward in normalized network analysis because the results are only relative to the randomized control network. Therefore, we cannot conclude that the long range connections in the gamma band disappeared after SD. The results only show that after SD the functional network of the brain is more similar to the randomized control network in the alpha band and less similar to the randomized control network in the gamma band. The absence of the changes in the network of the delta and beta band suggests that daytime input affects the topology of the functional brain network in these frequency bands to a lesser extent and that cognitive processes in these frequency bands are more robust to SD than processes in the alpha and gamma band.
Concerning behavioural implications of these network changes after SD, we have shown that a SD‐induced decrease in reaction speed was significantly associated with the SD‐induced decrease in eyes‐closed alpha band SL, PLI, C/C‐s, and L/L‐s. To our knowledge this is the first study relating graph‐network analysis to performance on a simple sustained attention task. It may be that the SD‐induced deviation from the optimal small‐world topology of the brain's functional network is involved in difficulties to proficiently respond to incoming stimuli. On the other hand, these associations did not survive correction for the power changes‐related performance deficits. Thus, alpha power changes remain the most strongly associated with behavioural performance deficits.
Though we found a deviation from the small‐world network after SD, one could argue that the functional network of the brain after NS is not small‐world to begin with. Humphries et al. defined a network as small‐world‐like when the following criteria are met: C/C‐s > 1 and (C/C‐s)/(L/L‐s) > 1 [Humphries et al.,2006]. These criteria were proposed on the basis of unweighted analyses. We applied weighted analysis, which results in systematically lower values as compared to unweighted analysis. Still, the first criterion was met for all clustering coefficients in the present study while the second, which equals the small‐world index (SWI), was lager than one in some and smaller but very close to one in other coefficients. The difference between the SWI of a weighted vs. an unweighted network can be seen in Table II of the paper by Ponten et al. who presented both weighted and unweighted analysis of the same signals [Ponten et al.,2009]. Though L/L‐s values are only a bit lower in weighted compared to unweighted analysis, C/C‐s values are considerably lower. We thus remain convinced that our data support a small‐world‐like functional connectivity in the brain as has been found before (see Introduction). As discussed in the penultimate paragraph of the discussion, we chose for weighted analysis because this analysis ensures no arbitrary threshold is set as with unweighted analysis and all signal information is included in the computation of the graph characteristics.
Although we aimed to obtain EEG only during wakefulness, it may be argued that changes in network topology after SD merely reflect transitions to Stage I sleep, especially during the eyes‐closed recordings. A comparison of our results with previous findings does not support such an interpretation. Ferri et al. found an increase in C/C‐s in frequency bands <15 Hz during the transition from wakefulness to (light) sleep [Ferri et al.,2008], which is in strong contrast with the decrease in alpha C/C‐s after SD found in our present study. Also, Cantero et al. found a decrease in gamma power during sleep [Cantero et al.,2004] whereas we found an increase after SD. Another argument against the validity of our findings might be that the slow eye movements typical of sleep‐deprived people [Cajochen et al.,1999] could have affected our coupling estimates. However, by use of independent component analysis we identified and removed eye movement‐related activity in the processed EEG. A third argument might be that the sleep deprivation procedure altered the phase of the circadian rhythms, e.g., in brain temperature, and might thus have indirectly influenced network connectivity. This interpretation is highly unlikely. First, all assessments were made between 10.30 and 16.30 h, an interval that falls well within the plateau of daytime temperature, even if a small phase shift would have been induced [Van Someren,2004]. Second, ancillary post‐hoc analyses investigating whether there was a systematic diurnal rhythm in the significant outcome measures by including a second order curve in the mixed effect models, as well as its interaction with sleep deprivation, revealed no significant time or time‐by‐sleep deprivation effects. These theoretical and practical considerations indicate that possible circadian effects cannot explain the SD effects reported.
PLI and SL are not interchangeable because they use different characteristics to compute coupling between two signals: SL is based on the simultaneous recurrence of (different) patterns in two time series while PLI is based on phase synchronization of oscillations in two time series. An advantage of SL is that some noncorrespondence in the actual waveforms of the two timeseries is allowed, as well as phase variability. An advantage of PLI is that it ignores zero‐phase lag coupling, thus effectively ignoring suggestive coupling that is merely due to volume conduction. Still, results of SL‐based and PLI‐based network analyses overlapped to a considerable extent. We consider it as informative to know that outcomes of SL‐based network analyses were unlikely to be confounded by volume conduction because they were in general confirmed by PLI‐based network analyses.
The use of weighted graph analysis in this study ensured that no arbitrary threshold had to be set as with unweighted graph analysis. In an unweighted or binary graph, an edge either exists or does not exist. Only those synchronization values between two nodes that are higher than a chosen threshold represent an edge in the functional network. This threshold can be set as a minimum value of the synchronization measurement, or by means of setting the degree k (the average number of edges per node). A synchronization threshold or fixed k could lead to an incomplete representation of network differences because changes in topology via relatively weak synchronization are excluded when the synchronization level is below threshold. With weighted graph analysis, all information obtained from the EEG recording is included in the analysis and computation of C/C‐s and L/L‐s. On the other hand, one could argue that the differences in weighted graph characteristics after SD and NS are merely caused by the differences in the level of synchronization. This could come about because stronger synchronization in a network leads to higher edge weights, which in turn leads to higher C and lower L values. However, the graph characteristics are normalized by dividing them by the C‐s and L‐s of random networks. These random networks have the same level of synchronization as the recorded brain network. Therefore, changes in the level of synchronization are cancelled out. Additionally, Ponten et al. reported weighted and unweighted graph analysis during absence seizures and found similar results for both approaches [Ponten et al.,2009], indicating that both methods may be robust when applied to EEG.
In conclusion, this is the first study, to our knowledge, to show that SD affects the topology of functional brain networks during wake resting state. Our findings are compatible with the hypothesis that sleep‐related processes support the restoration of a network configuration that is optimal for information processing [Tononi and Cirelli,2003,2006], and we suggest that the less optimal network after SD is involved in the decreased performance of a vigilance task. The hypothesis of Tononi and Cirelli has mainly focused on the role of sleep in an overall downscaling of synaptic strength to preserve optimal network functioning. Our present findings suggest that such sleep‐related processes are not only essential to maintain an optimal synaptic density in the neuronal network of the brain, but also promote preservation of its small‐world network properties.
Supporting information
Additional Supporting Information may be found in the online version of this article.
Supporting Information
APPENDIX A: MATHEMATICAL BACKGROUND OF SYNCHRONIZATION LIKELIHOOD
Adapted from [Ferri et al.,2008]
The synchronization likelihood (SL) is a measure of the generalized synchronization between two dynamical systems X and Y [Stam and van Dijk,2002]. Generalized synchronization [Rulkov et al.,1995] that exists between X and Y of the state of the response system is a function of the driver system: Y = F(X). The first step in the computation of the synchronization likelihood is to convert the time series x i and y i recorded from X and Y as a series of state space vectors using the method of time‐delay embedding [Takens,1981]:
| (A1) |
where L is the time lag, and m the embedding dimension. From a time series of N samples, N − (m × L) vectors can be reconstructed. State space vectors Y i are reconstructed in the same way.
Synchronization likelihood is defined as the conditional likelihood that the distance between Y i and Y j will be smaller than a cutoff distance r y, given that the distance between X i and X j is smaller than a cutoff distance r y. In the case of maximal synchronization this likelihood is 1; in the case of independent systems, it is a small, but nonzero number, namely P ref. This small number is the likelihood that two randomly chosen vectors Y (or X) will be closer than the cutoff distance r. In practice, the cutoff distance is chosen such that the likelihood of random vectors being close is fixed at P ref, which is chosen the same for X and for Y. To understand how P ref is used to fix r x and r y, we first consider the correlation integral:
| (A2) |
Here the correlation integral C r is the likelihood that two randomly chosen vectors X will be closer than r. The vertical bars represent the euclidian distance between the vectors. N is the number of vectors, w is the Theiler correction for autocorrelation [Theiler,1986] and θ is the Heaviside function: θ(X) = 0 if X ≥ = 0 and θ(X) = 1 if X < 0. Now, r x is chosen such that Cr x = P ref and r y is chosen such that Cr y = P ref. The synchronization likelihood between X and Y can now be formally defined as:
| (A3) |
SL is a symmetric measure of the strength of synchronization between X and Y (SLXY = SLYX). In Eq. (A3) the averaging is done over all i and j; by doing the averaging only over j SL can be computer as a function of time i. From Eq. (A3), it can be seen that in the case of complete synchronization SL = 1; in the case of complete independence SL = P ref. In the case of intermediate levels of synchronization P ref < SL < 1.
APPENDIX B: COMPUTATION OF PHASE LAG INDEX
Adapted from [Stam et al.,2009]
Rigorous phase locking between two systems implies that their relative phase or phase difference is constant (equal to Φ0). As extensively discussed by Pikovsky et al. [2001], this strict locking criterion can be weakened in that the phase difference is not constant but bounded in a reasonably small interval around that constant, i.e. [Φ0 − ε, Φ0 + ε]. Allowing further for different frequencies of the signals that differ by a ratio of n:m (with n and m some integers) one can readily define a so‐called generalized phase synchrony. More formally speaking, if Φ1 and Φ2 are the phases of two time series, the general n to m phase synchronization can be found if
| (B1) |
with 0 < ε = π holds—notice that the phase is a circular variable [Hutt et al.,2003]. Using this definition, phase synchronization can be determined for noisy, nonstationary, and chaotic signals. To do so, one computes the signals' phases via the corresponding analytical signals that are constructed using the Hilbert transform (the approach with wavelets provides similar results; see, e.g., [Bruns,2004]. That is, for a given real‐valued time series x(t) one defines
| (B2) |
i denotes the complex unit and PV refers to the Cauchy principal value. This definition provides an amplitude and a phase for the analytical signal z(t) in terms of
| (B3) |
here arctan′ denotes the four quadrant inverse tangent. In the article we restricted ourselves to the iso‐frequency case with n = m = 1, that is, using (B3) the instantaneous relative phase between two signals can be given as
| (B4) |
The different MEG frequency bands show different patterns of activity, and are thought to relate to different aspects of cognition. In view of our expectation to find specific changes in relatively narrow frequency bands, we limited our analysis to one to one frequency coupling, using n = m = 1.
There are many possibilities to subsequently quantify the (deviation of the) inequality (B1). We here use the PLI since it has been proven largely invariant against the presence of common sources or volume conduction, and active reference electrodes. The invariance is caused by the fact that PLI only quantifies the (relative) phase distribution's asymmetry. To elucidate, asymmetry of the phase difference distribution implies that the likelihood that the phase difference ΔΦ will be in the interval −π < ΔΦ < 0 is different from the likelihood that it will be in the interval 0 < ΔΦ < π. In the case of a unimodal phase distribution that asymmetry implies the presence of a consistent, non‐zero phase difference (“lag”) between the two time series. As been shown in detail in [Stam et al.,2007] the existence of such a phase lag cannot be explained by possible influences of volume conduction [similar to the imaginary component of coherency, see Nolte et al.,2004]. Therefore, the PLI is defined as index of the asymmetry of the phase difference distribution by means of
| (B5) |
in which 〈···〉 denotes the average over time t. So, if the phase difference ΔΦ between two signals is in the interval 0 < ΔΦ < π, the sinus function will produce a positive, nonzero value. If the phase difference is in the −π < ΔΦ < 0 interval, sin ΔΦ will produce a negative, nonzero value. The signum function returns a value of 1 if sin ΔΦ >0, and a value of 0 if sin ΔΦ <0. So, all positive and negative values in time t are consequently “counted” by the signum function and then averaged, and finally the absolute value is used to produce the PLI. The PLI is bounded 0 ≤ PLI ≤ 1 and a PLI of zero indicates either no coupling or coupling with a phase difference centred around 0 mod π, which may be caused by volume conduction. In contrast, a PLI of 1 indicates perfect phase locking at a value of ΔΦ different from 0 mod π. The stronger this non‐zero phase locking is, the larger the PLI will be.
REFERENCES
- Achard S, Salvador R, Whitcher B, Suckling J, Bullmore E ( 2006): A resilient, low‐frequency, small‐world human brain functional network with highly connected association cortical hubs. J Neurosci 26: 63–72. [DOI] [PMC free article] [PubMed] [Google Scholar]
- Altena E, Van Der Werf YD, Strijers RLM, Van Someren EJW ( 2008): Sleep loss affects vigilance: Effects of chronic insomnia and sleep therapy. J Sleep Res 17: 335–343. [DOI] [PubMed] [Google Scholar]
- Axmacher N, Schmitz D, Wagner T, Elger C, Fell J ( 2008): Interactions between medial temporal lobe, prefrontal cortex, and inferior temporal regions during visual working memory: A combined intracranial EEG and functional magnetic resonance imaging study. J Neurosci 28: 7304–7312. [DOI] [PMC free article] [PubMed] [Google Scholar]
- Bassett D, Bullmore E ( 2006): Small‐world brain networks. Neuroscientist 12: 512–523. [DOI] [PubMed] [Google Scholar]
- Bassett D, Meyer‐Lindenberg A, Achard S, Duke T, Bullmore E ( 2006): Adaptive reconfiguration of fractal small‐world human brain functional networks. Proc Natl Acad Sci USA 103: 19518–19523. [DOI] [PMC free article] [PubMed] [Google Scholar]
- Benington JH, Heller HC ( 1995): Restoration of brain energy metabolism as the function of sleep. Prog Neurobiol 45: 347–360. [DOI] [PubMed] [Google Scholar]
- Boccaletti S, Latora V, Moreno Y, Chavez M, Hwang U ( 2006): Complex networks: Structure and dynamics. Phys Rep 424: 175–308. [Google Scholar]
- Bruns A ( 2004): Fourier‐, Hilbert‐ and wavelet‐based signal analysis: Are they really different approaches? J Neurosci Methods 137: 321–332. [DOI] [PubMed] [Google Scholar]
- Bullmore E, Sporns O ( 2009): Complex brain networks: Graph theoretical analysis of structural and functional systems. Nat Rev Neurosci 10: 186–198. [DOI] [PubMed] [Google Scholar]
- Cajochen C, Brunner DP, Kräuchi K, Graw P, Wirz‐Justice A ( 1995): Power density in theta/alpha frequencies of the waking EEG progressively increases during sustained wakefulness. Sleep 18: 890–894. [DOI] [PubMed] [Google Scholar]
- Cajochen C, Khalsa SB, Wyatt JK, Czeisler CA, Dijk DJ ( 1999): EEG and ocular correlates of circadian melatonin phase and human performance decrements during sleep loss. Am J Physiol 277: R640–R649. [DOI] [PubMed] [Google Scholar]
- Cantero JL, Atienza M, Salas RM, Gómez CM ( 1999): Alpha EEG coherence in different brain states: An electrophysiological index of the arousal level in human subjects. Neurosci Lett 271: 167–170. [DOI] [PubMed] [Google Scholar]
- Cantero JL, Atienza M, Salas RM ( 2000): State‐modulation of cortico‐cortical connections underlying normal EEG alpha variants. Physiol Behav 71: 107–115. [DOI] [PubMed] [Google Scholar]
- Cantero JL, Atienza M, Madsen JR, Stickgold R ( 2004): Gamma EEG dynamics in neocortex and hippocampus during human wakefulness and sleep. NeuroImage 22: 1271–1280. [DOI] [PubMed] [Google Scholar]
- Delorme A, Makeig S ( 2004): EEGLAB: An open source toolbox for analysis of single‐trial EEG dynamics including independent component analysis. J Neurosci Methods 134: 9–21. [DOI] [PubMed] [Google Scholar]
- Dinges DF, Powell JW ( 1985): Microcomputer analyses of performance on a portable, simple visual RT task during sustained operations. Behav Res Methods Instr Comput 17: 652–655. [Google Scholar]
- Ferreira C, Deslandes A, Moraes H, Cagy M, Pompeu F, Basile LF, Piedade R, Ribeiro P ( 2006): Electroencephalographic changes after one night of sleep deprivation. Arq Neuropsiquiatr 64: 388–393. [DOI] [PubMed] [Google Scholar]
- Ferri R, Rundo F, Bruni O, Terzano M, Stam C ( 2008): The functional connectivity of different EEG bands moves towards small‐world network organization during sleep. Clin Neurophysiol 119: 2026–2036. [DOI] [PubMed] [Google Scholar]
- Gong G, He Y, Concha L, Lebel C, Gross D, Evans A, Beaulieu C ( 2009): Mapping anatomical connectivity patterns of human cerebral cortex using in vivo diffusion tensor imaging tractography. Cereb Cortex 19: 524–536. [DOI] [PMC free article] [PubMed] [Google Scholar]
- Gray C, Konig P, Engel A, Singer W ( 1989): Oscillatory responses in cat visual cortex exhibit inter‐columnar synchronization which reflects global stimulus properties. Nature 338: 334–337. [DOI] [PubMed] [Google Scholar]
- Habeck C, Rakitin B, Moeller J, Scarmeas N, Zarahn E, Brown T, Stern Y ( 2004): An event‐related fMRI study of the neurobehavioral impact of sleep deprivation on performance of a delayed‐match‐to‐sample task. Brain Res Cogn Brain Res 18: 306–321. [DOI] [PubMed] [Google Scholar]
- He Y, Chen ZJ, Evans AC ( 2007): Small‐world anatomical networks in the human brain revealed by cortical thickness from MRI. Cereb Cortex 17: 2407–2419. [DOI] [PubMed] [Google Scholar]
- Herrmann CS, Munk MHJ, Engel AK ( 2004): Cognitive functions of gamma‐band activity: Memory match and utilization. Trends Cogn Sci 8: 347–355. [DOI] [PubMed] [Google Scholar]
- Humphries MD, Gurney K, Prescott TJ ( 2006): The brainstem reticular formation is a small‐world, not scale‐free network. Proc Biol Sci 273: 503–511. [DOI] [PMC free article] [PubMed] [Google Scholar]
- Hutt A, Bestehorn M, Wennekers T ( 2003): Pattern formation in intracortical neuronal fields. Network 14: 351–368. [PubMed] [Google Scholar]
- Iturria‐Medina Y, Canales‐Rodríguez EJ, Melie‐García L, Valdés‐Hernández PA, Martínez‐Montes E, Alemán‐Gómez Y, Sánchez‐Bornot JM ( 2007): Characterizing brain anatomical connections using diffusion weighted MRI and graph theory. NeuroImage 36: 645–660. [DOI] [PubMed] [Google Scholar]
- Jung TP, Makeig S, Humphries C, Lee TW, McKeown MJ, Iragui V, Sejnowski TJ ( 2000): Removing electroencephalographic artifacts by blind source separation. Psychophysiology 37: 163–178. [PubMed] [Google Scholar]
- Klimesch W, Schack BÃ, Sauseng P ( 2005): The functional significance of theta and upper alpha oscillations. Exp Psychol 52: 99–108. [DOI] [PubMed] [Google Scholar]
- Lago‐Fernández LF, Huerta R, Corbacho F, Sigüenza JA ( 2000): Fast response and temporal coherent oscillations in small‐world networks. Phys Rev Lett 84: 2758–2761. [DOI] [PubMed] [Google Scholar]
- Latora V, Marchiori M ( 2001): Efficient behavior of small‐world networks. Phys Rev Lett 87: 198701. [DOI] [PubMed] [Google Scholar]
- Leistedt SLJJ, Coumans N, Dumont M, Lanquart JP, Stam CJ, Linkowski P ( 2009): Altered sleep brain functional connectivity in acutely depressed patients. Hum Brain Mapp 30: 2207–2219. [DOI] [PMC free article] [PubMed] [Google Scholar]
- Lorenzo I, Ramos J, Arce C, Guevara MA, Corsi‐Cabrera M ( 1995): Effect of total sleep deprivation on reaction time and waking EEG activity in man. Sleep 18: 346–354. [PubMed] [Google Scholar]
- Micheloyannis S, Pachou E, Stam CJ, Breakspear M, Bitsios P, Vourkas M, Erimaki S, Zervakis M ( 2006): Small‐world networks and disturbed functional connectivity in schizophrenia. Schizophr Res 87: 60–66. [DOI] [PubMed] [Google Scholar]
- Montez T, Linkenkaer‐Hansen K, van Dijk BW, Stam CJ ( 2006): Synchronization likelihood with explicit time‐frequency priors. NeuroImage 33: 1117–1125. [DOI] [PubMed] [Google Scholar]
- Naruse Y, Matani A, Miyawaki Y, Okada M ( 2010): Influence of coherence between multiple cortical columns on alpha rhythm: A computational modeling study. Hum Brain Mapp 31: 703–715. [DOI] [PMC free article] [PubMed] [Google Scholar]
- Nase G, Singer W, Monyer H, Engel A ( 2003): Features of neuronal synchrony in mouse visual cortex. J Neurophysiol 90: 1115–1123. [DOI] [PubMed] [Google Scholar]
- Nolte G, Bai O, Wheaton L, Mari Z, Vorbach S, Hallett M ( 2004): Identifying true brain interaction from EEG data using the imaginary part of coherency. Clin Neurophysiol 115: 2292–2307. [DOI] [PubMed] [Google Scholar]
- Peigneux P, Laureys S, Delbeuck X, Maquet P ( 2001): Sleeping brain, learning brain. The role of sleep for memory systems. Neuroreport 12: A111–A124. [DOI] [PubMed] [Google Scholar]
- Peiris MTR, Jones RD, Davidson PR, Bones PJ ( 2006): Detecting behavioral microsleeps from EEG power spectra. Conf Proc IEEE Eng Med Biol Soc 1: 5723–5726. [DOI] [PubMed] [Google Scholar]
- Pikovsky AS, Rosenblum M, Kurths J ( 2001): Synchronization. A Universal Concept in Nonlinear Sciences. Cambridge: Cambridge University Press. [Google Scholar]
- Ponten SC, Douw L, Bartolomei F, Reijneveld JC, Stam CJ ( 2009): Indications for network regularization during absence seizures: Weighted and unweighted graph theoretical analyses. Exp Neurol 217: 197–204. [DOI] [PubMed] [Google Scholar]
- Romeijn N, Van Someren EJW ( 2011): Correlated fluctuations of daytime skin temperature and vigilance. J Biol Rhythms 26: 68–77. [DOI] [PubMed] [Google Scholar]
- Rubinov M, Knock SA, Stam CJ, Micheloyannis S, Harris AWF, Williams LM, Breakspear M ( 2009): Small‐world properties of nonlinear brain activity in schizophrenia. Hum Brain Mapp 30: 403–416. [DOI] [PMC free article] [PubMed] [Google Scholar]
- Rulkov NF, Sushchik MM, Tsimring LS, Abarbanel HD ( 1995): Generalized synchronization of chaos in directionally coupled chaotic systems. Phys Rev E Stat Phys Plasmas Fluids Relat Interdiscip Top 51: 980–994. [DOI] [PubMed] [Google Scholar]
- Santhi N, Horowitz TS, Duffy JF, Czeisler CA ( 2007): Acute sleep deprivation and circadian misalignment associated with transition onto the first night of work impairs visual selective attention. PLoS One 2: e1233. [DOI] [PMC free article] [PubMed] [Google Scholar]
- Sarnthein J, Petsche H, Rappelsberger P, Shaw GL, von Stein A ( 1998): Synchronization between prefrontal and posterior association cortex during human working memory. Proc Natl Acad Sci USA 95: 7092–7096. [DOI] [PMC free article] [PubMed] [Google Scholar]
- Sporns O, Zwi JD ( 2004): The small world of the cerebral cortex. Neuroinformatics 2: 145–162. [DOI] [PubMed] [Google Scholar]
- Stam CJ ( 2004): Functional connectivity patterns of human magnetoencephalographic recordings: A “small‐world” network? Neurosci Lett 355: 25–28. [DOI] [PubMed] [Google Scholar]
- Stam CJ, de Bruin EA ( 2004): Scale‐free dynamics of global functional connectivity in the human brain. Hum Brain Mapp 22: 97–109. [DOI] [PMC free article] [PubMed] [Google Scholar]
- Stam CJ, van Dijk BW ( 2002): Synchronization likelihood: An unbiased measure of generalized synchronization in multivariate data sets. Phys D 163: 236–251. [Google Scholar]
- Stam C, van Cappellen AM, Micheloyannis S ( 2002): Variability of EEG synchronization during a working memory task in healthy subjects. Int J Psychophysiol 46: 53–66. [DOI] [PubMed] [Google Scholar]
- Stam CJ, Nolte G, Daffertshofer A ( 2007): Phase lag index: Assessment of functional connectivity from multi channel EEG and MEG with diminished bias from common sources. Hum Brain Mapp 28: 1178–1193. [DOI] [PMC free article] [PubMed] [Google Scholar]
- Stam CJ, de Haan W, Daffertshofer A, Jones BF, Manshanden I, van Cappellen van Walsum AM, Montez T, Verbunt JPA, de Munck JC, van Dijk BW, Berendse HW, Scheltens P ( 2009): Graph theoretical analysis of magnetoencephalographic functional connectivity in Alzheimer's disease. Brain 132: 213–224. [DOI] [PubMed] [Google Scholar]
- Stampi C, Stone P, Michimori A ( 1995): A new quantitative method for assessing sleepiness: The alpha attenuation test. Work Stress 9: 368. [Google Scholar]
- Stickgold R ( 2005): Sleep‐dependent memory consolidation. Nature 437: 1272–1278. [DOI] [PubMed] [Google Scholar]
- Strijkstra AM, Beersma DGM, Drayer B, Halbesma N, Daan S ( 2003): Subjective sleepiness correlates negatively with global alpha (8–12 Hz) and positively with central frontal theta (4–8 Hz) frequencies in the human resting awake electroencephalogram. Neurosci Lett 340: 17–20. [DOI] [PubMed] [Google Scholar]
- Strogatz S ( 2001): Exploring complex networks. Nature 410: 268–276. [DOI] [PubMed] [Google Scholar]
- Takens F ( 1981): Detecting strange attractors in turbulence. Lecture Notes Math 898: 366–381. [Google Scholar]
- Tallon‐Baudry C, Bertrand O ( 1999): Oscillatory gamma activity in humans and its role in object representation. Trends Cogn Sci 3: 151–162. [DOI] [PubMed] [Google Scholar]
- Theiler J ( 1986): Spurious dimension from correlation algorithms applied to limited time‐series data. Phys Rev A 34: 2427–2432. [DOI] [PubMed] [Google Scholar]
- Thomas M, Sing H, Belenky G, Holcomb H, Mayberg H, Dannals R, Wagner H, Thorne D, Popp K, Rowland L, Welsh A, Balwinski S, Redmond D ( 2000): Neural basis of alertness and cognitive performance impairments during sleepiness. I. Effects of 24 h of sleep deprivation on waking human regional brain activity. J Sleep Res 9: 335–352. [DOI] [PubMed] [Google Scholar]
- Tononi G, Cirelli C ( 2003): Sleep and synaptic homeostasis: A hypothesis. Brain Res Bull 62: 143–150. [DOI] [PubMed] [Google Scholar]
- Tononi G, Cirelli C ( 2006): Sleep function and synaptic homeostasis. Sleep Med Rev 10: 49–62. [DOI] [PubMed] [Google Scholar]
- Van Der Werf Y, Altena E, Schoonheim M, Sanz‐Arigita E, Vis J, De Rijke W, Van Someren E ( 2009): Sleep benefits subsequent hippocampal functioning. Nat Neurosci 12: 122–123. [DOI] [PubMed] [Google Scholar]
- van den Heuvel MP, Stam CJ, Kahn RS, Hulshoff Pol HE ( 2009): Efficiency of functional brain networks and intellectual performance. J Neurosci 29: 7619–7624. [DOI] [PMC free article] [PubMed] [Google Scholar]
- Van Someren EJW ( 2004): Sleep propensity is modulated by circadian and behavior‐induced changes in cutaneous temperature. J Therm Biol 29: 437–444. [Google Scholar]
- von Stein A, Sarnthein J ( 2000): Different frequencies for different scales of cortical integration: From local gamma to long range alpha/theta synchronization. Int J Psychophysiol 38: 301–313. [DOI] [PubMed] [Google Scholar]
- Walker MP ( 2009): The role of sleep in cognition and emotion. Ann N Y Acad Sci 1156: 168–197. [DOI] [PubMed] [Google Scholar]
- Wang L, Zhu C, He Y, Zang Y, Cao Q, Zhang H, Zhong Q, Wang Y ( 2008): Altered small‐world brain functional networks in children with attention‐deficit/hyperactivity disorder. Hum Brain Mapp 30: 638–649. [DOI] [PMC free article] [PubMed] [Google Scholar]
- Watts D, Strogatz S ( 1998): Collective dynamics of “small‐world” networks. Nature 393: 440–442. [DOI] [PubMed] [Google Scholar]
- Yoo SS, Hu P, Gujar N, Jolesz F, Walker M ( 2007): A deficit in the ability to form new human memories without sleep. Nat Neurosci 10: 385–392. [DOI] [PubMed] [Google Scholar]
Associated Data
This section collects any data citations, data availability statements, or supplementary materials included in this article.
Supplementary Materials
Additional Supporting Information may be found in the online version of this article.
Supporting Information