Abstract
Somatosensory evoked fields in response to compression (termed as Co) and decompression (termed as De) of glabrous skin (D1, thumb; D2, index finger; D5, little finger) were recorded. Although estimated equivalent current dipoles (ECDs) following stimulation of D1 and D5 were larger, but not significantly larger, in decompression than in compression, those of D2 were significantly larger (P = 0.035). The ECDs were located in the postcentral gyrus in the order of D5De, D2De, and D1De medially, posteriorly, and superiorly in decompression but not in compression (z‐value, F = 2.692, P = 0.031). The average distance of ECDs between D1 and D5 was longer in decompression (12.8 ± 1.6 mm) than in compression (9.1 ± 1.6 mm). Our data suggest that the cortical response for the commonly used digit D2 is functionally different from those for other digits (D1 and D5) that the somatotopic variability is greater in compression. Hum Brain Mapp, 2013. © 2012 Wiley Periodicals, Inc.
Keywords: somatosensory evoked fields, compression, decompression, glabrous skin, somatotopy
INTRODUCTION
Somatosensory evoked potentials (SEPs) and somatosensory evoked fields (SEFs) have been investigated in detail mostly by electrical stimulation on bodies. In some studies, other stimuli such as air‐puff, vibration, and CO2 laser were applied [Forss et al., 1994; Kakigi et al., 1989; Treede et al., 2003]. Mechanical stimuli can be applied painlessly [Pratt et al., 1979].
However, these studies on the cortical responses to somatosensory stimuli were focused on responses when the stimuli reached the brain (compression responses), not extinguished from it (decompression responses). In natural life, decompression responses should play an important role to execute skillful movements of our body (i.e., precision grip). Studies using mechanical stimuli are needed to elucidate the mechanism of decompression response. Furthermore, when compared with functional magnetic resonance imaging (fMRI) or positron emission tomography (PET) [Dresel et al., 2008; Ledberg et al., 1995], the high temporal resolution in magnetoencephalography (MEG) is expected to produce excellent results in studies on tactile decompression responses.
We have recently found that human mechanical touch stimuli induce somatosensory cortical responses not only when glabrous skin is compressed but also when it is decompressed in the index finger [Inoue et al., 2005; Shirai et al., 2004]. It is thought that the somatosensory cortical responses were evoked not only by action potentials from skin receptors such as Pacinian corpuscles but also by off‐set cortical responses (off‐responses) when glabrous skin is decompressed [Crevits et al., 1982; Hari et al., 1987; Noda et al., 1998; Pantev et al., 1996; Wakai et al., 2007].
The cortical top‐down mechanism to control off‐responses in the primary somatosensory cortical areas for the index finger is thought to work more effectively for precision grip than the control mechanisms in the great toe [Inoue et al., 2005]. Thus, it was questioned if there is any dominancy of off‐responses in fingers and if there is any difference of somatotopy in fingers.
Imaging studies suggest a hand‐level somatotopic arrangement in area 3b with the thumb located lateral, anterior, and inferior to the other digits tested [thumb (D1) vs. little finger (D5), Kurth et al., 1998, 2000; index finger (D2) vs. D5, Nelson and Chen, 2008]. However, the results of some studies do not agree with these notions. Some variability of generator locations across subjects has been shown and explained by inaccuracies caused by recordings at some distance from the sources and by the application of a spherical head model [Baumgartner et al., 1991]. Various cytoarchitectural structures in the postcentral gyrus have also been considered as a cause of variability of generator locations [Gelnar et al., 1998]. Recently, it has been shown that somatotopic variability was greater in area 1 than in area 3b and that digits spanned less cortical territory in humans [Nelson and Chen, 2008]. The main purpose of this study was to determine the dominancy of digits in tactile somatosensory decompression responses and to determine how somatotopy is mapped by compression and decompression responses.
SUBJECTS AND METHODS
Subjects
Eleven normal right‐handed volunteers (10 men and one woman, age range: 25–40 years) participated in this study. The instrument used in this study was approved by the Japanese Ministry of Health, Labor and Welfare (No. 20800BZY00275000), and informed consent was obtained from each subject after a full explanation of the experiment.
Stimuli and Device
Glabrous skin contact was made by the examiner, who compressed the left thumb (D1) and the index (D2) and little (D5) fingers of each subject with his right index finger at 1‐s intervals. One set of the examiner's action consisted of touch, sustained contact, and removal of his finger as shown in Figure 1. A video‐based 3D motion analysis system (APAS, Ariel Dynamics, USA) was used to measure the average speeds of touch/removal and the time intervals of machine cycle constituents.
Figure 1.
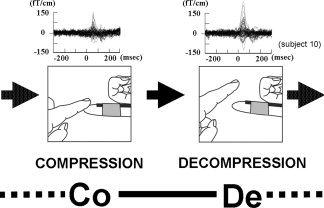
Somatosensory evoked field (SEF) waveforms of a representative subject were obtained by mechanical stimulation of D2 as follows: compression trigger session and decompression trigger session. Responses are from 40 to 50 channels around the primary somatosensory cortical area. One cycle comprised Co—1437.0 ± 16.8 ms—De—1531.3 ± 14.1 ms and was repeated.
Two recording sessions with different trigger timings were carried out for the task. In one recording session, the trigger was elicited by a light reflection through an optic fiber placed on the subject's finger when the examiner compressed the subject's finger (compression trigger session). In the other recording session (decompression trigger session), the trigger was elicited when the examiner's finger decompressed the subject's finger (Fig. 1). The evoked fields in each recording session were averaged 100 times in all subjects. The performance was continuously monitored by means of a video camera, and the operator confirmed that there was no contact with the subject other than the finger. Neuromagnetic recordings were made using a helmet‐shaped 306‐channel MEG system (Vector‐view, ELEKTA Neuromag, Helsinki, Finland), which was composed of 102 identical triple sensor elements. Each sensor element consisted of two orthogonal planar gradiometers and one magnetometer coupled to a multisuperconducting quantum interference device. The recording bandpass was 0.1–200, and the signals were digitized at a rate of 600 Hz. The analysis period of 2,000 ms started 1,000 ms before triggering. When triggering failure (i.e., no triggering or triggering twice) occurred in more than 10% of a recording, recording was discarded. For source identification, the head was assumed to be a sphere and the dimensions were determined on the basis of individual magnetic resonance (MR) images obtained by using a GE Yokogawa SIGNA 1.5 T device (slice thickness of 2 mm; 3D‐SPGR). The two coordinate systems (MEG and MR imaging) were aligned by applying markers in MR imaging and by identifying those landmarks with a three‐dimensional (3D) digitizer (Isotrack; Polhemus Navigation Sciences, Colchester, VT) before MEG recordings. All source analysis was based on high‐pass signals filtered at 2 Hz to eliminate baseline fluctuation and low‐pass signals filtered at 100 Hz.
Data Analysis
One main components of evoked fields appeared in each session. Sources for the evoked responses were modeled as single‐current dipoles. The magnetic field patterns were first visually examined in 1‐ms steps to identify all local and stable “dipolar field patterns,” that is, all field distributions resembling those produced by a single‐current dipole. Then the equivalent current dipole (ECD) best describing the most dominant source during the strongest signals of each dipolar field pattern was identified by a least‐squares search using a subset of 20–30 channels over the source area. The goodness‐of‐fit value of an ECD was calculated to indicate in percentage terms how much the dipole accounts for the measured field variance. Model accuracy was assessed by examining percent variance [Hari et al., 1988]. Only ECDs explaining more than 80% of the field variance [goodness of fit (GOF)] were used for further analysis. The origin of the head‐based coordinate system was defined as the midpoint between the preauricular points. The x‐axis pointed from the origin to the right preauricular point, the y‐axis to the nasion, and the z‐axis to the vertex in a direction perpendicular to the x‐y plane. Analysis was focused on the evoked fields elicited by compression stimuli in the compression trigger session and those elicited by decompression stimuli in the decompression trigger session. The signal‐to‐noise ratio was sufficiently good during this period. The ECDs were superimposed on a high‐resolution T 1‐weighted MR image of the brain for each subject and were depicted in the coordination system on the MR image.
To compare the ECD maps obtained from different subjects, the coordinate differences from the ECD of D1De to the ECD of the other points (Δx, Δy, Δz) were calculated. Linear distances between the ECD of D1De and the ECD of the other points were calculated by the formula ((Δx)2 + (Δy)2 + (Δz)2)1/2.
Statistical Tests
One‐way analysis of variance (ANOVA) was used for statistical comparisons of the peak latencies, orientations, and strengths of ECDs from the primary somatosensory (SI) cortex for each stimulation. Fisher's protected least significant difference test was used for post hoc comparisons (P < 0.05). Student's t‐test was applied for comparison of the distances of ECD location between D1 and D5 in compression and decompression (P < 0.05).
RESULTS
The mean speeds of touch/removal were 0.32 ± 0.06 mm/ms and 0.29 ± 0.03 mm/ms, respectively. One cycle comprised touch—1437.0 ± 16.8 ms—removal—1531.3 ± 14.1 ms and was repeated (Fig. 1). The SEF waveform following compression and decompression stimulation showed one major component (Fig. 2). We termed them Co for compression (touch) stimuli and De for decompression (removal) stimuli. Compression and decompression responses were successfully localized in eight and nine of the 11 subjects, respectively (GOF > 80%). Subject 3 did not show SEF waveforms following compressions for D1, D2, and D5 stimuli and showed decompression for D5 with low GOF (78.4%). Subjects 4 and 5 did not show compressions for D2 and D1 stimuli, respectively. Subject 6 did not show decompressions for D5 stimuli (Table I). The peak ECD latency of decompression response was shorter than that of compression response (D1De: 18.9 ± 20.2 ms, D1Co: 60.6 ± 17.1 ms, D2De: 30.4 ± 12.1 ms, D2Co: 54.5 ± 12.7 ms, D5De: 32.6 ± 24.0 ms, D5Co: 59.3 ± 32.7 ms). No significant difference in peak ECD latency was found between D1, D2, and D5 either by Co stimuli or by De stimuli (Fig. 3).
Figure 2.
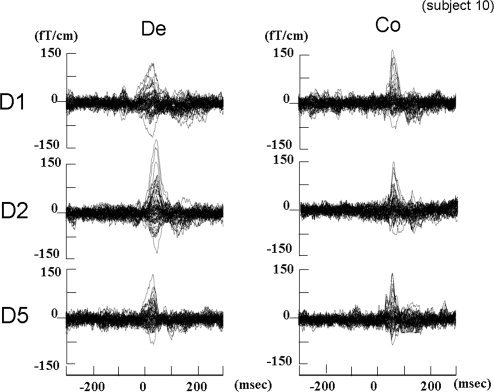
Somatosensory evoked field (SEF) waveforms of a representative subject were obtained by mechanical stimulation of D1, D2, and D5 in the compression trigger session (Co) and the decompression trigger session (De).
Table I.
Summary of goodness of fit (GOF, %)
| Subject | 1 | 2 | 3 | 4 | 5 | 6 | 7 | 8 | 9 | 10 | 11 | Average | SE |
|---|---|---|---|---|---|---|---|---|---|---|---|---|---|
| D1De | 86.7 | 82.3 | 88.1 | 94.8 | 82.0 | 86.6 | 94.4 | 96.1 | 81.3 | 85.1 | 95.1 | 88.4 | 1.7 |
| D1Co | 87.1 | 92.9 | n.e. | 93.2 | n.e. | 81.1 | 85.3 | 93.4 | 92.3 | 91.3 | 93.6 | 90.0 | 1.5 |
| D2De | 97.5 | 91.4 | 93.5 | 95.9 | 83.3 | 90.2 | 94.7 | 94.0 | 92.7 | 92.1 | 96.5 | 92.9 | 1.2 |
| D2Co | 95.4 | 81.1 | n.e. | n.e. | 91.0 | 80.7 | 89.7 | 96.9 | 93.4 | 90.1 | 95.7 | 90.4 | 2.0 |
| D5De | 93.3 | 80.5 | 78.4 | 95.6 | 80.0 | n.e. | 91.0 | 90.6 | 81.6 | 93.3 | 95.8 | 88.0 | 2.3 |
| D5Co | 87.3 | 86.5 | n.e. | 81.5 | 88.2 | 90.6 | 93.1 | 96.7 | 83.1 | 89.4 | 89.3 | 88.6 | 1.4 |
Bold number indicates GOF less than 80%. Note that all subjects demonstrated SEFs for D1De and D2De, whereas two subjects failed to demonstrate SEFs for D1Co, D2Co, and D5De. Also note the lower GOF (78.4%) value of D5De.
n.e., not evoked; SE, standard error.
Figure 3.
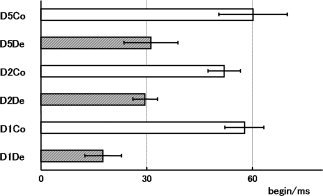
Latencies (mean and standard error) of the main peak of the source waveforms of compression and decompression responses for D1, D2, and D5. We termed them Co for compression and De for decompression. Although the latencies for D1De, D2De, and D5De were significantly shorter than those for D1Co, D2Co, and D5Co, no significant differences were obtained between D1, D2, and D5.
Strength of ECD
The strengths of ECDs were 19.7 ± 7.8 Q/nAm and 16.7 ± 9.3 Q/nAm for D1De and D1Co, respectively, 22.1 ± 9.1 Q/nAm and 13.2 ± 9.7 Q/nAm for D2De and D2Co, respectively, and 11.0 ± 6.8 Q/nAm and 10.9 ± 5.9 Q/nAm for D5De and D5Co, respectively.
A one‐way nonparametric ANOVA showed significant differences in the strength of ECD between digit responses (F‐ratio = 4.314, P < 0.005). In the post hoc comparison, the strength of ECD for the D1De and D5De responses was slightly but not significantly increased with respect to the D1Co and D5Co responses, respectively. Significant increase of ECD strength in the D2De source was found compared with the D2Co source (P = 0.035). Significant increase of ECD strength in the D1 and D2De sources was also found with respect to the D5 source (D1De vs. D5De, P = 0.038; D1De vs. D5Co, P = 0.009; D1Co vs. D5Co, P = 0.019; D2De vs. D5De, P = 0.002; D2De vs. D5Co, P < 0.001; Fig. 4).
Figure 4.
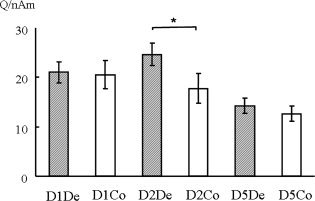
Strength of ECD for each digit response to compression and decompression stimuli. The strength of ECD for D1De and D5De responses was slightly, but not significantly, increased with respect to D1Co and D5Co responses, respectively. A significant increase of ECD strength in the D2De source was found with respect to the D2Co source (P = 0.035). Significant increase of ECD in D1 and D2De sources was also found with respect to the D5 source (D1De vs. D5De, P = 0.038; D1De vs. D5Co, P = 0.009; D1Co vs. D5Co, P = 0.019; D2De vs. D5De, P = 0.002; D2De vs. D5Co, P < 0.001).
Source Location
The estimated ECDs following D1, D2, and D5 stimulations for both compression and decompression responses were located in the right postcentral gyrus. Figure 5 shows representative data of ECD location and direction following D1De, D2De, and D5De stimuli. Line A shows how the x‐axis decreases (lateral to medial) and line B shows how the y‐axis decreases (anterior to posterior) in the order of D1De, D2De, and D5De. On the other hand, Figure 6 shows the same subject's data of ECD location following D1Co, D2Co, and D5Co. It should be noted that lines A and B show neither x‐value, y‐value, nor z‐value changes.
Figure 5.
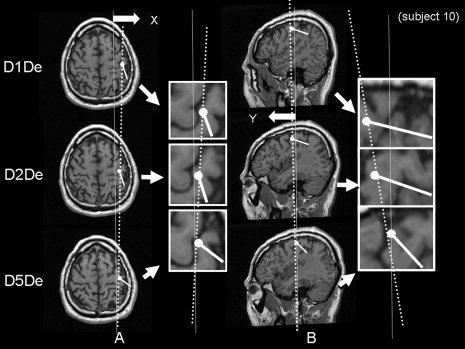
Axial and sagittal sections of the brain showing representative data of ECD location and direction following D1De, D2De, and D5De stimuli in the right postcentral gyrus. Line A shows how the x‐axis decreases (lateral to medial) and line B shows how the y‐axis decreases (anterior to posterior) in the order of D1De, D2De, and D5De.
Figure 6.
Axial and sagittal sections of the brain showing representative data of ECD location following D1Co, D2Co, and D5Co stimuli. Note that neither line A nor line B shows any changes in x‐value, y‐value, or z‐value.
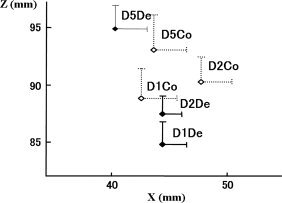
Figure 7 shows the average localizations of ECD for each stimulation. Results of ANOVA showed a significant difference in the z values of the coordinates (F 2.692, P = 0.031). Post hoc analysis indicated that the ECDs for D1De and D2De were located more deeply (z axis) than those for D5De stimuli (P = 0.003 and P = 0.031, respectively) and that the ECDs for D2De were also located more deeply than those for D5Co stimuli (P = 0.01). The average of ECD locations was in the order of D5De, D2De, and D1De medially, posteriorly, and superiorly, respectively. On the other hand, no statistical significance was obtained for the ECD location following D1Co, D2Co, or D5Co.
Figure 7.
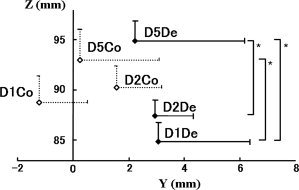
Average localizations of ECD for each stimulation. The average of ECD locations was in the order of D5De, D2De, and D1De medially, posteriorly, and superiorly, respectively. Note the ECDs for D1De and D2De were located more deeply (z axis) than those for D5De stimuli (P = 0.003, P = 0.031). The distance between D1 and D5 was greater for decompression stimuli than for compression stimuli. Error bars represent standard errors for positive values.
The average distance between D1 and D5 was decreased in compressions in all coordinates. In z‐values, the distances spanned by D1–D5 were significantly larger in decompression response than in compression response (P < 0.05). The distance between D1De and D5De (12.8 ± 1.5 mm) was larger, but not significantly larger, than that between D1Co and D5Co (9.1 ± 1.6 mm; Table II).
Table II.
Distance between D1 and D5
| De | Co | |
|---|---|---|
| x (mm) | 5.1 (1.5) | 3.5 (0.8) |
| y (mm) | 6.0 (1.1) | 5.7 (2.1) |
| z (mm) | 9.3 (1.0) | 8.0 (1.8) |
| Linear distance (mm) | 12.8 (1.6) | 9.1 (1.6) |
De, decompression stimuli; Co, compression stimuli; D1, thumb; D5, little finger.
DISCUSSION
Decompression Response
We previously applied human mechanical touch stimuli and found that somatosensory cortical responses occur not only when glabrous skin is compressed but also when it is decompressed [Inoue et al., 2005; Shirai et al., 2004]. In those studies, we found that the strength of ECDs was different in the index finger between decompression and compression responses [Shirai et al., 2004] and between the index finger and the toe [Inoue et al., 2005]. These differences between decompression and compression must be related to the previous continuous touch before decompression stimuli. We hypothesize that the decompression responses are not only evoked by peripheral action potentials [Talbot et al., 1968] but also by off‐responses [Yamashiro et al., 2009]. Visual [Crevits et al., 1982] and auditory [Hari et al., 1987; Noda et al., 1998; Pantev et al., 1996; Wakai et al., 2007] off‐responses have been studied and explained as cortical activation after continuous cortical activation disappears. Recently, off‐responses were noted by radial nerve electrical stimuli [Yamashiro et al., 2009]. However, only secondary cortical responses, not primary sensory responses, were noted in that study. One of the explanations for this is that off‐response by electrical stimuli is diminished as primary somatosensory cortical responses fail to summate the responses. This is because the duration of primary somatosensory responses is so short that the variable onset latencies of off‐responses can cancel the opposite flow of off‐responses. On the other hand, compression and decompression responses are monophasic responses that have long (70–90 ms) components as shown in Figure 2. They are essentially different from electrical responses, which have short durations.
In terms of the larger decompression responses, it was considered that off‐responses from cortical origin are added to the decompression responses from peripheral origin.
Brain Topographical Study
In the case of decompression responses, the z‐values of ECD locations for D1 and D2 stimuli are significantly smaller than that for D5 (Fig. 7). Therefore, a sufficient distinction of the positions of the cortical areas representing D1, D2, and D5 can be obtained by the present method. These results are in accordance with results for the homunculus [Penfield and Boldrey, 1937] and results obtained by imaging studies [D1 vs. D5, Kurth et al., 1998, 2000; D2 vs. D5]. The sources of D1De are significantly lower than those of D5De. On the other hand, in compression, we could not observe any resemblance of an orderly topographic representation in the medial‐lateral, anterior‐posterior, and inferior‐posterior directions. In the case of vibratory stimulus with dominant frequency of 50 Hz, nonorderly topographic representation has been found using fMRI [Gelnar et al., 1998]. As in the case of vibratory stimulus, the cortical territories should be more overlapped in compression than in decompression.
Stronger Responses to D1 and D2 Stimuli than to D5 Stimuli
The responses in D1 and D2 were stronger than that in D5 (Fig. 4). Responses in digits have been compared using SEPs, functional MRI, and MEG. Because of the smaller number of receptors stimulated, ECDs for D5 stimulation were smaller than those for D1 and D2 stimulation [Merzenich et al., 1984]. Some maps of cortical magnification, which is a receptive field's ratio of cortical area to skin area, provide support for this, but some do not [Merzenich et al., 1984, 1987]. Enlarged representations of D2 and the middle finger (D3) compared with the ring finger (D4) and D5 were demonstrated by fMRI [Hansson and Brismar, 1999]. In behavioral scientific examinations, it was shown by using grating orientation discrimination and letter recognition tests that the spatial acuity declined significantly from D2 to D3 and from D3 to D4 [Vega‐Bermudez and Johnson, 2001]. The numbers of receptors in D1 and D2 are larger than the number in D5, and this might be the reason for the responses to D1 and D2 stimuli being stronger than the response to D5 stimuli.
Stronger Decompression in the Case of D2 Stimuli
The source strengths associated with decompression were slightly stronger than the source strengths associated with compression in the case of D1 and D5 stimuli but were significantly stronger than those associated with compression in the case of D2 stimuli. Previous studies also showed a difference between index finger and great toe stimulations, decompressions being more dominant in index finger stimulation than in great toe stimulation [Inoue et al., 2005]. Peripheral differences such as size of the finger or toe and thickness of skin and difference in innervation density need to be considered. Although the sizes of fingers are in the order of D1, D2, and D5, the decompression dominancy was selective to D2 among D1, D2, and D5. There is no evidence that glabrous skin is thicker or thinner in D2 than in D1 or D5. Furthermore, there are no innervation data for individual fingers or toes. If there is no explanation of the peripheral level, central factors such as off‐response and gating phenomenon should be considered. As mentioned before, off‐responses that had not been recorded due to jittering phenomena [Yamashiro et al., 2008, 2009] might actually activate the primary somatosensory cortex. Because the components for responses by mechanical stimuli are relatively long, those off‐responses would activate the responses from peripheral action potentials by decompression stimuli. The off‐responses might be stronger in D2 than in D1 or D5 due to the larger number of receptors in the primary somatosensory cortical area [Hansson and Brismar, 1999; Merzenich et al., 1983; Vega‐Bermudez and Johnson, 2001]. Thus, it is thought that the stronger off‐responses in D2 than in D1 or D5 from cortical origin are added to the decompression responses from peripheral origin.
It is also possible that the suppression mechanism from joint movement or muscle contraction works to decrease the strengths of ECDs by compression more than by decompression responses in the SI cortex [Fujii et al., 1994; Jones et al., 1989].
Greater Digit Overlap in Compression Response
We showed that a digit‐level somatotopy exists in decompression response with an orderly distribution in the anterior‐posterior, lateral‐medial, and inferior‐superior directions, in support of results of previous studies [Kurth et al., 1998, 2000; Nelson and Chen, 2008]. In contrast, compression response did not show the existence of digit‐level somatotopy. Distances spanned by D1–D5 were only slightly larger in decompression than in compression, which were not significant. However, in z‐values, the distances spanned by D1–D5 were significantly larger in decompression response than in compression response. The results of this study suggest that decompression stimuli evoke cortical responses more selectively than do compression stimuli. Nevertheless, the effect of dynamical modulation during an experiment should be considered. It has been hypothesized that hand representation within the primary somatosensory cortex is not fixed but is dynamically modulated by top‐down mechanisms to support task requirements [Braun et al., 2000, 2002]. Considering this theory, our results suggest that top‐down mechanisms modulate the cortical response (off‐responses) in decompression. The cortical top‐down mechanism to control off‐responses in the primary somatosensory cortical areas for digits is thought to be beneficial for precision grip by modulating hand representation.
Technical Limitations
These studies have been conducted by an examiner's finger, not by machine. Therefore, the strength of decompression or compression could not be adjusted and evaluated. Using the photosensor, the timing of triggering decompression responses and that of triggering compression responses are not equal since the peak ECD latency of decompression response was shorter than that of compression responses (Fig. 3). Thus, there is a limitation in our study for evaluating each ECD latency and durations of responses.
CONCLUSIONS
Two important findings were obtained by using mechanical stimuli in this study. (1) The somatotopy of digits for decompression responses were essentially similar to those in previous studies by fMRI showing neural activities in area 3b by tactile stimuli. The reason for the overlapping somatotopy for compression responses is thought to be that decompression stimuli evoke cortical responses more selectively than do compression stimuli. It is thought that off‐responses can enhance the selectivity of somatotopy for decompression responses. (2) Decompression responses were significantly stronger than compression responses only in the case of D2 stimuli. Central factors such as off‐responses and gating were considered to be the reasons. The importance of somatosensory input from the thumb and index finger for a precision grip shows the gradual decline of ECDs and decompression dominancy from the index finger (D2) to the fifth finger (D5). This phenomenon might be limited to animals, which use tools precisely, and may reflect evolutionary distinctions.
REFERENCES
- Baumgartner C, Doppelbauer A, Sutherling WW, Zeitlhofer J, Lindinger G, Lind C, Deecke L ( 1991): Human somatosensory cortical finger representation as studied by combined neuromagnetic and neuroelectric measurements. Neurosci Lett 134: 103–108. [DOI] [PubMed] [Google Scholar]
- Braun C, Wilms A, Schweizer R, Godde B, Preissl H, Birbaumer N ( 2000): Activity patterns of human somatosensory cortex adapt dynamically to stimulus properties. Neuroreport 11: 2977–2980. [DOI] [PubMed] [Google Scholar]
- Braun C, Haug M, Wiech K, Birbaumer N, Elbert T, Roberts LE ( 2002): Functional organization of primary somatosensory cortex depends on the focus of attention. Neuroimage 17: 1451–1458. [DOI] [PubMed] [Google Scholar]
- Crevits L, van Lith G, Viifvinkel‐Bruinenga S ( 1982): On and off contribution to the combined occipital on‐off response to a pattern stimulus. Ophthalmologica 184: 169–173. [DOI] [PubMed] [Google Scholar]
- Dresel C, Parzinger A, Rimpau C, Zimmer C, Ceballos‐Baumann AO, Haslinger B ( 2008) A new device for tactile stimulation during fMRI. Neuroimage 39: 1094–1103. [DOI] [PubMed] [Google Scholar]
- Forss N, Salmelin R, Hari R ( 1994): Comparison of somatosensory evoked fields to airpuff and electric stimuli. Electroencephalogr Clin Neurophysiol 92: 510–517. [DOI] [PubMed] [Google Scholar]
- Fujii M, Yamada T, Aihara M, Kokubun Y, Noguchi Y, Matsubara M, Yeh MH ( 1994): The effects of stimulus rates upon median, ulnar and radial nerve somatosensory evoked potentials. Electroencephalogr Clin Neurophysiol 92: 518–526. [DOI] [PubMed] [Google Scholar]
- Gelnar PA, Krauss BR, Szeverenyi NM, Apkarian AV ( 1998): Fingertip representation in the human somatosensory cortex: an fMRI study. Neuroimage 7: 261–283. [DOI] [PubMed] [Google Scholar]
- Hansson T, Brismar T ( 1999): Tactile stimulation of the hand causes bilateral cortical activation: A functional magnetic resonance study in humans. Neurosci Lett 271: 29–32. [DOI] [PubMed] [Google Scholar]
- Hari R, Pelizzone M, Mäkelä JP, Hällström J, Leinonen L, Lounasmaa OV ( 1987): Neuromagnetic responses of the human auditory cortex to on‐ and offsets of noise bursts. Audiology 26: 31–43. [DOI] [PubMed] [Google Scholar]
- Hari R, Joutsiniemi SL, Sarvas J ( 1988): Spatial resolution of neuromagnetic records: Theoretical calculations in a spherical model. Electroencephalogr Clin Neurophysiol 71: 64–72. [DOI] [PubMed] [Google Scholar]
- Inoue K, Shirai T, Nakanishi K, Hashizume A, Harada T, Mimori Y, Matsumoto M ( 2005): Difference in somatosensory evoked fields elicited by mechanical and electrical stimulations: Elucidation of the human homunculus by a noninvasive method. Hum Brain Mapp 24: 274–283. [DOI] [PMC free article] [PubMed] [Google Scholar]
- Jones SJ, Halonen JP, Shawkat F ( 1989): Centrifugal and centripetal mechanisms involved in the ‘gating’ of cortical SEPs during movement. Electroencephalogr Clin Neurophysiol 74: 36–45. [DOI] [PubMed] [Google Scholar]
- Kakigi R, Shibasaki H, Ikeda A ( 1989): Pain‐related somatosensory evoked potentials following CO2 laser stimulation in man. Electroencephalogr Clin Neurophysiol 74: 139–146. [DOI] [PubMed] [Google Scholar]
- Kurth R, Villringer K, Mackert BM, Schwiemann J, Braun J, Curio G, Villringer A, Wolf KJ ( 1998): fMRI assessment of somatotopy in human Brodmann area 3b by electrical finger stimulation. Neuroreport 9: 207–212. [DOI] [PubMed] [Google Scholar]
- Kurth R, Villringer K, Curio G, Wolf KJ, Krause T, Repenthin J, Schwiemann J, Deuchert M, Villringer A ( 2000): fMRI shows multiple somatotopic digit representations in human primary somatosensory cortex. Neuroreport 11: 1487–1491. [PubMed] [Google Scholar]
- Ledberg A, O'Sullivan BT, Kinomura S, Roland S ( 1995): Somatosensory activations of the parietal operculum of man. A PET study. Eur J Neurosci 9: 1934–1941. [DOI] [PubMed] [Google Scholar]
- Merzenich MM, Kaas JH, Wall J, Nelson RJ, Sur M, Felleman D ( 1983): Topographic reorganization of somatosensory cortical areas 3b and 1 in adult monkeys following restricted differentiation. Neuroscience 8: 33–55. [DOI] [PubMed] [Google Scholar]
- Merzenich MM, Nelson RJ, Stryker MP, Cynader MS, Schoppmann A, Zook JM ( 1984): Somatosensory cortical map changes following digit amputation in adult monkeys. J Comp Neurol 224: 591–605. [DOI] [PubMed] [Google Scholar]
- Merzenich MM, Nelson RJ, Kaas JH, Stryker MP, Jenkins WM, Zook JM, Cynader MS, Schoppmann A ( 1987): Variability in hand surface representations in areas 3b and 1 in adult owl and squirrel monkeys. J Comp Neurol 258: 281–296. [DOI] [PubMed] [Google Scholar]
- Nelson AJ, Chen R ( 2008): Digit somatotopy within cortical areas of the postcentral gyrus in humans. Cereb Cortex 18: 2341–2351. [DOI] [PubMed] [Google Scholar]
- Noda K, Tonoike M, Doi K, Koizuka I, Yamaguchi M, Seo R, Matsumoto N, Noiri T, Takeda N, Kubo T ( 1998): Auditory evoked off‐response: its source distribution is different from that of on‐response. Neuroreport 9: 2621–2625. [DOI] [PubMed] [Google Scholar]
- Pantev C, Eulitz C, Hampson S, Ross B, Roberts LE ( 1996): The auditory evoked “off” response: Sources and comparison with the “on” and the “sustained” responses. Ear Hear 17: 255–265. [DOI] [PubMed] [Google Scholar]
- Pratt H, Starr A, Amlie RN, Politoske D ( 1979): Mechanically and electrically evoked somatosensory potentials in normal humans. Neurology 29: 1236–1244. [DOI] [PubMed] [Google Scholar]
- Shirai T, Inoue K, Hashizume A, Nakanishi K, Harada T, Mimori Y, Matsumoto M ( 2004): Human reactions to physical stimulus and the removal of such stimulus as recorded by magnetoencephalography. Neurosci Lett 362: 10–13. [DOI] [PubMed] [Google Scholar]
- Talbot WH, Darian‐Smith I, Kornhuber HH, Mountcastle VB ( 1968): The sense of flutter‐vibration: Comparison of the human capacity with response patterns of mechanoreceptive afferents from the monkey hand. J Neurophysiol 31: 301–334. [DOI] [PubMed] [Google Scholar]
- Treede RD, Lorenz J, Baumgärtner U ( 2003): Clinical usefulness of laser‐evoked potentials. Neurophysiol Clin 33: 303–314. [DOI] [PubMed] [Google Scholar]
- Vega‐Bermudez F, Johnson KO ( 2001): Differences in spatial acuity between digits. Neurology 56: 1389–1391. [DOI] [PubMed] [Google Scholar]
- Wakai RT, Lutter WJ, Chen M, Maier MM ( 2007): On and off magnetic auditory evoked responses in early infancy: A possible marker of brain immaturity. Clin Neurophysiol. 118: 1480–1487. [DOI] [PMC free article] [PubMed] [Google Scholar]
- Yamashiro K, Inui K, Otsuru N, Kida T, Akatsuka K, Kakigi R ( 2008): Somatosensory off‐response in humans: An ERP study. Exp Brain Res 190: 207–213. [DOI] [PubMed] [Google Scholar]
- Yamashiro K, Inui K, Otsuru N, Kida T, Kakigi R ( 2009): Somatosensory off‐response in humans: An MEG study. Neuroimage 44: 1363–1368. [DOI] [PubMed] [Google Scholar]


