

Abstract
White matter (WM) has been shown to be affected in elderly patients with major depressive disorders (MDD). There is only limited evidence of WM structural abnormalities in nongeriatric MDD patients. This study investigates WM microstructural integrity in nongeriatric MDD patients recruited as part of the International Study to Predict Optimized Treatment in Depression clinical trial and establishes the validity of diffusion tensor imaging measures for the investigation of depression. Baseline diffusion tensor imaging data from 29 nongeriatric MDD participants (11 with melancholia) and 39 healthy control participants were used in this analysis. We performed tract‐based spatial statistics analyses to evaluate WM microstructural integrity (1) between all healthy controls and all MDD participants, (2) between melancholic and nonmelancholic MDD participants, and (3) between each subgroup (melancholic and nonmelancholic) and controls. Significant WM integrity deficits were seen only for the melancholic MDD participants compared with controls. Compared with controls, melancholic participants showed an average reduction of 7.8% in fractional anisotropy over WM regions associated with the limbic system, dorsolateral prefrontal cortex, thalamic projection fibers, corpus callosum, and other association fibers. These fractional anisotropy deficits were also associated with decreased axial and increased radial diffusivity in these WM regions, suggesting a pattern of decreased myelination or other degeneration change. Our findings of WM structural abnormalities associated with the limbic system, the frontal cortex, and the thalamus support the prevailing theory of limbic‐dorsolateral prefrontal cortex‐thalamic dysfunction in depression. Our results also suggest that these deficits are most prominent in the melancholic subtype of MDD. Hum Brain Mapp, 2011. © 2010 Wiley Periodicals, Inc.
Keywords: iSPOT‐D, major depressive disorder, diffusion tensor imaging, melancholia, nongeriatric, TBSS
INTRODUCTION
Magnetic resonance imaging (MRI) provides a noninvasive means to measure structural differences between individuals, and it has greatly enhanced the understanding of the structure–function relationship in the human brain. Diffusion tensor imaging (DTI) is an MRI modality, which is sensitive to diffusion processes in solution and can be used to measure microscopic tissue orientation characteristics in vivo [Basser et al.,1994]. In the brain, because this diffusion is affected by the orientation and integrity of the underlying axonal microstructure, DTI can noninvasively study the white matter (WM) architecture and structural connectivity. DTI‐based quantitative measures, such as fractional anisotropy (FA), the degree of anisotropy in diffusion; mean diffusivity (MD), the direction‐independent average diffusion; axial diffusivity (AD), and radial diffusivity (RD), the diffusion along or perpendicular to the principle direction of diffusion, respectively, have been shown to be useful markers of changes and degradation of WM [Bennett et al.,2010; Yuan et al.,2009]. An increase in RD has been shown to be a sensitive indicator of demyelination or dysmyelination in animal models of axonal disease [Song et al.,2002]. Interpretation of changes in AD is somewhat more complex than for RD; however, it is known to be sensitive to a number of developmental and pathological processes, including changes in fiber coherence and axonal injury [Dubois et al.,2008; Song et al.,2003].
Major depressive disorder (MDD) is a common disorder with a chronic pattern of recurrence and a lifetime prevalence of 16.2% [Kessler et al.,2003]. It is the fourth most disabling medical condition worldwide based on disability‐adjusted life years (years of life lost because of premature death and years lived with a disability of specified severity and duration) [Greenberg et al.,1993]. Several preliminary studies have found WM abnormalities in MDD patients. Using mainly region‐of‐interest (ROI) analysis approaches, patient populations with MDD have been shown to have reduced anisotropy in the frontal lobe [Bae et al.,2006; Li et al.,2007; Shimony et al.,2009; Taylor et al.,2004] and temporal lobe [Nobuhara et al.,2006; Steele et al.,2005; Yang et al.,2007]. Reduced frontal WM FA has also been associated with greater severity of depression [Nobuhara et al.,2006] and poor response to antidepressant medications (ADMs) [Alexopoulos et al.,2002,2008]. Other DTI studies using voxel‐based and tract‐based analysis approaches have demonstrated decreased FA in other regions, including the corpus callosum, internal capsule, superior longitudinal fasciculus (SLF), sagittal stratum, and occipital and parietal cortices [Kieseppa et al.,2010; Ma et al.,2007; Zou et al.,2008].
Almost all MRI studies of depression to date have examined cohorts of advanced age [Bae et al.,2006; Nobuhara et al.,2006s; Shimony et al.,2009; Taylor et al.,2004; Yang et al.,2007]. The implicit assumption contained within many of these studies is that any anatomical abnormalities seen are secondary or compounded by age‐related pathology. Of the small number of DTI studies in nongeriatric patients, the outcomes have either been of reduced significance or of limited consensus in terms of the WM regions affected. However, these studies provide the basis to hypothesize the presence of connectivity abnormalities occurring in MDD in a nongeriatric setting [Kieseppa et al.,2010; Li et al.,2007; Ma et al.,2007; Zou et al.,2008]. It is also not clear from the current evidence how the loss of WM connectivity varies with subtypes of depression. The known substantial heterogeneity of this illness may be a possible reason for lack of consolidation in outcomes from these studies [Rush,2007; Stewart et al.,2007].
Based on the results of functional imaging studies, it has been postulated that frontal–limbic network dysregulation occurs with depression [Drevets,2000; Drevets et al.,2008; Johnstone et al.,2007]. Using an integrative neuroscience approach, our group has also recently shown the influence of gene–environment interactions and limbic–prefrontal structural changes on the level of risk and symptoms of depression [Gatt et al.,2009]. These observations lead us to postulate that the same cortical network will also be affected at the underlying subcortical WM level.
This study was conducted as part of the International Study to Predict Optimized Treatment in Depression (iSPOT‐D), an ongoing multicentre, international, randomized, prospective, open‐label clinical trial (Williams et al., submitted for publication) designed to evaluate a number of potentially useful clinical, cognitive, genetic, and MRI measures that might inform treatment strategy in outpatients with nonpsychotic MDD. This study was aimed to use the baseline data from the imaging subset of the first 15% of the iSPOT‐D cohort to establish the validity of DTI for the investigation of depression. We also used tract‐based spatial statistics (TBSS) analysis of the DTI data from this subset of nongeriatric MDD patients to test the working hypothesis that patients in an acute phase of MDD will differ from matched healthy controls with regard to corticolimbic WM connectivity, and that these differences may be more profound in the melancholic subtype of MDD because of the more severe phenotypic expression of this subtype.
MATERIALS AND METHODS
Participants
Participants were drawn from the first 15% of patients who provided MRI data at Westmead Hospital (University of Sydney Medical School) as part of the baseline data collection for the iSPOT‐D study (i.e., 30 of the total 200 MDD patients, aged 18–65, estimated to be tested at this site) (Williams et al., submitted for publication). Of this first 15%, DTI data were not collected at one patient's baseline visit because of time constraints. Hence, a total of 29 MDD patients provided DTI data for this analysis. At the time of analysis, a total of 39 healthy control participants had been scanned as part of the study, and DTI data from these control participants were included for comparison.
A complete description of the iSPOT‐D study protocol, clinical assessments, inclusion/exclusion criteria, and diagnosis procedures is provided in Williams et al. (submitted for publication). In short, the Mini‐International Neuropsychiatric Interview [Sheehan et al.,1997,1998], according to Diagnostic and Statistical Manual of Mental Disorders, fourth edition, criteria, and a 17‐item Hamilton Rating Scale for Depression [Hamilton,1960] score ≥16 confirmed primary diagnosis of MDD. All MDD patients were either ADM naïve or had undergone a wash out period if previously prescribed an ADM. MDD participants with a score >7 on the Clinical Outcome in Routine Evaluation scale were categorized as having melancholic depression, whereas those with a score ≤7 were categorized as having nonmelancholic depression [Parker and Hadzi‐Pavlovic,1996]. Healthy control participants were extensively screened for the absence of Axis I disorders using the Mini‐International Neuropsychiatric Interview and for a 17‐item Hamilton Rating Scale for Depression score < 7, and could not meet the Diagnostic and Statistical Manual of Mental Disorders, fourth edition, criteria for single or recurrent nonpsychotic MDD. This study was conducted according to the principles of the Declaration of Helsinki 2008 (World Medical Association Declaration of Helskini: http://www.wma.net/en/30publications/10policies/b3/index.html). After the study procedures were fully explained in accordance with the ethical guidelines of the institutional review board, participants provided written informed consent.
Image Acquisition
Magnetic resonance images were acquired using a 3.0 Tesla GE Signa HDx scanner (GE Healthcare, Milwaukee, WI). Acquisition was performed using an eight‐channel head coil. Three‐dimensional T1‐weighted images were acquired in the sagittal plane using a three‐dimensional SPGR sequence (TR, 8.3 ms; TE, 3.2 ms; flip angle, 11°; TI, 500 ms; NEX, 1; ASSET, 1.5; and frequency direction, S/I). A total of 180 contiguous 1‐mm slices were acquired using a 256 × 256 matrix with an in‐plane resolution of 1 mm × 1 mm that results in isotropic voxels. Diffusion tensor images were acquired using a spin‐echo DTI‐Echo Planar Imaging sequence. Seventy contiguous 2.5‐mm slices were acquired in an axial orientation with an in‐plane resolution of 1.72 mm × 1.72 mm and a 128 × 128 matrix (TR, 17,000 ms; TE, 95 ms; fat saturation, ON; NEX, 1; and frequency direction, R/L). A baseline image (b = 0) and 42 different diffusion orientations were acquired with a b‐value of 1,250.
Volumetric Analysis of MRI Data
The T1‐weighted MRI data were processed using a previously described optimized protocol that uses Statistical Parametric Mapping (SPM2; Wellcome Department of Imaging Neuroscience, London; http://www.fil.ion.ucl.ac.uk/spm), running under MATLAB 6.5 software (MathWorks, Natick, MA) [Ashburner and Friston,2000; Grieve et al.,2005]. WM regional volume measurements were made using custom templates as previously described in Grieve et al. [2007].
Tract‐Based Spatial Statistical Analysis of DTI Data
DTI data were preprocessed and analyzed using the Oxford Centre for Functional MRI of the Brain (FMRIB) Diffusion Toolbox [Behrens et al.,2003] and TBSS [Smith et al.,2006] software tools as part of the FMRIB Software Library (FSL) release 4.1.3 (http://www.fmrib.ox.ac.uk/fsl) [Smith et al.,2004]. The raw DTI data for each participant were first corrected for head movement and eddy current distortions. A binary brain mask was generated using the baseline nondiffusion weighted (b = 0) image. Diffusion tensor models were then fitted independently for each voxel within the brain mask and images of FA, MD, first (λ1), second (λ2), and third (λ3) eigen values were generated for each participant.
FA images from each participant were then aligned to the FMRIB58_FA template and transformed into Montreal Neurological Institute 152 1 mm3 standard space using the nonlinear registration tool FNIRT [Andersson et al.,2007a,b]. Next, an average FA image was generated and thinned to create a WM skeleton representing the centers of all WM tracts common to all participants. This FA skeleton was then thresholded to FA ≥ 0.3 to include the major WM pathways but avoid peripheral tracts that are more vulnerable to interparticipant variability and/or partial volume effects with grey matter. Each participant's aligned FA image was then projected onto the mean FA skeleton by assigning each skeleton voxel by the maximum FA value found in a direction perpendicular to the tract. This accounts for any residual registration misalignments and variability in exact tract location between participants.
Voxel‐wise cross‐participant statistics were then performed on this skeletonized participant data using the Randomise (v2.1) permutation testing software in FSL. We performed three sets of FA comparisons: (1) between all healthy controls and all participants with MDD, (2) between melancholic and nonmelancholic participants, and (3) between each subgroup (melancholic and nonmelancholic) and controls. Age was found to be significantly different between the groups, and, accordingly, age was included as a covariate of no interest in all analyses, as was gender. Permutation testing was performed using 5,000 permutations with the threshold‐free cluster enhancement option. This option enables the finding of clusters without setting an initial cluster threshold [Smith and Nichols,2009]. Statistical maps corrected for multiple comparisons at the cluster level (P < 0.05) were used for assessment. The Johns Hopkins University International Consortium for Brain Mapping (JHU ICBM)‐DTI‐81 WM labels atlas [Mori et al.,2008] was used to label clusters with significant FA differences. For clusters not labeled using this atlas, assignments were made using custom templates created with reference to both the high‐resolution image and segmented images of the Montreal Neurological Institute single‐participant brain, which have previously been described [Grieve et al.,2007]. A binary mask of the cluster in each label was also generated to extract the mean FA in each identified label for each participant.
Following analysis of FA, the diffusional characteristics of the significant clusters were characterized using the diffusion parameters MD, AD, and RD. For comparisons with no‐FA significant differences, the other diffusion parameters were not evaluated (see later). The non‐FA images (MD, λ1, λ2, and λ3) were first projected onto the skeleton using the same nonlinear warping parameters, and skeleton projection vectors calculated for the FA images. The generated cluster binary mask in each label was then used to calculate the respective average diffusion parameter value for each participant. λ1 values were used to represent AD, and the average of the λ2 and λ3 values were used to represent RD. Significant differences in MD, AD, and RD between the melancholic and control group were evaluated using analysis of variance in SPSS.
RESULTS
Volumetric Analysis of MRI Data
The demographic features and structural volumetric data for the control, all MDD, melancholic, and nonmelancholic groups are presented in Table I. Global grey matter volume was found to be significantly lower for the MDD group (−6.5%; P = 0.02) and the melancholic subgroup (−7.6%; P = 0.04) compared with the control group. There were no significant differences between the control group and any MDD subgroup regarding the other gross brain volumetric measurements or regional WM volumes.
Table I.
Selected demographic features and structural volumetric data
| Controls (n = 39) | All MDD participants (n = 29) | Melancholic (n = 11) | Nonmelancholic (n = 18) | |
|---|---|---|---|---|
| Demographics | ||||
| Age (years) | 29.6 ± 12.7 | 40.5 ± 15.8a | 43.1 ± 15.3a | 38.9 ± 16.3a |
| Male gender (%) | 46.2 | 41.3 | 36.4 | 44.4 |
| Education (years) | 14.7 ± 3.4 | 14.5 ± 3.2 | 14.7 ± 3.8 | 14.7 ± 3.4 |
| Alcohol consumers (%) | 53.8 | 39.3 | 36.4 | 41.2 |
| Left handers (%) | 7.7 | 13.8 | 18.2 | 11.1 |
| DASS Depression | 0.82 ± 1.06 | 9.76 ± 4.18a | 9.10 ± 4.38a | 10.2 ± 4.14a |
| DASS Anxiety | 0.79 ± 1.09 | 5.04 ± 3.16a | 5.00 ± 3.37a | 5.07 ± 3.13a |
| DASS Stress | 2.08 ± 1.63 | 8.84 ± 4.46a | 8.50 ± 5.76a | 9.07 ± 3.56a |
| HRSD17 | 1.3 ± 1.5 | 19.1 ± 3.0a | 20.1 ± 3.2a | 18.4 ± 2.7a |
| CORE | 0.3 ± 0.8 | 9.1 ± 4.3a | 12.0 ± 3.0a | 7.3 ± 4.1a,b |
| Volumetric MRI | ||||
| Global GM (mL) | 776.9 ± 82.8 | 726.1 ± 83.8a | 717.6 ± 71.4a | 731.1 ± 92.0 |
| Global WM (mL) | 470.0 ± 42.2 | 475.5 ± 54.4 | 480.2 ± 50.0 | 472.8 ± 58.1 |
| Global CSF (mL) | 348.1 ± 187.8 | 413.9 ± 164.8 | 422.2 ± 207.6 | 409.1 ± 140.8 |
| Frontal lobe WM (mL) | 151.4 ± 14.3 | 154.1 ± 20.4 | 156.5 ± 18.9 | 152.6 ± 21.8 |
| Parietal lobe WM (mL) | 89.0 ± 8.4 | 89.9 ± 11.2 | 90.1 ± 10.8 | 89.8 ± 11.8 |
| Occipital lobe WM (mL) | 52.8 ± 5.8 | 52.7 ± 6.2 | 53.4 ± 7.0 | 52.3 ± 5.8 |
| Temporal lobe WM (mL) | 64.3 ± 5.5 | 64.8 ± 7.7 | 66.0 ± 7.7 | 64.1 ± 7.8 |
Significant difference with control group at P < 0.05.
Significant difference with melancholic group at P < 0.05.
CSF, cerebrospinal fluid; CORE, Clinical Outcome in Routine Evaluation; DASS, Depression Anxiety Stress Scales; GM, gray matter; HRSD17, 17‐Item Hamilton Rating Scale for Depression; MDD, major depressive disorder; WM, white matter.
TBSS Analysis of DTI Data
Significant WM FA differences were observed between the melancholic subgroup and the control group. No significant WM FA differences were found between the control vs. all MDD, control vs. nonmelancholic, or melancholic vs. nonmelancholic groups. Because no significant FA clusters were found, these comparisons were not further evaluated using the other diffusion measures.
FA was found to be significantly lower for melancholic patients compared with controls in 13 WM regions identified using the JHU atlas. Figure 1 shows selected slices displaying the WM skeleton with the significant clusters superimposed in color. The identified WM regions and average FA values for these clusters (corrected for age and gender) are summarized in Table II. The average decreased FA seen over the 13 regions was 7.8%, with a maximum difference of 13.5% seen in the right fornix/stria terminalis and a minimum difference of 3.5% seen in the retrolenticular part of the left internal capsule. No WM regions with significantly higher FA for melancholic participants than for controls were identified. Numerous significant differences (P < 0.05) between the melancholic and control groups were found for the other diffusion measures (Table II). Of the 13 clusters examined, three showed significant AD differences, whereas nine regions showed significant differences in RD. For these significant regions, there was a general pattern of lower AD and higher RD in melancholic participants compared with controls. Regarding MD, only one region showed a small difference between groups (left sagittal stratum, melancholic > controls).
Figure 1.
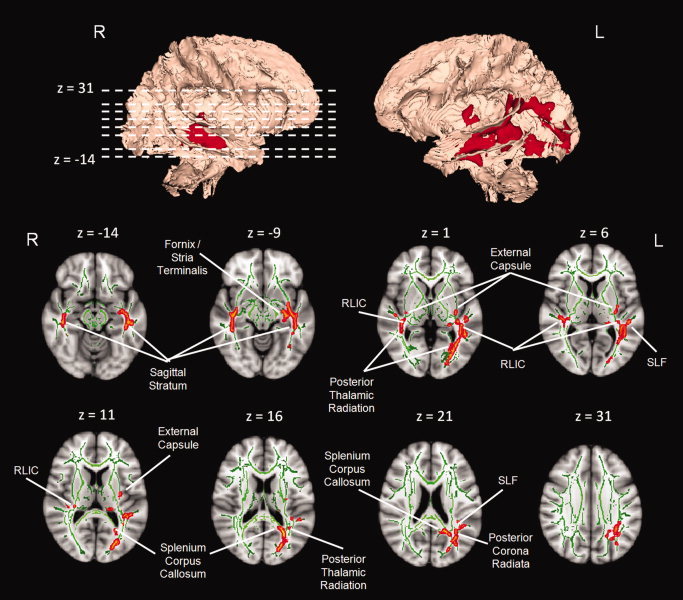
Three‐dimensional rendered view of the WM tract skeleton (Montreal Neurological Institute space) with areas of significantly lower fractional anisotropy (P < 0.05, family‐wise error corrected) for the melancholic participant subgroup compared with healthy controls shown in red (upper row). Bottom two rows show selected axial slices of the three‐dimensional rendering overlaid on the Montreal Neurological Institute standard brain: WM tract skeleton = green; significant WM clusters = red. Images are in radiological convention.
Table II.
Diffusional characteristics of significant white matter clusters
| White matter cluster | FA | MD (10−4 mm2) | AD (10−4 mm2) | RD (10−4 mm2) | ||||||||
|---|---|---|---|---|---|---|---|---|---|---|---|---|
| Controls | Melancholic | Difference | Controls | Melancholic | Difference | Controls | Melancholic | Difference | Controls | Melancholic | Difference | |
| Limbic | ||||||||||||
| L fornix/stria terminalis | 0.57 ± 0.01 | 0.52 ± 0.01 | −8.8% | 8.30 ± 0.07 | 8.27 ± 0.13 | −0.4% | 14.30 ± 0.12 | 13.50 ± 0.24 | −5.5% | 5.31 ± 0.07 | 5.66 ± 0.15 | 6.7% |
| R fornix/stria terminalis | 0.52 ± 0.01 | 0.45 ± 0.03 | −13.5% | 8.12 ± 0.13 | 8.07 ± 0.26 | −0.6% | 13.34 ± 0.25 | 12.44 ± 0.49 | −6.7% | 5.52 ± 0.14 | 5.88 ± 0.27 | 6.5% |
| Association fibers of DLPFC | ||||||||||||
| L superior longitudinal fasciculus | 0.60 ± 0.01 | 0.55 ± 0.01 | −8.3% | 7.58 ± 0.06 | 7.74 ± 0.12 | 2.1% | 13.53 ± 0.10 | 13.19 ± 0.20 | −2.5% | 4.60 ± 0.06 | 5.02 ± 0.13 | 9.1% |
| Projection fibers | ||||||||||||
| L retrolenticular part of internal capsule | 0.57 ± 0.01 | 0.55 ± 0.01 | −3.5% | 8.21 ± 0.07 | 8.42 ± 0.14 | 2.6% | 14.22 ± 0.11 | 14.19 ± 0.22 | −0.2% | 5.20 ± 0.07 | 5.53 ± 0.14 | 6.3% |
| R retrolenticular part of internal capsule | 0.60 ± 0.01 | 0.57 ± 0.01 | −5.0% | 8.11 ± 0.05 | 8.28 ± 0.11 | 2.1% | 14.51 ± 0.10 | 14.33 ± 0.20 | −1.2% | 4.91 ± 0.07 | 5.25 ± 0.15 | 7.0% |
| L posterior corona radiate | 0.55 ± 0.01 | 0.51 ± 0.02 | −7.3% | 8.19 ± 0.06 | 8.47 ± 0.12 | 3.4% | 13.98 ± 0.11 | 13.87 ± 0.21 | −0.8% | 5.29 ± 0.09 | 5.77 ± 0.18 | 9.0% |
| L posterior thalamic radiation | 0.67 ± 0.01 | 0.64 ± 0.01 | −4.5% | 8.15 ± 0.05 | 8.23 ± 0.11 | 1.0% | 15.71 ± 0.08 | 15.37 ± 0.17 | −2.1% | 4.37 ± 0.07 | 4.66 ± 0.14 | 6.6% |
| R posterior thalamic radiation | 0.65 ± 0.01 | 0.62 ± 0.02 | −4.6% | 8.18 ± 0.10 | 8.27 ± 0.20 | 1.1% | 15.39 ± 0.16 | 15.01 ± 0.32 | −2.5% | 4.57 ± 0.11 | 4.90 ± 0.21 | 7.2% |
| Other association fibers | ||||||||||||
| L sagittal stratum | 0.59 ± 0.01 | 0.54 ± 0.01 | −8.5% | 8.11 ± 0.06 | 8.52 ± 0.13 | 5.1% | 14.30 ± 0.09 | 14.26 ± 0.18 | −0.3% | 5.01 ± 0.08 | 5.66 ± 0.16 | 12.8% |
| R sagittal stratum | 0.60 ± 0.01 | 0.55 ± 0.01 | −8.3% | 8.06 ± 0.05 | 8.24 ± 0.10 | 2.2% | 14.32 ± 0.10 | 13.84 ± 0.19 | −3.3% | 4.93 ± 0.07 | 5.44 ± 0.13 | 10.5% |
| L external capsule | 0.52 ± 0.01 | 0.48 ± 0.01 | −7.7% | 7.96 ± 0.07 | 8.17 ± 0.13 | 2.6% | 13.09 ± 0.09 | 12.78 ± 0.17 | −2.4% | 5.40 ± 0.07 | 5.87 ± 0.14 | 8.7% |
| R external capsule | 0.54 ± 0.01 | 0.48 ± 0.02 | −11.1% | 8.14 ± 0.06 | 8.31 ± 0.11 | 2.1% | 13.65 ± 0.12 | 13.07 ± 0.24 | −4.2% | 5.39 ± 0.08 | 5.94 ± 0.16 | 10.2% |
| Corpus callosum | ||||||||||||
| Splenium | 0.76 ± 0.00 | 0.73 ± 0.01 | −3.9% | 7.31 ± 0.05 | 7.48 ± 0.10 | 2.3% | 15.60 ± 0.11 | 15.37 ± 0.22 | −1.5% | 3.16 ± 0.06 | 3.53 ± 0.11 | 11.7% |
| Other clusters | ||||||||||||
| L frontal WM | 0.52 ± 0.01 | 0.49 ± 0.01 | −5.8% | 7.99 ± 0.05 | 8.01 ± 0.10 | 0.3% | 13.09 ± 0.08 | 12.67 ± 0.16 | −3.3% | 5.44 ± 0.06 | 5.69 ± 0.12 | 4.6% |
| R frontal WM | 0.54 ± 0.01 | 0.49 ± 0.02 | −9.3% | 7.87 ± 0.07 | 8.05 ± 0.14 | 2.3% | 13.03 ± 0.14 | 12.53 ± 0.28 | −3.8% | 5.29 ± 0.09 | 5.81 ± 0.17 | 10.0% |
| L temporal WM | 0.56 ± 0.00 | 0.51 ± 0.01 | −8.9% | 7.86 ± 0.05 | 8.10 ± 0.09 | 3.1% | 13.40 ± 0.07 | 13.14 ± 0.14 | −1.9% | 5.10 ± 0.05 | 5.58 ± 0.10 | 9.5% |
| R temporal WM | 0.54 ± 0.01 | 0.49 ± 0.01 | −9.3% | 7.85 ± 0.05 | 8.04 ± 0.09 | 2.4% | 13.20 ± 0.08 | 12.83 ± 0.15 | −2.8% | 5.18 ± 0.06 | 5.65 ± 0.12 | 9.1% |
| L parietal WM | 0.49 ± 0.00 | 0.45 ± 0.01 | −8.2% | 7.34 ± 0.05 | 7.52 ± 0.10 | 2.5% | 11.63 ± 0.07 | 11.46 ± 0.14 | −1.5% | 5.20 ± 0.05 | 5.55 ± 0.10 | 6.8% |
| R parietal WM | 0.51 ± 0.01 | 0.45 ± 0.02 | −11.8% | 7.71 ± 0.08 | 7.92 ± 0.16 | 2.7% | 12.15 ± 0.14 | 11.73 ± 0.29 | −3.5% | 5.49 ± 0.10 | 6.02 ± 0.20 | 9.6% |
| L occipital WM | 0.58 ± 0.00 | 0.53 ± 0.01 | −8.6% | 7.51 ± 0.05 | 7.79 ± 0.10 | 3.7% | 13.13 ± 0.06 | 12.99 ± 0.13 | −1.1% | 4.70 ± 0.06 | 5.19 ± 0.11 | 10.3% |
Significant differences (P < 0.05) between the healthy controls and melancholic MDD participants are denoted in bold.
AD, axial diffusivity; DLPFC, dorsolateral prefrontal cortex; FA, fractional anisotropy; L, Left; MD, mean diffusivity; R, Right; RD, radial diffusivity; WM, white matter.
Regarding the significant differences seen in the melancholic group compared with controls, the crus of the fornix and stria terminalis, both associated with the limbic region, showed decreased FA bilaterally (13.5% on the right and 8.8% on the left). The left fornix/stria terminalis showed significantly increased RD (6.7%) and decreased AD (5.5%). No difference in RD or AD was seen on the right in this structure.
Significant diffusional differences were seen in the association fibers related to the external capsule and the sagittal stratum. An FA decrease of approximately 8%, together with RD increases of 12.8%, and 10.5%, was observed for melancholic participants in the left and right sagittal stratum ROIs, respectively. A similar bilateral FA/RD change was also seen in the external capsule (7.7% FA decrease and 8.7% RD increase on the left; 11.1% FA decrease and 10.2% RD increase on the right). An AD decrease of 3.3% and 4.2% was observed in the right‐side sagittal stratum and external capsule, respectively, with no significant difference observed in the left side.
Significant decreases in FA for melancholic participants were also observed in other clusters of the projection fiber bundles. These decreases were mainly in the left posterior corona radiata (7.3%) and bilateral regions of the posterior thalamic radiations (4.5% on the left and 4.6% on the right) and retrolenticular part of the internal capsule (3.5% on the left and 5.0% on the right). Significant increases in RD were also seen in the posterior corona radiata (9.0%) and right retrolenticular part of the internal capsule (7.0%) clusters.
Other regions of significant FA/RD changes in melancholic participants were the splenium region of the corpus callosum (3.9% FA decrease and 11.7% RD increase) and the left SLF (8.3% FA decrease and 9.1% RD increase).
A number of WM regions that are not represented in the JHU atlas were detected in our study. These clusters were mainly extensions of the association and projection fiber bundles described above and have been grouped by main brain lobes for interpretation. These regions also showed a similar pattern of FA/AD decrease and MD/RD increase for melancholic participants as was seen for the other WM clusters.
DISCUSSION
In this study, we present evidence of WM structural involvement in a nongeriatric MDD patient group. Using DTI data analysis of all major connectivity tracts, we found that these structural differences were found significant for only the melancholic subtype of MDD participants. The nonmelancholic MDD participant group did not show any evidence of significant WM structural differences compared with either the melancholic or control groups. A large number of WM clusters showed significantly reduced FA in melancholic participants compared with controls. When we examined the diffusional characteristics of these significant clusters, the predominant pattern was of normal or slightly decreased AD and increased RD. This pattern may represent decreased myelination; however, it could also result from a decrease in the number of normally myelinated fibers or an altered WM microstructure in the affected WM tracts (e.g., axonal degeneration [Bennett et al.,2010]).
Classification of Significant Clusters
The significant clusters in our study can be classified into five main groups: (1) limbic, (2) association fibers relating to the dorsolateral prefrontal cortex (DLPFC), (3) projection fibers, (4) other association fibers, and (5) corpus callosum. These WM clusters relate to regions with WM, structural, or functional abnormalities previously reported in MDD patients. For example, the Fornix and Stria terminalis are both associated with the amygdala and hippocampus limbic regions [Mori et al.,2008]. Both morphometry and WM abnormalities with depression have been previously reported for both these limbic regions [Frodl et al.,2008; Kronmuller et al.,2009; MacQueen et al.,2003; Yang et al.,2007].
Similarly, the SLF is a primary association tract connecting the frontal cortex with the temporal, occipital, and parietal lobes, with a particular bias toward fibers originating or terminating in the DLPFC. Frontal lobe dysfunction and its association with depression symptomology has been well established [Koenigs and Grafman,2009]. There is evidence of severity of depression symptoms to be linked with frontal WM changes in late‐life depression [Nobuhara et al.,2006]. It has been previously shown that ischemic changes in the DLPFC predispose elderly patients to depression [Hickie et al.,1997]. FA alterations in the SLF have also been previously reported for both elderly and young depressed individuals [Bae et al.,2006; Zou et al.,2008]. Our study provides strong data to confirm this finding, with both FA and RD differences seen in melancholic participants.
Our study also confirms previous findings of decreased FA in the projection fibers of the internal capsule [Zou et al.,2008] and association fibers within the sagittal stratum [Kieseppa et al.,2010] in MDD patients. Additional identified clusters were mainly present bilaterally in the posterior thalamic radiations and the left posterior corona radiata region. Both these regions carry the thalamocortical projection fibers, which may support the role of thalamic‐cortical connection theories in the etiology of MDD [Lafer et al.,1997].
Limbic‐DLPFC‐Thalamic Dysfunction in Depression
A number of functional imaging studies have identified the interplay between the limbic and the dorsolateral frontal cortex as a key concept in understanding the mechanism behind MDD [Dannlowski et al.,2009; Hooley et al.,2009; Kito et al.,2008]. Functional studies also implicate both of these regions, with positive treatment response using cognitive behavioral therapy associated with increased metabolic rates in the hippocampus and dorsal cingulate and decreases in the DLPFC [Goldapple et al.,2004]. Similarly, other functional data after pharmacological intervention show modulation of both regions, albeit in the opposite direction of the treatment affect [Kennedy et al.,2001]. These functional findings and the structural evidence support the idea that impaired function both within and between the limbic structures and the associated frontal cortical regions can explain most of the symptomatology and performance changes associated with depression [Drevets et al.,2008].
The other brain regions considered to be an integral part of this depression‐related limbic‐cortical network are the basal ganglia and the thalamus [Drevets et al.,2008; Lafer et al.,1997]. Functional and structural imaging studies have indicated that abnormalities in the basal ganglia structures are related to depression [Pizzagalli et al.,2009]. Both the basal ganglia and the thalamus are connected topographically to different functional regions of the frontal cortex, with the thalamus playing the important mediator role between these connections [Haber and Calzavara,2009]. In addition, specific connections exist between different regions of the thalamus and the limbic structures [Taber et al.,2004], suggesting that the thalamus may also have an important role to play in the frontal‐limbic dysregulation that is seen in depression. Our data confirm the central involvement of the limbic system with depression, which, combined with our demonstration of decreased WM tract integrity involving the frontal cortex and the thalamus, provides strong support for the prevailing theory of limbic‐DLPFC‐thalamic dysfunction in melancholic depression.
Only limited data were available on DTI MRI of nongeriatric patients with depression. Ma et al. [2007] showed FA reductions in the WM of the right middle frontal, left lateral occipitotemporal gyrus, and right parietal lobe in a subgroup (n = 14) of patients with MDD. Similar FA reductions in the prefrontal WM of 19 MDD patients were reported by Li et al. [2007]. Zou et al. [2008] also reported findings of decreased FA in the left anterior limb of the internal capsule and the parietal portion of the SLF in a larger group of 45 MDD patients. Although the outcomes from these studies have assumed a homogeneous MDD population group for the sake of analysis, this study was unable to replicate any of these previous findings in an analysis of the nonstratified MDD patient population.
In contrast, the strongest effects seen in our study were observed in our comparisons of the melancholic subgroup, a finding that suggests that the WM deficits may be specific to the melancholic subcategory of MDD patients. Melancholia is considered to be the most severe and chronic form of depression, with a low remission rate and known biological effects [McGrath et al.,2008; Rush,2007]. We suggest that the nonmelancholic subtype of depression may not share the same structural basis as the melancholic subtype. Including these patients in our analysis (18 nonmelancholics of a total of 29 MDD participants) may have diluted the effect observed by previous studies, which do not document the patient melancholic type characteristics and, hence, may have systematically included more melancholic patients. A possible alternative reason for this study not demonstrating WM effects in the main MDD group is that all the patients recruited into the previous studies were treatment‐naïve, whereas a subgroup of participants in our study had been on an ADM before entering a washout period before participating in our study. The only other study that did not show any significant FA differences in nongeriatric MDD patients had a subset of patients on prior or existing ADM [Kieseppa et al.,2010]. Nevertheless, our findings confirm the biological effect related to this subtype and suggest that the WM abnormalities seen in MDD patients are more pronounced in melancholia.
Strengths and Limitations
TBSS represents a marked improvement over ROI‐based approaches because it permits the detection of brain regions that are involved in disease processes without any need for preconceived “leading” hypotheses regarding the boundaries and locations of regions likely to be involved. This is of considerable importance in a disease process that involves alterations to brain functional dynamics, such as in depression. The current analysis is, however, limited by the inability to ascertain the precise architecture of the involved tracts after their identification. An example of this is the bilateral SLF clusters seen in this study. The axonal fibers in the SLF comprise four groups (SLF I, SLF II, SLF III, and arcuate fascicle) [Makris et al.,2005]. SLF I fibers terminate in the DLPFC and may be implicated in the psychometric defects seen in depression. A second limitation of this study is that detection of static structural abnormalities can only be of limited value in elucidating dysfunction in a dynamic organ such as the brain. Performance data are required to place these data in context. In subsequent studies on the iSPOT‐D cohort, we plan to use tensor tractography, functional MRI, and psychometric data to provide a more integrated and functional context for the structural changes demonstrated in this study. The wide age difference between the healthy participant and melancholic MDD subgroup adds caution to the interpretation of findings of our study. Although we have attempted to statistically correct for this difference in our analysis, these outcomes are required to be validated with closer age‐matched cohorts. The target control and MDD patient cohort to be collected as part of the iSPOT‐D study will provide us an opportunity to revalidate these outcomes using a larger and closely age–gender‐matched samples.
Although our findings seem to correspond to existing models of depression, it is not possible to postulate a causal structural involvement from this cross‐sectional study because all of the melancholic participants involved presented with an established diagnosis of melancholic depression. A further exploration of any postulated structural basis for melancholic depression would require a longitudinal study that involves data gathered on participants before onset.
CONCLUSIONS
This study investigated WM structural differences between healthy controls and patients with MDD. Using TBSS on DTI data, we were able to show that these WM structural differences were most prominent in the melancholic subgroup of MDD participants. Compared with controls, melancholic participants showed an average reduction of 7.8% in FA over WM regions associated with the limbic system, DLFC, thalamic projection fibers, corpus callosum and other association fiber bundles. This reduction in FA was also found to be associated with mainly unchanged MD, a 3.3–5.5% decrease in AD, and a 6.7–12.8% increase in RD in these areas, which suggests a pattern of decreased myelination with depression. Specific WM abnormalities associated with the limbic system, the frontal cortex, and the thalamus observed in our study are consistent with the prevailing theory of limbic‐DLPFC‐thalamic dysfunction in depression. As part of the iSPOT‐D clinical trial, our future goals will be to validate these initial preliminary findings using a larger patient population sample and to integrate DTI tractography, functional MRI, and psychometric data to better understand this limbic‐DLPFC‐thalamic coupling implication in depression.
Acknowledgements
The authors acknowledge the iSPOT‐D Investigators Group and the contributions of principal investigators at each site. They gratefully acknowledge the editorial support of Jon Kilner, MS, MA (Pittsburgh, PA), and the monitoring and management support of the Clinical Research Organization, PhaseForward. They also acknowledge the support of Ms. Claire Day in the recruitment and data collection of participants in the study, and the help of the radiographers at Westmead Hospital, Sydney, with the MRI data collection.
Conflicts of interest: S.H.K. and L.M.W. are small equity holders in Brain Resource Ltd. and have received consultancy fees for work unrelated to this study. E.G. is the CEO of Brain Resource Ltd. and has significant equity and stock options in the company.
The clinical trials registration identifier is NCT00693849.
REFERENCES
- Alexopoulos GS, Kiosses DN, Choi SJ, Murphy CF, Lim KO ( 2002): Frontal white matter microstructure and treatment response of late‐life depression: A preliminary study. Am J Psychiatry 159: 1929–1932. [DOI] [PubMed] [Google Scholar]
- Alexopoulos GS, Murphy CF, Gunning‐Dixon FM, Latoussakis V, Kanellopoulos D, Klimstra S, Lim KO, Hoptman MJ ( 2008): Microstructural white matter abnormalities and remission of geriatric depression. Am J Psychiatry 165: 238–244. [DOI] [PubMed] [Google Scholar]
- Andersson JLR, Jenkinson M, Smith SM ( 2007a): Non‐linear optimisation. FMRIB technical report TR07JA1. Available at: http://www.fmrib.ox.ac.uk/analysis/techrep. Accessed February 1, 2010.
- Andersson JLR, Jenkinson M, Smith SM ( 2007b): Non‐linear registration, aka Spatial normalisation. FMRIB technical report TR07JA2. Available at: http://www.fmrib.ox.ac.uk/analysis/techrep. Accessed February 1, 2010.
- Ashburner J, Friston KJ ( 2000): Voxel‐based morphometry—The methods. Neuroimage 11: 805–821. [DOI] [PubMed] [Google Scholar]
- Bae JN, MacFall JR, Krishnan KR, Payne ME, Steffens DC, Taylor WD ( 2006): Dorsolateral prefrontal cortex and anterior cingulate cortex white matter alterations in late‐life depression. Biol Psychiatry 60: 1356–1363. [DOI] [PubMed] [Google Scholar]
- Basser PJ, Mattiello J, LeBihan D ( 1994): Estimation of the effective self‐diffusion tensor from the NMR spin echo. J Magn Reson B 103: 247–254. [DOI] [PubMed] [Google Scholar]
- Behrens TE, Woolrich MW, Jenkinson M, Johansen‐Berg H, Nunes RG, Clare S, Matthews PM, Brady JM, Smith SM ( 2003): Characterization and propagation of uncertainty in diffusion‐weighted MR imaging. Magn Reson Med 50: 1077–1088. [DOI] [PubMed] [Google Scholar]
- Bennett IJ, Madden DJ, Vaidya CJ, Howard DV, Howard JH Jr ( 2010): Age‐related differences in multiple measures of white matter integrity: A diffusion tensor imaging study of healthy aging. Hum Brain Mapp 31: 378–390. [DOI] [PMC free article] [PubMed] [Google Scholar]
- Dannlowski U, Ohrmann P, Konrad C, Domschke K, Bauer J, Kugel H, Hohoff C, Schoning S, Kersting A, Baune BT, Mortensen LS, Arolt V, Zwitserlood P, Deckert J, Heindel W, Suslow T ( 2009): Reduced amygdala‐prefrontal coupling in major depression: Association with MAOA genotype and illness severity. Int J Neuropsychopharmacol 12: 11–22. [DOI] [PubMed] [Google Scholar]
- Drevets WC ( 2000): Functional anatomical abnormalities in limbic and prefrontal cortical structures in major depression. Prog Brain Res 126: 413–431. [DOI] [PubMed] [Google Scholar]
- Drevets WC, Price JL, Furey ML ( 2008): Brain structural and functional abnormalities in mood disorders: Implications for neurocircuitry models of depression. Brain Struct Funct 213: 93–118. [DOI] [PMC free article] [PubMed] [Google Scholar]
- Dubois J, Dehaene‐Lambertz G, Soares C, Cointepas Y, Le Bihan D, Hertz‐Pannier L ( 2008): Microstructural correlates of infant functional development: Example of the visual pathways. J Neurosci 28: 1943–1948. [DOI] [PMC free article] [PubMed] [Google Scholar]
- Frodl TS, Koutsouleris N, Bottlender R, Born C, Jager M, Scupin I, Reiser M, Moller HJ, Meisenzahl EM ( 2008): Depression‐related variation in brain morphology over 3 years: Effects of stress? Arch Gen Psychiatry 65: 1156–1165. [DOI] [PubMed] [Google Scholar]
- Gatt JM, Nemeroff CB, Dobson‐Stone C, Paul RH, Bryant RA, Schofield PR, Gordon E, Kemp AH, Williams LM ( 2009): Interactions between BDNF Val66Met polymorphism and early life stress predict brain and arousal pathways to syndromal depression and anxiety. Mol Psychiatry 14: 681–695. [DOI] [PubMed] [Google Scholar]
- Goldapple K, Segal Z, Garson C, Lau M, Bieling P, Kennedy S, Mayberg H ( 2004): Modulation of cortical‐limbic pathways in major depression: Treatment‐specific effects of cognitive behavior therapy. Arch Gen Psychiatry 61: 34–41. [DOI] [PubMed] [Google Scholar]
- Greenberg PE, Stiglin LE, Finkelstein SN, Berndt ER ( 1993): The economic burden of depression in 1990. J Clin Psychiatry 54: 405–418. [PubMed] [Google Scholar]
- Grieve SM, Clark CR, Williams LM, Peduto AJ, Gordon E ( 2005): Preservation of limbic and paralimbic structures in aging. Hum Brain Mapp 25: 391–401. [DOI] [PMC free article] [PubMed] [Google Scholar]
- Grieve SM, Williams LM, Paul RH, Clark CR, Gordon E ( 2007): Cognitive aging, executive function, and fractional anisotropy: A diffusion tensor MR imaging study. AJNR Am J Neuroradiol 28: 226–235. [PMC free article] [PubMed] [Google Scholar]
- Haber SN, Calzavara R ( 2009): The cortico‐basal ganglia integrative network: The role of the thalamus. Brain Res Bull 78: 69–74. [DOI] [PMC free article] [PubMed] [Google Scholar]
- Hamilton M ( 1960): A rating scale for depression. J Neurol Neurosurg Psychiatry 23: 56–61. [DOI] [PMC free article] [PubMed] [Google Scholar]
- Hickie I, Scott E, Wilhelm K, Brodaty H ( 1997): Subcortical hyperintensities on magnetic resonance imaging in patients with severe depression—A longitudinal evaluation. Biol Psychiatry 42: 367–374. [DOI] [PubMed] [Google Scholar]
- Hooley JM, Gruber SA, Parker HA, Guillaumot J, Rogowska J, Yurgelun‐Todd DA ( 2009): Cortico‐limbic response to personally challenging emotional stimuli after complete recovery from depression. Psychiatry Res 171: 106–119. [DOI] [PubMed] [Google Scholar]
- Johnstone T, van Reekum CM, Urry HL, Kalin NH, Davidson RJ ( 2007): Failure to regulate: Counterproductive recruitment of top‐down prefrontal‐subcortical circuitry in major depression. J Neurosci 27: 8877–8884. [DOI] [PMC free article] [PubMed] [Google Scholar]
- Kennedy SH, Evans KR, Kruger S, Mayberg HS, Meyer JH, McCann S, Arifuzzman AI, Houle S, Vaccarino FJ ( 2001): Changes in regional brain glucose metabolism measured with positron emission tomography after paroxetine treatment of major depression. Am J Psychiatry 158: 899–905. [DOI] [PubMed] [Google Scholar]
- Kessler RC, Berglund P, Demler O, Jin R, Koretz D, Merikangas KR, Rush AJ, Walters EE, Wang PS ( 2003): National Comorbidity Survey Replication. The epidemiology of major depressive disorder: Results from the National Comorbidity Survey Replication (NCS‐R). JAMA 289: 3095–3105. [DOI] [PubMed] [Google Scholar]
- Kieseppa T, Eerola M, Mantyla R, Neuvonen T, Poutanen VP, Luoma K, Tuulio‐Henriksson A, Jylha P, Mantere O, Melartin T, Rytsala H, Vuorilehto M, Isometsa E ( 2010): Major depressive disorder and white matter abnormalities: A diffusion tensor imaging study with tract‐based spatial statistics. J Affect Disord 120: 240–244. [DOI] [PubMed] [Google Scholar]
- Kito S, Fujita K, Koga Y ( 2008): Regional cerebral blood flow changes after low‐frequency transcranial magnetic stimulation of the right dorsolateral prefrontal cortex in treatment‐resistant depression. Neuropsychobiology 58: 29–36. [DOI] [PubMed] [Google Scholar]
- Koenigs M, Grafman J ( 2009): The functional neuroanatomy of depression: Distinct roles for ventromedial and dorsolateral prefrontal cortex. Behav Brain Res 201: 239–243. [DOI] [PMC free article] [PubMed] [Google Scholar]
- Kronmuller KT, Schroder J, Kohler S, Gotz B, Victor D, Unger J, Giesel F, Magnotta V, Mundt C, Essig M, Pantel J ( 2009): Hippocampal volume in first episode and recurrent depression. Psychiatry Res 174: 62–66. [DOI] [PubMed] [Google Scholar]
- Lafer B, Renshaw PF, Sachs GS ( 1997): Major depression and the basal ganglia. Psychiatr Clin North Am 20: 885–896. [DOI] [PubMed] [Google Scholar]
- Li L, Ma N, Li Z, Tan L, Liu J, Gong G, Shu N, He Z, Jiang T, Xu L ( 2007): Prefrontal white matter abnormalities in young adult with major depressive disorder: A diffusion tensor imaging study. Brain Res 1168: 124–128. [DOI] [PubMed] [Google Scholar]
- Ma N, Li L, Shu N, Liu J, Gong G, He Z, Li Z, Tan L, Stone WS, Zhang Z, Xu L, Jiang T ( 2007): White matter abnormalities in first‐episode, treatment‐naive young adults with major depressive disorder. Am J Psychiatry 164: 823–826. [DOI] [PubMed] [Google Scholar]
- MacQueen GM, Campbell S, McEwen BS, Macdonald K, Amano S, Joffe RT, Nahmias C, Young LT ( 2003): Course of illness, hippocampal function, and hippocampal volume in major depression. Proc Natl Acad Sci U S A 100: 1387–1392. [DOI] [PMC free article] [PubMed] [Google Scholar]
- Makris N, Kennedy DN, McInerney S, Sorensen AG, Wang R, Caviness VS Jr, Pandya DN ( 2005): Segmentation of subcomponents within the superior longitudinal fascicle in humans: A quantitative, in vivo, DT‐MRI study. Cereb Cortex 15: 854–869. [DOI] [PubMed] [Google Scholar]
- McGrath PJ, Khan AY, Trivedi MH, Stewart JW, Morris DW, Wisniewski SR, Miyahara S, Nierenberg AA, Fava M, Rush JA ( 2008): Response to a selective serotonin reuptake inhibitor (citalopram) in major depressive disorder with melancholic features: A STAR*D report. J Clin Psychiatry 69: 1847–1855. [DOI] [PubMed] [Google Scholar]
- Mori S, Oishi K, Jiang H, Jiang L, Li X, Akhter K, Hua K, Faria AV, Mahmood A, Woods R, Toga AW, Pike GB, Neto PR, Evans A, Zhang J, Huang H, Miller MI, van Zijl P, Mazziotta J ( 2008): Stereotaxic white matter atlas based on diffusion tensor imaging in an ICBM template. Neuroimage 40: 570–582. [DOI] [PMC free article] [PubMed] [Google Scholar]
- Nobuhara K, Okugawa G, Sugimoto T, Minami T, Tamagaki C, Takase K, Saito Y, Sawada S, Kinoshita T ( 2006): Frontal white matter anisotropy and symptom severity of late‐life depression: A magnetic resonance diffusion tensor imaging study. J Neurol Neurosurg Psychiatry 77: 120–122. [DOI] [PMC free article] [PubMed] [Google Scholar]
- Parker G, Hadzi‐Pavlovic D ( 1996): Melancholia: A Disorder of Movement and Mood. New York: Cambridge University Press. [Google Scholar]
- Pizzagalli DA, Holmes AJ, Dillon DG, Goetz EL, Birk JL, Bogdan R, Dougherty DD, Iosifescu DV, Rauch SL, Fava M ( 2009): Reduced caudate and nucleus accumbens response to rewards in unmedicated individuals with major depressive disorder. Am J Psychiatry 166: 702–710. [DOI] [PMC free article] [PubMed] [Google Scholar]
- Rush AJ ( 2007): The varied clinical presentations of major depressive disorder. J Clin Psychiatry 68( Suppl 8): 4–10. [PubMed] [Google Scholar]
- Sheehan DV, Lecrubier Y, Harnett‐Sheehan K, Janavs J, Weiller E, Keskiner A, Schinka J, Knapp E, Sheehan MF, Dunbar GC ( 1997): Reliability and validity of the MINI International Neuropsychiatric Interview (M.I.N.I.): According to the SCID‐P. Eur Psychiatry 12: 232–241. [Google Scholar]
- Sheehan DV, Lecrubier Y, Sheehan KH, Amorim P, Janavs J, Weiller E, Hergueta T, Baker R, Dunbar GC ( 1998): The Mini‐International Neuropsychiatric Interview (M.I.N.I.): The development and validation of a structured diagnostic psychiatric interview for DSM‐IV and ICD‐10. J Clin Psychiatry 59( Suppl 20): 22–33. [PubMed] [Google Scholar]
- Shimony JS, Sheline YI, D'Angelo G, Epstein AA, Benzinger TL, Mintun MA, McKinstry RC, Snyder AZ ( 2009): Diffuse microstructural abnormalities of normal‐appearing white matter in late life depression: A diffusion tensor imaging study. Biol Psychiatry 66: 245–252. [DOI] [PMC free article] [PubMed] [Google Scholar]
- Smith SM, Nichols TE ( 2009): Threshold‐free cluster enhancement: Addressing problems of smoothing, threshold dependence and localisation in cluster inference. Neuroimage 44: 83–98. [DOI] [PubMed] [Google Scholar]
- Smith SM, Jenkinson M, Woolrich MW, Beckmann CF, Behrens TE, Johansen‐Berg H, Bannister PR, De Luca M, Drobnjak I, Flitney DE, Niazy RK, Saunders J, Vickers J, Zhang Y, De Stefano N, Brady JM, Matthews PM ( 2004): Advances in functional and structural MR image analysis and implementation as FSL. Neuroimage 23( Suppl 1): S208–S219. [DOI] [PubMed] [Google Scholar]
- Smith SM, Jenkinson M, Johansen‐Berg H, Rueckert D, Nichols TE, Mackay CE, Watkins KE, Ciccarelli O, Cader MZ, Matthews PM, Behrens TE ( 2006): Tract‐based spatial statistics: Voxelwise analysis of multi‐subject diffusion data. Neuroimage 31: 1487–1505. [DOI] [PubMed] [Google Scholar]
- Song SK, Sun SW, Ramsbottom MJ, Chang C, Russell J, Cross AH ( 2002): Dysmyelination revealed through MRI as increased radial (but unchanged axial) diffusion of water. Neuroimage 17: 1429–1436. [DOI] [PubMed] [Google Scholar]
- Song SK, Sun SW, Ju WK, Lin SJ, Cross AH, Neufeld AH ( 2003): Diffusion tensor imaging detects and differentiates axon and myelin degeneration in mouse optic nerve after retinal ischemia. Neuroimage 20: 1714–1722. [DOI] [PubMed] [Google Scholar]
- Steele JD, Bastin ME, Wardlaw JM, Ebmeier KP ( 2005): Possible structural abnormality of the brainstem in unipolar depressive illness: A transcranial ultrasound and diffusion tensor magnetic resonance imaging study. J Neurol Neurosurg Psychiatry 76: 1510–1515. [DOI] [PMC free article] [PubMed] [Google Scholar]
- Stewart JW, McGrath PJ, Quitkin FM, Klein DF ( 2007): Atypical depression: Current status and relevance to melancholia. Acta Psychiatr Scand Suppl 115: 58–71. [DOI] [PubMed] [Google Scholar]
- Taber KH, Wen C, Khan A, Hurley RA ( 2004): The limbic thalamus. J Neuropsychiatry Clin Neurosci 16: 127–132. [DOI] [PubMed] [Google Scholar]
- Taylor WD, MacFall JR, Payne ME, McQuoid DR, Provenzale JM, Steffens DC, Krishnan KR ( 2004): Late‐life depression and microstructural abnormalities in dorsolateral prefrontal cortex white matter. Am J Psychiatry 161: 1293–1296. [DOI] [PubMed] [Google Scholar]
- Yang Q, Huang X, Hong N, Yu X ( 2007): White matter microstructural abnormalities in late‐life depression. Int Psychogeriatr 19: 757–766. [DOI] [PubMed] [Google Scholar]
- Yuan W, Mangano FT, Air EL, Holland SK, Jones BV, Altaye M, Bierbrauer K ( 2009): Anisotropic diffusion properties in infants with hydrocephalus: A diffusion tensor imaging study. AJNR Am J Neuroradiol 30: 1792–1798. [DOI] [PMC free article] [PubMed] [Google Scholar]
- Zou K, Huang X, Li T, Gong Q, Li Z, Ou‐Yang L, Deng W, Chen Q, Li C, Ding Y, Sun X ( 2008): Alterations of white matter integrity in adults with major depressive disorder: A magnetic resonance imaging study. J Psychiatry Neurosci 33: 525–530. [PMC free article] [PubMed] [Google Scholar]