

Abstract
Mild traumatic brain injury (mTBI) can induce long‐term behavioral and cognitive disorders. Although the exact origin of these mTBI‐related disorders is not known, they may be the consequence of diffuse axonal injury (DAI). Here, we investigated whether MRI at the subacute stage can detect lesions that are associated with poor functional outcome in mTBI by using anatomical images (T1) and diffusion tensor imaging (DTI). Twenty‐three patients with mTBI were investigated and compared with 23 healthy volunteers. All patients underwent an MRI investigation and clinical tests between 7 and 28 days (D15) and between 3 and 4 months (M3) after injury. Patients were divided in two groups of poor outcome (PO) and good outcome (GO), based on their complaints at M3. Groupwise differences in gray matter partial volume between PO patients, GO patients and controls were analyzed using Voxel‐Based Morphometry (VBM) from T1 data at D15. Differences in microstructural architecture were investigated using Tract‐Based Spatial Statistics (TBSS) and the diffusion images obtained from DTI data at D15. Permutation‐based non‐parametric testing was used to assess cluster significance at p < 0.05, corrected for multiple comparisons. Twelve GO patients and 11 PO patients were identified on the basis of their complaints. In PO patients, gray matter partial volume was significantly lower in several cortical and subcortical regions compared with controls, but did not differ from that of GO patients. No difference in diffusion variables was found between GO and controls. PO patients showed significantly higher mean diffusivity values than both controls and GO patients in the corpus callosum, the right anterior thalamic radiations and the superior longitudinal fasciculus, the inferior longitudinal fasciculus and the fronto‐occipital fasciculus bilaterally. In conclusion, PO patients differed from GO patients by the presence of diffusion changes in long association white matter fiber tracts but not by gray matter partial volume. These results suggest that DTI at the subacute stage may be a predictive marker of poor outcome in mTBI. Hum Brain Mapp, 2011. © 2010 Wiley‐Liss, Inc.
Keywords: mild traumatic brain injury, diffusion tensor imaging, post‐commotional syndrome, outcome, voxel‐based morphometry, tract‐based spatial statistics
INTRODUCTION
Approximately 57 million people suffer from Traumatic Brain Injury (TBI) worldwide. Mild Traumatic Brain Injury (mTBI), which represents about 80% of all TBI types [Langlois et al.,2006], can induce long‐term functional disorders [Binder,1986; Bohnen and Jolles,1992; Carroll et al.,2004; Iverson,2005; Mittenberg and Strauman,2000; Ponsford et al.,2000]. For these reasons, mTBI is considered as a public health problem [Ragnarsson,2002]. Following mTBI, patients may present a post‐commotional syndrome (PCS), which is characterized by the presence of complaints in the behavioral, cognitive, and somatic domains [Rimel et al.,1981] and generally resolves between 3 and 12 months after the injury [Bohnen and Jolles,1992; Carroll et al.,2004; Dikmen et al.,1986; Hugenholtz et al.,1988; Stuss et al.,1989; van der Naalt et al.,1999]. Complaints are relatively numerous and often stereotyped. When the symptoms persist beyond three months, the syndrome is called persistent PCS [Begaz et al.,2006; Stålnacke et al.,2005; Willer and Leddy,2006]. Approximately 15% of PCS patients will present persistent PCS characterized by the persistence or the worsening of the complaints [Binder et al.,1997; Binder,1986; Bohnen and Jolles,1992; Dikmen et al.,1986; Iverson,2005; Mittenberg and Strauman,2000; Ponsford et al.,2000; Rutherford,1977; Wood,2004]. In some cases, neurobehavioral disorders may persist several years [Binder et al.,1997; Binder,1986; Bohnen and Jolles,1992]. Persistent PCS is often poorly recognized, leading to a lack of early and appropriate care although this condition may result in serious social and professional consequences [Drake et al.,2001; Elgmark et al.,2007]. Neurobehavioral disorders that are associated with persistent PCS include impaired working memory, executive functions, attention, set shifting, and planning abilities as well as reduced speed of mental processing [Belanger et al.,2005; Chan,2005; Lundin et al.,2006; Stablum et al.,1996; Stulemeijer et al.,2005; Vanderploeg et al.,2005].
Brain lesions associated with persistent PCS are not well characterized. Persistent PCS may be the consequence of direct brain trauma or can result from more diffuse axonal injury (DAI) within white matter fiber bundles [Tagliaferri et al.,2006]. DAI can be secondary to the traumatic impact or to ischemia. Brain movements against the skull and dura matter result in stretching and distortions rather than breaking of the axons [Gennareli and Graham,1998; Smith et al.,2003]. DAI has been evidenced in pathological studies as well as using neuroimaging [Aihara et al.,1995; Blumbergs et al.,1994; Blumbergs et al.,1995; Gennarelli,1996; Goodman,1994; Inglese et al.,2005; Mittl et al.,1994]. Conventional T1‐weighted brain imaging has not contributed to the understanding of persistent PCS as most often it shows no brain abnormalities and does not detect DAI [Adams et al.,1982; Adams et al.,1991; Bazarian et al.,2007; Fork et al.,2005; Medana and Esiri,2003; Nakayama et al.,2006; Parizel et al.,2005; Scheid et al.,2006]. Diffusion tensor imaging (DTI), which describes the amount of water diffusion in biological tissues, provides information on brain white matter and is therefore a promising tool to study DAI [Arfanakis et al.,2002; Huisman et al.,2004; Inglese et al.,2005; Kraus et al.,2007; Nakayama et al.,2006; Parizel et al.,2005; Ptak et al.,2003; Rutgers et al.,2008]. DTI provides quantitative markers of white matter lesions and an extensive description of water diffusion. Diffusion scalars derived from the tensor model, such as fractional anisotropy (FA), mean diffusivity (MD), or directional diffusivity (axial and radial) describe microstructural anatomy and integrity of white matter fibers pathways [Pierpaoli and Basser,1996]. Such measurements have been associated with the extent of damage following TBI [Inglese et al.,2005; Le et al.,2005; Ptak et al.,2003; Song et al.,2003; Xu et al.,2007] as well as mTBI [Arfanakis et al.,2002; Inglese et al.,2005; Niogi et al.,2008; Rutgers et al.,2008]. DTI also allows reconstructing white matter fiber bundles in three dimensions (3D) using fiber tracking algorithms [Basser et al.,2000; Mori and Zhang,2006], with some recent applications in TBI [Le et al.,2005; Wang et al.,2008]. The results of these studies remain controversial, with no common findings probably due to the variety of damages and their evolution with time [Arfanakis et al.,2002; Le et al.,2005]. Moreover, the investigations were mainly conducted using a region of interest (ROI) approach, which implied a priori localization of mTBI‐related lesions. In addition, it is unclear whether areas of decreased FA in mTBI correspond to fiber stretching, distortion or disruption.
In this study, we investigated whether MRI using DTI in the subacute stage can detect lesions that are associated with persistent PCS in mTBI patients. Brain structural and microstructural changes were assessed using anatomical and diffusion imaging and compared with clinical outcome. We tested the hypothesis that patients with mTBI and persistent PCS have widespread brain white matter lesions that can be detected in the subacute stage using DTI and that involve a variety of fiber bundles associated with cognitive, somatic, and behavioral processes.
MATERIALS AND METHODS
Participants
This study was prospective, multi‐site, open and longitudinal. Subjects were recruited in the emergency departments of three hospitals in Kremlin‐Bicêtre, Nantes and Lille, France. A total of 55 patients with mild TBI participated in the study (age range, 18–65 years). The study was approved by the local Ethics Committee, and informed consent was obtained for all subjects. Inclusion criteria of mTBI were defined according to the mTBI Committee of the Head Injury Interdisciplinary Special Interest Group of the American Congress of Rehabilitation Medicine [Kay et al.,1993]. Trauma‐induced physiological disruption of brain function manifested by at least one of the following signs: loss of consciousness (of less than 30 min; Glasgow Coma Scale (GCS) score between 13 and 15) and/or post‐traumatic amnesia less than 24 h and/or any alteration in mental state at the time of the injury (confusion, disorientation...), and/or focal neurological deficit possibly transient. Additionally, noninclusion criteria of mTBI were defined as: history of chronic alcohol or drug abuse, previous TBI, contraindications to MRI, intubation and/or presence of a skull fracture and administration of sedatives on arrival in the emergency department, spinal cord injury, neurological signs or multiple disabilities (including at least one life‐threatening injury associated), head injury following autolysis, patients with psychiatric or psychological disabilities that may interfere with the monitoring and/or evaluation, psychotropic medication at the time of TBI, history of hospitalization especially in psychiatry and/or arrest for psychological reasons, pre‐existing neurological condition. Exclusion criteria were the presence of a major depressive syndrome according to the [DSM‐IV,1994], or patients not participating fully in the procedure (see next section). Of the 55 examined patients, 3 were excluded for major depressive syndrome and 29 did not participate in the late phase investigation, resulting in a total of 23 patients who fulfilled all inclusion criteria and were finally included (men/women, 17/6; mean age ± SD, 30.6 ± 8.6 years). Head injury was mainly caused by motor vehicle accident, pedestrian injury and aggressions. Twenty‐three healthy volunteers with no known history or MRI evidence of central nervous system disease, and no inclusion and exclusion criteria also participated in the study (men/women, 11/12; age, 30.0 ± 8.4 years) (Table I).
Table I.
Clinical Characteristics of the Controls and mTBI Patients
| Controls | GO patients | PO patients | |
|---|---|---|---|
| Number | 23 | 11 | 12 |
| Subjects per site | 5/12/6 | 2/4/6 | 2/5/4 |
| Age, mean (SD) | 30.0 (8.4) | 27.8 (8.5) | 31.3 (8.4) |
| Sex ratio (F/M) | 11/12 | 3/8 | 5/7 |
| SCL, mean (SD) | ‐ | 3.4 (1.3) | 4.0 (1.2) |
| Origins of injury | |||
| MVA | |||
| Car | ‐ | 1 | 2 |
| Motorbike | ‐ | 2 | 1 |
| Bicycle | ‐ | 0 | 1 |
| Pedestrian | ‐ | 1 | 3 |
| Falls | ‐ | 6 | 3 |
| Aggressions | ‐ | 1 | 2 |
F, female; GCS, Glasgow coma scale; GO, good outcome; M, male; MVA, motor vehicle accident; PO, poor outcome; SCL, socio‐cultural level; Subjects per site, number of subjects examined in each of the three sites.
Procedure
All patients underwent an MRI investigation and clinical tests between 7 and 28 days (D15, subacute phase, mean ± SD: 17.2 ± 7.2 days) and 3 to 4 months (M3, late phase) after injury. Volunteers had only one MRI investigation. PCS followed TBI by an average of four weeks, and was not associated with any other neurological disorder [Gillum and Bosworth,2002]. Persistent PCS was evaluated using a complaint questionnaire adapted from [Gillum and Bosworth,2002]. The questionnaire was performed at three months post‐injury and included assessment of three categories of symptoms (Table II): behavioral and emotional disorders (irritability, anxiety, depression, and emotional labiality), subjective cognitive impairment (concentration, memory, processing speed, and divided attention) and somatic complaint (headache, fatigue, dizziness, noise intolerance). PCS was defined by the presence of at least one complaint in each of the three domains of the questionnaire. Patients were divided in two groups with good and poor functional outcome based on the presence or absence of persistent PCS. Patients with no persistent PCS were considered as having a good functional outcome (GO) while patients with persistent PCS were considered as having a poor functional outcome (PO).
Table II.
Description of the Complaint Questionnaire
| Behavioral and emotional disorders | Irritability, anxiety |
| Loss of initiative and motivation | |
| Reduced spontaneous activity | |
| Increased periods of inactivity | |
| Reduced self control | |
| Feeling depressed or tearful | |
| Being irritable, easily angered | |
| Subjective cognitive impairment | Slowness |
| Forgetfulness, poor memory | |
| Poor concentration | |
| Difficulty to make two things at the same time | |
| Difficulty to perform two tasks successively | |
| Somatic complaints | Headaches |
| Dizziness | |
| Noise sensitivity | |
| Sleep disturbance | |
| Fatigue, being easily tired |
A variety of psychological and neuropsychological tests were used to evaluate the emotional, cognitive, and somatic disorders. Tests were selected from previously published articles in patients with mTBI. Neuropsychological tests were administered to evaluate short‐term memory, working memory, reactive flexibility, inhibitory control, and attention. This assessment included the following tests: forward and backward digit spans of the Wechsler Memory Scale, 3rd edition (WMS III), the trail making test B (TMT B), the number/letter sequence of WMS III, the board Stroop test [Stroop,1935], the verbal fluency (categorical with animals and phonemic with the letter “m”) released at 1 min, the dual task of Baddeley [Baddeley,1986]. Evaluation of emotional states was assessed using psychological and psychopathological tests: a test of overall quality of life (EVA), and the hospital anxiety depression scale (HADS). The somatic domain was evaluated using the visual analogue scale (VAS) of pain intensity for headaches and other pains [Scott and Huskisson,1979].
MRI Protocol
The MRI protocol consisted of an axial 3D T1 weighted acquisition (Field‐of‐View (FOV) 240 × 240 mm2; 66 slices with no gap; Repetition Time (TR)/Echo Time (TE) = 11/3.8 ms; flip angle 30°; image matrix 256 × 256; voxel size 0.94 × 0.94 × 1 mm3), an axial Fluid‐Attenuated Inversion Recovery (FLAIR) acquisition (FOV 181 × 210 mm2; 20 slices with 2‐mm gap; TR/TE/Inversion Time = 8,800/129/2,500 ms; image matrix 276 × 320; voxel size 0.66 × 0.66 × 5 mm3), an axial T2* weighted gradient‐echo acquisition (FOV 190 × 200 mm2; 20 slices with 1.5 mm gap; TR/TE, 830/33 ms; image matrix 448 × 512; voxel size 0.39 × 0.39 × 5 mm3) and an axial echo‐planar diffusion tensor imaging (DTI) acquisition (FOV 240 × 240 mm2; 32 4 mm thick sections (no gap); TR/TE = 5,300/110 ms; image matrix 128 × 128; voxel size 1.875 × 1.875 × 4 mm3; 3 averages; 26 noncollinear diffusion gradient directions; b = 1,000 s/mm2; one image with no diffusion weighting (b = 0 s/mm2) was also obtained). Images were acquired using 1.5 T scanners in each of the three hospitals. No statistical difference was found in the proportion of controls and patients scanned in each hospital (χ2 = 2.0; P = 0.73) (see Table I).
Statistical Analysis
Clinical scores
Parametric statistical inference was used. Z‐scores were calculated for each score between the two groups (GO and PO) and for the two assessments (D15 and M3) (Table III).
Table III.
Psychological and Neuropsychological Scores for All Groups (D15 and M3)
| Normative Values | D15 | M3 | ||||||
|---|---|---|---|---|---|---|---|---|
| GO mean (SD) | PO mean (SD) | GO vs. PO P‐value | GO mean (SD) | PO mean (SD) | GO vs. PO P‐value | |||
| Cognitive tests | Forward digit span | 7 (2) | 9.8 (2.2) | 8.9 (2.3) | 0.518 | 11.1 (2.3) | 9.0 (1.4) | 0.022* |
| Backward digit span | 6 (2) | 7.4 (2.1) | 5.7 (1.0) | 0.031* | 8.0 (2.9) | 6.3 (1.0) | 0.121 | |
| Trail Making Test B (Time score) | 60 (22) | 66.9 (17.7) | 109.3 (63.2) | 0.033* | 54.6 (15.7) | 77.5 (32.7) | 0.064 | |
| Letter and number sequence | 4 | 9.3 (3.3) | 9.0 (2.4) | 0.877 | 11.7 (2.9) | 8.5 (2.3) | 0.017* | |
| Word Stroop test | 40 | 49.0 (8.2) | 44.4 (10.5) | 0.388 | 51.6 (7.7) | 49.0 (7.2) | 0.428 | |
| Color Stroop Test | 40 | 51.6 (4.6) | 48.1 (7.4) | 0.207 | 56.1 (5.1) | 52.8 (10.1) | 0.322 | |
| Word/Color Stroop Test | 40 | 53.9 (8.1) | 51.7 (10.3) | 0.689 | 63.0 (8.3) | 52.1 (9.7) | 0.019* | |
| Categorical verbal fluency “Animals” | 22 (5) | 21.6 (5.9) | 19.2 (6.5) | 0.479 | 22.8 (7.2) | 21.0 (3.8) | 0.817 | |
| Phonemic verbal fluency “M” | 15.5 (5.3) | 11.6 (4.7) | 11.4 (4.4) | 0.829 | 14.0 (5.0) | 14.4 (3.8) | 0.973 | |
| Crossing box task (Baddeley) “Mu” score | 91.4 (13.2) | 93.6 (20.7) | 95.4 (20.6) | 0.877 | 84.2 (18.1) | 90.8 (15.2) | 0.644 | |
| Emotional scales | HADS Anxiety | X | 5.4 (3.6) | 7.3 (3.4) | 0.109 | 1.3 (1.0) | 8.0 (2.5) | <0.001** |
| HADS Depression | X | 4.9 (3.7) | 4.2 (2.4) | 0.781 | 4.8 (1.3) | 4.8 (1.9) | 0.817 | |
| Somatic scales | Headache | X | 1.5 (1.6) | 1.9 (2.5) | 1.000 | 1.6 (1.5) | 2.5 (2.6) | 0.716 |
| Other pains | X | 1.2 (1.9) | 3.2 (2.6) | 0.295 | 0.0 (0.0) | 3.7 (3.1) | 0.008** | |
| Global quality of life score | X | 6.8 (1.7) | 6.1 (2.4) | 0.309 | 7.8 (0.8) | 6.3 (1.8) | <0.001** | |
| Complaints | X | 4.3 (3.7) | 8.8 (3.5) | 0.009** | 0.0 (0.0) | 10.9 (3.3) | <0.001** | |
P values are corrected for multiple comparisons (*P < 0.05; **P < 0.01). X corresponds to no available data.
MRI preprocessing
All images were transferred to an offline workstation for processing.
First, the brain was extracted from structural 3D T1‐weighted images using Brain Extraction Tool (BET) [Smith,2002], which is part of the FMRIB Software Library (FSL 4.1, http://www.fmrib.ox.ac.uk/fsl/) [Smith et al.,2004]. To account for possible bias induced by the multisite nature of the study, 3D‐T1 image histograms were normalized with a histogram matching algorithm, which is a generalization of histogram equalization [Li et al., 2010]. The histogram matching operation reduced multisite effects by enhancing image contrast, and consequently improved the following steps of the tissue segmentation.
Microstructural images (DTI) were corrected for Eddy current distortions and head motion using linear image registration, which relies on the maximization of mutual information [Mangin et al.,2001]. Then, brain masks were extracted from each subject in four steps: thresholding of unweighted diffusion image; erosion of the thresholded image; selection of the largest connected component; and finally dilation of these components. Voxel intensities of the DTI images were then fitted to obtain the six elements of the symmetric diffusion tensor using a least‐squares approach, followed by a median filtering to remove some ill‐conditioned tensors. The diffusion tensors of each voxel were diagonalized to obtain eigenvalues and eigenvectors, and the FA, the MD and the axial and radial diffusivity maps were computed. DTI image preprocessing was performed using the BrainVISA software (http://brainvisa.info) accompanied by the in‐house OdysseeToolbox [Lenglet et al.,2009].
Voxel‐based morphometry
Structural images
Structural data were analyzed with FSL‐VBM, a voxel‐based morphometry analysis [Ashburner and Friston,2000; Good et al.,2001] which is part of the FSL software [Smith et al.,2004]. First, tissue segmentation was carried out using FMRIB's Automatic Segmentation Tool (FAST) [Zhang et al.,2001] from brain extracted images. The resulting gray matter partial volume maps were then aligned to the Montreal Neurological Institute standard space (MNI152) using the nonlinear registration approach of the Image Registration ToolKit (IRTK, http://www.doc.ic.ac.uk/~dr/software) [Rueckert et al.,1999]. The registered partial volume maps were then modulated (to correct for local expansion or contraction) by dividing them by the Jacobian of the warp field. The modulated images were then smoothed with an isotropic Gaussian kernel with a standard deviation of 4 mm (FWHM ≈ 7 mm). Finally, a voxelwise general linear model (GLM) was applied and permutation‐based non‐parametric testing was used to form clusters with the Threshold‐Free Cluster Enhancement (TFCE) method [Smith and Nichols,2009], tested for significance at P < 0.05, corrected for multiple comparisons across space.
Microstructural images
Tract‐Based Spatial Statistics (TBSS) [Smith et al.,2006] from FSL were used to perform a skeleton‐based analysis of white matter FA. FA maps of each individual subject were coregistered using nonlinear registration IRTK [Rueckert et al.,1999] to the MNI standard space using the FMRIB58_FA template, which is available as part of the FSL software. The template was subsampled at 2 × 2 × 2 mm3 due to the coarse resolution of native DTI data (i.e. 2 × 2 × 4 mm3). After image registration, FA maps were averaged to produce a group mean FA image. A skeletonization algorithm was applied to the group mean FA image to define a group template of the lines of maximum FA, assumed to correspond to centers of white matter tracts. FA values for each individual subject were then projected onto this group template skeleton. Voxelwise analyses of FA across the group of subjects were performed only on data projected onto the skeleton template, using a GLM as for the structural images. For MD, axial and radial diffusivity maps, values for each individual subject were projected onto the group template skeleton given previously by FA maps and voxelwise statistical analyses were performed only on projected data. The acquisition sites were included as confound factors in the GLM to reduce multisite influence. Clusters were tested for significance at P < 0.05, corrected for multiple comparisons across space using the TFCE approach.
Groupwise structural and microstructural differences were assessed using the following comparisons: GO patients versus controls, PO patients versus controls, and PO patients versus GO patients.
Predictive Accuracy of DTI‐Derived Biomarkers for the Clinical Outcome
The previous analysis allowed us to determine whether FA, MD, axial or radial diffusivity was the most discriminant biomarker between GO and PO patients and to identify the white matter tracts where the differences were the highest. We then tested the predictive accuracy of the most discriminant biomarker measured in the tracts for classifying patients into GO and PO groups by using linear discriminant analysis (LDA). The posterior probability that a patient belongs to a particular group was calculated by using a bootstrap crossvalidation procedure as follows [Perlbarg et al.,2009]: first, we randomly chose two test patients from each group (GO/PO); second, we computed the LDA function using the 19 remaining mTBI patients; third, we calculated the posterior probability that the four test patients belong to each group. This procedure was repeated 1,000 times. To evaluate the classification accuracy, we calculated the sensitivity and the specificity of the classification for the two groups according to the threshold of the posterior probability. We compared the results with two thresholds: P = 0.5 (all cases were classified) and P = 0.95 (only cases with a high level of confidence were classified). The sensitivity of the classification was defined as the ratio between the number of correctly classified PO patients and the total number of PO patients; the specificity was defined as the ratio between the correctly classified GO patients and the total number of GO patients.
RESULTS
Twelve GO patients and 11 PO patients were identified on the basis of their complaints at M3 (Tables I and II). No statistical difference was found between controls, PO patients, and GO patients for age and socio‐cultural level (SCL) (all P > 0.05, T‐test). No statistical difference was found between PO patients and GO patients for timeframe at D15 (P > 0.05, T‐test). Group means are presented for each test in Table III. At D15, the performance of PO patients differed significantly from that of GO patients for the backward digit span and the trail making test B (time score) (P < 0.05, T‐test), which are strongly associated with prefrontal function. The trend for all tests indicated that GO patients performed better than PO patients. At D15, the number of complaints differed significantly between the two groups. At M3, performances for the forward digit span, the letter and number sequence, and the Stroop test part word/color, tests which are commonly associated with frontal lobe and fronto‐parietal network function, differed significantly between GO and PO patients. At M3, anxiety, pain, quality of life, and complaints differed significantly between GO and PO patients, as pain and complaints were no longer present in GO patients.
Conventional FLAIR and gradient echo T2 images did not show any significant abnormalities in 7 out of 11 GO patients and 6 out of 12 PO patients, small isolated microbleeds in 3 PO patients, a small subdural hematoma of the tentorium cerebelli in 1 GO patient and cerebral contusion in 3 GO and 3 PO patients. There were no significant differences in the proportion of patients with normal examinations or cerebral contusion between the two groups (P = 0.73, Chi square Yates corrected).
Changes in gray matter partial volume assessed using FSL‐VBM are presented in Figure 1 and Table IV. In GO patients compared with controls, gray matter partial volume was significantly lower in the left orbito‐frontal cortex and the right inferior temporal gyrus (Fig. 1 upper row). The PO group compared with the control group showed lower gray matter partial volume in the inferior temporal cortex, the insula, and the cerebellum in the right hemisphere, the left orbitofrontal cortex, the ventrolateral prefrontal cortex bilaterally, and the caudate nucleus bilaterally (Fig. 1, middle row). The VBM analysis showed no statistical difference in gray matter partial volume in the GO group compared with the PO group (see Fig. 1).
Figure 1.
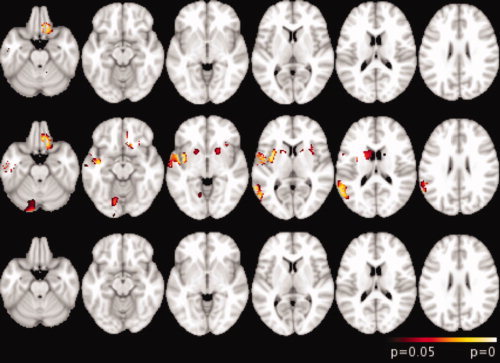
FSL‐VBM analysis results overlaid on axial views of the MNI152 template (neurological convention). Top row, GO patients versus controls; middle row, PO patients versus controls; bottom row, PO patients versus GO patients. Clusters were significant at P < 0.05, corrected for multiple comparisons.
Table IV.
Regions of significant gray matter decrease in mTBI patients when comparing PO patients with controls and GO patients with controls. Coordinates correspond to peak voxels in each cluster in the MNI space. Clusters are significant at p < 0.05, corrected for multiple comparisons
| Regions | Hemisphere | Brodmann area | MNI coordinates X,Y,Z (mm) | Cluster extent (voxel) | T score | ||
|---|---|---|---|---|---|---|---|
| PO compared with controls | |||||||
| Cortical areas | |||||||
| Ventrolateral prefrontal cortex | R | 45 | 49 | 22 | 14 | 99 | 3.53 |
| R | 47 | 49 | 21 | −1 | 9 | 3.90 | |
| L | 47 | −32 | 25 | −8 | 96 | 4.27 | |
| Orbitofrontal cortex | L | 11 | −16 | 33 | −23 | 297 | 4.57 |
| L | 11 | −18 | 28 | −18 | 87 | 4.00 | |
| Inferior temporal cortex | R | 37 | 55 | −47 | −4 | 517 | 4.11 |
| R | 20 | 49 | −1 | −4 | 462 | 3.85 | |
| Insula | R | 47 | 32 | 19 | −6 | 57 | 5.23 |
| Postcentral cortex | R | 4 | 58 | −4 | 36 | 343 | 4.98 |
| Angular cortex | R | 39 | 50 | −62 | 31 | 123 | 3.49 |
| Lingual cortex | R | 18 | 11 | −91 | −17 | 82 | 3.13 |
| Subcortical areas | |||||||
| Caudate nucleus | R | 16 | 19 | −4 | 237 | 3.69 | |
| L | −16 | 23 | −8 | 9 | 3.38 | ||
| Cerebellum | R | 14 | −71 | −28 | 302 | 3.08 | |
| GO compared with controls | |||||||
| Orbitofrontal cortex | L | 11 | −12 | 40 | −24 | 164 | 5.68 |
| Inferior temporal gyrus | R | 20 | 53 | 5 | −48 | 221 | 4.95 |
Brain diffusion changes assessed using TBSS are presented in Figures 2 and 3 and Table V. GO patients compared with controls had no MD abnormalities (Fig. 2 top row). On the other hand, higher MD values were observed in PO patients compared with both controls and GO patients, in the forceps major (FMaj) and minor (FMin) of the corpus callosum, the inferior fronto‐occipital fasciculus (IFF) bilaterally, and the inferior longitudinal fasciculus (ILF) bilaterally (middle and bottom rows in Figs. 2 and 3 and Table V). Moreover, PO patients showed higher MD values than controls in the superior longitudinal fasciculus and the corticospinal tract bilaterally, and the left anterior thalamic radiation (Fig. 2, middle row). No difference was found between groups when analyzing FA, axial and radial diffusivity maps.
Figure 2.
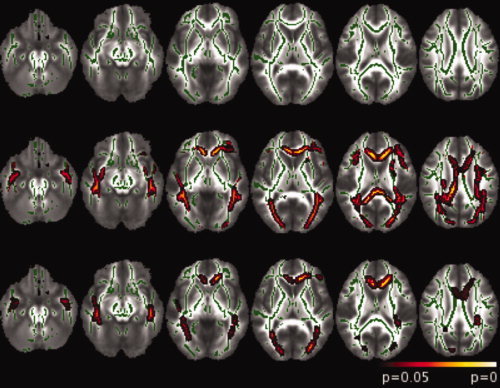
TBSS analysis results overlaid on axial views of the FA template (neurological convention). The skeleton is shown in green. Top row, GO patients versus controls; middle row, PO patients versus controls; bottom row, PO patients versus GO patients. Clusters were significant at P < 0.05, corrected for multiple comparisons.
Figure 3.
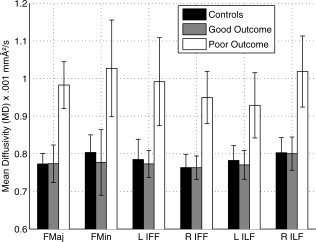
Mean and standard deviation of MD values in the six tracts of the TBSS results across the three groups.
Table V.
Tracts of Significant MD Increase in mTBI Patients When Comparing PO Patients With Controls and Go Patients
| Tracts | Hemisphere | PO compared with controls | PO compared with GO | ||
|---|---|---|---|---|---|
| Cluster extent (voxel) | P‐value | Cluster extent (voxel) | P‐value | ||
| Superior longitudinal fasciculus | R | 219 | 0.021 | ||
| L | 445 | 0.013 | |||
| Forceps minor | 369 | 0.006 | 186 | 0.011 | |
| Forceps major | 437 | 0.010 | 49 | 0.022 | |
| Anterior thalamic radiation | L | 127 | 0.021 | ||
| Corticospinal tract | R | 143 | 0.017 | ||
| L | 139 | 0.009 | |||
| Inferior fronto‐occipital fasciculus | R | 175 | 0.016 | 32 | 0.024 |
| L | 492 | 0.009 | 83 | 0.022 | |
| Inferior longitudinal fasciculus | R | 432 | 0.008 | 117 | 0.024 |
| L | 437 | 0.007 | 102 | 0.019 | |
Clusters are significant at P < 0.05, corrected for multiple comparisons.
TBSS analysis showed that six regions (FMaj, FMin, left and right ILF, and left and right IFF, see Fig. 2, bottom row) were the most discriminant between GO patients and PO patients in terms of MD value. We defined, for each mTBI patient and control, an index corresponding to the mean of the MD values in each of the six regions. The values of these indices across the three groups (controls, GO, and PO) were plotted in Figure 3. As expected, the indices were significantly (all P < 0.001, T‐test) higher for PO patients than for controls and GO patients whereas they did not differ between GO patients and controls (all P > 0.05, T‐test). The predictive accuracy of the six chosen parameters (the MD value means) was then tested by a bootstrap crossvalidation of the LDA classification. We distinguished two extreme cases depending on the threshold of the posterior probability used. In the PO/GO classification, the sensitivity and the specificity using MD values were 69 and 77%, respectively, for P = 0.50 (all cases were classified) and 34 and 89%, respectively, for P = 0.95 (see Fig. 4). In this last case, where only the patients with a high level of confidence were classified, the classification was highly specific but only half of the patients were classified. For the other half, no conclusion could be drawn.
Figure 4.
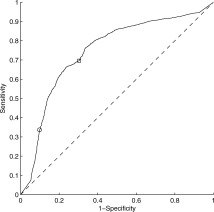
LDA classification using bootstrap crossvalidation. The ROC (receiver operating characteristic) curve represents the sensitivity as a function of 1‐specificity for various thresholds of the posterior probability P that a patient belongs to a class. The square corresponds to P = 0.5 and the circle to P = 0.95.
DISCUSSION
In this study, compared with GO patients, PO patients presented increased mean diffusivity in long association white matter fiber tracts but no changes in gray matter partial volume. GO subjects presented only few areas of decreased gray matter partial volume compared with control subjects, whereas gray matter partial volume was decreased in several areas in PO subjects compared with controls. However, gray matter partial volume did not differ between the PO and GO groups. In contrast, MD was significantly increased in the PO group compared with both controls and GO patients. These results suggest that damage to white matter fiber bundles may represent the main pathological substrate of PCS in mTBI, whereas gray matter lesions appear less important. Changes in diffusivity may be a consequence of DAI, which is the main neuropathological lesion observed in white matter.
Clinical Findings
Unfavorable outcome of PCS after mTBI remains difficult to predict at the subacute phase, whether clinically or using MRI. Here, we first classified mTBI patients based on complaints at three to four months after injury and we specifically investigated brain lesions associated with poor outcome in mTBI. In the literature, persistent PCS is characterized by complaints that persist beyond three months post injury and involve the somatic, cognitive, and behavioral domains [Belanger et al.,2005; Bohnen and Jolles,1992; Chan,2005; Evans,1992; Hinton‐Bayre et al.,1997; Levin et al.,1987; Lundin et al.,2006; McAllister,1992; Ponsford et al.,2000; Stablum et al.,1996; Stulemeijer et al.,2005; Vanderploeg et al.,2005]. Therefore in our study, the poor outcome group was defined on the basis of patients' complaints in each of these three domains. We observed that many mTBI patients presented long‐term functional disorders in the cognitive, emotional, and even somatic domains in line with previous studies [Evans,1992; McAllister,1992]. At M3, PO patients had scores significantly impaired in all three domains. In the subacute phase, PO patients also presented some degree of impairment although restricted to the cognitive domain (backward digit span and TMT B). Therefore, PO patients significantly differed from GO patients for cognitive tests that investigated working memory and mental flexibility, both at the subacute phase and remote stage. These results are in agreement with previous studies, which reported a significant impairment in cognitive functions in patients with PCS [Bohnen and Jolles,1992; Carroll et al.,2004; Dikmen et al.,1986; Goldstein et al.,1994; Hugenholtz et al.,1988; Levin et al.,1987; van der Naalt et al.,1999]. They also suggest that frontal lobe functions are predominantly impaired in PO patients and that this may help distinguishing PO from GO patients at the subacute stage.
Gray Matter Lesions
Several studies have investigated long‐term brain lesions associated with mild to severe TBI [Inglese et al.,2005; Kraus et al.,2007; Sidaros et al.,2008] but only few studies have investigated early brain abnormalities associated with mTBI and their relationships with functional outcome in these patients [Niogi et al.,2008]. To our knowledge only one study has investigated gray matter partial volume in mTBI about one year following the injury using voxel‐based morphometry [Gale et al.,2005]. The authors reported a decrease in gray matter partial volume in mTBI patients in the cerebral peduncle, the thalamus, the caudate nucleus, the cingulate cortex, and the frontal lobe. Another study has investigated longitudinally gray matter changes in TBI [Bendlin et al.,2008]. The authors showed atrophy in brain regions close to those found in our study. Moreover, conventional imaging was not sensitive enough to detect DAI, which affects white matter [Nakayama et al.,2006; Parizel et al.,2005; Scheid et al.,2006].
White Matter Lesions and Relation With DAI
The predominant involvement of white matter in patients with mTBI and persistent PCS suggests that persistent PCS may be primarily a consequence of DAI. Numerous previous studies have reported changes in the white matter of patients with TBI [Adams et al.,1991; McAllister,1992; Medana and Esiri,2003; Tagliaferri et al.,2006]. These studies have reported a variety of diffusion changes associated with DAI‐related lesions. White matter lesions involved the corpus callosum, the internal and external capsules, the corticospinal tract and several long association fasciculi such as the superior and inferior longitudinal fasciculus, and the cingulum [Arfanakis et al.,2002; Harsan et al.,2006; Huisman et al.,2004; Inglese et al.,2005; Kraus et al.,2007; Le et al.,2005; Nakayama et al.,2006; Niogi et al.,2008; Ptak et al.,2003; Rugg‐Gunn et al.,2001; Rutgers et al.,2008; Salmond et al.,2006; Song et al.,2002; Tisserand et al.,2006; Wang et al.,2008; Xu et al.,2007]. Diffusion changes in DAI were mainly characterized by reduced FA [Arfanakis et al.,2002; Huisman et al.,2004; Kraus et al.,2007; Wang et al.,2008] or/and increased MD [Bendlin et al.,2008; Huisman et al.,2004; Inglese et al.,2005; Nakayama et al.,2006; Niogi et al.,2008; Rugg‐Gunn et al.,2001; Rutgers et al.,2008]. Increases in axial and radial diffusivity have also been reported [Kraus et al.,2007]. Some studies have demonstrated that local microstructural properties of DAI varied between the subacute and long‐term phases, usually characterized by an early increase in MD after injury followed by a progressive decrease back to baseline values [Inglese et al.,2005; Le et al.,2005]. In Mac Donald et al. [2007], evolution of DAI was analyzed in a mouse model of TBI using DTI and histology. The authors showed, in the subacute stage, higher radial diffusivity and MD and lower FA, which they related to demyelination, macrophage infiltration, and edema. Moreover, diffusion changes varied with time. We therefore investigated mTBI at D15 after the injury assuming early changes in diffusion and a progressive recovery of microstructural architecture.
We found only MD changes following mTBI. Thus, MD appeared to be the most sensitive diffusion variable to measure the early impact of DAI following mTBI. One possible explanation for the lack of changes in FA may be that cell changes associated with decreased FA are delayed [Adams et al.,1991; Huisman et al.,2004; Mittl et al.,1994; Scheid et al.,2006]. Few studies have assessed the relationship between outcome and diffusion changes in the subacute phase in mTBI [Bigler,2004; Niogi et al.,2008]. Lesions of tracts similar to those reported here were found in a study including mTBI with PCS with an ROI‐based analysis [Niogi et al.,2008]. Bigler et al. [2004] observed in an mTBI patient with working memory deficits the presence of hemosiderin‐laden macrophages in the perivascular space and macrophages in the white matter particularly in the frontal lobe at autopsy [Bigler,2004]. These studies and others indicate that disruption of the parallel organization of tracts, loss of myelin, and increased axonal sheath permeability are plausible consequences of DAI [Bazarian et al.,2007; Gennareli and Graham,1998; Inglese et al.,2005; Povlishock and Katz,2005]. These may provide an explanation to the increased MD.
Diffusion abnormalities have also been related to cognitive dysfunction. In chronic severe TBI, reduced FA was related to scores in memory or executive functions [Nakayama et al.,2006]. In moderate and severe TBI, a relationship was reported between reduced FA and learning and memory scores [Salmond et al.,2006]. In patients with mild to severe TBI, reduced FA in several brain regions correlated with measures of executive, attention and memory functions [Kraus et al.,2007]. Here, we extend these results by showing that persistent PCS in mTBI was associated with early diffusion changes in long association fasciculi connecting the frontal, parietal and temporal cortices: the forceps major and minor of the corpus callosum linking prefrontal and fronto‐orbital regions and occipital lobes respectively (involved in perceptual and cognitive functions), the anterior thalamic radiations projecting to the frontal lobe, the superior longitudinal fasciculus connecting frontal and parietal lobes (involved in working memory), the inferior longitudinal fasciculus and the inferior fronto‐occipital fasciculus connecting occipital and temporal and frontal lobes (involved in reading, attention, visual perception, processing and memory, and language) bilaterally [Catani and Thiebaut de Schotten,2008; Wakana et al.,2004]. In addition, MD in the affected fiber tracts accurately predicted the clinical outcome at the individual level suggesting that DTI may be useful in a clinical setting.
In this study, we only investigated whether DTI results were consistent with a classification of mild TBI patients regarding poor or good outcome, made on the basis of the complaints questionnaire at M3. We did not investigate specifically whether DTI‐based analyses were able to predict PO vs. GO better than clinical measures alone (e.g. age, GCS, conventional scan normal vs. abnormal, psychological, and neuropsychological data) performed at the subacute timepoint. This question is currently under investigation in a new study involving a much larger group of mild TBI patients.
Methodological Limitations
Our study has some limitations. The main limitation was the small sample size of mTBI patients. For VBM analysis, the statistical power is largely influenced by the sample size. Here we used a non‐parametric permutation‐based test (or exact test, similar to the bootstrap approach), which does not require any assumption about the distribution across the population of the scalar tested and limits the effect of the sample size. Another source of limitation arises from the fact that some patients presented evident brain lesions detectable with conventional images. These lesions can reduce the efficiency of the VBM and TBSS preprocessing steps, mainly the registration to a standard space, because registration tools are optimized to run on “normal” brain. Last, the predictive value of MD in white matter fiber tracts needs to be confirmed using an independent group of patients.
CONCLUSIONS
Poor outcome in patients with mTBI was associated with specific brain lesions. At the subacute stage, DTI data allowed to differentiate PO patients from both GO patients and controls, while gray matter lesions only distinguished PO patients from controls. This suggests that persistent PCS may be primarily a consequence of DAI in specific long association tracts including the corpus callosum, the inferior longitudinal fasciculus and the inferior fronto‐occipital fasciculus bilaterally. In addition, DTI may be a better predictive biomarker of poor outcome in mTBI than gray matter partial volume. White matter fiber tracking will help localize fiber tracts that are affected by the lesions. A better evaluation of early damage in mTBI patients using DTI may help clinicians better evaluate patients' outcome and facilitate patients' care.
Acknowledgements
The authors thank all study participants. The authors are grateful to Dr C. Delmaire (Inserm, Univ Lille II, UMR_S 8160), Dr R. Jardri (Department of Child and Adolescent Psychiatry, Lille Hospital) and Dr D. Pins (Inserm, Univ Lille II, UMR_S 8160) for providing us with additional control data.
REFERENCES
- Adams JH,Graham DI,Gennarelli TA,Maxwell WL( 1991): Diffuse axonal injury in non‐missile head injury. J Neurol Neurosurg Psychiatr 54: 481–483. [DOI] [PMC free article] [PubMed] [Google Scholar]
- Adams JH,Graham DI,Murray LS,Scott G( 1982): Diffuse axonal injury due to nonmissile head injury in humans: An analysis of 45 cases. Ann Neurol 12: 557–563. [DOI] [PubMed] [Google Scholar]
- Aihara N,Hall J,Pitts L,Fukuda K,Noble L( 1995): Altered immunoexpression of microglia and macrophages after mild head injury. J Neurotrauma 12: 53–63. [DOI] [PubMed] [Google Scholar]
- Arfanakis K,Haughton VM,Carew JD,Rogers BP,Dempsey RJ,Meyerand ME( 2002): Diffusion tensor mr imaging in diffuse axonal injury. AJNR Am J Neuroradiol 23: 794–802. [PMC free article] [PubMed] [Google Scholar]
- Ashburner J,Friston KJ( 2000): Voxel‐based morphometry—The methods. Neuroimage 11: 805–821. [DOI] [PubMed] [Google Scholar]
- Baddeley AD ( 1986): Working Memory. Oxford: Oxford University Press; (Ed.). [Google Scholar]
- Basser PJ,Pajevic S,Pierpaoli C,Duda J,Aldroubi A( 2000): In vivo fiber tractography using DT‐MRI data. Magn Reson Med 44: 625–632. [DOI] [PubMed] [Google Scholar]
- Bazarian JJ,Zhong J,Blyth B,Zhu T,Kavcic V,Peterson D( 2007): Diffusion tensor imaging detects clinically important axonal damage after mild traumatic brain injury: A pilot study. J Neurotrauma 24: 1447–1459. [DOI] [PubMed] [Google Scholar]
- Begaz T,Kyriacou DN,Segal J,Bazarian JJ( 2006): Serum biochemical markers for post‐concussion syndrome in patients with mild traumatic brain injury. J Neurotrauma 23: 1201–1210. [DOI] [PubMed] [Google Scholar]
- Belanger HG,Curtiss G,Demery JA,Lebowitz BK,Vanderploeg RD( 2005): Factors moderating neuropsychological outcomes following mild traumatic brain injury: A meta‐analysis. J Int Neuropsychol Soc 11: 215–227. [DOI] [PubMed] [Google Scholar]
- Bendlin BB,Riesa ML,Lazar M,Alexander AL,Dempsey RJ,Rowley HA,Sherman JE,Johnson SC( 2008): Longitudinal changes in patients with traumatic brain injury assessed with diffusion‐tensor and volumetric imaging. Neuroimage 42: 503–514. [DOI] [PMC free article] [PubMed] [Google Scholar]
- Bigler ED( 2004): Neuropsychological results and neuropathological findings at autopsy in a case of mild traumatic brain injury. J Int Neuropsychol Soc 10: 794–806. [DOI] [PubMed] [Google Scholar]
- Binder LM( 1986): Persisting symptoms after mild head injury: A review of postconcussive syndrome. J Clin Exp Neuropsychol 8: 323–346. [DOI] [PubMed] [Google Scholar]
- Binder LM,Rohling ML,Larrabee GJ( 1997): A review of mild head trauma. J Clin Exp Neuropsychol 19: 421–431. [DOI] [PubMed] [Google Scholar]
- Blumbergs PC,Scott G,Manavis J,Wainwright H,Simpson DA,McLean AJ( 1994): Staining of amyloid precursor protein to study axonal damage in mild head injury. Lancet 344: 1055–1056. [DOI] [PubMed] [Google Scholar]
- Blumbergs PC,Scott G,Manavis J,Wainwright H,Simpson DA,McLean AJ( 1995): Topography of axonal injury as defined by amyloid precursor protein and the sector scoring method in mild and severe closed head injury. J Neurotrauma 12: 565–572. [DOI] [PubMed] [Google Scholar]
- Bohnen N,Jolles J( 1992): Neurobehavioral aspects of postconcussive symptoms after mild head injury. J Nerv Ment Dis 180: 683–692. [DOI] [PubMed] [Google Scholar]
- Carroll L,Cassidy JD,Peloso P,Borg J,von Holst H,Holm L,Paniak C,Pepin M( 2004): Prognosis for mild traumatic brain injury: Results of the who collaborating centre task force on mild traumatic brain injury. J Rehabil Med 36: 84–105. [DOI] [PubMed] [Google Scholar]
- Catani M,Thiebaut de Schotten M( 2008): A diffusion tensor imaging tractography atlas for virtual in vivo dissections. Cortex 44: 1105–1132. [DOI] [PubMed] [Google Scholar]
- Chan RCK( 2005): Sustained attention in patients with mild traumatic brain injury. Clin Rehabil 19: 188–193. [DOI] [PubMed] [Google Scholar]
- DSM‐IV‐94 ( 1994): Diagnostic and statistical manual of mental disorders DSM‐IV‐TR fourth edition (text revision). Association, A.P. (Ed.). [Google Scholar]
- Dikmen S,McLean A,Temkin N( 1986): Neuropsychological and psychosocial consequences of minor head injury. J Neurol Neurosurg Psychiatr 46: 1227–1232. [DOI] [PMC free article] [PubMed] [Google Scholar]
- Drake RE,Goldman HH,Leff HS,Lehman AF,Dixon L,Mueser KT,Torrey WC( 2001): Implementing evidence‐based practices in routine mental health service settings. Psychiatr Serv 52: 179–182. [DOI] [PubMed] [Google Scholar]
- Elgmark AE,Emanuelson I,Bjorklund R,Stalhammar DA( 2007): Mild traumatic brain injuries: The impact of early intervention on late sequelae: A randomized controlled trial. Acta Neurochirur (Wien) 149: 151–160. [DOI] [PubMed] [Google Scholar]
- Evans RW( 1992): The postconcussion syndrome and the sequelae of mild head injury. Neurol Clin 10: 815–847. [PubMed] [Google Scholar]
- Fork M,Bartels C,Ebert AD,Grubich C,Synowitz H,Wallesch C( 2005): Neuropsychological sequelae of diffuse traumatic brain injury. Brain Inj 19: 101–108. [DOI] [PubMed] [Google Scholar]
- Gale SD,Baxter L,Roundy N,Johnson SC( 2005): Traumatic brain injury and grey matter concentration: A preliminary voxel based morphometry study. J Neurol Neurosurg Psychiatr 76: 984–988. [DOI] [PMC free article] [PubMed] [Google Scholar]
- Gennarelli T( 1996): The spectrum of traumatic axonal injury. Neuropathol Appl Neurobiol 22: 509–513. [DOI] [PubMed] [Google Scholar]
- Gennareli TA,Graham DI( 1998): Neuropathology of the head injuries. Semin Clin Neuropsychiatry 3: 160–175. [PubMed] [Google Scholar]
- Gillum RF,Bosworth HB( 2002): New considerations in analyzing stroke and heart disease mortality trends: The year 2000 age standard and the international statistical classification of diseases and related health problems, 10th revision. Stroke 33: 1717–1722. [DOI] [PubMed] [Google Scholar]
- Goldstein FC,Levin HS,Presley RM,Searcy J,Colohan AR,Eisenberg HM,Jann B,Bertolino‐Kusnerik L( 1994): Neurobehavioural consequences of closed head injury in older adults. J Neurol Neurosurg Psychiatr 57: 961–966. [DOI] [PMC free article] [PubMed] [Google Scholar]
- Good CD,Johnsrude IS,Ashburner J,Henson RNA,Friston KJ,Frackowiak RSJ( 2001): A voxel‐based morphometric study of ageing in 465 normal adult human brains. Neuroimage 14: 21–36. [DOI] [PubMed] [Google Scholar]
- Goodman J( 1994): Pathologic changes in mild head injury. Semin Neurol 14: 19–24. [DOI] [PubMed] [Google Scholar]
- Harsan LA,Poulet P,Guignard B,Steibel J,Parizel N,Loureiro de Sousa P,Boehm N,Grucker D,Ghandour MS( 2006): Brain dysmyelination and recovery assessment by noninvasive in vivo diffusion tensor magnetic resonance imaging. J Neurosci Res 83: 392–402. [DOI] [PubMed] [Google Scholar]
- Hinton‐Bayre AD,Geffen G,McFarland K( 1997): Mild head injury and speed of information processing: A prospective study of professional rugby league players. J Clin Exp Neuropsychol 19: 275–289. [DOI] [PubMed] [Google Scholar]
- Hugenholtz H,Stuss DT,Stethem LL,Richard MT ( 1988): How long does it take to recover from a mild concussion? Neurosurgery 22: 853–858. [PubMed] [Google Scholar]
- Huisman TA,Schwamm LH,Schaefer PW,Koroshetz WJ,Shetty‐Alva N,Ozsunar Y,Wu O,Sorensen AG( 2004): Diffusion tensor imaging as potential biomarker of white matter injury in diffuse axonal injury. AJNR Am J Neuroradiol 25: 370–376. [PMC free article] [PubMed] [Google Scholar]
- Inglese M,Makani S,Johnson G,Cohen BA,Silver JA,Gonen O,Grossman RI( 2005): Diffuse axonal injury in mild traumatic brain injury: A diffusion tensor imaging study. J Neurosurg 103: 298–303. [DOI] [PubMed] [Google Scholar]
- Iverson GL( 2005): Outcome from mild traumatic brain injury. Curr Opin Psychiatry 18: 301–317. [DOI] [PubMed] [Google Scholar]
- Kay T,Harrington DE,Adams R,Anderson T,Berrol S,Cicerone K,Dahlberg C,Gerber D,Goka R,Harley P,Hilt J,Horn L,Lehmkuhl D,Malec J( 1993): Definition of mild traumatic brain injury. J Head Trauma Rehabil 8: 86–87. [Google Scholar]
- Kraus MF,Susmaras T,Caughlin BP,Walker CJ,Sweeney JA,Little DM( 2007): White matter integrity and cognition in chronic traumatic brain injury: A diffusion tensor imaging study. Brain 130: 2508–2519. [DOI] [PubMed] [Google Scholar]
- Langlois JA,Rutland‐Brown W,Wald MM( 2006): The epidemiology and impact of traumatic brain injury: A brief review. J Head Trauma Rehabil 21: 375–378. [DOI] [PubMed] [Google Scholar]
- Le TH,Mukherjee P,Henry RG,Berman J,Ware M,Manley GT( 2005): Diffusion tensor imaging with three‐dimensional fiber tractography of traumatic axonal shearing injury: An imaging correlate for the posterior callosal disconnection syndrome: Case report. Neurosurgery 56: 189. [PubMed] [Google Scholar]
- Lenglet C,Campbell JSW,Descoteaux M,Haro G,Savadjiev P,Wassermann D,Anwander A,Deriche R,Pike GB,Sapiro G,Thompson P( 2009): Mathematical methods for diffusion MRI processing. Neuroimage 45: S111–S122. [DOI] [PMC free article] [PubMed] [Google Scholar]
- Levin HS,Mattis S,Ruff RM,Eisenberg HM,Marshall LF,Tabaddor K,High WMJ,Frankowski RF( 1987): Neurobehavioral outcome following minor head injury: A three‐center study. J Neurosurg 66: 234–243. [DOI] [PubMed] [Google Scholar]
- Li X,Messé A,Marrelec G,Pélégrini‐Issac M,Benali H( 2010): An enhanced voxel‐based morphometry method to investigate structural changes: Application to Alzheimer's disease. Neuroradiology 52: 203–213. [DOI] [PubMed] [Google Scholar]
- Lundin A,de Boussard C,Edman G,Borg J( 2006): Symptoms and disability until 3 months after mild tbi. Brain Inj 20: 799–806. [DOI] [PubMed] [Google Scholar]
- Mac Donald CL,Dikranian K,Bayly P,Holtzman D,Brody D( 2007): Diffusion tensor imaging reliably detects experimental traumatic axonal injury and indicates approximate time of injury. J Neurosci 27: 11869–11876. [DOI] [PMC free article] [PubMed] [Google Scholar]
- Mangin J,Poupon C,Clark C,Lebihan D,Bloch I( 2001): Eddycurrent distortion correction and robust tensor estimation for MR diffusion imaging. Medical image computing and computer‐assisted intervention ‐ MICCAI' 01: 186–194. [Google Scholar]
- McAllister TW( 1992): Neuropsychiatric sequelae of head injury. Psychiatr Clin North Am 15: 395–413. [PubMed] [Google Scholar]
- Medana IM,Esiri MM( 2003): Axonal damage: A key predictor of outcome in human CNS diseases. Brain 126: 515–530. [DOI] [PubMed] [Google Scholar]
- Mittenberg W,Strauman S( 2000): Diagnosis of mild head injury and the postconcussion syndrome. J Head Trauma Rehabil 15: 783–791. [DOI] [PubMed] [Google Scholar]
- Mittl RL,Grossman RI,Hiehle JF,Hurst RW,Kauder DR,Gennarelli TA,Alburger GW( 1994): Prevalence of mr evidence of diffuse axonal injury in patients with mild head injury and normal head CT findings. Am J Neuroradiol 15: 1583–1589. [PMC free article] [PubMed] [Google Scholar]
- Mori S,Zhang J( 2006): Principles of diffusion tensor imaging and its applications to basic neuroscience research. Neuron 51: 527–539. [DOI] [PubMed] [Google Scholar]
- Nakayama N,Okumura A,Shinoda J,Yasokawa Y,Miwa K,Yoshimura S,Iwama T( 2006): Evidence for white matter disruption in traumatic brain injury without macroscopic lesions. J Neurol Neurosurg Psychiatr 77: 850–855. [DOI] [PMC free article] [PubMed] [Google Scholar]
- Niogi SN,Mukherjee P,Ghajar J,Johnson C,Kolster RA,Sarkar R,Lee H,Meeker M,Zimmerman RD,Manley GT,McCandliss BD( 2008): Extent of microstructural white matter injury in postconcussive syndrome correlates with impaired cognitive reaction time: A 3T diffusion tensor imaging study of mild traumatic brain injury. AJNR Am J Neuroradiol 29: 967–973. [DOI] [PMC free article] [PubMed] [Google Scholar]
- Parizel PM,van Goethem JW,Özsarlak Ö,Maes M,Phillips CD( 2005): New developments in the neuroradiological diagnosis of craniocerebral trauma. Eur Radiol 15: 569–581. [DOI] [PubMed] [Google Scholar]
- Perlbarg V,Puybasset L,Tollard E,Lehéricy S,Benali H,Galanaud D( 2009): Relation between brain lesion location and clinical outcome in patients with severe traumatic brain injury: A diffusion tensor imaging study using voxel‐based approaches. Hum Brain Mapp 30: 3924–3933. [DOI] [PMC free article] [PubMed] [Google Scholar]
- Pierpaoli C,Basser PJ( 1996): Toward a quantitative assessment of diffusion anisotropy. Magn Reson Med 36: 893–906. [DOI] [PubMed] [Google Scholar]
- Ponsford J,Willmott C,Rothwell A,Cameron P,Kelly A,Nelms R,Curran CNGK( 2000): Factors influencing outcome following mild traumatic brain injury in adults. J Int Neuropsychol Soc 6: 568–579. [DOI] [PubMed] [Google Scholar]
- Povlishock JT,Katz DI( 2005): Update of neuropathology and neurological recovery after traumatic brain injury. J Head Trauma Rehabil 20: 76–94. [DOI] [PubMed] [Google Scholar]
- Ptak T,Sheridan RL,Rhea JT,Gervasini AA,Yun JH,Curran MA,Borszuk P,Petrovick L,Novelline RA( 2003): Cerebral fractional anisotropy score in trauma patients: A new indicator of white matter injury after trauma. Am J Roentgenol 181: 1401–1407. [DOI] [PubMed] [Google Scholar]
- Ragnarsson KT( 2002): Results of the nih consensus conference on rehabilitation of persons with traumatic brain injury. Restor Neurol Neurosci 20: 103–108. [PubMed] [Google Scholar]
- Rimel RW,Giordani B,Barth JT,Boll TJ,Jane JA( 1981): Disability caused by minor head injury. Neurosurgery 9: 221–228. [PubMed] [Google Scholar]
- Rueckert D,Sonoda LI,Hayes C,Hill DL,Leach MO,Hawkes DJ( 1999): Nonrigid registration using free‐form deformations: Application to breast MR images. IEEE Trans Med Imaging 18: 712–721. [DOI] [PubMed] [Google Scholar]
- Rugg‐Gunn FJ,Symms MR,Barker GJ,Greenwood R,Duncan JS( 2001): Diffusion imaging shows abnormalities after blunt head trauma when conventional magnetic resonance imaging is normal. J Neurol Neurosurg Psychiatr 70: 530–533. [DOI] [PMC free article] [PubMed] [Google Scholar]
- Rutgers DR,Toulgoat F,Cazejust J,Fillard P,Lasjaunias P,Ducreux D( 2008): White matter abnormalities in mild traumatic brain injury: A diffusion tensor imaging study. AJNR Am J Neuroradiol 29: 514–519. [DOI] [PMC free article] [PubMed] [Google Scholar]
- Rutherford WH( 1977): Sequelae of concussion caused by minor head injuries. Lancet 1: 1–4. [DOI] [PubMed] [Google Scholar]
- Salmond CH,Menon DK,Chatfield DA,Williams GB,Pena A,Sahakian BJ,Pickard JD( 2006): Diffusion tensor imaging in chronic head injury survivors: Correlations with learning and memory indices. Neuroimage 29: 117–124. [DOI] [PubMed] [Google Scholar]
- Scheid R,Walther K,Guthke T,Preul C,von Cramon DY( 2006): Cognitive sequelae of diffuse axonal injury. Arch Neurol 63: 418–424. [DOI] [PubMed] [Google Scholar]
- Scott J,Huskisson EC( 1979): Vertical or horizontal visual analogue scales. Ann Rheum Dis 38: 560–560. [DOI] [PMC free article] [PubMed] [Google Scholar]
- Sidaros A,Engberg AW,Sidaros K,Liptrot MG,Herning M,Petersen P,Paulson OB,Jernigan TL,Rostrup E( 2008): Diffusion tensor imaging during recovery from severe traumatic brain injury and relation to clinical outcome: A longitudinal study. Brain 131: 559–572. [DOI] [PubMed] [Google Scholar]
- Smith DH,Meaney DF,Shull WH( 2003): Diffuse axonal injury in head trauma. J Head Trauma Rehabil 18: 307–316. [DOI] [PubMed] [Google Scholar]
- Smith SM( 2002): Fast robust automated brain extraction. Hum Brain Mapp 17: 143–155. [DOI] [PMC free article] [PubMed] [Google Scholar]
- Smith SM,Nichols TE( 2009): Threshold‐free cluster enhancement: Addressing problems of smoothing, threshold dependence and localisation in cluster inference. Neuroimage 44: 83–98. [DOI] [PubMed] [Google Scholar]
- Smith SM,Jenkinson M,Woolrich MW,Beckmann CF,Behrens TE,Johansen‐Berg H,Bannister PR,De Luca M,Drobnjak I,Flitney DE,Niazy RK,Saunders J,Vickers J,Zhang Y,De Stefano N,Brady JM,Matthews PM( 2004): Advances in functional and structural MR image analysis and implementation as FSL. Neuroimage 23: S208–S219. [DOI] [PubMed] [Google Scholar]
- Smith SM,Jenkinson M,Johansen‐Berg H,Rueckert D,Nichols TE,Mackay CE,Watkins KE,Ciccarelli O,Cader MZ,Matthews PM,Behrens TE( 2006): Tract‐based spatial statistics: Voxelwise analysis of multi‐subject diffusion data. Neuroimage 31: 1487–1505. [DOI] [PubMed] [Google Scholar]
- Song SK,Sun SW,Ju WK,Lin SJ,Cross AH,Neufeld AH( 2003): Diffusion tensor imaging detects and differentiates axon and myelin degeneration in mouse optic nerve after retinal ischemia. Neuroimage 20: 1714–1722. [DOI] [PubMed] [Google Scholar]
- Song SK,Sun SW,Ramsbottom MJ,Chang C,Russell J,Cross AH( 2002): Dysmyelination revealed through MRI as increased radial (but unchanged axial) diffusion of water. Neuroimage 17: 1429–1436. [DOI] [PubMed] [Google Scholar]
- Stablum F,Mogentale C,Umiltà C( 1996): Executive functioning following mild closed head injury. Cortex 32: 261–278. [DOI] [PubMed] [Google Scholar]
- Stroop JR( 1935): Studies of interferences in serial verbal reactions. J Exp Psychol 18: 634–661. [Google Scholar]
- Stulemeijer M,de Jong LWAM,Fiselier TJW,Hoogveld SWB,Bleijenberg G( 2005): Cognitive behaviour therapy for adolescents with chronic fatigue syndrome: Randomised controlled trial. Br Med J 330: 14. [DOI] [PMC free article] [PubMed] [Google Scholar]
- Stuss DT,Stethem LL,Hugenholtz H,Picton T,Pivik J,Richard MT( 1989): Reaction time after head injury: Fatigue, divided and focused attention, and consistency of performance. J Neurol Neurosurg Psychiatr 52: 742–748. [DOI] [PMC free article] [PubMed] [Google Scholar]
- Stålnacke BM,Björnstig U,Karlsson K,Sojka P( 2005): One‐year follow‐up of mild traumatic brain injury: Post‐concussion symptoms, disabilities and life satisfaction in relation to serum levels of S‐100B and neurone‐specific enolase in acute phase. J Rehabil Med 37: 300–305. [DOI] [PubMed] [Google Scholar]
- Tagliaferri F,Compagnone C,Korsic M,Servadei F,Kraus J( 2006): A systematic review of brain injury epidemiology in europe. Acta Neurochir (Wien) 148: 255–268. [DOI] [PubMed] [Google Scholar]
- Tisserand D,Staanisz G,Lobaugh N,Gibson E,Li T,Black S( 2006): Diffusion tensor imaging for the evaluation of white matter pathology in traumatic brain injury. Brain Cogn 60: 216–217. [PubMed] [Google Scholar]
- Vanderploeg RD,Curtiss G,Belanger HG( 2005): Long‐term neuropsychological outcomes following mild traumatic brain injury. J Int Neuropsychol Soc 11: 228–236. [DOI] [PubMed] [Google Scholar]
- Wakana S,Jiang H,Nagae‐Poetscher LM,van Zijl PCM,Mori S( 2004): Fiber tract‐based atlas of human white matter anatomy. Radiology 230: 77–87. [DOI] [PubMed] [Google Scholar]
- Wang JY,Bakhadirov K,Devous MDS,Abdi H,McColl R,Moore C,Marquez de la Plata CD,Ding K,Whittemore A,Babcock E,Rickbeil T,Dobervich J,Kroll D,Dao B,Mohindra N,Madden CJ,Diaz‐Arrastia R( 2008): Diffusion tensor tractography of traumatic diffuse axonal injury. Arch Neurol 65: 619–626. [DOI] [PubMed] [Google Scholar]
- Willer B,Leddy JJ( 2006): Management of concussion and pos‐concussion syndrome. Curr Treat Options Neurol 8: 415–426. [DOI] [PubMed] [Google Scholar]
- Wood RLI( 2004): Understanding the ‘miserable minority’: A diasthesis‐stress paradigm for post‐concussional syndrome. Brain Inj 18: 1135–1153. [DOI] [PubMed] [Google Scholar]
- Xu J,Rasmussen I,Lagopoulos J,Håberg A( 2007): Diffuse axonal injury in severe traumatic brain injury visualized using high‐resolution diffusion tensor imaging. J Neurotrauma 24: 753–765. [DOI] [PubMed] [Google Scholar]
- Zhang Y,Brady M,Smith S( 2001): Segmentation of brain MR images through a hidden Markov random field model and the expectation‐maximization algorithm. IEEE Trans Med Imaging 20: 45–57. [DOI] [PubMed] [Google Scholar]
- van der Naalt J,van Zomeren AH,Sluiter WJ,Minderhoud JM( 1999): One year outcome in mild to moderate head injury: The predictive value of acute injury characteristics related to complaints and return to work. J Neurol Neurosurg Psychiatr 66: 207–213. [DOI] [PMC free article] [PubMed] [Google Scholar]