

Abstract
Objectives:
Brisk walking, a sensitive test to evaluate gait capacity in normal and pathological aging such as parkinsonism, is used as an alternative to classical fitness program for motor rehabilitation and may help to decrease the risk of cognitive deterioration observed with aging. In this study, we aimed to identify brain areas normally involved in its control.
Methods:
We conducted a block‐design blood oxygen level dependent function magnetic resonance imaging (BOLD fMRI) experiment in 18 young healthy individuals trained to imagine themselves in three main situations: brisk walking in a 25‐m‐long corridor, standing or lying. Imagined walking time (IWT) was measured as a control of behavioral performance during fMRI.
Results:
The group mean IWT was not significantly different from the actual walking time measured during a training session prior to the fMRI study. Compared with other experimental conditions, mental imagery (MI) of brisk walking was associated with stronger activity in frontal and parietal regions mainly on the right, and cerebellar hemispheres, mainly on the left. Presumed imagined walking speed (2.3 ± 0.4 m/s) was positively correlated with activity levels in the right dorsolateral prefrontal cortex and posterior parietal lobule along with the vermis and the left cerebellar hemisphere.
Interpretations:
A new finding in this study is that MI of brisk walking in young healthy individuals strongly involves processes lateralized in right fronto‐parietal regions along with left cerebellum. These results show that brisk walking might be a non automatic locomotor activity requiring a high‐level supraspinal control. Hum Brain Mapp, 2012. © 2011 Wiley Periodicals, Inc.
Keywords: gait, mental imagery, fMRI, right frontal cortex, left cerebellum
INTRODUCTION
Locomotion is easily performed in daily life by healthy humans, most of the time without any cognitive effort. It however requires a fine tuning between automatic and controlled processes involving complex interactions between spinal interneurons, afferent inputs from the limbs and a supraspinal network composed of specialized locomotor centers within the brainstem, cerebellum, basal ganglia, and cerebral cortex [Whelan,1996].
A large part of our current knowledge on the supraspinal control of gait comes from electrophysiological studies in decerebrate mammals. Studies in the cat led to the discovery of several brainstem structures labeled “locomotor regions” that produce locomotion when stimulated electrically: the mesencephalic locomotor region (MLR) in the posterior midbrain, the pontomedullary reticular formation (PMRF), the subthalamic locomotor region (SLR) located in the lateral hypothalamic area and the cerebellar locomotor region (CLR) in the midline cerebellum [Mori et al.,1999; Whelan,1996]. Whereas these brain regions are preferentially involved in the automatic aspects of gait control, other brain areas including the lateral cerebellum and posterior parietal cortex (PPC) seems to play a more important role in adjusting gait parameters to the constraints of the environment in mammals [Andujar et al.,2010; Marple‐Horvat and Criado,1999].
In humans, technical advances in functional neuroimaging have enabled the investigation of the neural control of gait. Three paradigms have been commonly employed depending on the main task performed by the participants: actual gait, alternative ankle movements, or mental imagery (MI) of gait [Bakker et al.,2007; Sacco et al.,2009]. Recording of brain activity during actual gait has been made possible by means of near‐infrared spectroscopy (NIRS) and hexamethyl‐propyleneamine oxime (HM‐PAO) single photon emission computed tomography (SPECT). These techniques have however limitations: NIRS is only effective in assessing the responses of the most superficial portions of the cerebral cortex whereas the temporal resolution of SPECT is in the order of several minutes [Bakker et al.,2007]. Two other paradigms, which have been favored in positron emission tomography (PET) and/or functional magnetic resonance imaging (fMRI) activation studies, involve either alternative feet extension and flexion movements or MI of gait under the assumption that there is a large overlap in brain activity changes elicited by these tasks and actual gait [Dobkin et al.,2004; Miyai et al.,2001; Sacco et al.,2009] as shown for other voluntary movements [Decety et al.,1994; Deiber et al.,1998; Gerardin et al.,2000; Munzert et al.,2009; Porro et al.,1996].
The distribution of brain areas involved in the control of human gait has been quite variable across functional neuroimaging studies. This might be explained, at least in part, by differences in task characteristics [Bakker et al.,2008; Dobkin et al.,2004; Miyai et al.,2001; Iseki et al.,2008; Jahn et al.,2008; Sacco et al.,2009; Wang et al.,2008]. From a general perspective, tasks requiring high‐level gait control such as precision gait elicited strong activity changes in fronto‐parietal cortices and lateral cerebellum [Bakker et al.,2008] whereas tasks with a strong emphasis on automatic gait control such as walking at a comfortable speed and running were found to preferentially elicit activity changes in brainstem and midline cerebellar locomotor centers [Jahn et al.,2008]. In healthy individuals, alternative feet extension and flexion movements combined with training in locomotor attention were shown to activate both fronto‐parietal cortices and midline cerebellum [Sacco et al.,2009].
In the present study, we used fMRI to investigate the neural correlates of MI of brisk walking in young healthy subjects. Brisk walking is an aerobic fitness exercise that consists in walking at a high pace with energetic arm motion. It is wedged between the boundaries of walking and running and might thus require more cognitive influences insomuch as individuals performing this task are continually adapting their speed in order to not to walk and not to run. Brisk walking is a sensitive tool to evaluate gait capacity, which declines during senescence and Parkinson's disease (PD). Reduced gait speed is a predictor of decline in brain function in the elderly, and slower gait has been correlated with declined cognitive function [Fitzpatrick et al.,2007]. Brisk walking has been proposed as a less expensive alternative to classical medical fitness programs for motor and cardiovascular rehabilitation [Praet et al.,2008] and may help to decrease the risk of cognitive deterioration observed with aging [Prohaska et al.,2009]. Furthermore, studying the neural correlates of MI of brisk walking may have clinical implications in gait rehabilitation. For instance, motor imagery of gait has been suggested as an efficient clinical tool for gait rehabilitation in poststroke paresis [Dunsky et al.,2008; Hwang et al.,2010].
The neural correlate of brisk walking is poorly known in healthy individuals. Using NIRS during actual gait on a treadmill, Suzuki et al. [2004] observed that walking at 2.5 m/sec elicited brain signal increases in the right lateral and medial prefrontal cortices, bilateral posterior parietal areas along with medial primary sensori‐motor cortex, the locus of the leg representation area.
The task paradigm employed in this study was MI of brisk walking. Since the speed of imagined locomotion (imagined walking speed, IWS) is a critical aspect of the present study, the gait imagination task was designed to allow monitoring participants' performance on a trial‐by‐trial basis in the scanner by measuring the time (imagined walking time, IWT) required for MI of a 75‐m high‐pace walk in a 25‐m‐long corridor located next to the fMRI scanning room. In addition to provide us with a behavioral marker of MI of gait, we also used IWS as a dependant variable in a correlation analysis with brain activity.
METHODS
Subjects
Eighteen young healthy subjects (11 M/7 F; mean age = 22.9 ± 2.5 years) were recruited from the Cyclotron Research Center database of normal volunteers. Seventeen out of eighteen participants were right‐handed according to the Edinburgh Inventory [Oldfield,1971]. None of them had any history of neurological disorder, head trauma with loss of consciousness, epilepsy, brain surgery, systemic illness, excessive drug, or alcohol consumption. Informed verbal and written consents for this research protocol, which was approved by the local Ethic Committee, were obtained from all subjects prior to the study.
fMRI Task Procedure
Subjects lay supine in the scanner with the right hand resting on a home made 4‐button response unit with eyes closed, as it has been suggested that eye closure improves imagination [Marx et al.,2003].
The fMRI study was organized as a block‐design experiment including 4 main conditions: brisk walking, standing, lying, and baseline. Each condition was repeated eight times in a random order leading to a total of 32 block trials within the fMRI session.
Brisk walking, standing, and lying were MI tasks. The onset of all trials was indicated verbally to the participants through headphones. The verbal instructions were the french words “marche rapide,”, “station debout immobile,” “position couchée” for brisk walking, standing, lying, respectively. These instructions were preceded by a brief warning signal presented 4–6 s earlier. The warning signal consisted in a triple beep of increasing pitch (600, 1,800, and 3,000 Hz). Beeps were presented for 200 ms at a rate of 3.3 Hz. In the brisk walking condition, subjects were instructed to imagine themselves walking back and forth at a high pace in a 25‐m‐long basement floor. The requested walking distance was 75 m. Participants were specifically instructed not to count their steps or to place the emphasis on time estimation. In the standing and lying conditions, participants were asked to imagine themselves standing in the same basement floor or lying, respectively. We instructed subjects to imagine each situation as vividly as possible, in a first person perspective, in a kinesthetic and visual way, but without making any voluntary movements.
In this study, the duration of MI trials did not have a fixed value across blocks. In the brisk walking condition, the participants had to indicate when they had completed each trial by pressing a key with their right index finger. The experiment was nevertheless designed to render the average duration of the three MI conditions as close as possible. The duration of each brisk walking trial (IWT) computed as the time elapsed between the onset of the verbal instruction and the key press was recorded on‐line. This value was used to determine the duration of subsequent standing and lying trials until the next brisk walking trial. Since the order of trials was randomized, one or more standing and/or lying trials could occur before the first brisk walking trial. In this case, the initial duration of these early standing and/or lying trials was fixed by the experimenters based on the data obtained during training prior to the fMRI experiment (see below).
In the baseline condition, the triple beep of increasing pitch was delivered to the subjects but was not followed by any verbal instruction. The duration of the baseline trials was jittered from 8 to 12 s.
In all four conditions, the end of the trial was indicated to the subjects by a triple beep of decreasing pitch (3,000, 1,800, and 600 Hz). As for the warning signal, beeps were presented for 200 ms at a rate of 3.3 Hz. In the brisk walking condition, the beeps immediately followed the key press with the right index finger whereas in the standing, lying and baseline conditions, subjects were instructed to wait for the beeps before pressing the second, the third or the fourth button of the response box, using the middle, ring or little finger, respectively. Any IWT longer than 50 s was considered as a failed brisk walking trial. Wrong key presses were considered as failed trials in all MI conditions.
All subjects were trained to the MI tasks and their real counterpart for about 60 min before the fMRI experiment. The time required to walk 75 m at a high pace in the basement floor was recorded in all subjects on eight successive trials. To tailor the effort to each individual's physical capability, participants were instructed to walk at the highest speed that they feel is close to running.
After the fMRI study, participants were given a debriefing questionnaire about the strategy they adopted during the MI tasks.
Image Acquisition
BOLD fMRI data were obtained on a 3T Magnetom Allegra MR Head scanner (Siemens AG Medical Solutions, Erlangen Germany) using a single‐shot 2D gradient‐echo echo‐planar imaging (GRE‐EPI) sequence (32 axial slices, slice thickness = 3 mm, slice gap = 30%, TR = 2,130 ms, TE = 40 ms, flip angle = 90°; bandwidth = 3,552 Hz; matrix size = 64 × 64, yielding an in‐plane resolution of 3.44 mm × 3.44 mm). The first three images of the BOLD time series were discarded to allow for T1 saturation effects. Head movement was minimized by restraining the subject's head using a vacuum cushion. Eyelid closure during fMRI was monitored on‐line using an eye‐tracking system (LRO5000, Applied Science Laboratories) positioned at the rear of the scanner.
In addition to BOLD fMRI, all participants underwent a high‐resolution volumetric anatomical MRI of the brain using a T1‐weighted MDEFT sequence (TR = 7.92 ms TE = 2.4 ms, TI = 910 ms, flip angle = 15°; matrix size 240 × 256, yielding 176 contiguous sagittal slices with a isotropic voxel size of 1 mm × 1 mm × 1 mm).
Image Analysis
Offline MRI data processing was performed using the Statistical Parametric Mapping Software (SPM5, Wellcome Department of Imaging Neuroscience, London, UK; freely available at http://www.fil.ion.ucl.ac.uk/spm) implemented within Matlab 7.4.0 (MathWorks, Natick, MA). Individual BOLD data time‐series were realigned using iterative rigid body transformations that minimize the residual sum of square between the first and subsequent images. The mean EPI image was spatially coregistered to the anatomical MRI image and coregistration parameters were applied to the realigned BOLD time series. The anatomical MRI was spatially normalized into MNI space (Montreal Neurological Institute, http://www.bic.mni.mcgill.ca) using the unified segmentation approach, and the normalization parameters were subsequently applied to the coregistered BOLD times series, which was then resliced to a voxel size of 2 × 2 × 2 mm3, and finally smoothed using a 6 mm FWHM Gaussian kernel.
Processed BOLD data time series were then analyzed using SPM5 in the framework of the General Linear Model (GLM). A first‐level analysis was initially performed to accommodate for within‐subject, between‐scan variability. All main experimental conditions (brisk walking, standing, lying, baseline) were modeled using a boxcar function whose onset and duration were time‐locked with onset and duration of the corresponding trials. These boxcar functions were convolved with a canonical hemodynamic response function. In addition to these 4 regressors of interest, the statistical model included three events modeling the motor responses (with the right hand fingers), triple beeps and verbal instruction, respectively. The six regressors representing the realignment parameters from the rigid body‐transformation step were added to the statistical design. A high pass filter using a cut‐off period of 128 s was applied in order to remove the low frequency drifts from the time series. Serial autocorrelations were estimated with a restricted maximum likelihood algorithm with an autoregressive model of order 1 (+ white noise). Parameter estimates and variance were derived voxel‐by‐voxel and the main effect of each condition was assessed using t‐contrasts.
In order to capture the most accurate individual brain activation related to the locomotor task, the contrasts “brisk walking—standing” and “brisk walking—lying” were created in a first‐level and then entered in a second‐level analysis.
A group‐level random effects analysis modeled the main effect of the locomotor task described by the individual contrasts “brisk walking—standing” and “brisk walking—lying” by means of a one sample t‐test.
Group results were characterized in terms of the probability that the increase in magnitude value in a given voxel could occur by chance under the null hypothesis. In all analyses, the statistical level of significance was set at a p < 0.05 after correction for multiple comparisons using the false discovery rate (FDR) [Genovese et al.,2002] as implemented in SPM5.
In a separate second‐level statistical model, we looked for a positive linear relationship between presumed IWS and brain activity. This was modeled using a correlation analysis across individuals between brain activations defined by the contrasts brisk walking–standing, and their respective IWS. The analysis was restricted by an inclusive mask defined by the contrast brisk walking–standing (uncorrected mask p‐value = 0.05). Threshold was set at p ≤ 0.001, uncorrected.
Assessment of Lateralization Index
In a post‐hoc analysis, we assessed lateralization index (LI) using the LI‐toolbox implemented in SPM5. This toolbox has been tested in assessment of hemispheric lateralization of language [Wilke and Lidzba,2007] but to our knowledge it is the first time it is used in a locomotion imagery study. The rationale for using LI value is to assess hemispheric dominance from functional activation patterns. The LI value is computed using this formula: LI = (Q LH − Q RH)/(Q LH + Q RH) where Q LH and Q RH are representative quantities measured by fMRI for left and right hemispheres, respectively. These values range between −1 and +1, with −1 being a purely right and +1 a purely left activation [Tamada et al.,1999; Seghier,2008; Wilke and Lidzba,2007].
A particular issue was to select an adequate statistical threshold because LI value can vary with this threshold [Seghier,2008]. Here, we choose the height threshold T value corresponding to p = 0.001, uncorrected. This value has been pointed out as the most appropriate statistical threshold to determine LI in an fMRI study evaluating the hemispheric language dominance [Chlebus et al.,2007].
LI calculation was applied to the contrasts brisk walking–standing and brisk walking–lying from the group second‐level one sample t‐test analyses. Following the LI‐toolbox algorithm, we first selected the corresponding spmT images. We chose optional inclusive masks defining the volumes to investigate. Frontal, parietal and cerebellar masks were selected. We did not select any exclusive mask. The inclusive mask was define by the height threshold T of 3.65 corresponding to a p = 0.001, uncorrected in the contrasts brisk walking–standing and brisk walking–lying. LI was assessed by means of automatic voxel count which calculates the number of voxels that survived the adequate threshold in left‐ and right‐sided masks.
RESULTS
Behavioral Data
As predicted by previous studies [Decety et al.,1989], the group mean (± SD) 75 m walking time (actual walking time, AWT) measured in the basement floor during real gait (31.8 ± 4.6 s) was not significantly different from the IWT (33.7 ± 5.3 s) measured during fMRI (paired t‐test: p = 0.07). We found a strong linear correlation between individual AWT and IWT (Pearson's r = 0.65; p = 0.003) (see Fig. 1). Group mean IWT coefficient of variability (CV) between trials was 9.3 ± 3.7%. On average, IWS (2.3 ± 0.4 m/s) is compatible with a high pace walk in a group of young healthy subjects. Group mean accuracy was 99%.
Figure 1.
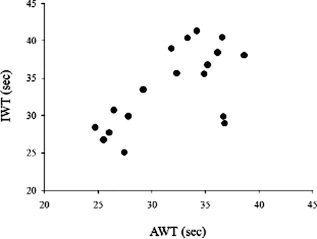
Relationship between imagined walking time (IWT) and actual walking time (AWT).
At the debriefing after the fMRI experiment, all subjects stated that they did not count their steps or use a time estimation strategy. They all confirmed vivid MI of brisk walking in a first person perspective, as if their legs were moving. Taken together, these data suggest that subjects performed MI of gait reasonably well.
Imaging Data
Significant increases in fMRI BOLD signal during MI of brisk walking compared with the control conditions are listed in Tables I and II. Peak results reported in the tables are significant at p < 0.05, corrected for multiple comparisons using the FDR [Genovese et al.,2002]. Coordinates of peaks in MNI space are informational.
Table I.
Main areas showing a significant increase in BOLD signal during mental imagery of BRISK WALKING as compared with mental imagery of STANDING
| Localization | Right hemisphere | Left hemisphere | ||||||||
|---|---|---|---|---|---|---|---|---|---|---|
| Coordinates (mm) | Z‐score | P value | Coordinates (mm) | Z‐score | P value | |||||
| x | y | z | x | y | z | |||||
| Cortex | ||||||||||
| Inferior frontal gyrus | 32 | 44 | 4 | 4.28 | 0.010 | |||||
| Superior frontal sulcus | 24 | 6 | 42 | 3.61 | 0.034 | |||||
| Middle frontal gyrus (DLPFC) | 42 | 42 | 26 | 4.48 | 0.004 | |||||
| SMA | −6 | −6 | 66 | 3.75 | 0.029 | |||||
| Anterior insula | 30 | 16 | 6 | 4.18 | 0.013 | |||||
| Superior parietal lobule | 22 | −58 | 48 | 3.85 | 0.026 | |||||
| Inferior parietal lobule | 46 | −38 | 38 | 3.52 | 0.036 | |||||
| Precuneus | 16 | −64 | 42 | 5.54 | <0.001 | −14 | −64 | 38 | 3.75 | 0.029 |
| Posterior cingulate cortex | 22 | −56 | 22 | 3.91 | 0.025 | −22 | −58 | 22 | 4.79 | 0.001 |
| Parahippocampal gyrus | −32 | −46 | 0 | 4.94 | 0.001 | |||||
| Basal ganglia | ||||||||||
| Medial pallidum | −12 | −2 | 0 | 3.46 | 0.038 | |||||
| Caudate nucleus‐body | 22 | −6 | 32 | 4.24 | 0.011 | −18 | −8 | 30 | 3.58 | 0.035 |
| Cerebellum | ||||||||||
| Vermis | 2 | −58 | −12 | 3.95 | 0.024 | |||||
| Cerebellar hemisphere‐simple lobule | 42 | −50 | −34 | 3.86 | 0.027 | −30 | −56 | −28 | 4.98 | 0.001 |
| Cerebellar hemisphere‐biventer lobule | −30 | −60 | −40 | 3.86 | 0.027 | |||||
Table II.
Main areas showing a significant increase in BOLD signal during mental imagery of BRISK WALKING as compared with mental imagery of LYING
| Right hemisphere | Left hemisphere | |||||||||
|---|---|---|---|---|---|---|---|---|---|---|
| Coordinates (mm) | Coordinates (mm) | |||||||||
| Localization | x | y | z | Z‐score | P value | x | Y | z | Z‐score | P value |
| Cortex | ||||||||||
| Inferior frontal gyrus | 38 | 52 | 2 | 4.08 | 0.015 | |||||
| Superior frontal sulcus | 26 | 6 | 56 | 3.49 | 0.035 | |||||
| Middle frontal gyrus (DLPFC) | 36 | 38 | 32 | 4.92 | 0.005 | −32 | 36 | 34 | 3.55 | 0.034 |
| SMA | 8 | −2 | 58 | 3.49 | 0.034 | −4 | −4 | 64 | 4.17 | 0.014 |
| Anterior insula | 34 | 20 | 4 | 4.13 | 0.014 | |||||
| Superior parietal lobule | 20 | −60 | 48 | 3.96 | 0.019 | |||||
| Inferior parietal lobule | 48 | −38 | 42 | 4.10 | 0.015 | |||||
| Precuneus | 16 | −68 | 44 | 5.43 | 0.001 | −8 | −70 | 44 | 4.60 | 0.010 |
| Posterior cingulate cortex | 20 | −58 | 28 | 4.63 | 0.009 | −20 | −62 | 24 | 4.36 | 0.013 |
| Parahippocampal gyrus | −32 | −46 | 0 | 4.51 | 0.010 | |||||
| Basal ganglia | ||||||||||
| Medial pallidum | −14 | −2 | 4 | 4.38 | 0.013 | |||||
| Thalamus | 12 | −22 | 12 | 4.49 | 0.011 | −12 | −26 | 12 | 3.36 | 0.036 |
| Cerebellum | ||||||||||
| Vermis | 2 | −52 | −6 | 4.54 | 0.010 | |||||
| Cerebellar hemisphere‐simple lobule | −32 | −54 | −30 | 4.79 | 0.006 | |||||
| Cerebellar hemisphere‐biventer lobule | −30 | −60 | −40 | 3.45 | 0.038 | |||||
We found similar patterns of cortical activity in MI of brisk walking compared either with the standing or lying conditions (see Fig. 2). Compared with these control conditions, MI of brisk walking was characterized by a stronger activation in left SMA, right inferior frontal gyrus, right superior frontal sulcus, right dorsolateral prefrontal cortex (DLPC), right anterior insula, parietal areas including bilateral precuneus and superior parietal lobule (SPL) and right inferior parietal lobule (IPL), and left parahippocampal gyrus. In the group contrast brisk walking–standing, we found activity in basal ganglia (i.e., left medial pallidum and bilateral bodies of caudate nuclei) and in vermis and bilateral hemispheres (simple and biventer lobule) of cerebellum. When compared to the lying condition, MI of brisk walking showed a slight difference in the pattern of activation of basal ganglia where activity was located in left medial pallidum, head of right caudate nucleus and bilateral thalami. A similar pattern of activation was found within the cerebellum.
Figure 2.
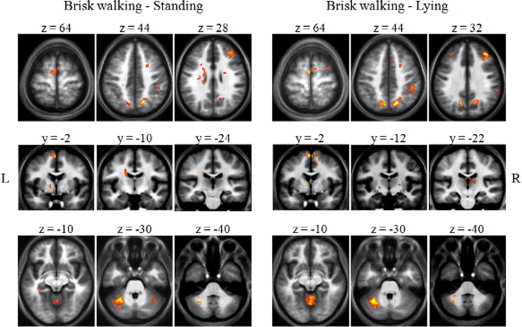
Comparison of BOLD signal changes in fMRI during mental imagery of brisk walking compared with mental imagery of standing and mental imagery of lying. During imagination of brisk walking compared with imagination of standing and lying prominent activations were found in fronto‐parietal regions, basal ganglia, posterior cingulate cortex, anterior insula, left parahippocampal gyrus, and cerebellum. Results are displayed on the group mean high resolution T1 weighted MRI at a threshold of P < 0.05, FDR‐corrected.
IWS was positively correlated with brain activity in the right DLPFC, IPL and cerebellar vermis and left hemisphere suggesting that activity of these regions increase with increasing IWS (see Fig. 3). Peak results at p < 0.001, uncorrected of significant BOLD fMRI increases and their coordinates in MNI space are reported in Table III.
Figure 3.

Correlation analysis between imagined walking speed and brain activity. Imaging data show a positive correlation between imagined walking speed and activity in the right dorsolateral prefrontal cortex, right inferior parietal lobule, vermis, and left hemisphere of cerebellum (see text). Results are displayed at P < 0.001, uncorrected.
Table III.
Areas showing a correlation between imagined walking speed and brain activity
| Localization | Coordinates (mm) | Z‐score | ||
|---|---|---|---|---|
| x | y | z | ||
| Right DLPFC | 36 | 40 | 18 | 3.66 |
| Right IPL | 44 | −48 | 50 | 3.50 |
| Cerebellum‐left hemisphere | −30 | −64 | −42 | 3.42 |
| Cerebellum‐vermis | −6 | −54 | −10 | 3.35 |
The post‐hoc LI analysis of the brisk walking condition compared with the standing and lying conditions revealed a strong right lateralization of cortical activations and left lateralization of cerebellar activations. Details of LI calculation are presented in Table IV.
Table IV.
Laterality index in selected regions during mental imagery of BRISK WALKING as compared with control conditions
| Region | BRISK WALKING – STANDING | BRISK WALKING ‐ LYING | ||||
|---|---|---|---|---|---|---|
| Voxel count | LI | Voxel count | LI | |||
| Right hemisphere | Left hemisphere | Right hemisphere | Left hemisphere | |||
| Frontal lobe | 274 | 55 | −0.67 | 517 | 47 | −0.83 |
| Parietal lobe | 327 | 64 | −0.67 | 735 | 286 | −0.44 |
| Cerebellum | 122 | 419 | 0.59 | 239 | 476 | 0.33 |
DISCUSSION
The main goal of the present BOLD fMRI experiment was to identify, in a group of young healthy individuals, brain areas engaged in MI of brisk walking in a first person perspective. The main finding of our study is the involvement of a neural network composed of right DLPFC, right IPL and vermis and left hemisphere of the cerebellum in the control of walking speed.
Our behavioral data show that all subjects performed the brisk walking trials reasonably well. Previous functional imaging studies on MI of gait differed by the degree of behavioral assessment of the subjects' compliance to the imagination task, ranging from no assessment [Boly et al.,2007; Jahn et al.,2004,2008], to a structured interview after the experiment [Sacco et al.,2006], or mental chronometry measurements performed outside [Iseki et al.,2008] or inside [Bakker et al.,2008; Guillot et al.,2009] the scanner. The latter approach was used here. The gait imagination task was designed to allow monitoring participants' performance on a trial‐by‐trial basis in the scanner by measuring the time (IWT) required for MI of a 75 m high‐pace walk in a corridor located next to the fMRI scanning room. The group mean IWS was 2.3 m/s, a value that is compatible with a high pace walk in a group of young healthy subjects. Since each participant performed eight walking trials, we could reasonably consider that MI the locomotor task was closed to the MI of steady‐state walking and that brain activity due to reaching the destination and turning 180° was drowned in the brain activity due to MI of brisk walking stricto sensu.
For a given subject, IWT was reproducible across trials as shown by a group mean CV lower than 10%. Furthermore, on average, IWT was not significantly different from the mean AWT measured during a training session measured prior to the fMRI experiment. We found a significant linear correlation between IWT and AWT across subjects (see Fig. 1). Finally, in a debriefing questionnaire administered at the end of the fMRI experiment, all participants stated that they mentally rehearsed brisk walking at the first person perspective and that their strategy did not involve time estimation or counting steps. Taken together, these data suggest that IWT was related to a first person MI of brisk walking.
The general pattern of activated brain regions observed in the present study during MI of brisk walking in comparison with MI of standing and lying (see Fig. 2) partially overlap with that reported in previous functional imaging studies. Our results support the view that medial and lateral aspects of fronto‐parietal areas, insular cortex, hippocampal regions, basal ganglia along with cerebellar vermis and hemispheres play a role in MI of gait [Iseki et al.,2008; Jahn et al.,2004,2008; Malouin et al.,2003; Sacco et al.,2006; Wang et al.,2008]. This widespread activation pattern has been related to the multiple brain processes presumably engaged during this task.
In our study, subjects were asked to imagine themselves walking at a high pace in a visual and kinesthetic way. Results of an fMRI study suggest that visual and kinesthetic imagery engage different brain areas. In that study, motor‐associated regions and IPL were preferentially activated in kinesthetic mental imagery, whereas increased SPL activity was preferentially associated with visual mental imagery [Guillot et al.,2009]. The general pattern of brain activation we found (see Fig. 2) is consistent with the suggestion that subjects performed the mental locomotor task in both kinesthetic and visual ways.
Since brisk walking presumably involves more cognitive control than comfortable walking or running, we postulated that this task should boost the activity of brain areas that control high order aspects of gait. Comfortable walking has traditionally been considered as an automatic activity without the involvement of cognitive processing [Cherng et al.,2007]. Previous fMRI studies of automatic movements showed that the learning phase of a task performed while doing a mental dual task was associated with a greater activity in cerebellar hemispheres along with a wider cortical activity pattern than when the motor task became automatic [Floyer‐Lea and Matthews,2004; Hanakawa et al.,2003; Wu et al.,2004]. Although the present results suggest a strong cortical activation during MI of brisk walking, the design of the study did not allow us to find regions that are specific for brisk walking as compared with comfortable walking, and this is the topic of an ongoing study.
A novel finding in our study is a hemispheric specialization of brain areas involved in the control of brisk walking. This is supported by two independent analyses: a correlation analysis between brain activity and IWS and a LI analysis of brain activation. In both analyses, the preferential involvement of right fronto‐parietal areas and left cerebellum during MI of brisk walking occurred over and above that in the 2 control conditions, namely MI of standing and lying.
The right hemispheric specialization during MI of brisk walking differs from other fMRI studies which showed a left hemispherical dominance in locomotion imagery tasks [Jahn et al.,2008; Malouin et al.,2003; Sacco et al.,2006; Wagner et al.,2008]. This apparent discrepancy could be explained by differences in the task paradigm between studies. Right hemisphere is particularly involved in visuo‐spatial attention [Foxe et al.,2003]. The vivid rehearsal of a fast‐moving visual environment required by our paradigm may contribute to a right lateralization of fronto‐parietal activations found in the present study. We however attempted to reduce the neural activity related to visuo‐spatial navigation by using a common “standardized” corridor. Furthermore, LI of brain activation was never formally assessed in previous studies.
The activity we found in the right DLPFC is in line with previous NIRS studies of real gait on a treadmill which showed that this area is involved in the adjustment of walking speed [Suzuki et al.,2004, 2008]. There is some evidence suggesting a close links between locomotion and prefrontal cortex (PFC) which is thought to be a supervisory system in maintaining attention during locomotion [Alexander et al.,2005]. The assumption that the DLPFC is highly involved in brisk walking is corroborated by an existing correlation between attention and executive processes subserved by the PFC [Holtzer et al.,2010].
The IPL is a visually responsive portion of the parietal cortex [Avillac et al.,2005] and thus, its recruitment during gait imagery might reflect visual predictions of walking movements. Other fMRI studies have emphasized its activation during MI of locomotion [Malouin et al.,2003; Sacco et al.,2006] or ankle flexion/extension movements [Sacco et al.,2009]. The PPC has been reported to be active during tasks involving motor imagery [Andujar et al.,2010; Ruby and Decety,2001] and its activity as well as its frontal connections increases with increasing complexity of the imagined movement [de Lange et al.,2005]. In agreement with Bakker et al. [2008], we found increased neural activity in right PPC in comparison with left PPC during MI of gait. A role for the right PPC in the control of gait is also supported by the study of Bartels and co‐workers [2006] who found a decreased glucose metabolism in this region in a population of PD patients suffering from freezing of gait (FOG) compared with a population of PD patients without FOG.
The cerebellum has previously been associated with internally simulated movement sensation during motor imagery [Naito et al.,2002]. The coupling between left cerebellum and contralateral cerebral hemisphere we found is in line with previous fMRI observations [Floyer‐Lea and Matthews,2004; Lotze et al.,1999; Naito et al.,2002; Tamada et al.,1999]. The midline cerebellar activation we found corresponds to the CLR described in humans by Jahn and co‐workers [2008]. Our finding that this region is correlated with the presumed IWS is consistent with their results. This region that regulates the speed of locomotion sends outputs to the midbrain tegmentum around the pedunculopontine nucleus (PPN) and the cuneiform nucleus that compose the MLR [Jahn et al.,2008].
As this study showed a wide pattern of cortical activity during MI of brisk walking with a presumed right lateralization, MI of brisk walking might indeed be a useful clinical tool for gait rehabilitation and maintenance of good cognitive functions in disabled people. Further behavioral and neuroimaging studies in pathological conditions, i.e. PD that combines gait and cognitive disorders, should be performed in the future.
CONCLUSION
An important finding of this study is that MI of brisk walking is preferentially controlled by processes lateralized in right fronto‐parietal regions, especially PPC and DLPFC along with left cerebellum. In humans, these regions might be a part of a higher‐level network for gait control.
Acknowledgements
JC is clinician‐researcher and GG is senior research associate at the Belgian National Fund for Scientific Research (FRS‐FNRS). The authors would like to thank Dr Marko Wilke for sharing his LI‐toolbox.
REFERENCES
- Alexander MP, Stuss DT, Shallice T, Picton TW, Gillingham S ( 2005): Impaired concentration due to frontal lobe damage from two distinct lesion sites. Neurology 65: 572–579. [DOI] [PubMed] [Google Scholar]
- Andujar JE, Lajoie K, Drew T ( 2010): A contribution of area 5 of the posterior parietal cortex to the planning of visually guided locomotion: Limb‐specific and limb‐independent effects. J Neurophysiol 103: 986–1006. [DOI] [PubMed] [Google Scholar]
- Avillac M, Deneve S, Olivier E, Pouget A, Duhamel JR ( 2005): Reference frames for representating visual and tactile locations in parietal cortex. Nat Neurosci 8: 941–949. [DOI] [PubMed] [Google Scholar]
- Bakker M, Verstappen CCP, Bloem BR, Toni I ( 2007): Recent advances in functional neuroimaging of gait. J Neural Trasm 114: 1323–1331. [DOI] [PMC free article] [PubMed] [Google Scholar]
- Bakker M, De Lange FP, Helmich RC, Scheeringa R, Bloem BR, Toni I ( 2008): Cerebral correlates of motor imagery of normal and precision gait. NeuroImage 41: 998–1010. [DOI] [PubMed] [Google Scholar]
- Bartels AL, de Jong BM, Giladi N, Schaafsma JD, Maguire PR, Veenma L, Pruim J, Balash Y, Youdim MBH, Leenders KL ( 2006): Striatal dopa and glucose metabolism in PD patients with freezing of gait. Mov Disord 21: 1326–1332. [DOI] [PubMed] [Google Scholar]
- Boly M, Coleman MR, Davis MH, Hampshire A, Bor D, Moonen G, Maquet PA, Pickard JD, Laureys S, Owen MA ( 2007): When thoughts become action: An fMRI paradigm to study volitional brain activity in non‐communicative brain injured patients. NeuroImage 36: 979–992. [DOI] [PubMed] [Google Scholar]
- Cherng RJ, Liang LY, Hwang IS, Chen JY ( 2007): The effect of a concurrent task on the walking performance in preschool children. Gait Posture 26: 231–237. [DOI] [PubMed] [Google Scholar]
- Chlebus P, Mikl M, Brazdil M, Pazourkova M, Krupa P, Rektor I ( 2007): fMRI evaluation of hemispheric dominance using various methods of laterality index calculation. Exp Brain Res 179: 365–374. [DOI] [PubMed] [Google Scholar]
- de Lange F, Hogoort P, Toni I ( 2005): Neural topography and content of movement representations. J Cogn Neurosci 17, 97–112. [DOI] [PubMed] [Google Scholar]
- Decety J, Jeannerod M, Prablanc C ( 1989): The timing of mentally represented actions. Behav Brain Res 34: 35–42. [DOI] [PubMed] [Google Scholar]
- Decety J, Perani D, Jeannerod M, Bettinardi V, Tadary B, Woods R, Mazziotta JC, Fazui F ( 1994): Mapping motor representations with positron emission tomography. Nature 371: 600–602. [DOI] [PubMed] [Google Scholar]
- Deiber MP, Ibanez V, Honda M, Sadato N, Raman R, Hallett M ( 1998): Cerebral processes related to visuomotor imagery and generation of simple finger movements studied with positron emission tomography. NeuroImage 7: 73–85. [DOI] [PubMed] [Google Scholar]
- Dobkin BH, Firestine A, West M, Saremi K, Woods R ( 2004): Ankle dorsiflexion as an fMRI paradigm to assay motor control for walking during rehabilitation. NeuroImage 23: 370–381. [DOI] [PMC free article] [PubMed] [Google Scholar]
- Dunsky A, Dickstein R, Marcovitz E, Levy S, Deutsch JE ( 2008): Home‐based motor imagery training for gait rehabilitation in people with chronic poststroke hemiparesis. Arch Phys Med Rehabil 89: 1580–1588. [DOI] [PubMed] [Google Scholar]
- Fitzpatrick AL, Buchanan, CK , Nahin RL, Deksoky ST, Atkinson HH, Carlson MC, Williamson JD ( 2007): Associations of gait speed and other measures of physical function with cognition in a healthy human cohort of elderly persons. J Gerontol A Biol Sci Med Sci 62: 1244–1251. [DOI] [PubMed] [Google Scholar]
- Floyer‐Lea A, Matthews PM ( 2004): Changing brain networks for visuomotor control with increased movement automaticity. J Neurophysiol 92: 2405–2412. [DOI] [PubMed] [Google Scholar]
- Foxe JJ, McCourt ME, Javitt DC ( 2003): Right hemisphere control of visuospatial attention: Line‐bisection judgments evaluated with high‐density electrical mapping and source analysis. NeuroImage 19: 710–726. [DOI] [PubMed] [Google Scholar]
- Genovese CR, Lazar NA, Nichols T ( 2002): Thresholding of statistical maps in functional neuroimaging using the false discovery rate. NeuroImage 15: 870–878. [DOI] [PubMed] [Google Scholar]
- Gerardin E, Sirigu A, Lehericy S, Poline JB, Gaymard B, Marsault C, Agid Y, Le Bihan D ( 2000): Partially overlapping neural networks for real and imagined hand movements. Cereb Cortex 10: 1093–1104. [DOI] [PubMed] [Google Scholar]
- Guillot A, Collet C, Nguyen VA, Malouin F, Richards C, Doyon J ( 2009): Brain activity during visual versus kinesthetic imagery: An fMRI study. Hum Brain Mapp 30: 2157–2172. [DOI] [PMC free article] [PubMed] [Google Scholar]
- Hanakawa T, Immisch I, Toma K, Dimyan MA, van Gelderen P, Hallett M ( 2003): Functional properties of brain areas associated with motor execution and imagery. J Neurophysiol 89: 989–1002. [DOI] [PubMed] [Google Scholar]
- Holtzer R, Ozelius L, Xue X, Wang T, Lipton RB, Verghese J ( 2010): Differential effects of COMT on gait and executive control in aging. Neurobiol Aging 31: 523–531. [DOI] [PMC free article] [PubMed] [Google Scholar]
- Hwang S, Jeon HS, Yi C, Kwon O, Cho S, You S ( 2010): Locomotor imagery training improves gait performance in people with chronic hemiparetic stroke: A controlled clinical trial. Clin Rehabil 24: 514–522. [DOI] [PubMed] [Google Scholar]
- Iseki K, Hanakawa T, Shinozaki J, Nankaku M, Fukuyama H ( 2008): Neural mechanisms involved in mental imagery and observation of gait. NeuroImage 41: 1021–1031. [DOI] [PubMed] [Google Scholar]
- Jahn K, Deutschländer A, Stephan T, Strupp M, Wiesmann M, Brandt T ( 2004): Brain activation patterns during imagined stance and locomotion in fMRI. NeuroImage 22: 1722–1731. [DOI] [PubMed] [Google Scholar]
- Jahn K, Deutschländer A, Stephan T, Kalla R, Wiesmann M, Strupp M, Brandt T ( 2008): Imaging human supraspinal locomotor centers in brainstem and cerebellum. NeuroImage 39: 786–792. [DOI] [PubMed] [Google Scholar]
- Lotze M, Montoya P, Erb M, Hulsmann E, Flor H, Klose U, Birbaumer N, Grodd W ( 1999): Activation of cortical and cerebellar motor areas during executed and imagined hand movements: An fMRI study. J Cogn Neurosci 11: 491–501. [DOI] [PubMed] [Google Scholar]
- Malouin F, Richards CL, Jackson PL, Dumas F, Doyon J ( 2003): Brain activations during motor imagery of locomotor‐related tasks: A PET study. Hum Brain Mapp 19: 47–62. [DOI] [PMC free article] [PubMed] [Google Scholar]
- Marple‐Horvat DE, Criado JM ( 1999): Rythmic neuronal activity in the lateral cerebellum of the cat during visually guided stepping. J Physiol 508: 595–603. [DOI] [PMC free article] [PubMed] [Google Scholar]
- Marx E, Stephan T, Nolte A, Deutschlander A, Seelos KC, Dieterich M, Brandt T ( 2003): Eye closure in darkness animates sensory systems. NeuroImage 19: 924–934. [DOI] [PubMed] [Google Scholar]
- Miyai I, Tanabe HC, Sase I, Eda H, Oda I, Konishi I, Tsunazawa Y, Suzuki T, Yanagida T, Kubota K ( 2001): Cortical mapping of gait in humans: A near infra‐red spectroscopic topography study. NeuroImage 14: 1186–1192. [DOI] [PubMed] [Google Scholar]
- Mori S, Matsui T, Kuze B, Asanome M, Nakajima K, Matsuyama K ( 1999): Stimulation of a restricted region in the midline cerebellar white matter evokes coordinated quadrupedal locomotion in the decerebrate cat. J Neurophysiol 82: 290–300. [DOI] [PubMed] [Google Scholar]
- Munzert J, Lorey B, Zentgraf K ( 2009): Cognitive motor processes: The role of motor imagery in the study of motor representations. Brain Res Rev 60: 306–326. [DOI] [PubMed] [Google Scholar]
- Naito E, Kochiyama T, Kitada R, Nakamura S, Matsumura M, Yonekura Y, Sadato N ( 2002): Internally simulated movement sensations during motor imagery activate the cortical motor areas and the cerebellum. J Neurosci 22: 3683–3691. [DOI] [PMC free article] [PubMed] [Google Scholar]
- Oldfield RC ( 1971): The assessment and analysis of handedness: The Edinburgh Inventory. Neuropsychologia 9: 97–114. [DOI] [PubMed] [Google Scholar]
- Porro CA, Francescato MP, Cettolo V, Diamond ME, Baraldi P, Zuiani C, Bazzocchi M, di Prampero PE ( 1996): Primary motor and sensory cortex activation during motor performance and motor imagery: A functional magnetic resonance imaging study. J Neurosci 16: 7688–7698. [DOI] [PMC free article] [PubMed] [Google Scholar]
- Praet SFE, van Rooij ESJ, Wijtvliet A, Boonman de Winter LJM, Enneking T, Kuuipers H, Stehouwer CDA, van Loon LJC ( 2007): Brisk walking compared with an individualized medial fitness programme for patients with type 2 diabetes: A randomized controlled trial. Diabetologia 51: 736–746. [DOI] [PMC free article] [PubMed] [Google Scholar]
- Prohaska TR, Eisenstein AR, Satariano WA, Hunter R, Bayles CM, Kurtovich E, Kealy M, Ivey SL ( 2009): Walking and the preservation of cognitive function in older populations. Gerontologist 49: S86–S93. [DOI] [PubMed] [Google Scholar]
- Ruby P, Decety J ( 2001): Effect of subjective perspective taking during simulation of action: A PET investigation of agency. Nat Neurosci 4: 546–550. [DOI] [PubMed] [Google Scholar]
- Sacco K, Cauda F, Cerliani L, Mate D, Duca S, Geminiani GC ( 2006): Motor imagery of walking following training in locomotor attention. The effect of “tango lesson”. NeuroImage 32: 1441–1449. [DOI] [PubMed] [Google Scholar]
- Sacco K, Cauda F, D'Agata F, Mate D, Duca S, Geminiani G ( 2009): Reorganization and enhanced functional connectivity of motor areas in repetitive ankle movements after training in locomotor attention. Brain Res 1297: 124–134. [DOI] [PubMed] [Google Scholar]
- Seghier ML ( 2008): Laterality index in functional MRI: Methodological issues. Magn Reson Imaging 26: 594–601. [DOI] [PMC free article] [PubMed] [Google Scholar]
- Suzuki M, Miyai I, Ono T, Oda I, Konishi I, Kochiyama T, Kubota K ( 2004): Prefrontal and premotor cortices are involved in adapting walking and running speed on the treadmill: an optical imaging study. NeuroImage 23: 1020–1026. [DOI] [PubMed] [Google Scholar]
- Tamada T, Miyauchi M, Himamizu H, Yoshioka T, Kawato M ( 1999): Cerebro‐cerebellar functional connectivity revealed by the laterality index in tool‐use learning. NeuroReport 10: 325–331. [DOI] [PubMed] [Google Scholar]
- Wagner J, Stephan T, Kalla R, Brückmann H, Strupp M, Brandt T, Jahn K ( 2008): Mind the bend: Cerebral activations associated with mental imagery of walking along a curved path. Exp Brain Res 191: 247–255. [DOI] [PubMed] [Google Scholar]
- Wang CH, Wai YY, Kuo BC, Yeh YY, Wang JJ ( 2008): Cortical control of gait in healthy human: An fMRI study. J Neural Transm 115: 1149–1158. [DOI] [PubMed] [Google Scholar]
- Whelan PJ ( 1996): Control of locomotion in the decerebrate cat. Prog Neurobiol 49: 481–515. [DOI] [PubMed] [Google Scholar]
- Wilke M, Lidzba K ( 2007): LI‐tool: A new toolbox to assess lateralization in functional MR‐data. J Neurosci Methods 163: 128–136. [DOI] [PubMed] [Google Scholar]
- Wu T, Kansaku K, Hallett M ( 2004): How self‐initiated memorized movements become automatic: A functional MRI study. J Neurophysiol 91: 1690–1698. [DOI] [PubMed] [Google Scholar]