

Abstract
Synchrony measurements of spontaneous low‐frequency blood oxygenation level‐dependent (BOLD) fluctuations are increasingly being used to investigate spatial regions of functional connectivity. Although information regarding BOLD–BOLD synchrony between different regions is frequently reported, the relationship between spontaneous activity and behavioral state, and the association of spontaneous signal synchrony and evoked response, are less well characterized. The purpose of this study is to exploit the higher signal‐to‐noise ratio and in turn available spatial resolution at 7.0 T to understand the relationship between synchrony, measured as Pearson's R value, and amplitude, measured as signal standard deviation over time, in sensorimotor cortex for four separate behavioral states: eyes closed resting (EC), eyes open fixation (EO), EO with constant right hand fist clench (EO‐F) and EO with 6 s off/6 s on (0.083 Hz) right hand finger tapping (EO‐T). BOLD (TE/TR = 25/3,000 ms; 100 time points) scans were performed in healthy volunteers (7.0 T; 4 M/3 F; right‐handed) at high spatial resolution = 1.6 × 1.6 × 1.6 mm3. Results (z > 5; P < 0.05; low‐pass filtering <0.067 Hz) reveal that synchrony is highest in the EC state (R = 0.35 ± 0.07) and reduces for EO (R = 0.26 ± 0.07), EO‐F (R = 0.23 ± 0.07; P < 0.05), and EO‐T (R = 0.12 ± 0.04; P < 0.05) conditions. Amplitude was highest in the EC condition and only reduced significantly (P < 0.05) for the EO‐T condition. Synchrony within sensorimotor cortex correlated with evoked finger‐tapping response magnitude (R = 0.81; P = 0.03), suggesting that spontaneous signal synchrony may be a predictor of evoked BOLD response magnitude and may account for intersubject variability in sensorimotor cortex. Hum Brain Mapp, 2012. © 2011 Wiley Periodicals, Inc.
Keywords: resting state network, spontaneous fluctuations, BOLD, behavioral state, motor cortex, 7 T
INTRODUCTION
Spontaneous low‐frequency blood oxygenation level‐dependent (BOLD) signal fluctuations, in the absence of specific cognitive tasks, are increasingly being used to identify spatial regions of functional connectivity [Fox and Raichle,2007]. This approach is especially promising in clinical scenarios where inadequate patient compliance prevents the administration of many tasks or stimuli, and altered BOLD connectivity has successfully been observed in a variety of neurological disorders [He et al.,2007].
Although much is known regarding the origin and synchrony of spontaneous activity between different brain regions [Boly et al.,2008; Chang and Glover,2009; Cohen et al.,2008; Fukunaga et al.,2008; Murayama et al.,2010; Smith et al.,2009], comparatively less is known quantitatively regarding the role of behavioral state on the synchrony and amplitude of spontaneous activity [Bianciardi et al.,2009; Fox et al.,2006; McAvoy et al.,2008; Yang et al.,2007]. In terms of conventional‐evoked BOLD fMRI responses, an understanding of this relationship may be important for accurate quantification of baseline signal fluctuations and for predicting magnitude variations in fMRI response [de Zwart et al.,2008; Liu et al.,2010]. Alternatively, differences in synchrony or amplitude of spontaneous activity over different behavioral states, which cannot be explained by differences in respiratory and cardiac fluctuations, may be useful for demonstrating a neuronal correlate to spontaneous BOLD activity.
It was recently demonstrated that during sedation [Kiviniemi et al.,2005] and sleep studies [Fukunaga et al.,2006; Horovitz et al.,2008], the amplitude of spontaneous activity in visual cortex was inversely correlated with the degree of alertness. In a recent quantitative study of the dependence of visual cortex spontaneous BOLD activity on behavioral state, both coherence and amplitude of spontaneous signal were found to be highest in an eyes closed (EC) resting condition and reduced in alternative conditions with the eyes open (EO) [Bianciardi et al.,2009]. Similar observations were observed over a more limited range of behavioral states in visual, sensorimotor, auditory, and retrosplenial cortex [McAvoy et al.,2008]. Using BOLD fMRI in conjunction with measurements of local field potential (LFP) (single cortical site near visual cortex) in awake monkeys at rest, a positive correlation was observed between the baseline fMRI fluctuations in cerebral cortex and the LFP, with the correlation being highest during states of reduced alertness (EC) [Scholvinck et al.,2010]. Finally, in a recent study of spontaneous and evoked activity in visual cortex, it was observed that the magnitude of the evoked fMRI response to a flashing checkerboard stimulus was correlated with the level of synchrony of resting state spontaneous BOLD activity in visual cortex [Liu et al.,2010].
Thus, correlations between spontaneous BOLD activity, behavioral state, and evoked fMRI response in the visual cortex have been observed; however, such relationships have not been investigated quantitatively to the same rigor in sensorimotor cortex. As motor cortex is the focus of many evoked fMRI investigations and motor impairment is prevalent in a variety of neurological disorders, it would be useful to understand such relationships in this region. In this study, the dependence of spontaneous BOLD signal on behavioral state is investigated in sensorimotor cortex by acquiring BOLD data for varying behavioral states and types of motor performance. Data were acquired at 7.0 T and using high spatial resolution (1.6 × 1.6 × 1.6 mm3). The purpose of this study was twofold. First, to quantify synchrony and amplitude of ongoing spontaneous BOLD fluctuations in sensorimotor cortex in the presence of four different behavioral states: EC, EO, constant right‐hand fist clench, and finger tapping. Second, to determine whether the synchrony of spontaneous BOLD fluctuations within sensorimotor cortex correlated with the magnitude of the evoked BOLD finger‐tapping response. The results of this study exploit the increased signal‐to‐noise ratio (SNR) available at 7.0 T to help elucidate the role of behavioral state on spontaneous and evoked BOLD contrast in motor cortex.
METHODS
All volunteers (n = 7; 4 males/3 females; age = 26 ± 4 years; right‐handed) provided informed, written consent, and were scanned at 7.0 T (Philips Medical Systems, Best, The Netherlands).
Experiment
First, a whole‐brain B0 map was acquired, which was used for third order tissue‐based shimming after brain extraction using the FMRIB software library (FSL) brain extraction tool [Smith,2002; Wilson et al.,2002]. This approach was found to provide improved shimming over the brain region while avoiding shim bias in scalp and nasal cavities that were not of interest in the present study.
Second, four separate behavioral states were investigated for each volunteer: (1) awake with EC, (2) EO with cross‐hair fixation (EO), (3) EO with cross‐hair fixation + constant right hand fist clench (EO‐F), and (4) EO 6 s/6 s off/on (frequency = 0.083 Hz) right‐handed finger tapping (EO‐T). Note that the 0.083 Hz finger tapping corresponds to the off/on frequency (6 s off/6 s on); the frequency of tapping during the on periods was ∼1 Hz. Considering that the rest scans (EC and EO) are intended to be representative of a control baseline condition, the motor tasks were presented in advance to ensure that subjects would be in a state of rest and not in anticipation of a task. During all behavioral states, cardiac and respiratory traces were recorded using pulse oximetry and a respiratory bellow. For each condition, a BOLD scan was acquired with radiofrequency volume coil transmit and 16‐channel head coil receive. Scan parameters: gradient echo single‐shot echo planar imaging, field of view = 216 × 192 mm2, slices = 33, sensitivity encoding (SENSE) factor = 3.0, TR/TE = 3000/25 ms, spatial resolution = 1.6 × 1.6 × 1.6 mm3, and time points = 100. TE = 25 ms chosen given the expected tissue T2* at 7.0 T [Duong et al.,2003; Zhao et al.,2007].
All images were corrected for motion, baseline drift, and were co‐registered using FSL routines [Jenkinson et al.,2002]. Baseline drift was corrected for by normalizing the timecourses to a third‐order polynomial fit, as has recently been described [Bianciardi et al.,2009]. Retrospective correction for cardiac and respiratory noise contributions was applied for each behavioral state [Glover et al.,2000]. No spatial smoothing was applied.
Analysis I: The Dependence of Spontaneous Activity on Behavioral State
A multistep approach was implemented to quantify the synchrony and amplitude of the spontaneous signal fluctuations for the different behavioral states. To provide a controlled comparison with quantitative values obtained in visual cortex, the analysis steps employed here generally reflect the procedure used in a similar study [Bianciardi et al.,2009].
Specifically, to characterize evoked responses, BOLD finger‐tapping data were high‐pass filtered (removing frequencies < 0.083 Hz) after which evoked activation maps (z > 5.0) and corresponding timecourses were calculated. For analysis, the FSL Expert Analysis Tool was used to perform a general linear model analysis with a box car regressor matching the specified task convolved with the default gamma hemodynamic response function with width of 3 s [Smith et al.,2004]. The signal change between baseline and activated time periods was recorded as the magnitude of the evoked response. Although the majority of activation was found in the left sensorimotor cortex as expected for the right‐hand finger‐tapping task, in some volunteers, small regions of evoked activation were also found in right sensorimotor cortex. Second, a 30‐component ICA decomposition was performed on all unfiltered data [Beckmann and Smith,2004]. The ICA analysis was chosen strictly for identifying the approximate boundaries of sensorimotor cortex. From the ICA decomposition, a mask was generated that included voxels in sensorimotor cortex for all four behavioral states. The choice of the appropriate independent components was guided by the Juelich Histological Atlas of sensorimotor cortex and was clear in each volunteer (see Results section). The dimensionality of the ICA decomposition was restricted to 30, so that the sensorimotor cortex would not be divided into a large array of subnetworks. However, in all but two subjects, left and right sensorimotor network were separately detected; in such cases, both networks were used for the sensorimotor mask. Third, the evoked mask was subtracted from the ICA‐derived sensorimotor mask to generate a so‐called residual sensorimotor mask, which included regions of the sensorimotor cortex that did not show activation in the finger‐tapping task. Therefore, at this step, two regions (evoked mask and residual sensorimotor mask) within the sensorimotor cortex were identified from which synchrony statistics could be performed. Fourth, filtering with a Gaussian linear low‐pass filter at 0.067 Hz was applied to all data to remove contributions from the 0.083 Hz evoked activity in the finger tapping (EO‐T) condition and to allow for uniform preprocessing in all data. The removal of evoked activity in the finger‐tapping tasks was confirmed by re‐running the fMRI analysis on the low‐pass filtered data and confirming that the activation was absent in all subjects. Activation was confirmed absent when no activated voxels were detected in the filtered data. Fifth, synchrony (measured as Pearson correlation coefficient, R) and amplitude (measured as standard deviation over time) of the spontaneous signal were calculated by comparing low‐pass‐filtered timecourses from the evoked mask and the residual sensorimotor ICA‐derived mask for each behavioral state. For synchrony measurements, the mean evoked mask timecourse was compared to the timecourse of each voxel in the residual sensorimotor mask. The mean synchrony +/− standard deviation was recorded. Note that the same masks were used for all behavioral states for each subject.
Analysis II: The Relationship Between Spontaneous and Evoked Activity
An additional aim of this study was to understand any possible relationship between synchrony within the sensorimotor cortex and the magnitude of evoked BOLD finger‐tapping response. Here, the synchrony (Pearson correlation coefficient, R) from the above analysis was plotted against the magnitude of the 0.083 Hz finger‐tapping response for each subject. The relationship was investigated for each behavioral state. Linear regression was performed to assess significance; linear regression R and associated P (two‐tailed) values were recorded.
Alternative Analysis Procedures
The approaches described earlier used a relatively strict z‐threshold (z > 5.0) for the identification of the evoked activation mask. As this will omit activated areas with a smaller significance level, we additionally analyzed data using z > 2.3. Two additional variants of analysis were also performed. First, we measured synchrony both on a voxel‐by‐voxel basis as described earlier (i.e., mean timecourse in evoked region compared to each voxel timecourse in residual sensorimotor region) and on a mean voxel basis (i.e., mean timecourse in evoked region compared to mean timecourse in residual sensorimotor region). Note that the former approach is potentially more sensitive to smaller variations, yet does not have the SNR of the latter approach. Second, it is possible that interesting information regarding both synchrony and amplitude may be discarded by applying the 0.067 Hz low‐pass filter, which was necessary to remove the evoked finger‐tapping frequency. Therefore, we additionally processed the data without applying such low‐pass filtering. In this approach, the finger‐tapping data were not analyzed owing to contamination from the 0.083 Hz finger tapping. In summary, eight different approaches for mask determination and data preprocessing were used (Table I). Method 1A, which was described earlier in the Analysis I section, was the primary approach of interest; however, for completeness, results from alternative methods are presented as well.
Table I.
Different analysis approaches for synchrony and amplitude calculations
| Z‐statistic for evoked mask determination | Residual mask timecourse calculation approach | Low‐pass (0.067 Hz) filtering Applied | |
|---|---|---|---|
| Method 1A | 5.0 | Voxel‐by‐voxel | Yes |
| Method 1B | 5.0 | Mean | Yes |
| Method 1C | 2.3 | Voxel‐by‐voxel | Yes |
| Method 1D | 2.3 | Mean | Yes |
| Method 2A | 5.0 | Voxel‐by‐voxel | No |
| Method 2B | 5.0 | Mean | No |
| Method 2C | 2.3 | Voxel‐by‐voxel | No |
| Method 2D | 2.3 | Mean | No |
Note that only synchrony values will be different for mean versus voxel‐by‐voxel residual mask approaches; the amplitude will be identical for both cases.
RESULTS
No statistically significant mean variations in either cardiac or respiratory rate were found between the different behavioral states, suggesting that respiratory and cardiac rates were similar across each of the reasonably simple tasks.
Figure 1 shows a 30‐dimensional ICA decomposition for a single volunteer (EC condition). Regions of the left and right sensorimotor cortex can be identified (green, red, and yellow), in addition to subcomponents of the visual cortex (blue and purple). Additional components could be identified on a single‐subject basis; however, the focus of this study was specifically the sensorimotor cortex. Image distortions at 7.0 T were found not to be a confounding source of error in this region.
Figure 1.

7.0T ICA decomposition of BOLD data for a single subject during the eyes closed behavioral state (30 of 33 slices shown). The cool colors (blue and purple) show subcomponents of the visual network whereas the warmer colors (green, red, and yellow) show regions of the sensorimotor network. [Color figure can be viewed in the online issue, which is available at wileyonlinelibrary.com.]
Figure 2a shows a representative slice with the evoked activation map overlaid. Figure 2b shows the corresponding 6 s off/6 s on finger‐tapping timecourse with data shown in red and regressor shown in black. The 0.083 Hz finger tapping is clearly discernable in the data.
Figure 2.

A representative single slice of the evoked activation map (a) with corresponding timecourse (red) and hemodynamic response function regressor (black) (b). The timecourse data have a well‐defined frequency owing to the 6 s off/6 s on finger‐tapping task. [Color figure can be viewed in the online issue, which is available at wileyonlinelibrary.com.]
Figure 3 shows two representative slices for each subject depicting the residual activation map (blue) and evoked activation region (red). The evoked region is colored by z‐score, with z > 5 or z > 2.3 being used depending on the specific analysis method (see Table I).
Figure 3.

Two representative slices of the evoked (red) and residual sensorimotor mask (blue) for all seven subjects. [Color figure can be viewed in the online issue, which is available at wileyonlinelibrary.com.]
Figure 4a shows representative slices from a single subject. Figure 4b (signal vs. time) shows the EO‐T timecourse (gray); the 0.083 Hz finger tapping, which was subsequently removed by low‐pass filtering (red) is clearly visible. Figure 4c–f shows representative evoked mask (red) and residual sensorimotor cortex mask (blue) timecourses (signal vs. time) for a representative subject for each behavioral condition. The EC task contains the highest coherence, with the other three behavioral states showing reductions in coherence.
Figure 4.
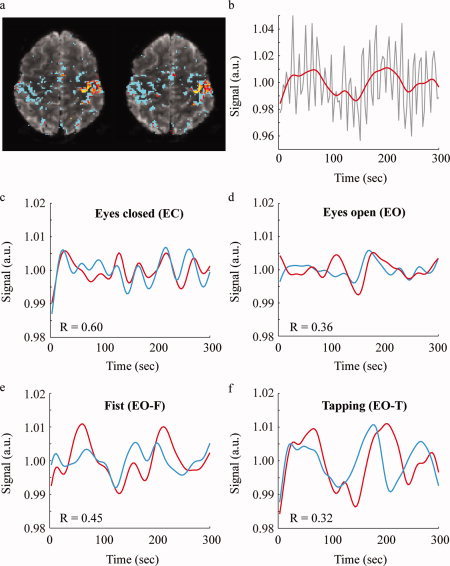
(a) Representative evoked activity map for a single subject for the 0.083 Hz right‐hand finger‐tapping task containing the evoked sensorimotor cortex mask (red) and ICA‐derived residual sensorimotor cortex mask (blue), which were used for the synchrony and amplitude analysis. (b) Corresponding evoked activity timecourse with (red) and without (gray) 0.067 Hz low‐pass filtering. Timecourses and corresponding synchrony values (R) for a representative subject for the evoked and residual regions of the sensorimotor cortex for the eyes closed (EC; c), eyes open, EO (d), constant fist clench, EO‐F (e), and finger tapping, EO‐T (f) behavioral conditions. Synchrony is highest for the EC condition. Standard error over all voxels is very small (<0.0001) owing to the large number of voxels in the masks (activated mask = 427; residual mask = 1096). [Color figure can be viewed in the online issue, which is available at wileyonlinelibrary.com.]
Figure 5 shows group results (* denotes P < 0.05 compared to EC) for analysis according to Method 1A. Synchrony is highest in the EC state (R = 0.35 ± 0.07) and reduces for EO (R = 0.26 ± 0.07), EO‐F (R = 0.23 ± 0.07; P < 0.05), and EO‐T (R = 0.12 ± 0.04; P < 0.05) conditions. A similar, yet less robust trend, is found for the amplitude analysis (Fig. 5b). For the amplitude comparison (activated regions shown here), only EO‐T is significantly different (P = 0.01) from EC amplitude. Results from all analysis approaches are shown in Tables II (synchrony) and Table III (amplitude). Note that the general trends persist regardless of approach, with the numbers and significance levels varying slightly. For amplitude results, in most cases, the amplitude does reduce slightly going from the EC to the motor tasks; however, this generally does not reach statistical significance. Additionally, the amplitude trends are similar regardless of whether the residual motor regions or evoked regions are analyzed.
Figure 5.
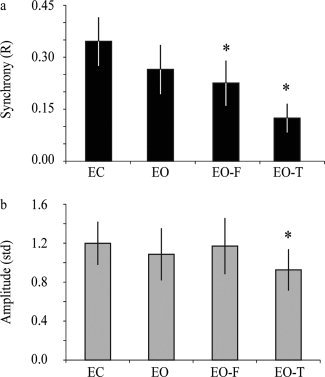
Subject‐averaged synchrony and amplitude (evoked activation mask region) values for the four different behavioral states for Method 1A. *Denotes P < 0.05 relative to the eyes closed condition.
Table II.
Synchrony (Pearson's R) values for different behavioral states
| Eyes closed (EC) | Eyes open (EO) | Eyes open fist (EO‐F) | Eyes open tapping EO‐T) | |
|---|---|---|---|---|
| Low‐pass filtering (BPTF < 0.067 Hz) | ||||
| Method 1A (z = 5; voxel‐by‐voxel) | 0.35 ± 0.07 | 0.26 ± 0.07 | 0.23 ± 0.07a | 0.12 ± 0.04a |
| Method 1B (z = 5; mean) | 0.73 ± 0.07 | 0.49 ± 0.24 | 0.51 ± 0.10 | 0.49 ± 0.11 |
| Method 1C (z = 2.3; voxel‐by‐voxel) | 0.30 ± 0.10 | 0.13 ± 0.06 | 0.11 ± 0.05a | 0.07 ± 0.04a |
| Method 1D (z = 2.3; mean) | 0.68 ± 0.10 | 0.36 ± 0.14 | 0.07 ± 0.21a | 0.26 ± 0.17a |
| No low‐pass filtering | ||||
| Method 2A (z = 5; voxel‐by‐voxel) | 0.29 ± 0.05 | 0.25 ± 0.05 | 0.17 ± 0.04a | N/A |
| Method 2B (z = 5; mean) | 0.70 ± 0.06 | 0.64 ± 0.09 | 0.48 ± 0.06a | N/A |
| Method 2C (z = 2.3; voxel‐by‐voxel) | 0.26 ± 0.06 | 0.14 ± 0.05 | 0.10 ± 0.04a | N/A |
| Method 2D (z = 2.3; mean) | 0.65 ± 0.10 | 0.41 ± 0.11a | 0.26 ± 0.12a | N/A |
Denotes significance (P < 0.05) when compared with the eyes closed condition.
Table III.
Amplitude (standard deviation over time) values for different behavioral states
| Eyes closed (EC) | Eyes open (EO) | Eyes open fist (EO‐F) | Eyes open tapping EO‐T) | |
|---|---|---|---|---|
| Low‐pass filtering (BPTF < 0.067 Hz) | ||||
| Method 1A(z = 5; voxel‐by‐voxel) | 0.012 ± 0.005 | 0.011 ± 0.007 | 0.012 ± 0.009 | 0.011 ± 0.008 |
| 0.012 ± 0.002 | 0.011 ± 0.003 | 0.012 ± 0.003 | 0.009 ± 0.002a | |
| Method 1B (z = 5; mean) | 0.012 ± 0.005 | 0.011 ± 0.007 | 0.012 ± 0.009 | 0.011 ± 0.008 |
| 0.012 ± 0.002 | 0.011 ± 0.003 | 0.012 ± 0.003 | 0.009 ± 0.002a | |
| Method 1C (z = 2.3; voxel‐by‐voxel) | 0.017 ± 0.002 | 0.018 ± 0.003 | 0.020 ± 0.003 | 0.017 ± 0.002 |
| 0.016 ± 0.002 | 0.015 ± 0.003 | 0.016 ± 0.003 | 0.014 ± 0.002 | |
| Method 1D (z = 2.3; mean) | 0.017 ± 0.002 | 0.018 ± 0.003 | 0.020 ± 0.003 | 0.017 ± 0.002 |
| 0.016 ± 0.002 | 0.015 ± 0.003 | 0.016 ± 0.003 | 0.014 ± 0.002 | |
| No low‐pass filtering | ||||
| Method 2A (z = 5; voxel‐by‐voxel) | 0.030 ± 0.004 | 0.029 ± 0.004 | 0.030 ± 0.004 | N/A |
| 0.026 ± 0.001 | 0.024 ± 0.002 | 0.025 ± 0.002 | ||
| Method 2B (z = 5; mean) | 0.030 ± 0.004 | 0.029 ± 0.004 | 0.030 ± 0.004 | N/A |
| 0.026 ± 0.001 | 0.024 ± 0.002 | 0.025 ± 0.002 | ||
| Method 2C (z = 2.3; voxel‐by‐voxel) | 0.038 ± 0.004 | 0.041 ± 0.006 | 0.042 ± 0.005 | N/A |
| 0.035 ± 0.003 | 0.032 ± 0.002 | 0.034 ± 0.003 | ||
| Method 2D (z = 2.3; mean) | 0.038 ± 0.004 | 0.041 ± 0.005 | 0.042 ± 0.005 | N/A |
| 0.035 ± 0.003 | 0.032 ± 0.002 | 0.034 ± 0.003 | ||
Denotes significance (P < 0.05) when compared with the eyes closed condition. Values in bold fonts indicate evoked region. Nonbold font indicates residual sensorimotor region.
Figure 6 shows the relationship between the mean synchrony (Method 1A: Fig. 6a; Method 2A: Fig. 6b) and mean amplitude (Method 1A: Fig. 6c; Method 2A: Fig. 6d) within the motor cortex versus magnitude of the evoked response. 95% confidence intervals are shown in gray. A clear and significant correlation is observed for the relationship between synchrony and evoked response (R = 0.81; P = 0.03) in Method 1A, yet this relationship is not maintained to the same extent when the amplitude and the evoked response (Fig. 6c; R = 0.54; P = 0.21) is considered. When an identical z‐statistic is used, yet low‐pass filtering is not applied (Method 2A), the relationship between the synchrony and evoked response reduces (Fig. 6b), yet the relationship between the amplitude and evoked response becomes stronger (Fig. 6d). The plots depict the mean synchrony over all behavioral states; however, trends were found between synchrony for each behavioral state and magnitude evoked response as well (Method 1A): EC (R = 0.67; P = 0.10), EO (R = 0.56; P = 0.19), EO‐F (R = 0.69; P = 0.08), and EO‐T (R = 0.76; P = 0.05). For amplitude, the correlation found was also always positive, however with much reduced significance. Evoked region: EC (R = 0.16; P = 0.73), EO (R = 0.13; P = 0.78), EO‐F (R = 0.18; P = 0.70), EO‐T (R = 0.11; P = 0.81); residual sensorimotor region: EC (R = 0.14; P = 0.76), EO (R = 0.17; P = 0.72), EO‐F (R = 0.15; P = 0.75), and EO‐T (R = 0.20; P = 0.67). Table IV shows all correlation values, which describe the strength of the relationship between the baseline synchrony or amplitude and the magnitude of the evoked finger‐tapping response. In general, the relationship between synchrony and evoked response is strongest when low‐pass filtering is applied, whereas the relationship between amplitude and evoked response is strongest when no filtering is applied. The relationship between synchrony and evoked response is weakest when using the filtered data for the z > 2.3 and voxel‐by‐voxel timecourse approach (Method 1C), likely owing to low SNR in this specific approach.
Figure 6.
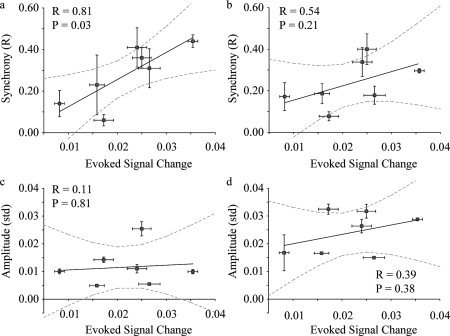
Regression analysis of baseline synchrony (R) versus magnitude of evoked finger‐tapping response for filtered (a; Method 1A) and unfiltered data (b; Method 2A). Regression analysis of baseline amplitude (evoked region) versus magnitude of evoked finger‐tapping response for filtered (c; Method 1A) and unfiltered (d; Method 2A) data. Values are mean over the EC, EO, and EO‐F behavioral states (EO‐T omitted due to lack of filtering applied in Method 2). Vertical error bars depict standard error over three behavioral states and horizontal error bars depict standard error of magnitude response over all blocks of the 6 s off/6 s on finger tapping. A significant correlation is found between synchrony and magnitude of evoked response when filtered data are analyzed, yet no relationship is found between amplitude and magnitude of evoked response. The correlation reduces for the synchrony (b), yet increases for the amplitude (d), when unfiltered data are analyzed.
Table IV.
Correlation (R) between evoked signal change and baseline synchrony and amplitude
| Synchrony | Amplitude (Evoked Region) | Amplitude (Residual Sensorimotor Region) | |
|---|---|---|---|
| Method 1A (z = 5; voxel‐by‐voxel) | R = 0.81 | R = 0.11 | R = 0.15 |
| Method 1B (z = 5; mean) | R = 0.59 | R = 0.11 | R = 0.15 |
| Method 1C (z = 2.3; voxel‐by‐voxel) | R = 0.25 | R = 0.06 | R = 0.13 |
| Method 1D (z = 2.3; mean) | R = 0.81 | R = 0.06 | R = 0.13 |
| Method 2A (z = 5; voxel‐by‐voxel) | R = 0.54 | R = 0.39 | R = 0.38 |
| Method 2B (z = 5; mean) | R = 0.17 | R = 0.39 | R = 0.38 |
| Method 2C (z = 2.3; voxel‐by‐voxel) | R = 0.14 | R = 0.32 | R = 0.16 |
| Method 2D (z = 2.3; mean) | R = 0.41 | R = 0.32 | R = 0.16 |
Synchrony and amplitude values used here are averages over EC, EO, EO‐F (EO‐T omitted to allow for comparison between both filtered (Method 1), and nonfiltered (Method 2) analysis approaches.
Given the strong correlation between the magnitude of the evoked response and the synchrony values, we attempted to determine whether introducing the baseline synchrony as a covariate in a general linear model would account for some variation of the mean evoked response between volunteers. This was achieved using the FSL tool FMRIB's linear analysis of mixed effects and modeling the evoked response as a linear combination of the mean finger‐tapping BOLD signal change and the baseline synchrony value [Woolrich et al.,2009]. A z‐statistic of 2.7 (Method 1A) was found for the synchrony parameter, thereby suggesting that the synchrony measure is significant (P < 0.01) at explaining variation in the intersubject mean.
DISCUSSION
The results of this study reveal trends regarding the synchrony of spontaneous activity in sensorimotor cortex and the dependence of this synchrony on behavioral state.
First, synchrony in sensorimotor cortex is reduced during EO tasks relative to an EC condition, with this finding being most pronounced in the fist clench and finger‐tapping conditions. A small amplitude reduction was similarly observed in the finger‐tapping condition relative to the amplitude in the EC condition; however, this finding was much less well pronounced than the synchrony observation. These findings were observed in the absence of any statistically significant variation in the amplitude of the respiratory or cardiac traces between behavioral states. Therefore, underlying and ongoing low‐frequency BOLD fluctuations in sensorimotor cortex appear to be highest in synchrony when the brain is in a state of reduced motor activity relative to increased motor activity (e.g., resting vs. fist clench or finger tapping).
Second, we observed a significant correlation between the mean synchrony of the spontaneous activity and the magnitude of the evoked finger‐tapping response when a strict activation criteria (z > 5.0) was used in conjunction with low‐pass 0.067 Hz filtering. No significant relationship between mean amplitude and the magnitude of the evoked response was found; however, positive trends were found here as well. This supports the conclusion that differences in baseline synchrony within the sensorimotor cortex are linked to the magnitude of the evoked hemodynamic response. Furthermore, it was possible to explain intersubject variations in the mean evoked finger‐tapping response by introducing the baseline synchrony as a covariate in a general linear model.
Behavioral State Literature
It is useful to consider the present findings in the context of the existing behavioral state literature. Similar findings of reduced synchrony and amplitude have been observed using BOLD [Bianciardi et al.,2009; McAvoy et al.,2008] and EEG [Buzsaki and Draguhn,2004] applied to EC versus EO behavioral states. We observed only a small reduction in amplitude during the EO conditions, suggesting that synchrony in sensorimotor cortex may be more sensitive to behavioral state than amplitude or that the synchrony dependence on behavioral state may be stronger than the amplitude dependence. Upon analyzing the power spectral density of BOLD fMRI signal in humans, it was shown that correlations of low‐frequency spectral density between motor regions reduced during a finger‐tapping task relative to a resting condition [Duff et al.,2008], which is consistent with the findings in this study. Following an analysis of multiple brain regions, it has been observed [McAvoy et al.,2008] that only sensorimotor, auditory, visual cortex, and retrosplenial cortex showed trends of increased BOLD activity for EC conditions relative to EO conditions, suggesting that the findings in this study, and those observed previously in visual cortex [Bianciardi et al.,2009], may only be applicable to specific brain networks. Given these findings, evoked fMRI analyses may explain some uncertainty in intersubject variations and possibly improve the statistical certainty by incorporating adjustments in spontaneous activity between task and baseline; indeed, methods for accounting for such effects have been proposed [de Zwart et al.,2008].
We observed that the degree of synchrony between evoked and residual sensorimotor cortex was statistically correlated with the magnitude of the evoked BOLD finger‐tapping response. A similar effect was previously observed in a simultaneous study of event related and spontaneous activity in human motor cortex, in which it was shown that coherent spontaneous BOLD fluctuations may account for some variability in the evoked BOLD response [Fox et al.,2006]. In a recent preliminary report, a correlation was observed in visual cortex between the level of synchrony of spontaneous activity (EO with fixation) and the amplitude of the evoked signal change in response to a flashing checkerboard stimulus [Liu et al.,2010]. As in the present study, no significant relationship was found between the amplitude of the spontaneous activity and the evoked response.
Neurophysiological Implications
The relationship between baseline synchrony and evoked fMRI response magnitude is intriguing as it suggests that intersubject variability in BOLD response may be partially explained by differences in ongoing spontaneous activity. The findings of this study are additionally useful as the sources of the spontaneous activity and evoked response form part of a spatially distinct yet functionally connected network, thereby reducing the likelihood that such an occurrence is an artifactual effect resulting from similar spatial location within the coil or from vascular motion. Therefore, the synchrony of ongoing BOLD fluctuations, and corresponding brain activity, may have a predictive role for hemodynamic response magnitude. On a fundamental neurophysiological level, this observation suggests that ongoing coherent spontaneous brain activity may be related to task performance at some level.
As has previously been suggested [Fox et al.,2006], variability in the evoked BOLD response both within subjects (on a trial‐by‐trial basis) and between subjects may be attributed to differences in both individual performance and perception. As spontaneous BOLD fluctuations may account for some such variability, it is reasonable to suggest that spontaneous BOLD fluctuations may account for some variability in human behavior and performance. The mechanism for this possibility is beyond the scope of this study; however, it is known that the details of neurovascular coupling vary on a subject‐by‐subject basis [Donahue et al.,2009], which could lead to differences in regards to the MR signal synchrony and amplitude in functional networks. Unraveling the nature of these relationships may be the basis of future studies.
One additional finding of this study pertains to the robustness of the ICA maps obtained from the high spatial resolution 7.0 T data. We were able to discern right and left sensorimotor cortex clearly on a single‐subject basis without the aid of spatial smoothing or complex multisubject regression approaches. This suggests that 7.0 T may be a promising field strength for identifying single‐subject connectivity variations in the future.
Technical Limitations
Several limitations of the current study should be considered as well. First, the sensorimotor cortex masks were defined based on ICA decomposition and statistical thresholding of the evoked activation map. Differences in z‐threshold will lead to slightly different activation maps including different spatial regions of the sensorimotor network and possibly surrounding networks as well. Here, we used a range of criteria for determining the different mask regions (Table I) and observed similar trends (yet with different significance levels) regardless of threshold used. However, different choices for thresholds will lead to slightly different spatial maps and correspondingly different synchrony and amplitude measurements. Second, the focus of the current study was to investigate synchrony and amplitude in sensorimotor cortex. Therefore, measurements were not made between different brain regions and independent networks. Understanding how internetwork synchronies are influenced by behavioral state may therefore be of interest and a future study with a wider scope may be useful for addressing such relationships. Third, the population studied in the present study was reasonably small (n = 7), and a larger study incorporating additional volunteers and brain regions would be useful for reinforcing the statistical weight of the current findings and also for shedding light on findings that were found to be on the border of significance in the present study. Given the consistent positive trends between evoked response and baseline signal amplitude, it is also likely that by incorporating additional subjects this finding will reach significance. Fourth, we observed trends of reduced synchrony in resting EO relative to EO behavioral states, however, did not observe a clear trend in the amplitude of the signal. This may be due to the spatial separation of right and left sensorimotor cortex and different proximities to the receiver coil or simply to a smaller correlation here which is not significant for such a small sample size. Finally, we investigated negative‐evoked BOLD responses during the finger‐tapping task in a subgroup of the volunteers and found that the number of voxels meeting the negative activation criteria was very small relative to the large number of voxels in the residual sensorimotor mask. Therefore, it is not anticipated that negatively activated voxels will cause an overwhelming confound in this study; however, future investigations of negative BOLD effects and synchrony/amplitude would certainly be of interest and a logical extension of this work.
CONCLUSION
In conclusion, (i) we exploited the high SNR available at 7.0 T to demonstrate that synchrony, and to a lesser extent amplitude, is influenced by behavioral state in sensorimotor cortex and (ii) that the synchrony of spontaneous activity in sensorimotor cortex is statistically related to the magnitude of the evoked BOLD response in sensorimotor cortex. Both findings are expected to provide a basis for further understanding intersubject variations in evoked BOLD experiments and additionally for further identifying the nature of spontaneous brain fluctuations.
Acknowledgements
We are grateful to James Pekar, Richard Edden, Suresh Joel and Molly Bright for helpful conversations.
REFERENCES
- Beckmann CF, Smith SM ( 2004): Probabilistic independent component analysis for functional magnetic resonance imaging. IEEE Trans Med Imaging 23: 137–152. [DOI] [PubMed] [Google Scholar]
- Bianciardi M, Fukunaga M, van Gelderen P, Horovitz SG, de Zwart JA, Duyn JH ( 2009): Modulation of spontaneous fMRI activity in human visual cortex by behavioral state. Neuroimage 45: 160–168. [DOI] [PMC free article] [PubMed] [Google Scholar]
- Boly M, Phillips C, Tshibanda L, Vanhaudenhuyse A, Schabus M, Dang‐Vu TT, Moonen G, Hustinx R, Maquet P, Laureys S ( 2008): Intrinsic brain activity in altered states of consciousness: How conscious is the default mode of brain function? Ann NY Acad Sci 1129: 119–129. [DOI] [PMC free article] [PubMed] [Google Scholar]
- Buzsaki G, Draguhn A ( 2004): Neuronal oscillations in cortical networks. Science 304: 1926–1929. [DOI] [PubMed] [Google Scholar]
- Chang C, Glover GH ( 2009): Relationship between respiration, end‐tidal CO2, and BOLD signals in resting‐state fMRI. Neuroimage 47: 1381–1393. [DOI] [PMC free article] [PubMed] [Google Scholar]
- Cohen AL, Fair DA, Dosenbach NU, Miezin FM, Dierker D, Van Essen DC, Schlaggar BL, Petersen SE ( 2008): Defining functional areas in individual human brains using resting functional connectivity MRI. Neuroimage 41: 45–57. [DOI] [PMC free article] [PubMed] [Google Scholar]
- de Zwart JA, Gelderen P, Fukunaga M, Duyn JH ( 2008): Reducing correlated noise in fMRI data. Magn Reson Med 59: 939–945. [DOI] [PMC free article] [PubMed] [Google Scholar]
- Donahue MJ, Blicher JU, Ostergaard L, Feinberg DA, MacIntosh BJ, Miller KL, Gunther M, Jezzard P ( 2009): Cerebral blood flow, blood volume, and oxygen metabolism dynamics in human visual and motor cortex as measured by whole‐brain multi‐modal magnetic resonance imaging. J Cereb Blood Flow Metab 29: 1856–1866. [DOI] [PubMed] [Google Scholar]
- Duff EP, Johnston LA, Xiong J, Fox PT, Mareels I, Egan GF ( 2008): The power of spectral density analysis for mapping endogenous BOLD signal fluctuations. Hum Brain Mapp 29: 778–790. [DOI] [PMC free article] [PubMed] [Google Scholar]
- Duong TQ, Yacoub E, Adriany G, Hu X, Ugurbil K, Kim SG ( 2003): Microvascular BOLD contribution at 4 and 7 T in the human brain: Gradient‐echo and spin‐echo fMRI with suppression of blood effects. Magn Reson Med 49: 1019–1027. [DOI] [PubMed] [Google Scholar]
- Fox MD, Raichle ME ( 2007): Spontaneous fluctuations in brain activity observed with functional magnetic resonance imaging. Nat Rev Neurosci 8: 700–711. [DOI] [PubMed] [Google Scholar]
- Fox MD, Snyder AZ, Zacks JM, Raichle ME ( 2006): Coherent spontaneous activity accounts for trial‐to‐trial variability in human evoked brain responses. Nat Neurosci 9: 23–25. [DOI] [PubMed] [Google Scholar]
- Fukunaga M, Horovitz SG, van Gelderen P, de Zwart JA, Jansma JM, Ikonomidou VN, Chu R, Deckers RH, Leopold DA, Duyn JH ( 2006): Large‐amplitude, spatially correlated fluctuations in BOLD fMRI signals during extended rest and early sleep stages. Magn Reson Imaging 24: 979–992. [DOI] [PubMed] [Google Scholar]
- Fukunaga M, Horovitz SG, de Zwart JA, van Gelderen P, Balkin TJ, Braun AR, Duyn JH ( 2008): Metabolic origin of BOLD signal fluctuations in the absence of stimuli. J Cereb Blood Flow Metab 28: 1377–1387. [DOI] [PubMed] [Google Scholar]
- Glover GH, Li TQ, Ress D ( 2000): Image‐based method for retrospective correction of physiological motion effects in fMRI: RETROICOR. Magn Reson Med 44: 162–167. [DOI] [PubMed] [Google Scholar]
- He BJ, Shulman GL, Snyder AZ, Corbetta M ( 2007): The role of impaired neuronal communication in neurological disorders. Curr Opin Neurol 20: 655–660. [DOI] [PubMed] [Google Scholar]
- Horovitz SG, Fukunaga M, de Zwart JA, van Gelderen P, Fulton SC, Balkin TJ, Duyn JH ( 2008): Low frequency BOLD fluctuations during resting wakefulness and light sleep: A simultaneous EEG‐fMRI study. Hum Brain Mapp 29: 671–682. [DOI] [PMC free article] [PubMed] [Google Scholar]
- Jenkinson M, Bannister P, Brady M, Smith S ( 2002): Improved optimization for the robust and accurate linear registration and motion correction of brain images. Neuroimage 17: 825–841. [DOI] [PubMed] [Google Scholar]
- Kiviniemi VJ, Haanpaa H, Kantola JH, Jauhiainen J, Vainionpaa V, Alahuhta S, Tervonen O ( 2005): Midazolam sedation increases fluctuation and synchrony of the resting brain BOLD signal. Magn Reson Imaging 23: 531–537. [DOI] [PubMed] [Google Scholar]
- Liu X, Zhu X, Chen W ( 2010): Baseline BOLD Correlation Accounts for Inter‐Subject Variability in Task‐Evoked BOLD Responses. Sweden: Stockholm. [Google Scholar]
- McAvoy M, Larson‐Prior L, Nolan TS, Vaishnavi SN, Raichle ME, d'Avossa G ( 2008): Resting states affect spontaneous BOLD oscillations in sensory and paralimbic cortex. J Neurophysiol 100: 922–931. [DOI] [PMC free article] [PubMed] [Google Scholar]
- Murayama Y, Biebetamann F, Meinecke FC, Muller KR, Augath M, Oeltermann A, Logothetis NK. ( 2010): Relationship between neural and hemodynamic signals during spontaneous activity studied with temporal kernel CCA. Magn Reson Imaging 28: 1095–1103. [DOI] [PubMed] [Google Scholar]
- Scholvinck ML, Maier A, Ye FQ, Duyn JH, Leopold DA ( 2010): Neural basis of global resting‐state fMRI activity. Proc Natl Acad Sci USA 107: 10238–10243. [DOI] [PMC free article] [PubMed] [Google Scholar]
- Smith SM ( 2002): Fast robust automated brain extraction. Hum Brain Mapp 17: 143–155. [DOI] [PMC free article] [PubMed] [Google Scholar]
- Smith SM, Jenkinson M, Woolrich MW, Beckmann CF, Behrens TE, Johansen‐Berg H, Bannister PR, De Luca M, Drobnjak I, Flitney DE, Niazy RK, Saunders J, Vickers J, Zhang Y, De Stefano N, Brady JM, Matthews PM ( 2004): Advances in functional and structural MR image analysis and implementation as FSL. Neuroimage 23 ( Suppl 1): S208–S219. [DOI] [PubMed] [Google Scholar]
- Smith SM, Fox PT, Miller KL, Glahn DC, Fox PM, Mackay CE, Filippini N, Watkins KE, Toro R, Laird AR, Beckmann CF. ( 2009): Correspondence of the brain's functional architecture during activation and rest. Proc Natl Acad Sci USA 106: 13040–13045. [DOI] [PMC free article] [PubMed] [Google Scholar]
- Wilson JL, Jenkinson M, de Araujo I, Kringelbach ML, Rolls ET, Jezzard P ( 2002): Fast, fully automated global and local magnetic field optimization for fMRI of the human brain. Neuroimage 17: 967–976. [PubMed] [Google Scholar]
- Woolrich MW, Jbabdi S, Patenaude B, Chappell M, Makni S, Behrens T, Beckmann C, Jenkinson M, Smith SM ( 2009): Bayesian analysis of neuroimaging data in FSL. Neuroimage 45( 1 Suppl): S173–S186. [DOI] [PubMed] [Google Scholar]
- Yang H, Long XY, Yang Y, Yan H, Zhu CZ, Zhou XP, Zang YF, Gong QY ( 2007): Amplitude of low frequency fluctuation within visual areas revealed by resting‐state functional MRI. Neuroimage 36: 144–152. [DOI] [PubMed] [Google Scholar]
- Zhao JM, Clingman CS, Narvainen MJ, Kauppinen RA, van Zijl PC ( 2007): Oxygenation and hematocrit dependence of transverse relaxation rates of blood at 3T. Magn Reson Med 58: 592–597. [DOI] [PubMed] [Google Scholar]