



Abstract
In humans, white matter maturation is important for the improvement of cognitive function and performance with age. Across studies the variables of white matter maturity and age are highly correlated; however, the unique contributions of white matter to information processing speed remain relatively unknown. We investigated the relations between the speed of the visually‐evoked P100m response and the biophysical properties of white matter in 11 healthy children performing a simple, visually‐cued finger movement. We found that: (1) the latency of the early, visually‐evoked response was related to the integrity of white matter in both visual and motor association areas and (2) white matter maturation in these areas accounted for the variations in visual processing speed, independent of age. Our study is a novel investigation of spatial‐temporal dynamics in the developing brain and provides evidence that white matter maturation accounts for age‐related decreases in the speed of visual response. Developmental models of cortical specialization should incorporate the unique role of white matter maturation in mediating changes in performance during tasks involving visual processing. Hum Brain Mapp, 2012. © 2011 Wiley Periodicals, Inc.
Keywords: magnetoencephalography, diffusion tensor imaging, development, white matter, information processing speed, latency, visual, motor, visually‐evoked field
INTRODUCTION
White matter maturation is a key in brain development [Casey et al.,2000; Giedd et al.,1999; Paus et al.,2001]. Notably, white matter integrity is associated with information processing speed in children [Mabbott et al.,2006] and in adults [Madden et al., 2004; Tuch et al.,2005]. Information processing speed is the general rate at which a person can complete cognitive operations and is important in cognitive development [Kail,2000; Kail and Park,1994; Mabbott et al.,2008]. Behavioral tasks have typically been used to measure information processing speed and have provided valuable information. Indeed, increased white matter integrity as measured by diffusion tensor imaging (DTI) predicts faster speed during cognitive performance in healthy children [Mabbott et al.,2006; Olson et al.,2009]. As white matter has significant influence on the speed at which information can be processed, it is likely that maturation of this tissue is critical in understanding the role processing speed plays in supporting the development of normal cognitive function and performance [Mabbott et al.,2006]. To take the next step in integrating physiological mechanisms of brain maturation with behavior change, however, we need to understand the interaction between white matter integrity and direct measures of the speed of neuronal function. Such integration is important for understanding how structural maturation of the brain influences functional brain change and ultimately behavior change. This is a central question in developmental neuroscience. Reaction time (RT) paradigms measure the interval between the presentation of a stimulus and the onset of a voluntary response and have successfully been used to investigate changes in processing speed [Collins and Long,1996; Konrad et al.,2009]. In this study, we examined the links between speed of neuronal activation in visual cortex during presentation of visually‐cued finger movement RT task and white matter integrity in school aged children. We also examine the relations between the speed of the neuronal response and behavioral RT, which is the typical metric of information processing speed during cognitive performance. Finally, we examined whether white matter growth contributed uniquely to neuronal processing speed, independent of age.
We used magnetoencephalography (MEG) to measure the speed of neuronal activation in visual cortex. MEG combines high temporal and spatial resolution to localize peaks in cortical activity and measures the speed of neuronal response to an external or internal event (i.e., visual cue or volitional movement, respectively). In particular, visual stimulus‐evoked fields (VEFs) provide an objective assessment of the speed of neuronal response in primary visual cortex (VI) following a visual cue and have proven to be a useful diagnostic and prognostic tool for visual integrity [Klistorner et al.,2009; Kutlu et al.,2009; Laron et al.,2009]. Simple stimulus‐evoked VEFs are reliable, robust, and replicable (i.e., [Shigeto et al.,1998]). An external visual event elicits a positive, early VEF around 100ms [Moradi et al.,2003; Prieto et al.,2007; Tabuchi et al.,2002]. In adults, the latency of the this early, visual response is influenced by white matter anisotropy of right parietal and frontal regions [Stufflebeam et al.,2008]. In children, this latency steadily decreases with increases in age [Balachandran et al.,2004; Lenassi et al.,2008] until young adulthood [Allison et al.,1983; Brecelj,2003].
Diffusion tensor imaging is an excellent technique for acquiring quantitative information on white matter integrity [Beaulieu,2002; Paus et al.,2001; Pfefferbaum et al.,2000; Schmithorst et al.,2002]. Diffusion of water in white matter is affected by the thickness, orientation, and regularity of axonal fibers and can be used as an index of white matter organization. Fractional anisotropy (FA) measures the directionality of water diffusion and may reflect the influence of axonal membranes and density [Beaulieu,2002]. Using MEG in tandem with DTI, we examined how white matter integrity may be linked to neuronal processing speed in the visual cortex to understand the role white matter has in supporting the development of neural and behavioral function.
In a recent MEG/DTI study, Roberts et al. [2009] showed that FA of the auditory radiations was associated with the speed of the auditory evoked response in children and adolescents: the response latency of the auditory evoked‐potential decreased with age while FA increased with age [Roberts et al.,2009]. As neither age nor FA solely predicted the speed in the auditory latency, it was concluded that the evoked auditory latency could be predicted by either FA or age. However, white matter matures at varying rates within different regions of the brain [Barnea‐Goraly et al.,2005; Ben Bashat et al.,2005; Schneider et al.,2004] which may influence the speed of information processing differently in these regions. In support of this notion, only FA, and not age, is correlated with the speed of performance on a visual search task [Mabbott et al.,2006]. In addition, visual association areas mature later in development than the primary visual cortex [Gogtay et al.,2004]. Association areas can also influence the early evoked response through feedback loops; therefore, white matter integrity in extra‐primary regions may also be a marker of basic sensory processing speeds. Correspondingly, Stufflebeam et al. [2008] showed that the FA values in the posterior parietal cortex and frontal eye fields were positively correlated with the speed of the evoked visual response as measured in the primary cortex [Stufflebeam et al.,2008].
We investigated how white matter integrity influences the speed of the visual response during development. First, using tract‐based spatial statistics (TBSS) [Smith et al.,2006,2007] we examined FA of white matter across the whole brain using DTI, and related this to latency of neuronal activation in the primary visual cortex as measured by MEG following a simple, visually‐cued finger movement. Second, for discrete white matter regions where relations between FA and latency of neuronal activation were identified using TBSS, we then used hierarchical regression analyses to compare the relative increase in the variance in neuronal RT accounted for by FA within the region versus age. If white matter growth accounts for development of visual response latency then FA would uniquely account for neuronal processing speed of visual information, even when considering the contribution of age.
MATERIALS AND METHODS
Participants
Eleven right‐handed children ranging in age from 5.95 to 11.93 years were recruited for the study (6F/5M, mean age = 8.95 years ± 2.15 SD). All participants were free from neurological or psychiatric symptoms. Healthy volunteers were recruited by advertising at The Hospital for Sick Children (Toronto, Canada) and other community organizations. Interested participants were excluded if they wore orthodontic braces, had any nonremovable metal, had a diagnosis of psychosis or a neurological disorder, or were left‐handed. All participants provided informed written consent by the guidelines of The Hospital for Sick Children Research Ethics Board. The participants gave their informed consent in writing before the start of the experiment.
MEG Recordings
Neuromagnetic activity was recorded using a whole‐head 151 channel CTF MEG system (VSM MedTech, Vancouver, Canada) located in a magnetically shielded room. Prior to MEG data acquisition, each patient was fitted with three fiducial localization coils placed at the nasion and preauricular points to localize the position of the patient's head relative to the MEG sensors. Head position in relation to the MEG sensors was determined by measuring the magnetic field generated by the three fiducial reference coils just before and after each experimental session. If head movement exceeded 0.5 cm during task performance, the data were not examined and the experimental condition was redone. This was not required for any participant. Recordings were performed with participants lying supine on an adjustable bed, arms at their sides, and their eyes fixated on a visual fixation cross (2 cm × 2 cm “+”) projected by LCD projector onto a semitransparent screen placed 50 cm from the subjects' eyes. MEG data were collected continuously at a sample rate of 625 samples/s and a bandpass of 0.3–200 Hz. Data were visually inspected for eyeblink artifacts and contaminated trials were removed prior to analysis. Although eye saccades were not controlled for, the color change‐finger movement paradigm has been used successfully with a variety of clinical and typically developing pediatric populations [Gaetz et al.,2009,2010a,b]. Moreover, the task itself limits the likelihood of saccades given that finger movements were cued using a color change that occurred at central fixation. Upon completion of all MEG data collection, the MEG fiducial coils were replaced with MRI‐visible fiducial markers.
Visual Cue and Behavioral Reaction Time Measurements
Figure 1 provides a graphic depiction of the task and the components that were measured. While in the MEG, participants were instructed to attend to the cross on the LCD screen and to abduct their right index finger as quickly as possible in response to a color change (from a white “+” to green, 200 ms duration) which occurred randomly every 3.5–4.5 s. Approximately 100 visual responses and movements were captured for each MEG recording (400 s in total). In this study, behavioral RT was measured as the latency of electromyogram (EMG) from onset of the visual cue. Behavioral RT is typically measured as the time taken to complete a desired movement in response to an external cue. However, such a RT reflects both motor preparation (time from the stimulus presentation to the onset of an increase in desired muscle activity) and movement (the time from muscle activation to the completion of the required movement). The timing of the motor preparation stage is thought to be the best indicator of information processing time [Kato et al., 2006; Schmidt and Lee, 1999], as the movement stage can be confounded by trial‐by‐trial temporal jittering between initiation and completion of movement.
Figure 1.

Schematic depicting measured components in visual‐response task. Participants were instructed to attend to the cross on the screen and to abduct their right index finger as quickly as possible in response to the cross changing from white to green. Finger movements were confirmed with an EMG.
Finger abductions (RT response measure) were confirmed with an EMG which recorded electric activity emanating from muscular contractions of the first dorsal interosseus of right hand. Triggers providing EMG onset markers were inserted into the raw MEG data during neuromagnetic recordings. Head movement was monitored for each data recording.
MRI Recordings and DTI Measurements
MRI images were acquired with a GE LX 1.5T MRI scanner and an eight channel head coil. A T1‐weighted structural image was collected using a 3D FSPGR (TR/TE = 8.6/4.2 ms, 122 contiguous axial slices, 1.5 mm thick, 256 × 192 matrix). Parameters used to capture whole‐brain axial DTI images included a 2.5 mm × 2.5 mm × 2.5 mm voxel resolution single‐shot EPI sequence with 15 gradient directions, b = 0 and 1000 s/mm2, TE = 82.4 ms, TR = 15 s, and 2 repetitions. The slices were oriented to the intercommissural (AC‐PC) plane. Children watched a movie through video goggles to prevent excessive head movement during the scan. To overlay MEG information on the MRI of the subject's brain, the three fiducial points were identified on MRI images and coregistered with the fiducial information acquired during the MEG procedure.
ANALYSES
The Speed of the Visual Response: Measuring the early VEF
For analysis of visual evoked fields, the continuously recorded MEG data were epoched into single trials which were time‐locked to stimulus onset (color change). Each trial was defined as being of 2 s duration with 1 s preceding and 1 s following color change onset. Responses were filtered from 2 to 55 Hz and averaged for each participant to create an evoked response for each individual. Latencies of the early VEF response were ascertained by determining the timing of the peak response of the averaged data that was closest to 100 ms following the color change for each individual. Subsequent dipole source localization was performed using an equivalent current dipole model (DipoleFit, CTF) for each individual's VEF closest to 100ms peak latency. The dipole location represents the center of gravity of the neural population that was maximally activated at that time point. The location of the dipoles were fitted to the participants MR image using MRIViewer (CTF) and were inspected for each subject to confirm the location in the primary visual cortex.
White Matter Integrity and the early VEF: TBSS
All operations were performed using FSL software [Behrens et al.,2003]. Data was eddy corrected, and FA maps were calculated for each participant. Separate voxel‐wise analyses of the relations between (a) FA and visual response time (latency of early VEF) and (b) FA and age were carried out using TBSS [Smith et al.,2006,2007]. TBSS analysis restricts the FA data to a mean FA tract skeleton derived from individual subjects, before applying cross‐subject statistics. First, FA maps were nonlinearly registered to a representative image, which was then aligned using affine registration to standard space (MNI152; Montreal Neurological Institute, McGill, Canada). Second, a cross‐subject mean FA image was created and used to generate a skeleton FA map, thresholded at FA > 0.20, that included only white matter structures common to all subjects. Finally, individual FA maps were aligned with the skeleton and only the FA values along the centre of each fiber tract were considered in subsequent voxel‐wise analyses.
We applied voxel‐wise statistics using the TBSS‐preprocessed data and cluster‐size thresholding, with clusters initially defined by t > 3. The null distribution of the cluster‐size statistic was built up over 5000 permutations. FA values for each voxel along the mean FA skeleton were correlated with demeaned data (e.g., either age or early VEF latency). To correct for multiple comparisons, data were processed using a family‐wise model, and results were thresholded at an alpha level of 0.05. Significant clusters were visualized as an overlay on 3D slices of MNI template 152. MNI coordinates for the voxel central to each cluster were labeled with the MNI Structural Atlas and the Harvard‐Oxford Cortical Structural Atlas, both integrated into the FSL software [Behrens et al.,2003].
TBSS: Regions of Interest Analysis
Clusters where significant relations between FA and visual response time were evident were then used to define specific areas for subsequent regional analysis. Regions derived from the TBSS analyses were overlaid on individual FA maps to obtain region‐specific mean FA values for each subject which were then correlated with early VEF latency, overall FA, age, and RT values.
Relating TBSS Results to Brain Function
We conducted a functional, MEG‐based, whole‐brain analysis to examine whether there were any task‐related neural activities in the regions‐of‐interest as determined by TBSS. To do so, we applied a beamformer method (synthetic aperture magnetometry: SAM) that, unlike dipole modeling, required no a priori assumptions and was applied to the raw, un‐averaged data [Ishii et al.,1999; Robinson and Vrba,1998; Singh et al.,2003]. This method allowed us to localize neural activations that were task‐related but may not have withstood data averaging (which is required for measuring the evoked early VEF response). To do this, we subtracted a baseline period (−1 s to −0.4 s prior to visual cue onset) from an active period (0–0.6 s after onset) and filtered the data from 2 to 55 Hz. The result was a whole brain differential image of task‐related neural activations which we compared to our TBSS outcome.
Hierarchical Regression: FA Versus Age in Predicting the early VEF
We performed separate hierarchical regression analyses to determine the relative contribution of FA within each significant regions‐of‐interest (ROI) versus age to the speed of the visual response.
Age and White Matter Integrity: TBSS
Finally, to examine maturation of white matter we performed a secondary TBSS analysis examining the relations between FA and age.
RESULTS
The early VEF
A representative example of the early VEF from a single participant is shown in Figure 2A. Contour maps of the early VEF localized a peak response in neuromagnetic activities to the medial occipital region (Fig. 2B). Subsequent dipole fits determined that, for every subject, the early VEF was localized to primary visual cortex (VI) (a representative example is shown in Fig. 2C; dipole locations for all participants are depicted in Supp. Info. Fig. 1). This ECD modeling was successful in every participant. The average weighted error for each dipole solution was 10.45% ± 2.37 SEM. Mean peak latency for the grand‐averaged early VEF response was 111.17 ms ± 6.53 SEM following the visual cue. After one outlier was removed (Subject 9), the early VEF latency was negatively associated with age: early VEF latency decreased as age increased (r = −0.626, p < 0.05) (Fig. 2D).
Figure 2.
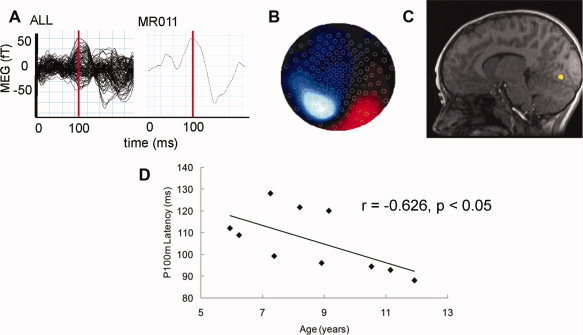
Images 2A through 2C depict data from a representative participant. (A) Evoked visual fields produced a well‐defined positive VEF around 100 ms following the visual cue. The evoked field was derived from the whole‐head MEG sensor data. (B) Preliminary localization on a contour map showed that distributions of magnetic fields appeared on either side of the occipital midline. (C) The dipole fit localized the early VEF response to the occipital region. Dipole fits for all participants are depicted in Supporting Information Figure 1. (D) There was a significant, negative correlation between age and the latency of the early VEF evoked visual response across participants.
TBSS and the early VEF
We examined the relations between early VEF latency and white matter integrity using TBSS. Clusters defining significant correlations between early VEF latency and FA were localized to parietal and frontal lobe regions, primarily in the right hemisphere (Fig. 3A). The overall mean FA value for these clusters was 0.42 ± 0.012 SEM across participants. There was a significant relationship between early VEF latency and overall FA of these regions where increases in FA highly predicted decreases in early VEF latencies (r = 0.942, p < 0.05) (Fig. 3B). These clusters were specifically located in the right superior parietal lobule, right temporal gyrus, and right frontal lobe (Table I). Note, although not the aim of this study, we did examine the relation between N75m and N145m components of the evoked visual response with FA in all subjects. Neither the N75m latencies nor the N145m latencies showed a significant relationship with FA within any brain region (data not shown).
Figure 3.

(A) TBSS analyses determined regions where FA and early VEF latency were significantly related. Circled: Significant clusters within the right V5‐parietal region (first image) and right premotor region (second image) were isolated and masks were created to derive regional FA values for each participant which was then applied to a later hierarchical regression. (B) Correlational analyses for the overall FA Value and early VEF Latency revealed a significant inverse relationship between overall FA and early VEF latency where higher FA values predicted reduced latencies of the visual cortex.
Table I.
Localization of clusters of white matter that were significantly correlated with the latency of the early VEF visually evoked response
| Cluster location MNI structural atlas (Harvard‐Oxford Cortical Atlas) | MNI 152 coordinates (x, y, z) | |
|---|---|---|
| early VEF | Right parietal lobe (superior parietal lobule) | 21, −44, 52 |
| Right temporal lobe (superior temporal gyrus) | 41, −40, 12 | |
| Right frontal lobe (middle frontal gyrus) | 32, −1, 41 |
We divided the clusters into three main regions: right parietal lobe, right temporal lobe, and right frontal lobe. MNI coordinates were determined by referencing the voxel most central in each of these three cluster regions.
Regions of Interest and the early VEF
Post‐hoc analyses were conducted for each ROI using the clustered regions identified by TBSS examining FA and early VEF location. Specifically, regression was performed on regional FA values for area V5 to superior parietal cortex in the right hemisphere and right premotor region to determine their unique contribution to the early VEF latency. These regions were post‐hoc selected from the significant clusters as they have been previously associated with visual‐motor activities (as described below).
V5‐parietal region
A region of significant clusters defined by the TBSS analysis were situated in a V5‐superior parietal region (circled in Fig. 3A, first image) known to be important for spatial awareness and visual guidance of motor actions [Ellison and Cowey,2009; Jantzen et al.,2005; Milner and Goodale,1993]. We created a V5‐parietal mask and overlaid it onto individual FA maps to derive mean FA value for this V5‐parietal region. The mean FA value for this location was 0.44 ± 0.008 SEM.
Right premotor region
A region of significant clusters was also located across the right frontal lobe in the vicinity of the premotor cortex (circled in Fig. 3A, second image). A bidirectional tract thought to be relevant for visuomotor integration and frontal regulation of visual attention during volitional movement travels between this frontal region and the occipital lobe [Makris et al.,2005]. We created a premotor mask and overlaid it onto individual FA maps to derive mean FA value for this region. The mean FA value for this location was 0.397 ± 0.011 SEM.
Optic radiations
Post‐hoc analysis was also conducted for a small cluster localized to the optic radiations as early VEF latency‐FA dependency has been reported for this region [Stufflebeam et al.,2008]. The optic radiations mask was overlaid onto FA maps to derive mean FA value for this region for each individual. The mean FA value for this location was 0.398 ± 0.012 SEM. There was a trend of increasing FA predicting reduced early VEF latency (r = −0.505, p > 0.05); however, the relationship was not significant (See Supp. Info. Fig. 2), perhaps due to the relatively small sample in this study. Because of the lack of significance in this ROI analysis, this region was not included in the following described hierarchical regression.
Relating TBSS Results to Brain Function
Differential SAM images revealed neural activations in the parietal and motor cortices that were related to the color change onset. Nine of 11 participants showed at least one SAM peak located within the region of the right premotor cortex defined by TBSS/early VEF regression analysis (see Fig. 4), and 9 of 11 participants showed at least one SAM peak located within the regions of the MT/V5 to parietal cortex defined by TBSS/early VEF regression analysis (see Fig. 5). These data demonstrated a functional relationship between the regions of interest detected by TBSS and visual‐motor performance.
Figure 4.

V5/parietal SAM localizations. Spatial analysis of neural activations temporally‐related to the colour change of the visual stimulus. Nine of 11 subjects demonstrated visual stimulus‐related activations in the upper right parietal lobe, and 4 of these 9 also demonstrated stimulus‐related activations in the lower right parietal lobe. All of these activations are within the general region of the V5/parietal dorsal processing stream. [Color figure can be viewed in the online issue, which is available at wileyonlinelibrary.com.]
Figure 5.

Premotor SAM localizations. Spatial analysis of neural activations temporally‐related to the colour change of the visual stimulus. Nine of 11 subjects demonstrated visual stimulus‐related activations in the right premotor region. [Color figure can be viewed in the online issue, which is available at wileyonlinelibrary.com.]
FA Versus Age in Predicting the early VEF
By applying a hierarchical regression analyses to examine the relative contributions of FA and age to the early VEF latency, we determined that white matter integrity of the right V5‐parietal and right premotor regions both contributed uniquely to the early VEF latency. Importantly, age did not contribute significantly to the model when entered after FA for these regions (Table II).
Table II.
Hierarchical regression models predicting the early VEF visual evoked latency with age and FA
| Model R 2 | Change R 2 | F change | Sig. F change | |
|---|---|---|---|---|
| Right V5/parietal | ||||
| Model 1:1a | ||||
| Age | 0.396 | — | 5.255 | 0.026 |
| FA added | 0.626 | 0.229 | 4.292 | 0.039 |
| Model 1:2 | ||||
| FA | 0.604 | — | 12.22 | 0.004 |
| Age added | 0.626 | 0.021 | 0.402 | 0.273 |
| Right premotor | ||||
| Model 2:1 | ||||
| Age | 0.396 | — | 5.255 | 0.026 |
| FA added | 0.781 | 0.385 | 12.291 | 0.005 |
| Model 2:2 | ||||
| FA | 0.772 | — | 27.129 | 0.000 |
| Age added | 0.781 | 0.009 | 0.279 | 0.305 |
Models were labeled separately for each relevant region of interest (i.e., Model 1 for the right V5/parietal region and Model 2 for the right precentral region). Within each region of interest, separate models were labeled with a second digit for those where either age was entered first (i.e., Model 1:1) or FA within the region was entered first (i.e., Model 1:2). All Models based on one‐tailed tests. One outlier was removed prior to regression analysis (Subject 9).
Age‐Related Changes in FA
FA measures
To examine the relations between age and white matter integrity, we tested for clusters of significant correlations between age and FA using statistical thresholding within a second TBSS analysis. Clusters of white matter were identified in subcortical regions as well as in the same parietal and frontal regions that were identified in the TBSS analyses of FA and early VEF (Fig. 6A). Overall FA values ranged from 0.373 to 0.486 FA within these regions. Using the Pearson product–moment correlation coefficient we measured the strength of linear dependence between age and mean FA extracted across these clusters. After one outlier was removed (Subject 9), there was a strong relationship between age and overall FA where increases in age predicted higher FA values (r = 0.768, p < 0.05) (Fig. 6B). Clusters were specifically localized to the left post‐central gyrus, right parietal lobe, and right frontal lobe (Table III).
Figure 6.

(A) Using TBSS we identified clusters of white matter in the parietal and frontal regions which FA significantly correlated with age. (B) There was a significant, positive correlation between age and the FA value extracted across all significant clusters. [Color figure can be viewed in the online issue, which is available at wileyonlinelibrary.com.]
Table III.
Localization of clusters of white matter that were significantly correlated with age
| Cluster location MNI structural atlas (Harvard‐Oxford Cortical Atlas) | MNI 152 coordinates (x, y, z) | |
|---|---|---|
| Age | Left parietal lobe (postcentral gyrus) | −36, −37, 39 |
| Right parietal lobe (superior parietal lobule) | 28, −44, 47 | |
| Right parietal lobe (precuneus) | 27, −58, 10 | |
| Right frontal lobe (middle frontal gyrus) | 29, 29, 35 |
We divided the clusters into four main regions: left parietal lobe, upper and lower right parietal lobes, and right frontal lobe. MNI coordinates were determined by referencing the voxel most central in each of these four cluster regions.
Behavioral Reaction Time
Across individuals, the grand‐averaged EMG onset for finger abduction was 274.29 ms ±18.5 SEM following the visual cue. The latency of EMG onset significantly decreased as age increased (r = −0.621, p < 0.05) (Fig. 7A) and early VEF latency decreased (r = 0.578, p < 0.05) (Fig. 7B).
Figure 7.

(A) There was a significant inverse relationship between RT, as measured by EMG onset, and age whereby RT latency decreased with increasing age. (B) RT was positively correlated with the latency of the visual evoked response whereby RT decreases as the early VEF latency decreased.
DISCUSSION
Here we show two major findings: (1) that the speed of the early VEF visual response was related to white matter integrity in both visual and motor association areas and (2) that white matter integrity in these areas, and not age, accounted for individual differences in the speed of the visual response.
In our paradigm, reduced early VEF latencies were associated with greater FA in the white matter of the right V5 and superior parietal regions. Moreover, SAM analyses localized V5 and superior parietal activations that were related to task performance. These observations suggest that the V5/superior parietal region is both structurally and functionally related to the latency of the visual response. The V5 region is a key cortical generator of the early VEF response [Barnikol et al.,2006], apart from VI itself. In humans, V5 receives input from V1 [Schoenfeld et al.,2003] and also receives direct input from the lateral geniculate nucleus [Bridge et al.,2008]. Our findings provide evidence that white matter in the V5‐parietal region influences the latency of the early VEF response localized in the VI. This influence may be caused by a continuous crosstalk of V1 and V5 due to the recurrent activations of these regions [Barnikol et al.,2006] or possibly by feedback travelling from V5 to V1 [Laycock et al.,2007]. Importantly, the location of the V5‐parietal complex corresponds with the location of the visual dorsal processing stream which is critical for spatial awareness and visuomotor integration [Jantzen et al.,2005; Milner and Goodale,1993].
Reduced early VEF latencies were also associated with greater FA of the right premotor region, and SAM analyses revealed activations in this area that were also related to task performance. These findings suggest that the speed of visual processing depends on diffusion properties of white matter fibers that modulate volitional motor output; in this case, a simple finger movement. White matter fibers of the superior longitudinal fasciculus connect regions of the motor cortex to the posterior end of the lateral sulcus where, in turn, numerous fibers connect with the occipital lobe [Makris et al.,2005]. Since this pathway is bidirectional, it provides a means by which motor preparation may regulate the focusing of visual attention required when moving a finger in response to a visual cue.
Notably, both visual and motor clusters reaching statistical significance were exclusively in the right hemisphere. Our observations are supported by several studies that show that visuospatial attention [Mesulam,1999] and visuospatial processing speed [Tuch et al.,2005] are right‐hemisphere dominant.
A striking finding was that parietal and premotor FA related to the latency of the visual response independent of age. In fact, age did not contribute significantly to the early VEF latency when FA within these regions was first included in the models. However, FA did increase as a function of age within the regions as demonstrated by results from our secondary TBSS analyses examining FA and age. Considering we identified age related increases in FA and that only FA accounted for the variability in speed of the neuronal response, our findings suggest that white matter maturation within parietal and premotor regions accounts in part for developmental changes in the speed of the visual response. Although the acquisition of “normal” visual perception [Bronson et al., 1982] and the white matter myelination of the major visual system tracts [Brody et al., 1987; Yakovlev and Lecours, 1967] both occur early in life, the properties of myelin continue to mature with ongoing development. Maturational changes include decreases in cerebral fluids and extra‐axonal spaces and increases in fiber diameter, cohesiveness and compactness of the fiber tracts [Beaulieu,2002; Schmithorst et al.,2002; Suzuki et al.,2003]. Maturational changes in white matter do not follow a linear path but flourish at various developmental stages, such as adolescence [Qiu et al.,2008; Snook et al.,2005], causing increases in FA that mature at different rates within different regions of the brain [Barnea‐Goraly et al.,2005; Ben Bashat et al.,2005; Schneider et al.,2004]. Importantly, white matter maturation is influenced by life experience. For instance, premature infants provided with an enriched developmental care intervention showed more mature fiber structure compared with their age‐matched controls [Als et al.,2004]. Furthermore, white matter fibers in the visual system show accelerated maturation in animals provided enriched environments during their developmental period [Cancedda et al.,2004]. Collectively this evidence persuades us that age may only be a surrogate marker of processing speeds (behavioral or neural). The characterization of white matter integrity, based on maturation, may be a more accurate reflection of performance. As a faster visual response associated significantly with a faster volitional response, we suggest that maturational processes boost axonal signaling, which in turn yield a more efficient behavioral output.
Our study was limited by the fact that we did not identify seed and termination points for the regions that showed a correlation with speed of the early VEF response. Although a tractography analysis would have permitted identification of these points, such an approach requires a priori assumptions based on specific regions. Our TBSS approach contained no a priori assumptions, therefore it allowed us to examine the relations of latency to FA in the entire brain without specifying any regions of interest. Our evidence suggests this may be particularly beneficial in detecting white matter pathways outside of the primary sensory cortex that influence the speed of sensory processing. A further limitation of the study was the relatively small sample size. For instance, the FA of the optic radiations would seem a likely influence of the response latency in a basic visual paradigm, and has been reported in adults [Stufflebeam et al.,2008]. However, we found only a trend between greater FA of this region and the latency of the early VEF. For this reason, these findings cannot be generalized based on this study alone but should be used to encourage future work on a larger scale. However, the findings do argue for the application of hierarchical regression and the separation of age versus white matter maturation, particularly in tasks requiring visually‐cued RT. Lastly, we do not know how previous experience affected white matter integrity in our design. It is likely that experience with speeded information processing increases with age (i.e., timed tests) and such experience may play a role in the observed structural differences in white matter integrity. Training designs that account for both brain maturation and experience would be useful in addressing this concern [Durston and Casey,2006]. Future directions will include testing the unique roles of neuronal function and white matter integrity in producing impaired information processing speed in children with white matter injury. Moreover, we will investigate additional DTI measures such as mean diffusivity and eigenvalues—providing even more detail into diffusion properties and their relation to processing speed.
In conclusion, our study is a novel investigation of spatial‐temporal dynamics in the developing brain and provides evidence that the speed of the early VEF visual response is related to white matter integrity in visual association and premotor regions in children. Furthermore, only white matter maturation, and not age per se, is responsible in accounting for the decreases in the latency of the visual response. Combining MEG and DTI methods provides a powerful means to examine the relations between neuronal function maturational processes, and white matter integrity. Developmental models of cognitive function should take into account the unique role of white matter maturation in mediating visual‐response task performance. More generally, we have demonstrated an innovative, noninvasive approach that directly links the variability in the speed of brain function with its structure. Our findings provide insight into how brain structure and function interact in producing behavioral response. Understanding how brain maturation may mediate functional change has wide‐ranging applications for brain/behavior models in neuroscience, and may ultimately yield novel information for characterizing and treating developmental neurological disorders.
Supporting information
Additional Supporting Information may be found in the online version of this article.
Supporting Figure 1.
Supporting Figure 2.
Acknowledgements
We thank Drs. Suresh Muthukumaraswamy and Krish Singh for developing and sharing Matlab based beamformer source analysis software. We also thank Matt MacDonald and Jolynn Dickson for technical support.
REFERENCES
- Allison T, Wood CC, Goff WR ( 1983): Brain stem auditory, pattern‐reversal visual, and short‐latency somatosensory evoked potentials: Latencies in relation to age, sex, and brain and body size. Electroencephalogr Clin Neurophysiol 55: 619–636. [DOI] [PubMed] [Google Scholar]
- Als H, Duffy FH, McAnulty GB, Rivkin MJ, Vajapeyam S, Mulkern RV, Warfield SK, Huppi PS, Butler SC, Conneman N, Fischer C, Eichenwald EC ( 2004): Early experience alters brain function and structure. Pediatrics 113: 846–857. [DOI] [PubMed] [Google Scholar]
- Balachandran C, Klistorner AI, Billson F ( 2004): Multifocal VEP in children: Its maturation and clinical application. Br J Ophthalmol 88: 226–232. [DOI] [PMC free article] [PubMed] [Google Scholar]
- Barnea‐Goraly N, Menon V, Eckert M, Tamm L, Bammer R, Karchemskiy A, Dant CC, Reiss AL ( 2005): White matter development during childhood and adolescence: A cross‐sectional diffusion tensor imaging study. Cereb Cortex 15: 1848–1854. [DOI] [PubMed] [Google Scholar]
- Barnikol UB, Amunts K, Dammers J, Mohlberg H, Fieseler T, Malikovic A, Zilles K, Niedeggen M, Tass PA ( 2006): Pattern reversal visual evoked responses of V1/V2 and V5/MT as revealed by MEG combined with probabilistic cytoarchitectonic maps. Neuroimage 31: 86–108. [DOI] [PubMed] [Google Scholar]
- Beaulieu C ( 2002): The basis of anisotropic water diffusion in the nervous system—A technical review. NMR Biomed 15: 435–455. [DOI] [PubMed] [Google Scholar]
- Behrens TE, Woolrich MW, Jenkinson M, Johansen‐Berg H, Nunes RG, Clare S, Matthews PM, Brady JM, Smith SM ( 2003): Characterization and propagation of uncertainty in diffusion‐weighted MR imaging. Magn Reson Med 50: 1077–1088. [DOI] [PubMed] [Google Scholar]
- Ben Bashat D, Ben Sira L, Graif M, Pianka P, Hendler T, Cohen Y, Assaf Y ( 2005): Normal white matter development from infancy to adulthood: Comparing diffusion tensor and high b value diffusion weighted MR images. J Magn Reson Imaging 21: 503–511. [DOI] [PubMed] [Google Scholar]
- Brecelj J ( 2003): From immature to mature pattern ERG and VEP. Doc Ophthalmol 107: 215–224. [DOI] [PubMed] [Google Scholar]
- Bridge H, Thomas O, Jbabdi S, Cowey A ( 2008): Changes in connectivity after visual cortical brain damage underlie altered visual function. Brain 131 ( Part 6): 1433–1444. [DOI] [PubMed] [Google Scholar]
- Cancedda L, Putignano E, Sale A, Viegi A, Berardi N, Maffei L ( 2004): Acceleration of visual system development by environmental enrichment. J Neurosci 24: 4840–4848. [DOI] [PMC free article] [PubMed] [Google Scholar]
- Casey BJ, Giedd JN, Thomas KM ( 2000): Structural and functional brain development and its relation to cognitive development. Biol Psychol 54: 241–257. [DOI] [PubMed] [Google Scholar]
- Collins LF, Long CJ ( 1996): Visual reaction time and its relationship to neuropsychological test performance. Arch Clin Neuropsychol 11: 613–623. [PubMed] [Google Scholar]
- Durston S, Casey BJ ( 2006): What have we learned about cognitive development from neuroimaging? Neuropsychologia 44: 2149–2157. [DOI] [PubMed] [Google Scholar]
- Ellison A, Cowey A ( 2009): Differential and co‐involvement of areas of the temporal and parietal streams in visual tasks. Neuropsychologia 47: 1609–1614. [DOI] [PubMed] [Google Scholar]
- Gaetz WC, Cheyne DO ( 2003): Localization of human somatosensory cortex using spatially filtered magnetoencephalography. Neurosci Lett 340: 161–164. [DOI] [PubMed] [Google Scholar]
- Gaetz W, Cheyne D, Rutka JT, Drake J, Benifla M, Strantzas S, Widjaja E, Holowka S, Tovar‐Spinoza Z, Otsubo H, Pang EW ( 2009): Presurgical localization of primary motor cortex in pediatric patients with brain lesions by the use of spatially filtered magnetoencephalography. Neurosurgery 64( 3 Suppl ): 177–185; discussion 186. [DOI] [PubMed] [Google Scholar]
- Gaetz W, Macdonald M, Cheyne D, Snead OC ( 2010a): Neuromagnetic imaging of movement‐related cortical oscillations in children and adults: age predicts post‐movement beta rebound. Neuroimage 51: 792–807. [DOI] [PubMed] [Google Scholar]
- Gaetz W, Scantlebury N, Widjaja E, Rutka J, Bouffet E, Rockel C, Dockstader C, Mabbott D ( 2010b): Mapping of the cortical spinal tracts using magnetoencephalography and diffusion tensor tractography in pediatric brain tumor patients. Childs Nerv Syst 26: 1639–1645. [DOI] [PubMed] [Google Scholar]
- Giedd JN, Blumenthal J, Jeffries NO, Castellanos FX, Liu H, Zijdenbos A, Paus T, Evans AC, Rapoport JL ( 1999): Brain development during childhood and adolescence: A longitudinal MRI study. Nat Neurosci 2: 861–863. [DOI] [PubMed] [Google Scholar]
- Gogtay N, Giedd JN, Lusk L, Hayashi KM, Greenstein D, Vaituzis AC, Nugent TF TG 3rd, Herman DH, Clasen LS, Toga AW, Rapoport JL, Thompson PM ( 2004): Dynamic mapping of human cortical development during childhood through early adulthood. Proc Natl Acad Sci USA 101: 8174–8179. [DOI] [PMC free article] [PubMed] [Google Scholar]
- Ishii R, Shinosaki K, Ukai S, Inouye T, Ishihara T, Yoshimine T, Hirabuki N, Asada H, Kihara T, Robinson SE, Takeda M ( 1999): Medial prefrontal cortex generates frontal midline theta rhythm. Neuroreport 10: 675–679. [DOI] [PubMed] [Google Scholar]
- Jantzen KJ, Steinberg FL, Kelso JA ( 2005): Functional MRI reveals the existence of modality and coordination‐dependent timing networks. Neuroimage 25: 1031–1042. [DOI] [PubMed] [Google Scholar]
- Kail R ( 2000): Speed of information processing: Developmental change and links to intelligence. J School Psychol 38: 51–61. [Google Scholar]
- Kail R, Park YS ( 1994): Processing time, articulation time, and memory span. J Exp Child Psychol 57: 281–291. [DOI] [PubMed] [Google Scholar]
- Klistorner A, Arvind H, Nguyen T, Garrick R, Paine M, Graham S, Yiannikas C ( 2009): Fellow eye changes in optic neuritis correlate with the risk of multiple sclerosis. Mult Scler 15: 928–932. [DOI] [PubMed] [Google Scholar]
- Konrad A, Vucurevic G, Musso F, Stoeter P, Winterer G ( 2009): Correlation of brain white matter diffusion anisotropy and mean diffusivity with reaction time in an oddball task. Neuropsychobiology 60: 55–66. [DOI] [PubMed] [Google Scholar]
- Kutlu G, Gomceli YB, Sonmez T, Inan LE ( 2009): Peripheral neuropathy and visual evoked potential changes in workers exposed to n‐hexane. J Clin Neurosci 16: 1296–1299. [DOI] [PubMed] [Google Scholar]
- Laron M, Cheng H, Zhang B, Schiffman JS, Tang RA, Frishman LJ ( 2009): Assessing visual pathway function in multiple sclerosis patients with multifocal visual evoked potentials. Mult Scler 15: 1431–1441. [DOI] [PMC free article] [PubMed] [Google Scholar]
- Laycock R, Crewther DP, Fitzgerald PB, Crewther SG ( 2007): Evidence for fast signals and later processing in human V1/V2 and V5/MT+: A TMS study of motion perception. J Neurophysiol 98: 1253–1262. [DOI] [PubMed] [Google Scholar]
- Lenassi E, Likar K, Stirn‐Kranjc B, Brecelj J ( 2008): VEP maturation and visual acuity in infants and preschool children. Doc Ophthalmol 117: 111–120. [DOI] [PubMed] [Google Scholar]
- Mabbott DJ, Noseworthy M, Bouffet E, Laughlin S, Rockel C ( 2006): White matter growth as a mechanism of cognitive development in children. Neuroimage 33: 936–946. [DOI] [PubMed] [Google Scholar]
- Mabbott DJ, Penkman L, Witol A, Strother D, Bouffet E ( 2008): Core neurocognitive functions in children treated for posterior fossa tumors. Neuropsychology 22: 159–168. [DOI] [PubMed] [Google Scholar]
- Makris N, Kennedy DN, McInerney S, Sorensen AG, Wang R, Caviness VS Jr, Pandya DN ( 2005): Segmentation of subcomponents within the superior longitudinal fascicle in humans: A quantitative, in vivo, DT‐MRI study. Cereb Cortex 15: 854–869. [DOI] [PubMed] [Google Scholar]
- Mesulam MM ( 1999): Spatial attention and neglect: Parietal, frontal and cingulate contributions to the mental representation and attentional targeting of salient extrapersonal events. Philos Trans R Soc Lond B Biol Sci 354: 1325–1346. [DOI] [PMC free article] [PubMed] [Google Scholar]
- Milner AD, Goodale MA ( 1993): Visual pathways to perception and action. Prog Brain Res 95: 317–337. [DOI] [PubMed] [Google Scholar]
- Moradi F, Liu LC, Cheng K, Waggoner RA, Tanaka K, Ioannides AA ( 2003): Consistent and precise localization of brain activity in human primary visual cortex by MEG and fMRI. Neuroimage 18: 595–609. [DOI] [PubMed] [Google Scholar]
- Olson EA, Collins PF, Hooper CJ, Muetzel R, Lim KO, Luciana M ( 2009): White matter integrity predicts delay discounting behavior in 9‐ to 23‐year‐olds: A diffusion tensor imaging study. J Cogn Neurosci 21: 1406–1421. [DOI] [PMC free article] [PubMed] [Google Scholar]
- Paus T, Collins DL, Evans AC, Leonard G, Pike B, Zijdenbos A ( 2001): Maturation of white matter in the human brain: A review of magnetic resonance studies. Brain Res Bull 54: 255–266. [DOI] [PubMed] [Google Scholar]
- Pfefferbaum A, Sullivan EV, Hedehus M, Lim KO, Adalsteinsson E, Moseley M ( 2000): Age‐related decline in brain white matter anisotropy measured with spatially corrected echo‐planar diffusion tensor imaging. Magn Reson Med 44: 259–268. [DOI] [PubMed] [Google Scholar]
- Prieto EA, Barnikol UB, Soler EP, Dolan K, Hesselmann G, Mohlberg H, Amunts K, Zilles K, Niedeggen M, Tass PA ( 2007): Timing of V1/V2 and V5+ activations during coherent motion of dots: An MEG study. Neuroimage 37: 1384–1395. [DOI] [PubMed] [Google Scholar]
- Qiu D, Tan LH, Zhou K, Khong PL ( 2008): Diffusion tensor imaging of normal white matter maturation from late childhood to young adulthood: voxel‐wise evaluation of mean diffusivity, fractional anisotropy, radial and axial diffusivities, and correlation with reading development. Neuroimage 41: 223–232. [DOI] [PubMed] [Google Scholar]
- Roberts TP, Khan SY, Blaskey L, Dell J, Levy SE, Zarnow DM, Edgar JC ( 2009): Developmental correlation of diffusion anisotropy with auditory‐evoked response. Neuroreport 20: 1586–1591. [DOI] [PubMed] [Google Scholar]
- Robinson S, Vrba J. 1998. Functional neuroimaging by Synthetic Aperture Magnetometry (SAM) In: Yoshimoto T KM, Kuriki S, Karibe H, Nakasato N, editors. Sendai, Japan: Tohku Univ. Press; pp 302–305. [Google Scholar]
- Schmithorst VJ, Wilke M, Dardzinski BJ, Holland SK ( 2002): Correlation of white matter diffusivity and anisotropy with age during childhood and adolescence: A cross‐sectional diffusion‐tensor MR imaging study. Radiology 222: 212–218. [DOI] [PMC free article] [PubMed] [Google Scholar]
- Schneider JF, Il'yasov KA, Hennig J, Martin E ( 2004): Fast quantitative diffusion‐tensor imaging of cerebral white matter from the neonatal period to adolescence. Neuroradiology 46: 258–266. [DOI] [PubMed] [Google Scholar]
- Schoenfeld MA, Woldorff M, Duzel E, Scheich H, Heinze HJ, Mangun GR ( 2003): Form‐from‐motion: MEG evidence for time course and processing sequence. J Cogn Neurosci 15: 157–172. [DOI] [PubMed] [Google Scholar]
- Shigeto H, Tobimatsu S, Yamamoto T, Kobayashi T, Kato M ( 1998): Visual evoked cortical magnetic responses to checkerboard pattern reversal stimulation: A study on the neural generators of N75, P100 and N145. J Neurol Sci 156: 186–194. [DOI] [PubMed] [Google Scholar]
- Singh KD, Barnes GR, Hillebrand A ( 2003): Group imaging of task‐related changes in cortical synchronisation using nonparametric permutation testing. Neuroimage 19: 1589–1601. [DOI] [PubMed] [Google Scholar]
- Smith SM, Jenkinson M, Johansen‐Berg H, Rueckert D, Nichols TE, Mackay CE, Watkins KE, Ciccarelli O, Cader MZ, Matthews PM, Behrens TE ( 2006): Tract‐based spatial statistics: Voxelwise analysis of multi‐subject diffusion data. Neuroimage 31: 1487–1505. [DOI] [PubMed] [Google Scholar]
- Smith SM, Johansen‐Berg H, Jenkinson M, Rueckert D, Nichols TE, Miller KL, Robson MD, Jones DK, Klein JC, Bartsch AJ, Behrens TE ( 2007): Acquisition and voxelwise analysis of multi‐subject diffusion data with tract‐based spatial statistics. Nat Protoc 2: 499–503. [DOI] [PubMed] [Google Scholar]
- Snook L, Paulson LA, Roy D, Phillips L, Beaulieu C ( 2005): Diffusion tensor imaging of neurodevelopment in children and young adults. Neuroimage 26: 1164–1173. [DOI] [PubMed] [Google Scholar]
- Stufflebeam SM, Witzel T, Mikulski S, Hamalainen MS, Temereanca S, Barton JJ, Tuch DS, Manoach DS ( 2008): A non‐invasive method to relate the timing of neural activity to white matter microstructural integrity. Neuroimage 42: 710–716. [DOI] [PMC free article] [PubMed] [Google Scholar]
- Suzuki Y, Matsuzawa H, Kwee IL, Nakada T ( 2003): Absolute eigenvalue diffusion tensor analysis for human brain maturation. NMR Biomed 16: 257–260. [DOI] [PubMed] [Google Scholar]
- Tabuchi H, Yokoyama T, Shimogawara M, Shiraki K, Nagasaka E, Miki T ( 2002): Study of the visual evoked magnetic field with the m‐sequence technique. Invest Ophthalmol Vis Sci 43: 2045–2054. [PubMed] [Google Scholar]
- Tuch DS, Salat DH, Wisco JJ, Zaleta AK, Hevelone ND, Rosas HD ( 2005): Choice reaction time performance correlates with diffusion anisotropy in white matter pathways supporting visuospatial attention. Proc Natl Acad Sci USA 102: 12212–12217. [DOI] [PMC free article] [PubMed] [Google Scholar]
Associated Data
This section collects any data citations, data availability statements, or supplementary materials included in this article.
Supplementary Materials
Additional Supporting Information may be found in the online version of this article.
Supporting Figure 1.
Supporting Figure 2.