

Abstract
This study investigates the differential contribution of gray matter (GM) atrophy and deafferentation through white matter (WM) damage in the clinical progression of Alzheimer's disease (AD). Thirty‐one patients with probable AD, 23 with amnestic mild cognitive impairment (a‐MCI), and 14 healthy subjects underwent MRI scanning at 3T. Voxel‐based morphometry was used to assess regional GM atrophy in AD and a‐MCI patients. Diffusion tensor‐MRI tractography was used to reconstruct the cingulum bilaterally, and to quantify, voxel‐by‐voxel, its fractional anisotropy (FA) and mean diffusivity (MD) (measures of microscopic WM integrity). Atrophy of the cinguli was also assessed by means of jacobian determinants (JD) of local transformations. In AD patients, four clusters of reduced GM were found nearby the cinguli, in the posterior (PCC) and anterior cingulate cortex, and in the hippocampal/parahippocampal areas. Widespread areas of reduced FA and increased MD were found in the cinguli of both, AD and a‐MCI patients. A region of macroscopic atrophy was detectable in AD patients only. Strong associations were found between local GM densities in the four identified clusters, and measures of micro‐ and (to a lesser extent) macroscopic damage of patients' cinguli. Linear regression analyses revealed that MD in the cinguli predicts patients' measures of episodic memory in combination with GM density of hippocampal/parahippocampal areas, and measures of global cognition in combination with GM density of the PCC. This study indicates that brain deafferentation though the cingulum is likely to play a remarkable role in progressive development of cognitive impairment in AD. Hum Brain Mapp, 2011. © 2011 Wiley‐Liss, Inc.
Keywords: AD, MCI, deafferentation, VBM, tractography, DT‐MRI, cingulum
INTRODUCTION
Memory loss is the most typical symptom of onset of Alzheimer's disease (AD), and it is the defining feature of amnestic mild cognitive impairment (a‐MCI), which is widely considered as the condition most commonly associated with a high risk of conversion to AD [Petersen, 2004; Petersen et al., 2001]. Post‐mortem investigation essentially based on assessment of the anatomical distribution of tau pathology across the brain, has identified a progressive course of tissue damage in AD brains, involving the hippocampus and parahippocampal regions first, and then extending to the whole association cortex [Braak and Braak, 1991]. The main advantage of this staging system, is to substantially agree with neuropsychological and some neuroimaging indicators of disease [Bozzali et al., 2006; Serra et al., 2010a; Whitwell et al., 2007]. Conversely, but nonetheless relevant for the current study, deposition of β−amyloid has been found to be prominent in the cingulate cortex since the early clinical stages of AD [Chételat et al., 2010].
Although magnetic resonance imaging (MRI) investigations have demonstrated abnormalities in AD brains involving both, gray (GM) [Bozzali et al. 2001, 2006; Frisoni et. al., 2008; Karas et al., 2004] and white matter (WM) [Bozzali et al., 2002; Serra et al., 2010a], the relationship between the damage of these two tissues still remains under debate. Regional GM atrophy of specific brain regions is certainly one of the main causes of cognitive impairment in AD. However, a recent report, combining metabolic information with measures of GM and WM integrity, provided a direct evidence for deafferentation as a major factor implicated in AD pathophysiology [Villain et al., 2008]. Consistently, it has also been recently shown that a reduction of functional connectivity in the posterior cingulate cortex (PCC) is already present at the early stage of a‐MCI, but it is associated with local GM atrophy only in patients already converted to AD [Gili et al., 2010]. However, it should be mentioned that the early occurrence of GM atrophy in the PCC of patients with AD is a controversial finding as some authors have reported it [Choo et al., 2010; Pengas et al., 2010; Scahill et al., 2002]. These inconsistencies are likely to be due to differences in the clinical stage of the recruited patients and to different approaches to image analysis. Despite these controversies, one emerging hypothesis is that the neuronal loss occurring to the medial temporal lobe areas at early clinical stages of AD, may result in axonal loss, with deafferentation of other brain regions to which these axons project. This latter mechanism may contribute in determining some of the cognitive disabilities observed in AD.
The cingulate bundle (or cingulum) is the major median associative WM fasciculus; it includes, both short associative fibers, connecting various areas of the cingulate cortex, and long associative fibers, reciprocally connecting various frontal, temporal, and parietal regions. Most of these regions are believed to be part of a functional network, known as the default mode network [Greicius et al., 2003]. According to this theory, the efficiency of the functional interconnections between the nodes of this network is as relevant for cognition as it is the preservation of the single nodes. Functional connectivity is a concept based on the evidence that different brain regions presenting with synchronous patterns of activity, are likely to be part of a common network subserving more complex brain functions. Consistently, changes in functional connectivity have been associated with cognitive decline in AD [Gili et al, 2010; Greicius et al., 2004; Sorg et al., 2007]. Although, a clear relationship between functional and structural changes has not been demonstrated yet, one possibility is again that a structural deafferentaion of the PCC (a key region of the “default mode network”), might affect the functional integration within the “default mode network.” Structural disruption of the cingulum has been demonstrated in AD [Catheline et al., 2008; Choo et al., 2010; Villain et al., 2008], although it remains unclear whether such a damage is independent or secondary to GM loss.
Aim of this study was to identify in vivo (within the limitation of a cross‐sectional design) radiological markers of progression of AD pathology, to infer about the differential role of local GM damage and structural deafferentation (through WM damage) at different disease stages. We first assessed the pattern of GM atrophy in AD and a‐MCI patients, using Voxel‐based morphometry (VBM); then, we evaluated the presence of both microscopic damage and atrophy of the cingulum, using diffusion tensor (DT) MRI and tractography; we also investigated associations between the degree of GM loss in regions anatomically close to the cingulum and its WM matter damage. Finally, we tested the contribution of WM damage to the cingulum and of GM loss in surrounding brain region, to global cognitive impairment as well as to episodic memory of patients. The former is clinically relevant for AD staging; the latter is one of the cognitive domains most typically impaired in patients with AD or at high risk for developing it.
VBM is an operator‐independent technique for estimating differences in regional GM volume at the voxel scale [Ashburner and Friston, 2000; Good et al., 2001] between groups of subjects. Specific patterns of GM atrophy have been identified at different AD stages, and also in association with the risk of conversion from MCI to AD [Bozzali et al., 2006; Chételat et al., 2005]. The MRI technique best suited for investigating WM pathways, and thus potential disconnection, is DT‐MRI [Basser et al., 1994]. DT‐MRI is sensitive to the random motion of water molecules trapped within tissues, thus reflecting their structural characteristics. In WM, the motion of water molecules is hindered orthogonally to the fiber main direction and diffusion tends to be anisotropic. An index of the magnitude of diffusion independent on the diffusion direction is given by the mean diffusivity (MD). Diffusion anisotropy can be measured by DT‐MRI by means of fractional anisotropy (FA) [Pierpaoli and Basser, 1996], a quantity often regarded as an index of microscopic tissue integrity. FA images also provide an exquisite contrast within WM, highlighting structures with the most coherent directionality and those constituted by the most tightly packed fibers. This property can be exploited to assess WM atrophy, by measuring the amount of local deformation required to match a subject's FA map to a reference template [Pagani et al., 2007]. This use of FA instead of standard anatomical images (T1‐weighted) for the estimation of atrophy is supposed to increase the sensitivity to specific WM features. DT‐MRI can also be used to estimate the main direction of diffusion in every voxel of the brain, thus allowing the reconstruction of WM pathways (DT‐MRI tractography). To investigate a specific WM tract, tractography can be used to reconstruct it, obtaining tract specific FA and MD as measures of microscopic tissue integrity, and deformation fields (Jacobian determinants, JD) as a measure of macroscopic atrophy.
MATERIALS AND METHODS
Subjects
This study was approved by the local Institutional Review Board and complied with the Health Insurance Portability and Accountability Act. All subjects gave written informed consent (provided by an informant relative if the patient was incapable) before study initiation.
We recruited 31 patients clinically diagnosed with probable AD [F/M = 19/12; mean (standard deviation, SD) age = 72.8 (6.8) years; mean (SD) education = 8.0 (4.3) years] by NINCDS‐ADRDA consensus criteria [McKhann et al., 1984], and 23 patients with a‐MCI (single or multiple domain) [F/M = 12/11; mean (SD) age = 71.2 (6.7) years; mean (SD) education = 10.3 (4.5) years] according to current diagnostic criteria [Petersen et al., 2001]. By definition, cognitive deficits observed in a‐MCI patients had to result in no or in a very mild impact on their daily living activities, as confirmed by their total Clinical Dementia Rating score [Hughes et al., 1982], which had not to exceed 0.5. Fourteen elderly healthy subjects (HS) [F/M = 4/10; mean (SD) age = 68.0 (8.5) years; mean (SD) education = 12.8 (2.9) years] were also enrolled as control group. Major systemic, psychiatric and other neurological illnesses were carefully investigated and excluded in all subjects. The T1 weighted data of part of the patients included in this study were also used in a previous VBM investigation [see Serra et al., 2010b]
All recruited subjects underwent an extensive neuropsychological battery to explore all the principal cognitive domains. These data are summarized in Table I, which includes, for each administered test, cut‐off scores and appropriate references.
Table I.
Neuropsychological assessment of studied subjects
| Cognitive function | Neuropsychological Test | Mean (SD) score | ||
|---|---|---|---|---|
| a‐MCI (n = 23) | AD (n = 31) | HS (n = 14) | ||
| Global measure | ||||
| Mini Mental State Examination (cut‐off ≥ 23.8) [Folstein et al., 1975; Magni et al., 1996] | 24.9 (1.2)§ | 17.8 (4.2)*, # | 28.9 (1.2) | |
| Long term episodic memory | ||||
| Verbal material | 15 Rey's words list [Carlesimo et al., 1996] | |||
| Immediate recall (cut‐off ≥ 28.5) | 31.0 (6.8)§ | 20.9 (7.3)*, # | 49.7 (8.8) | |
| Delayed recall (cut‐off ≥ 4.6) | 4.3 (2.6)§ | 1.6 (2.1)*, # | 10.5 (2.1) | |
| Rey's Complex Figure [Carlesimo et al., 2002] | ||||
| Visuo‐spatial material | Immediate recall (cut‐off ≥ 6.4) | 10.5 (8.4) | 4.7 (5.4)# | – |
| Delayed recall (cut‐off ≥ 6.3) | 10.8 (6.0) | 2.4 (4.3) | – | |
| Short term memory | ||||
| Digit span (cut‐off ≥ 3.7) [Orsini et al., 1987] | 5.0 (1.2)§ | 4.6 (1.2)* | 6.4 (0.7) | |
| Corsi Blocking taks (cut‐off ≥ 3.5) [Orsini et al., 1987] | 3.8 (1.1)§ | 3.3 (1.6)* | 5.1 (0.3) | |
| Language | ||||
| Naming of objects from BADA (cut‐off ≥ 22) [Miceli et al., 1991] | 27.5 (3.1) | 22.3 (8.2)# | – | |
| Reasoning | ||||
| Raven's progressive matrices (cut‐off ≥ 18.9) [Carlesimo et al., 1996] | 28.0 (4.2)§ | 20.4 (7.2)*, # | 34.0 (2.4) | |
| Executive functions | ||||
| Modified Card Sorting Test (criteria achieved) (cut‐off ≥ 4.2) [Nocentini et al., 2002] | 4.3 (1.8) | 2.1 (1.5)# | – | |
| Phonological verbal fluency (cut‐off ≥17.3) [Carlesimo et al., 1996] | 30.2 (8.9)§ | 21.4 (8.3)* | 36.9 (8.4) | |
| Praxis abilities | ||||
| Copy of drawings (cut‐off ≥ 7.1) [Carlesimo et al., 1996] | 9.4 (1.6)§ | 6.6 (3.8)*, # | 12.0 (0.0) | |
AD, Alzheimer's disease; a‐MCI, amnestic‐mild cognitive impairment; HS, healthy subjects; SD, standard deviation.
Statistics: One‐way ANOVA
p ≤ 0.05 a‐MCI vs. HS;
p ≤ 0.05 AD vs. HS;
p < 0.05 AD vs. a‐MCI.
For each administered test appropriate adjustments for sex, age, and education were applied according to the Italian normative data. Moreover, available cut‐off scores of normality (≥95% of the lower tolerance limit of the normal population distribution) have been applied.
Moreover, subjects with signs of concomitant cerebral vascular disease (CVD) on conventional MRI scans were excluded because vascular pathology might be at least partially responsible for cognitive deficits and brain atrophy, making the diagnosis of MCI (on a neurodegenerative basis) or AD less plausible. As previously described [Serra, et al., 2010a], in order to minimize the risk of CVD, subjects were excluded if they had either two or more hyperintense lesions with a diameter ≥10 mm or more than eight hyperintense lesions with a diameter between 5 and 9 mm on dual‐echo MR images. In addition, for the purposes of the present study, subjects were excluded in the presence of any WM lesion in the cingulate bundles.
The data presented here are part of a longitudinal study, designed to collect all imaging data only at study entry. Patients with a‐MCI, however, undergo regular clinical and neuropsychological re‐assessments at 1 year intervals, and are then reclassified in those who remain stable, those who develop disabilities in additional cognitive domains, and those who convert to dementia. So far, 16 out of 23 a‐MCI patients completed their first clinical and neuropsychological follow‐up.
Magnetic Resonance Imaging
All imaging was obtained using a 3.0T MR scanner (Siemens Allegra, Erlangen, Germany), equipped with a circularly polarized transmit‐receive coil. The maximum gradient strength is 40 mT m−1, with a maximum slew rate of 400 mT m−1 ms−1.
The following scans were collected from each studied subject: (1) dual‐echo turbo spin echo (TSE), repetition time TR = 6190 ms, echo time TE = 12/109 ms; (2) fast fluid attenuated inversion recovery (FLAIR), TR = 8170 ms, TE = 96 ms; (3) a Modified Driven Equilibrium Fourier Transform (MDEFT) scan (TR = 1338 ms, TE = 2.4 ms, matrix = 256 × 224 × 176, in‐plane field of view FOV = 250 × 250 mm2, slice thickness =1 mm); and (4) a diffusion weighted Spin‐Echo Echo Planar Imaging (SE EPI) (TR = 7 s, TE = 85 ms, maximum b factor = 1000 s mm−2, isotropic resolution = 2.3 mm3). This sequence collects seven images with no diffusion weighting (b 0) and 61 images with diffusion gradients applied in 61 noncollinear directions. As explained above, dual echo TSE and FLAIR scans were collected with the purpose of excluding the presence of vascular pathology.
Image Analysis
Voxel‐based morphometry
MDEFT data were processed using the VBM protocol in SPM8 (http://www.fil.ion.ucl.ac.uk/spm/). For each subject, an iterative combination of segmentations and normalizations (implemented within the “Segment” SPM8 module) produced a GM probability map [Ashburner and Friston, 2005] in Montreal Neurological Institute (MNI) coordinates. To compensate for compression or expansion during warping of images to match the template, GM maps were “modulated” by multiplying the intensity of each voxel by the local value derived from the deformation field (JD) [Ashburner and Friston, 2001]. All data were then smoothed using a 10‐mm FWHM Gaussian kernel. Modulated and smoothed GM maps were used for group analyses. Between‐group local differences in GM volume were assessed by an analysis of covariance adjusted for age, years of education, and total intracranial volume. In evaluating each T‐contrast, we applied family‐wise error (FWE) [Worsley et al., 1992] correction for multiple comparisons at voxel level, and considered significant a p value of less than 0.05.
A post‐hoc analysis on some GM regions anatomically located next to the cingulum bundles and found to be atrophic in AD patients (as compared to HS), was also carried out as explained in the section “post‐hoc analysis.”
DT‐MRI
DT‐MRI data were processed using tools from the FMRIB software library (FSL, http://www.fmrib.ox.ac.uk/fsl/) and CAMINO (http://www.camino.org.uk). After eddy current correction, the DT was estimated voxel‐wise [Basser et al., 1994], and FA maps were derived for every subject. To minimise the variability in seed‐point positioning, which is the main source of variance in tractography [Heiervang et al., 2006], all DT‐MRI data were transformed into standard space, to obtain maps with comparable brain size and slice orientation for all subjects. This process was performed using the following procedure: (1) every subject's FA was matched to the FA template (available in FSL) using an affine transformation [Jenkinson and Smith, 2001]; (2) the transformations were then applied to each component of the DT using the PPD (Preservation of Principal Direction) algorithm [Alexander et al., 2001].
Seed and way points to reconstruct the cingulum were defined on each subject's color coded map according to published guidelines [Wakana et al., 2007]. The rotated DT was used to generate maps of FA and of the eigenvalues and eigenvectors for every subject, from which color coded directionality maps in standard space were computed [Pajevic and Pierpaoli, 1999]. First, a coronal slice was selected in the middle of the genu of the corpus callosum, and two regions of interest (ROIs) were outlined, one in either hemisphere, to include fibers with mainly anterior‐posterior orientation (identified in green on color‐coded maps), rostral to the corpus callosum; these regions were used as seed‐point regions for tractography. Next, a coronal section was selected in the middle of the splenium of the corpus callosum and two ROIs including the cingulum bundle were outlined using similar criteria; these regions were used as way‐point regions for tractography. MD maps were also computed.
The probabilistic index of connectivity (PICo) algorithm [Parker et al., 2003], implemented in CAMINO, was used for probabilistic tractography. This algorithm assigns to every voxel in the brain a probability of being connected to the seed point by considering multiple pathways emanating from the seed‐point region and from each point along the reconstructed pathways. The probability is estimated by streamline‐based tracking iterations (5000 in this case) repeated in a Monte Carlo fashion, and the effect of noise is estimated through a calibration step. Streamlines that do not reach the way‐point regions are discarded.
Every subject's affine transformed FA map was then warped to the FA template (JHU‐ICBM‐FA‐2mm), using the tool FNIRT from the FSL library [Andersson et al., 2007], thus obtaining the deformation field and the related JD. The latter reflects the amount of stretching (JD < 1) or shrinking (JD > 1) set by the deformation field for matching an image to a template. As a consequence, it can be used to estimate the local WM fiber bundles atrophy within a specified WM tract [Pagani et al., 2007]. The same transformation was also applied to MD.
FA and MD maps, reflecting tissue microstructure, and JD, reflecting WM atrophy, were used for group comparisons and correlations (see post‐hoc analysis).
For each subject, the nonlinear transformation was also applied to the probabilistic maps of the cingulum. Retaining from the transformed probabilistic maps of the cingulum only voxels with values larger than 0.1 (voxels with a probability of connection lower than such a value are likely to be artifactual connections due to noise) we were able to create for each subject the binary mask of the normalized cingulum, setting the values of retained voxels to 1 and the others to zero.
These normalized cingulum masks were averaged across all subjects; the obtained image was then thresholded (only voxels common to at least 10% of the whole population were included) and binarised, to yield a customised template‐mask of the cingulum, in which confining the statistical group comparisons of FA, MD, and JD.
We first ran a one‐way ANOVA with Bonferroni's correction (post‐hoc analysis; p < 0.05) for between group comparisons of average measures obtained from the cingulate bundle bilaterally, with respect to both microscopic (FA and MD) and macroscopic measures of tissue integrity (JD).
Then, voxel‐wise group differences in FA and MD of the cingulum were tested in FSL, using the tool randomize (2000 iterations), which performs permutation‐based statistical analyses. Three contrasts (HS > AD; HS > MCI; MCI > AD) were estimated to assess the presence of microscopic WM damage. The resultant statistical maps were thresholded at p < 0.05 corrected for multiple comparisons using the Threshold‐Free Cluster Enhancement (TFCE) method [Smith and Nichols, 2009]. The same voxel‐wise analysis with the same statistical constraint was also carried out on the JD maps, to assess the presence of macroscopic tissue loss within the cingulum.
Post‐hoc analysis
As reported in the results section, four clusters showing an anatomical localization nearby the cingulate bundle [anterior cingulate cortex (ACC) and PPC, and left and right hippocampal/parahippocampal areas] could be identified from the VBM contrast “AD < HS.” From these clusters, mean GM densities were extracted and compared between the three groups (AD, a‐MCI and HS) using a one‐way ANOVA, with post‐hoc Bonferroni correction. Moreover, to investigate the hypothesis that WM damage of the cingulum is associated with GM loss, voxelwise correlations of the FA, MD, and JD of the cingulum with the mean GM density of these regions were investigated using randomize with 2000 iterations. In this correlation analysis we included the whole sample of subjects (without dividing them according to their diagnosis), and we tested for both positive and negative correlations. The resultant statistical maps were thresholded at p < 0.05 corrected for multiple comparisons using the TFCE method [Smith and Nichols, 2009].
Linear regression analyses were finally used to determine whether GM densities in regions found to be atrophic nearby the cinglulum, and micro‐and macroscopic DT‐MRI derived measures of the cingulum (MD, FA, JD) all contribute independently to the following variables (which were set as the independent variable in each linear regression analysis): the MMSE score (a measure of global cognitive impairment), and the score at the delayed recall of the 15 Rey's words list (a measures of episodic memory, the only function impaired in all recruited patients).
RESULTS
There were no significant between group differences in age and sex. AD patients were significantly less educated than HS, in the absence of other group differences. As shown in Table I, the mean MMSE scores were significantly different between all groups. AD patients reported a widespread impairment in most cognitive functions, while a‐MCI patients performed worse than HS at all long‐term memory tests. Moreover, they reported significantly lower scores than HS at executive functions, reasoning and praxis. According to inclusion criteria, our a‐MCI patients (single or multiple domain) may be regarded as belonging to an intermediate stage between normal aging and dementia. Moreover, since the beginning of this research project, 16 a‐MCI patients were clinically and neuropsychologically reassessed at one year interval. Seven out of 16 remained stable (43.7%), 5 out of 16 had developed or worsened their multi‐domain impairment (31.3%), and 4 out of 16 had converted to dementia (25.0%).
GM Atrophy
AD patients showed widespread regions of GM reduction relatively to HS (Fig. 1 and Table II). In particular, one cluster was found in the PCC/precuneus (MNI coordinates of maximum: 0, −54, 40), and one at the boundary between the ACC and the superior frontal gyrus (ACC/SFG, coordinates: 0, 54, −8), both regions anatomically close to the cingulum. Additionally, two clusters were found in the right and left hippocampal/parahippocampal regions (coordinates: 16, −10, −16 and −22, −12, −16, respectively) that are known to be connected to the rest of the brain through the cinguli. As explained above, these four clusters were used to extract the mean GM density (mean modulated GM probability value per voxel) from each subject for further post‐hoc analysis.
Figure 1.
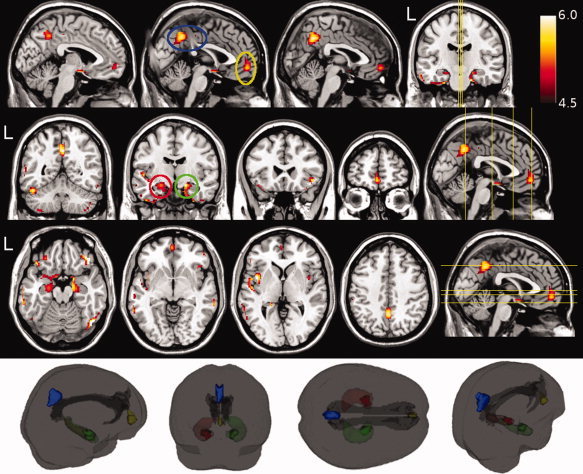
Voxel based morphometry revealed a widespread pattern of gray matter (GM) damage in patients with Alzheimer's disease (AD) as compared to healthy subjects (HS). These regions of significantly (p < 0.05, FWE corrected across the whole brain) lower GM volume are shown in red‐yellow (representing the t value, ranging from 4.5 to 6.0), and superimposed onto a T1‐weighted template. The circles highlight the four clusters used for further analysis, respectively located in the precuneus (blue), at the boundary between the anterior cingulate gyrus and the superior frontal gyrus (yellow), and in the hippocampal/parahippocampal areas (red for the left, and green for the right hemisphere). The inset in the lower part of the figure illustrates a 3D reconstruction of the cinguli (as obtained by tractography) together with four GM clusters used to investigate the relationship between GM and white matter damage (see text for further details).
Table II.
Between group differences in regional gray matter volumes as assessed by voxel‐based morphometry
| Brain region | Side | Size | Coordinates (mm) | Peak Z‐score | ||
|---|---|---|---|---|---|---|
| x | y | z | ||||
| AD patients < HS | ||||||
| Orbitofrontal cortex | R | 156 | 44 | 36 | −18 | 5.90 |
| Hippocampus/Parahippocampal gyrus/Orbitofrontal cortex | B | 1142 | 14 | −2 | −14 | 5.74 |
| Fusiform gyrus/inferior temporal gyrus | R | 307 | 50 | −68 | −16 | 5.65 |
| Insula/opercular cortex | L | 307 | −42 | 4 | 2 | 5.49 |
| Posterior cingulate/precuneus | B | 335 | 0 | −54 | 40 | 5.32 |
| Parahippocampal gyrus/fusiform gyrus | R | 33 | 28 | −8 | −42 | 5.20 |
| Middle and superior temporal gyrus | R | 56 | 68 | −32 | −6 | 5.19 |
| Middle and inferior temporal gyrus | L | 306 | −64 | −32 | −20 | 5.19 |
| Fusiform gyrus | L | 203 | −46 | −54 | −24 | 5.18 |
| Orbitofrontal cortex | L | 72 | −42 | 28 | −18 | 5.10 |
| Anterior cingulate/ medial prefrontal cortex | B | 139 | 0 | 54 | −8 | 5.00 |
| Cerebellum | R | 32 | 46 | −56 | −48 | 4.94 |
| Parahippocampal gyrus | L | 17 | −18 | −38 | 2 | 4.92 |
| Supramarginal gyrus | R | 24 | 52 | −30 | 50 | 4.91 |
| Inferior temporal gyrus | R | 25 | 40 | −8 | −44 | 4.82 |
| Cerebellum | R | 40 | 24 | −86 | −44 | 4.81 |
| Supramarginal gyrus | L | 18 | −34 | −66 | 46 | 4.80 |
| Cerebellum | L | 44 | −36 | −56 | −58 | 4.68 |
| Insula/opercular cortex | R | 21 | 42 | 4 | 4 | 4.63 |
| Superior temporal gyrus | L | 19 | −62 | −26 | −2 | 4.55 |
| AD patients < a‐MCI | ||||||
| Posterior cingulate | B | 297 | 2 | −50 | 38 | 5.58 |
| Middle Temporal gyrus | L | 57 | −64 | −16 | −18 | 4.77 |
| Middle Temporal gyrus | L | 43 | −62 | −44 | −12 | 4.63 |
AD, Alzheimer's disease; aMCI, amnestic mild cognitive impairment; R, Right; L, Left; B, Bilateral.
The size of each region is expressed in number of voxel. Only differences surviving after FWE correction for multiple comparison at voxel level (p < 0.05) have been reported (see text for further details).
There were no clusters of increased GM volume in AD patients compared to either a‐MCI or HS.
When comparing a‐MCI patients to HS, the reduction in regional GM volumes (hippocampus and parahippocampal gyrus, fusiform gyrus, and bilateral insula) did not survive FWE correction. Conversely, the direct comparison between AD and a‐MCI patients showed a significant GM reduction in the former group in the PCC/precuneus and in the left middle temporal gyrus (Fig. 2 and Table II), while no significant results were found when testing the reversed contrast.
Figure 2.

Voxel based morphometry revealed that gray matter (GM) volumes in the posterior cingulate and in the left middle temporal gyrus was reduced in Alzheimer's disease patients compared to those with amnestic mild cognitive impairment (p < 0.05, FWE corrected across the whole brain). These regions of significantly lower GM volume are shown in red‐yellow (representing the t value, ranging from 4.5 to 6.0), and superimposed onto a T1‐weighted template. The opposite contrast did not reveal any significant difference (see text for further details).
WM Damage to the Cingulum Bundles
In Figure 3, the box‐plots show between‐group differences in average FA (panel A) and MD (panel B), both measures of microscopic WM integrity, by considering all voxels derived from segmentation of the cingulate bundle bilaterally. A significant group effect was found for both measures: MD (F = 18.3; p < 0.0001) and FA (F = 7.3; p = 0.001). Post hoc analyses revealed that AD patients showed a higher average MD than both, HS (p < 0.0001) and a‐MCI patients (p = 0.0013). On turn, a‐MCI patients showed higher MD values than HS (p = 0.01). Average FA was lower in AD patients as compared to HS (p < 0.0001), while it was not significantly different between patients with AD and a‐MCI (p = 0.11). On turn, a‐MCI patients showed lower FA than HS (p = 0.04). A significant group effect was also found when considering the average change in JD (a measure of macroscopic change) derived from the cinglulum bilaterally (F = 3.66; p = 0.03). Post‐hoc analysis revealed a reduction of this parameter in AD patients as compared to HS only (p = 0.02; Fig. 3, panel C).
Figure 3.
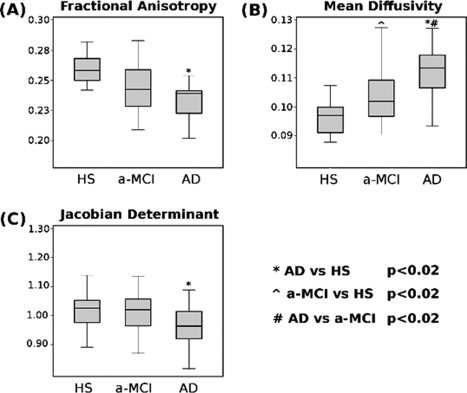
Box‐plots showing mean and percentile distributions of the fractional anisotropy (FA), mean diffusivity (MD), and Jacobian determinants (JD) values in the cingulate bundles of patients with Alzheimer's disease (AD) and amnestic mild cognitive impairment (a‐MCI), and healthy controls. The boundaries of the boxes represent the 25th and the 75th percentiles; the upper and lower bars represent the smallest and largest observations. FA values were significantly lower in AD patients as compared to HS. MD values were significantly different across all groups, with a progressive increasing from HS to a‐MCI, to AD patients. JD were significantly lower in AD patients as compared to HS, in the absence of other group differences (see text for further details).
When considering voxel‐wise comparisons across all groups, AD patients showed widespread areas of reduced FA and increased MD within the cingulum with respect to HS (Fig. 4, left column). A region of significant reduction of JD (macroscopic atrophy) was also found in the posterior part of the right cingulum of AD patients compared to HS (Fig. 4, left column). A‐MCI patients compared to HS showed areas of reduced FA and increased MD, although to a lesser extent than observed in AD patients, in the absence of any macroscopic change (Fig. 4, middle column). Finally, AD compared to a‐MCI patients showed several regions of increased MD, in the absence of any FA change, and in the presence of a small region (posterior part of the left cingulum) of reduced JD (Fig. 4, right column).
Figure 4.
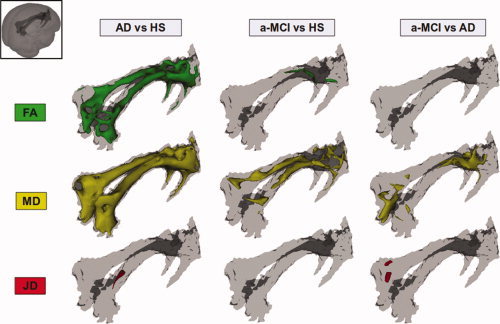
Results of between group voxel‐wise comparisons of mean diffusivity (MD), fractional anisotropy (FA), and Jacobian determinants (JD) as measured from the cingulum bundles. Patients with Alzheimer's disease (AD) showed widespread areas of reduced FA and increased MD with respect to healthy subjects (HS) (left column). A region of significant reduction of JD (macroscopic atrophy) was also present in the posterior part of the right cingulum of AD patients compared to HS (left column). Patients with amnestic mild cognitive impairment (a‐MCI) compared to HS showed a few regions of reduced FA and a diffuse increase of MD, in the absence of any significant JD difference (middle column). Finally, AD compared to a‐MCI patients showed several regions of increased MD, in the absence of any significant FA change and in the presence of a small region of reduced JD in the posterior part of the left cingulum (right column; see text for further details).
Post‐hoc Analysis
Four well defined clusters of GM atrophy were identified (by whole‐brain analysis) as anatomically close to the cinguli, one located within the posterior cingulate cortex/precuneus (PCC/precuneus), one within the anterior cingulate cortex/superior frontal gyrus (ACC/SFG), and two in the right and left hippocampal/parahippocampal regions (Fig. 1). The mean GM densities extracted from these clusters are summarized, for each studied group (AD, a‐MCI, HS) in Table III. A one‐way ANOVA with post‐hoc analysis showed that while AD patients had lower GM density of the ACC/SFG with respect to both a‐MCI patients (p = 0.0001) and HS (p = 0.0001), the reduction of GM density in a‐MCI patients compared to HS was not significant (p = 0.26) in this region. In the PCC/precuneus, AD patients had lower GM density than both a‐MCI patients (p < 0.0001) and HS (p < 0.0001). The difference in GM density between a‐MCI patients and HS was not significant in this region (p = 0.99). When considering the hippocampal/parahippocampal areas, AD patients showed lower GM density than both HS and patients with a‐MCI in the left (AD vs HS: p < 0.0001, AD vs MCI: p = 0.0001) as well as in the right (AD vs HS: p < 0.0001, AD vs MCI: p < 0.0001) hemisphere. No significant difference was found between HS and a‐MCI patients.
Table III.
Mean GM density of hippocampi, precuneus, and anterior cingulate gyrus, and mean FA and MD of the cingulum bundle
| HS | a‐MCI patients | AD patients | |
|---|---|---|---|
| GM density of the left hippocampal/ parahippocampal areas MNI coord: (−22, −12, −16) | 0.53 ± 0.05 | 0.50 ± 0.06 | 0.42 ± 0.08 |
| GM density of the right hippocampal/ parahippocampal areas MNI coord: (16, −10, −16) | 0.50 ± 0.05 | 0.47 ± 0.05 | 0.40 ± 0.07 |
| GM density of the precuneus MNI coord: (0, −54, 40) | 0.49 ± 0.08 | 0.49 ± 0.08 | 0.38 ± 0.05 |
| GM density of the ACC/SFG MNI coord: (−2, 52, −8) | 0.40 ± 0.08 | 0.38 ± 0.05 | 0.31 ± 0.06 |
| FA of cinguli | 0.26 ± 0.02 | 0.24 ± 0.02 | 0.23 ± 0.02 |
| MD of cinguli mm2 s−1 × 10⁻³ | 0.96 ± 0.06 | 1.04 ± 0.10 | 1.12 ± 0.08 |
| JD of cinguli | 1.03 ± 0.08 | 1.01 ± 0.08 | 0.97 ± 0.08 |
AD, Alzheimer's disease; a‐MCI, amnestic‐mild cognitive involvement; HS, healthy subjects; ACC, anterior cingulated cortex; SFG, superior frontal gyrus; FA, fractional anisotropy; GM, gray matter; MD, mean diffusivity.
GM density was extracted from four clusters located in the posterior and anterior cingulate cortex, and in the right and left hippocampal/parhahippocampal areas. These clusters were obtained by whole brain comparison between patients with AD and HS, at a statistical thereshold of p FWEcorrected < 0.05. In the case of the hippocampal/parhahippocampal regions, the table reports the average value between right and left side (see text for further details).
As shown in Figure 5, the voxelwise analysis of correlation (performed separately for the right and left hemisphere structures) showed a strong and widespread association between GM density of PCC/precuneus, ACC/SFG and hippocampal/parahippocampal areas, and FA and MD of the cingulum. Conversely, correlation analysis between local GM densities and JD of the cingulum revealed more confined regions of association in the posterior and anterior part of the cingulum.
Figure 5.
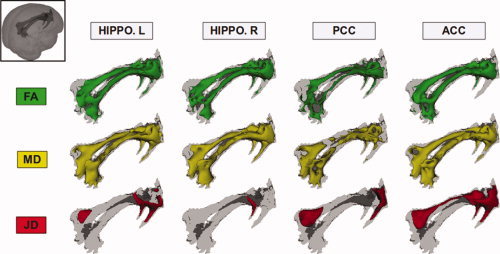
Results of the voxelwise analysis of correlation (including all subjects) between mean diffusivity (MD), fractional anisotropy (FA) and Jacobian determinant (JD) in the cingulum bundles and the mean values of GM density in the left and right hippocampal/parahippocampal areas, in the posterior cingulate/precuneus, and in the anterior cingulate cortex. These measures of local GM density and WM integrity were all strongly correlated to each other (see text for further details).
In the patients only, linear regression analysis was employed to assess the contribution of GM and WM variables to global cognition as assessed by MMSE score. In this model, MMSE score was entered as the dependent variable, while GM densities from all considered clusters (ACC/SFG; PCC/precuneus; hippocampal/parahippocampal areas) and FA, MD, and JD from the cinguli were entered as predictors. The best model (F = 19.39; p < 0.001) was the one including only the mean MD from the cinguli (β = −0.31, p = 0.005) and the GM density from the PCC/precuneus (β = 0.41, p < 0.001). In a second linear regression analysis (including the same independent variables) to predict the Delayed Recall of Rey's word list scores (dependent variable assessing episodic memory), the best model (F = 17.32; p < 0.001) was the one including the GM density in the hippocampal/parahippocampal areas (β = 0.23; p = 0.06) and MD from the cinguli (β = −0.49; p < 0.001).
DISCUSSION
This study investigates in vivo the progression of brain damage from the medial temporal lobes to other structurally connected areas of the brain of patients with AD at different clinical stages. Due to the cross‐sectional design of this study, to have a full representation of the spectrum ranging from healthy aging to fully developed dementia, we included patients with a‐MCI. We considered a‐MCI as a “prodromal” AD stage as suggested by other authors [Petersen, 2004]. Although we cannot be sure that all recruited a‐MCI patients will convert to AD in a short time, this concept is supported by evidence of progression in cognitive impairment in a large proportion of a‐MCI patients at 1 year follow‐up.
The cingulum is the most prominent WM tract of the limbic system, being directly connected to medial temporal lobe structures. According to gross pathology studies, the degenerative processes occurring in AD are initially well localized to the entorhinal cortex/hippocampus, and then progressively extend to other neocortical regions [Braak and Braak, 1995; Gomez‐Isla et al., 1996]. In this continuous transitional process between normal aging and dementia, a‐MCI represents the earliest stage of AD that can be detected by clinical instruments. The further accumulation of cognitive deficits, until conversion to dementia, is probably due to several pathophysiological mechanisms that are concomitantly present in AD brains. A progressive dissemination of AD pathology across the brain, with consequent GM loss, is certainly one of the most relevant mechanisms. However, several higher‐level functions are known to rely on cooperation of brain areas anatomically located far from each other [Grecius et al., 2003; Raichle et al., 2007], and structural brain disconnection (by deafferentation mechanism) is believed to be critically associated with the clinical manifestations of AD [Gili et al., 2010]. Previous studies have extensively demonstrated the presence of widespread GM atrophy in patients with AD [Bozzali et al., 2006; Chételat et al., 2005; Serra et al., 2010a], as well as a selective damage to the cingulum [Catheline et al., 2008; Choo et al., 2010; Fellgiebel et al., 2005; Villain et al. 2008, 2010; Xie et al., 2005; Zhang et al., 2007]. DT‐MRI (and DT‐based tractography) represents the most suitable approach to investigate well defined WM tracts such as the cingulate bundle. There are many published DT‐MRI studies [e.g., Catheline et al., 2008; Choo et al., 2010; Fellgiebel et al., 2005; Villain et al., 2008; Xie et al., 2005; Zhang et al., 2007] that have clarified the critical involvement of cingulum in AD. Measures of microscopic WM damage have been found to correlate with measures of cognitive impairment [Xie et al., 2005]. The originality of our work lies in the set up of a voxel‐wise approach able to assess microscopic damage, by means of FA and MD, and local atrophy, by means of JD.
Against this background, we aimed to investigate the relationship between these two pathophysiological processes of AD pathology, namely regional GM atrophy and structural disconnection (by deafferentation mechanism). First, using VBM, we replicated previous findings, showing a widespread GM atrophy in AD patients (Fig. 1), and a more restricted GM involvement in patients with a‐MCI [Bozzali et al., 2006; Chételat et al., 2005; Serra et al., 2010a], which did not survive correction for multiple comparisons. As previously demonstrated [Bozzali et al., 2006], GM volumetrics in MCI patients (a heterogeneous condition) can be similar to either that of HS or that of AD patients according to their staging between normal aging and dementia. Our VBM findings indicate that our MCI patients were, on average, at early clinical stages. With respect to GM atrophy in regions anatomically close to the cingulum, we found four main localizations (left and right hippocampal/parahippocampal regions, PCC/precuneus, and ACC/SFG), which resulted atrophic in AD from the whole brain contrast “AD patients vs. HS” (Fig. 1). However, DT‐MRI tractography of the cingulum revealed the following findings: (1) widespread FA reductions and MD increases in patients with AD compared to HS, in the presence of less extensive areas of macroscopic WM atrophy (Figs. 3 and 4); (2) diffuse MD and more restricted FA changes in a‐MCI patients as compared to HS in the absence of any macroscopic WM atrophy (Figs. 3 and 4); (3) extensive associations between FA and MD across the cingulum and GM density in the hippocampal/parahippocampal regions, in the PCC/precuneus and in the ACC/SFG (Fig. 5); and finally 4) associations between GM density of these areas and JD (macroscopic atrophy) in more restricted regions of the posterior and anterior parts of the cinguli (Fig. 5). Several authors have suggested that a progressive loss of neuronal efferents from the medial temporal lobe structures strongly contributes in affecting posterior brain regions per se in AD [Buckner, 2004], as well as more widespread neuronal networks relevant for cognition [Sorg et al., 2007]. Consistently, the microscopic and macroscopic changes we found in the cinguli might reflect a degeneration of the WM tract secondary to GM loss in medial temporal lobe structures. Interestingly, the progressive damage of the cingulum seems to parallel the increasing cognitive decline between patients with a‐MCI and patients with AD, with a macroscopic WM atrophy being present only at the stage of AD. Pathological processes that may reduce FA and increase MD include a decrease in axonal number and/or density, a reduction of axonal myelination, and, in the former case, a decreased coherence of the fiber tracts. At this stage, we cannot ascertain the specific pathophysiological substrate of these changes. However, according to our results, we can hypothesize that degeneration of GM in medial temporal lobe structures may result in macroscopic atrophy of the cingulum only at more advanced stages of AD pathology.
The posterior‐anterior hypothesis of progression of AD pathology mainly rises from Braak and Braak staging [Braak and Braak, 1991] and progressive accumulation of cognitive disabilities from memory deficits to impairment of other domains. As already mentioned, although this evolution is consistent with the spread of neurofibrillary tangles, it is less supported by the anatomical distribution of β‐amyloid [Chételat at al., 2010]. It is therefore possible that two different pathways take place concomitantly in AD brains. Our current study, as well as other [Catheline et al., 2008; Choo et al., 2010; Fellgiebel et al., 2005; Villain et al., 2008; Xie et al., 2005; Zhang et al., 2007] are based on a cross‐sectional design, which make any interpretation in terms of “causality” of events only speculative. A recent longitudinal investigation [Villain et al., 2010], which combined metabolic and volumetric data, indicates that hippocampal atrophy in amnestic MCI patients is related to subsequent disruption of the cingulum and the uncinate fasciculus. Consistent with the posterior‐anterior hypothesis of progression of tissue damage at different AD stages, we found the MD values of the cingulum to better predict patients' episodic memory dysfunction when associated to GM atrophy of the hippocampal/parahippocampal areas. Conversely, the MMSE score, which is a measure of global cognition, was better predicted by MD from the cinguli in association with GM density from the PCC/precuneus. These data are in agreement with previous PET studies in patients with AD, showing a reduction in resting glucose metabolism in medial temporal lobe regions and PCC as the most common functional AD abnormalities [Mosconi, 2005]. In the same perspective, other authors have shown how the resting glucose metabolism in retrosplenial cortex is strictly correlated with memory recall performance in AD patients [Desgranges et al., 2002]. Finally, using resting state functional MRI (fMRI) in association with VBM, it has been recently reported that functional disconnection in the PCC precedes the occurrence of local atrophy when comparing patients with AD against those with a‐MCI [Gili et al., 2010]. In this perspective, our current findings support the idea that GM loss in the PCC, probably due to deafferentation from medial temporal lobes, is critical for conversion from a‐MCI to AD. Further, this study, combining information of regional GM damage and structural brain disconnection (by deafferentation mechanism) at different AD stages, provides a link to combine the pathological knowledge of AD progression with brain volumetrics and functional imaging data. It should be noted that, in contrast with our findings, other authors have reported the presence of atrophy in the PCC of patients with MCI [Choo et al., 2010; Pengas et al., 2010]. This inconsistency across studies may be due to several reasons. First, the population of patients with MCI is known to be quite heterogeneous. Including small groups of patients, it is possible that subjects, who are indistinguishable from each other on a clinical/neuropshychological basis, are indeed at different transitional stages of AD progression, at least in terms of regional GM loss [Bozzali et al., 2006]. Moreover, as it is the case for the current study, full information about the conversion to AD is not available for all MCI patients, and a part of them might not convert to AD, or at least, not in a short time. Finally, the use of different image analysis methods may account for different results. Volumetric measures based on manual definition of anatomical structures [Choo et al., 2010; Pengas et al., 2010] are known to be more sensitive, but less reproducible than those based on voxel‐wise analyses [for a review, see Bozzali et al., 2008]. In a longitudinal study based on serial fluid registrations of images, Scahill and co‐workers, described the PCC and hippocampus as areas of accelerated atrophy across AD evolution, since the presymptomatic stages of the disease [Scahill et al., 2002]. A direct comparison between longitudinal [Schaill et al., 2002] and cross‐sectional data analyses (this work) is not feasible for obvious reasons. However, the two approaches seem to consistently remark the critical role of the anatomical system “hippocampus‐PCC” in accounting for the clinical evolution of AD.
Among all regions of GM atrophy close to the cingulum, we also found a more anterior cluster which was located in the ACC/SFG. GM density in this location was strictly associated with MD and FA values from the cinguli, although it did not contribute in predicting either measures of episodic memory or measures of global cognition of patients. Moreover, GM density in this area was significantly reduced in patients with AD but not in those with a‐MCI, indicating that this anterior GM loss is prominent at more advanced stages of the disease.
Despite these correlations between WM damage and GM atrophy, we cannot ascertain whether local degeneration in medial frontal regions is totally due to disconnection (by deafferentation mechanism) through the cingulum, or it may be the result of an independent and concomitant process. Future studies are needed to further clarify this issue.
From our analysis of the cingulum, it clearly appears that MD is more sensitive than FA in discriminating between a‐MCI patients and both, HC and patients with AD. As mentioned above, we can only speculate about the underlying pathological changes that result in modifications of these DT‐derived measures. We hypothesize that, following neuronal death in the medial temporal lobe structures, demyelination of residual axons in the cingulum might represent the first step of WM degeneration, resulting in an increase of water molecule mobility in all directions (increased MD), while preserving a preferential diffusion direction along axons (undetectable changes in FA). At more advanced stages, a combination of axonal loss/degeneration and gliosis might lead to changes of both, MD and FA.
This study has several limitations. As already mentioned above, some of the recruited patients with a‐MCI still lack of a long‐term follow‐up. It is possible that al least a part of them will not develop AD in a short time, thus introducing a potential bias in our longitudinal analysis, based on the assumption that all our MCI patients are at a prodromal stage of AD. Another limitation, introducing a potential bias in our analysis, is the difference in group size between a‐MCI and AD patients, which might have affected the statistical power. As already mentioned above, these limitations might account for some inconsistencies between previous studies and this work.
In conclusion, this study suggests that the involvement of PCC/precuneus, as well as that of the ACC/SFG, can be, at least partially, explained by structural disconnection (by deafferentation mechanism), and that the cingulum plays a relevant role in explaining both, the spread of disease from the medial temporal lobe to the rest of the brain, and the progressive development of cognitive impairment in AD.
REFERENCES
- Alexander DC, Pierpaoli C, Basser PJ, Gee JC ( 2001): Spatial transformations of diffusion tensor magnetic resonance images. IEEE Trans Med Imaging 20: 1131–1139. [DOI] [PubMed] [Google Scholar]
- Andersson JL, Jenkinson M, Smith S ( 2007): Non‐linear registration, aka Spatial normalisation, FMRIB technical report TR07JA2. Available at: http://www.fmrib.ox.ac.uk/analysis/techrep.
- Ashburner J, Friston KJ ( 2000): Voxel‐based morphometry‐the methods. Neuroimage 11: 805–821. [DOI] [PubMed] [Google Scholar]
- Ashburner J, Friston KJ ( 2001): Why voxel‐based morphometry should be used. Neuroimage 14: 1238–1243. [DOI] [PubMed] [Google Scholar]
- Ashburner J, Friston KJ ( 2005): Unified segmentation. Neuroimage 26: 839–851. [DOI] [PubMed] [Google Scholar]
- Basser PJ, Mattiello J, LeBihan D ( 1994): Estimation of the effective self‐diffusion tensor from the NMR spin echo. J Magn Reson B 103: 247–254. [DOI] [PubMed] [Google Scholar]
- Bozzali M, Franceschi M, Falini A, Pontesilli S, Cercignani M, Magnani G, Scotti G, Comi G, Filippi M ( 2001): Quantification of tissue damage in AD using diffusion tensor and magnetization transfer MRI. Neurology 57: 1135–1137. [DOI] [PubMed] [Google Scholar]
- Bozzali M, Falini A, Franceschi M, Cercignani M, Zuffi M, Scotti G, Comi G, Filippi M ( 2002): White matter damage in Alzheimer's disease assessed in vivo using diffusion tensor magnetic resonance imaging. J Neurol Neurosurg Psychiatry 72: 742–746. [DOI] [PMC free article] [PubMed] [Google Scholar]
- Bozzali M, Filippi M, Magnani G, Cercignani M, Franceschi M, Schiatti E, Castiglioni S, Mossini R, Falautano M, Scotti G, Comi G, Falini A ( 2006): The contribution of voxel‐based morphometry in staging patients with mild cognitive impairment. Neurology 67: 453–460. [DOI] [PubMed] [Google Scholar]
- Bozzali M, Cercignani M, Caltagirone C ( 2008): Brain volumetrics to investigate aging and the principal forms of degenerative cognitive decline: A brief review. Magn Reson Imaging 26: 1065–1070. [DOI] [PubMed] [Google Scholar]
- Braak H, Braak E ( 1991): Neuropathological stageing of Alzheimer‐related changes. Acta Neuropathol 82: 239–259. [DOI] [PubMed] [Google Scholar]
- Braak H, Braak E ( 1995): Staging of Alzheimer's disease‐related neurofibrillary changes. Neurobiol Aging 16: 271–278; discussion 278–284. [DOI] [PubMed] [Google Scholar]
- Buckner RL ( 2004): Memory and executive function in aging and AD: multiple factors that cause decline and reserve factors that compensate. Neuron 44: 195–208. [DOI] [PubMed] [Google Scholar]
- Carlesimo GA, Caltagirone C, Gainotti G ( 1996): The Mental Deterioration Battery: normative data, diagnostic reliability and qualitative analyses of cognitive impairment. The Group for the Standardization of the Mental Deterioration Battery. Eur Neurol 36: 378–384. [DOI] [PubMed] [Google Scholar]
- Carlesimo GA, Buccione I, Fadda L, Graceffa A, Mauri M, Lo russo S, Bevilacqua G, Caltagirone C ( 2002): “Standardizzazione di due test di memoria per uso clinico: Breve Racconto e Figura di Rey”. Nuova Rivista di Neurologia 12: 1–13. [Google Scholar]
- Catheline G, Periot O, Amirault M, Braun M, Dartigues JF, Auriacombe S, Allard M ( 2010): Distinctive alterations of the cingulum bundle during aging and Alzheimer's disease. Neurobiol Aging 31: 1582–1592. [DOI] [PubMed] [Google Scholar]
- Chételat G, Landeau B, Eustache F, Mézenge F, Viader F, de la Sayette V, Desgranges B, Baron JC ( 2005): Using voxel‐based morphometry to map the structural changes associated with rapid conversion in MCI: a longitudinal MRI study. Neuroimage 27: 934–946. [DOI] [PubMed] [Google Scholar]
- Chételat G, Villemagne VL, Bourgeat P, Pike KE, Jones G, Ames D, Ellis KA, Szoeke C, Martins RN, O'Keefe GJ, Salvado O, Masters CL, Rowe CC ( 2010): Relationship between atrophy and beta‐amyloid deposition in Alzheimer disease. Ann Neurol 67: 317–324. [DOI] [PubMed] [Google Scholar]
- Choo IH, Lee DY, Oh JS, Lee JS, Lee DS, Song IC, et al. ( 2010): Posterior cingulate cortex atrophy and regional cingulum disruption in mild cognitive impairment and Alzheimer's disease. Neurobiol Aging 31: 772–779. [DOI] [PubMed] [Google Scholar]
- De Blese R, Denes G, Luzzatti C, Mazzocchi A, Poeck K, Spinnler H, Willmes K ( 1986): L'Aachener Aphasie test I: Problemi e soluzioni per una versione italiana del test e per uno studio crosslinguistico dei disturbi afasici. Arch Psicol Neurol Psichiatr 47: 209–236. [Google Scholar]
- Desgranges B, Baron JC, Lalevée C, Giffard B, Viader F, de La Sayette V, Eustache F ( 2002): The neural substrates of episodic memory impairment in Alzheimer's disease as revealed by FDG‐PET: relationship to degree of deterioration. Brain 125: 1116–1124. [DOI] [PubMed] [Google Scholar]
- Folstein MF, Folstein SE, McHugh PR ( 1975): Mini‐mental state. A practical method for grading the cognitive state of patients for the clinician. J Psychiatr Res 12: 189–198. [DOI] [PubMed] [Google Scholar]
- Fellgiebel A, Müller MJ, Wille P, Dellani PR, Scheurich A, Schmidt LG, et al. ( 2005): Color‐coded diffusion‐tensor‐imaging of posterior cingulate fiber tracts in mild cognitive impairment. Neurobiol Aging 26: 1193–1198. [DOI] [PubMed] [Google Scholar]
- Gili T, Cercignani M, Serra L, Perri R, Giove F, Maraviglia B, Caltagirone C, Bozzali M ( 2011): Regional brain atrophy and functional disconnection across Alzheimer's disease evolution. J Neurol Neurosurg Psychiatry 82: 58–66. [DOI] [PubMed] [Google Scholar]
- Gomez‐Isla T, Price JL, McKeel DW Jr., Morris JC, Growdon JH, Hyman BT ( 1996): Profound loss of layer II entorhinal cortex neurons occurs in very mild Alzheimer's disease. J Neurosci 16: 4491–4500. [DOI] [PMC free article] [PubMed] [Google Scholar]
- Good CD, Johnsrude IS, Ashburner J, Henson RN, Friston KJ, Frackowiak RS ( 2001): A voxel‐based morphometric study of ageing in 465 normal adult human brains. Neuroimage 14: 21–36. [DOI] [PubMed] [Google Scholar]
- Greicius MD, Krasnow B, Reiss AL, Menon V ( 2003): Functional connectivity in the resting brain: a network analysis of the default mode hypothesis. Proc Natl Acad Sci U S A 100: 253–258. [DOI] [PMC free article] [PubMed] [Google Scholar]
- Greicius MD, Srivastava G, Reiss AL, Menon V ( 2004): Default‐mode network activity distinguishes Alzheimer's disease from healthy aging: evidence from functional MRI. Proc Natl Acad Sci U S A 101: 4637–4642. [DOI] [PMC free article] [PubMed] [Google Scholar]
- Heiervang E, Behrens TE, Mackay CE, Robson MD, Johansen‐Berg H ( 2006): Between session reproducibility and between subject variability of diffusion MR and tractography measures. Neuroimage 33: 867–877. [DOI] [PubMed] [Google Scholar]
- Hughes CP, Berg L, Danziger WL, Coben LA, Martin RL ( 1982): A new clinical scale for the staging of dementia. Br J Psychiatry 40: 566–572. [DOI] [PubMed] [Google Scholar]
- Jenkinson M, Smith S ( 2001): A global optimisation method for robust affine registration of brain images. Med Image Anal 5: 143–156. [DOI] [PubMed] [Google Scholar]
- Karas GB, Scheltens P, Rombouts SA, Visser PJ, van Schijndel RA, Fox NC, Barkhof F ( 2004): Global and local gray matter loss in mild cognitive impairment and Alzheimer's disease. Neuroimage 23: 708–716. [DOI] [PubMed] [Google Scholar]
- Magni E, Binetti G, Padovani A, Cappa SF, Bianchetti A, Trabucchi M ( 1996): The Mini‐Mental State Examination in Alzheimer's disease and multi‐infarct dementia. Int Psychogeriatr 8: 127–134. [DOI] [PubMed] [Google Scholar]
- Miceli G, Laudanna A, Burani C, Capasso R ( 1991): Batteria per l'analisi dei deficit afasici. Ass.ne per lo sviluppo delle ricerche neuropsicologiche. Berdata.
- McKhann G, Drachman D, Folstein M, Katzman R, Price D, Stadlan EM ( 1984): Clinical diagnosis of Alzheimer's disease: Report of the NINCDS‐ADRDA Work Group under the auspices of Department of Health and Human Services Task Force on Alzheimer's Disease. Neurology 34: 939–944. [DOI] [PubMed] [Google Scholar]
- Mosconi L ( 2005): Brain glucose metabolism in the early and specific diagnosis of Alzheimer's disease. FDG‐PET studies in MCI and AD. Eur J Nucl Med Mol Imaging 32: 486–510. [DOI] [PubMed] [Google Scholar]
- Nocentini U, Di Vincenzo S, Panella M, Pasqualetti P, Caltagirone C ( 2002). La valutazione delle funzioni esecutive nella pratica neuropsicologica: dal Modified Card Sorting Test al Modified Card Sorting Test‐Roma Version. Dati di standardizzazione. Nuova Rivista di Neurologia 12: 14–24. [Google Scholar]
- Orsini A, Grossi D, Capitani E, Laiacona M, Papagno C, Vallar G ( 1987): Verbal and spatial immediate memory span: Normative data from 1355 adults and 1112 children. Ital J Neurol Sci 8: 539–554. [DOI] [PubMed] [Google Scholar]
- Pagani E, Horsfield MA, Rocca MA, Filippi M ( 2007): Assessing atrophy of the major white matter fiber bundles of the brain from diffusion tensor MRI data. Magn Reson Med 58: 527–534. [DOI] [PubMed] [Google Scholar]
- Pajevic S, Pierpaoli C ( 1999): Color schemes to represent the orientation of anisotropic tissues from diffusion tensor data: Application to white matter fiber tract mapping in the human brain. Magn Reson Med 42: 526–540. [PubMed] [Google Scholar]
- Parker GJ, Haroon HA, Wheeler‐Kingshott CA ( 2003): A framework for a streamline‐based probabilistic index of connectivity (PICo) using a structural interpretation of MRI diffusion measurements. J Magn Reson Imaging 18: 242–254. [DOI] [PubMed] [Google Scholar]
- Pengas G, Hodges JR, Watson P, Nestor PJ ( 2010): Focal posterior cingulate atrophy in incipient Alzheimer's disease. Neurobiol Aging 31 25–33. [DOI] [PubMed] [Google Scholar]
- Petersen RC ( 2004): Mild cognitive impairment as a diagnostic entity. J Intern Med 256: 183–194. [DOI] [PubMed] [Google Scholar]
- Petersen RC, Doody R, Kurz A, Mohs RC, Morris JC, Rabins PV, Ritchie K, Rossor M, Thal L, Winblad B ( 2001): Current concepts in mild cognitive impairment. Arch Neurol 58: 1985–1992. [DOI] [PubMed] [Google Scholar]
- Pierpaoli C, Basser PJ ( 1996): Toward a quantitative assessment of diffusion anisotropy. Magn Reson Med 36: 893–906. [DOI] [PubMed] [Google Scholar]
- Raichle ME, Snyder AZ ( 2007): A default mode of brain function: A brief history of an evolving idea. Neuroimage 37: 1083–1090; discussion 1097–1099. [DOI] [PubMed] [Google Scholar]
- Scahill RI, Schott JM, Stevens JM, Rossor MN, Fox NC ( 2002): Mapping the evolution of regional atrophy in Alzheimer's disease: Unbiased analysis of fluid‐registered serial MRI. Proc Natl Acad Sci USA 99: 4703–4707. [DOI] [PMC free article] [PubMed] [Google Scholar]
- Serra L, Cercignani M, Lenzi D, Perri R, Fadda L, Caltagirone C, Macaluso E, Bozzali M ( 2010a): Grey and white matter changes at different stages of Alzheimer's disease. J Alzheimers Dis 19: 47–59. [DOI] [PubMed] [Google Scholar]
- Serra L, Perri R, Cercignani M, Spanò B, Fadda L, Marra C, Carlesimo GA, Caltagirone C, Bozzali M ( 2010b): Are the Behavioral Symptoms of Alzheimer's Disease Directly Associated with Neurodegeneration? J Alzheimers Dis 21: 627–639. [DOI] [PubMed] [Google Scholar]
- Smith SM, Nichols TE ( 2009): Threshold‐free cluster enhancement: Addressing problems of smoothing, threshold dependence and localisation in cluster inference. Neuroimage 44: 83–98. [DOI] [PubMed] [Google Scholar]
- Sorg C, Riedl V, Mühlau M, Calhoun VD, Eichele T, Läer L, Drzezga A, Förstl H, Kurz A, Zimmer C, Wohlschläger AM ( 2007): Selective changes of resting‐state networks in individuals at risk for Alzheimer's disease. Proc Natl Acad Sci U S A 104: 18760–18765. [DOI] [PMC free article] [PubMed] [Google Scholar]
- Villain N, Desgranges B, Viader F, de la Sayette V, Mézenge F, Landeau B, Baron JC, Eustache F, Chételat G ( 2008): Relationships between hippocampal atrophy, white matter disruption, and gray matter hypometabolism in Alzheimer's disease. J Neurosci 28: 6174–6181. [DOI] [PMC free article] [PubMed] [Google Scholar]
- Villain N, Fouquet M, Baron JC, Mézenge F, Landeau B, de La Sayette V, Viader F, Eustache F, Desgranges B, Chételat G ( 2010): Sequential relationships between grey matter and white matter atrophy and brain metabolic abnormalities in early Alzheimer's disease. Brain 133: 3301–3314. [DOI] [PMC free article] [PubMed] [Google Scholar]
- Wakana S, Caprihan A, Panzenboeck MM, Fallon JH, Perry M, Gollub RL, Hua K, Zhang J, Jiang H, Dubey P, Blitz A, van Zijl P, Mori S ( 2007): Reproducibility of quantitative tractography methods applied to cerebral white matter. Neuroimage 36: 630–644. [DOI] [PMC free article] [PubMed] [Google Scholar]
- Whitwell JL, Przybelski SA, Weigand SD, Knopman DS, Boeve BF, Petersen RC, Jack CR Jr ( 2007): 3D maps from multiple MRI illustrate changing atrophy patterns as subjects progress from mild cognitive impairment to Alzheimer's disease. Brain 130: 1777–1786. [DOI] [PMC free article] [PubMed] [Google Scholar]
- Worsley KJ, Evans AC, Marrett S, Neelin P ( 1992): A three‐dimensional statistical analysis for CBF activation studies in human brain. J Cereb Blood Flow Metab 12: 900–918. [DOI] [PubMed] [Google Scholar]
- Xie S, Xiao JX, Wang YH, Wu HK, Gong GL, Jiang XX ( 2005): Evaluation of bilateral cingulum with tractography in patients with Alzheimer's disease. Neuroreport 16: 1275–1278. [DOI] [PubMed] [Google Scholar]
- Zhang Y, Schuff N, Jahng GH, Bayne W, Mori S, Schad L, Mueller S, Du AT, Kramer JH, Yaffe K, Chui H, Jagust WJ, Miller BL, Weiner MW ( 2007): Diffusion tensor imaging of cingulum fibers in mild cognitive impairment and Alzheimer disease. Neurology 68: 13–19. [DOI] [PMC free article] [PubMed] [Google Scholar]