

Abstract
Cross‐modal processing enables the utilization of information received via different sensory organs to facilitate more complicated human actions. We used functional MRI on early‐blind individuals to study the neural processes associated with cross auditory‐spatial learning. The auditory signals, converted from echoes of ultrasonic signals emitted from a navigation device, were novel to the participants. The subjects were trained repeatedly for 4 weeks in associating the auditory signals with different distances. Subjects' blood‐oxygenation‐level‐dependent responses were captured at baseline and after training using a sound‐to‐distance judgment task. Whole‐brain analyses indicated that the task used in the study involved auditory discrimination as well as spatial localization. The learning process was shown to be mediated by the inferior parietal cortex and the hippocampus, suggesting the integration and binding of auditory features to distances. The right cuneus was found to possibly serve a general rather than a specific role, forming an occipital‐enhanced network for cross auditory‐spatial learning. This functional network is likely to be unique to those with early blindness, since the normal‐vision counterparts shared activities only in the parietal cortex. Hum Brain Mapp, 2012. © 2011 Wiley Periodicals, Inc.
Keywords: cross‐modal learning, spatial localization, functional MRI, blindness, neuroplasticity
INTRODUCTION
Cross‐modal processing serves an important function in our lives, enabling us to utilize the information we receive via different sensory organs to facilitate more complicated actions. For instance, the viewing of smiling faces indicates that we are in pleasant social circumstances, whereas smelling a disgusting odor will lead us to avoid or escape the offending stimulus. Although this association between sensory inputs and behavioral outputs may or may not involve intensive learning, previous studies have shown that cross‐modal association is mediated by rather sophisticated neural processes. A facial‐affect recognition task (which probes the emotions associated with facial features) found that males, as opposed to females, underwent activation of the right insula and the left thalamus, suggesting recall of past emotional experiences during appraisal of salient facial features [Lee et al., 2005]. In an odour pleasantness task (investigating the effect of vision associated with odor), activation of the hippocampus and the orbital frontal cortex in the congruent picture‐odor condition meant that semantic associations between these two modalities were being retrieved or reactivated during the process [Gottfried and Dolan, 2003]. In this study, we wanted to learn more about how simple auditory signals can be utilized for spatial processing. We recruited individuals with early blindness as subjects for two reasons. First, because these subjects did not have prior visual experiences with spatial objects, the association between auditory signals and spatial information could not be mediated by visual function. Second, use of early‐blind individuals allowed us to further understand the role of the occipital lobe in facilitating cross auditory‐spatial processing.
The frontal cortex and hippocampus have been shown to be involved in learning to associate auditory and visual stimuli [Calvert, 2001; Gonzalo et al., 2000]. In particular, areas of the frontal cortex, such as the right superior frontal gyrus [Gonzalo et al., 2000], are activated, suggesting that the two modes of stimuli are required to be paired, learned, and retrieved as part of the process. The superior temporal sulcus was revealed to play a key role in creating the paired associations among individuals with normal vision [Tanabe et al., 2005]. Because individuals with early blindness have stronger sound sensitivity and localization abilities than their counterparts with normal vision [Ashmead et al., 1998; Lessard et al., 1998; Voss et al., 2004], the neural substrates mediating these functions facilitate the cross‐modal process. The cortico‐cortical connectivity among the posterior and inferior parietal cortices and the occipital cortex have been found to be involved in the discrimination and recognition of objects by blind subjects [Gougoux et al., 2005; Macaluso et al., 2000]. Of all the sites involved, the inferior parietal cortex is the principal site for mediating Braille reading—that is to say, it mediates tactile inputs from the hands to allow visualization and reading [Buchel et al., 1998]‐and for an auditory localization task involving matching auditory signals to spatial locations [Collignon et al., 2007; Weeks et al., 2000].
Various studies have attributed enhanced tactile and auditory abilities among blind people to plastic changes in the occipital lobe arising from early deprivation of visual inputs [Collignon et al., 2009; Gougoux et al., 2005; Voss et al., 2008]. The extrastriate cortex (BA 18) has been revealed to mediate a possible functional network of auditory‐visual processing for early‐blind subjects [Collignon et al., 2006]. The dorsal and ventral occipital cortices and the peristriate cortex were found to be associated with auditory localization, which is essential for cross auditory‐spatial processes [Weeks et al., 2000]. In addition, inconsistent findings were revealed for involvement of the right and left cuneus (BA 17) in the striate cortex, which projects to the extrastriate cortex. Arno et al. [ 2001] reported that the left cuneus was significantly more activated in blind subjects than in normal controls in a sound‐mediated pattern‐spatial recognition task. Voss et al. [ 2008] found significant changes in cerebral blood flow in the right cuneus when subjects engaged in a binaural sound‐discrimination task, whereas the left cuneus was in the monaural condition. In contrast, Gougoux et al. [ 2005] did not identify involvement of the right or left cuneus in a binaural sound‐localization task. In this study, we were interested in differentiating the roles of the right and left cuneus in cross auditory‐spatial learning.
We compared event‐related functional MRI (fMRI) responses captured on two occasions, namely baseline and post‐training, in early‐blind and normal‐vision groups. All participants performed a sound‐to‐distance judgment task to initiate the cross‐modal process. The sounds, which were novel to all participants, were generated by ultrasonic echoes bounced back from obstacles located at varying distances. All participants were asked to discriminate the sounds according to distance. We hypothesized that the cross auditory‐spatial learning among early‐blind subjects would be mediated by a functional network involving the frontal cortex, the parietal cortex (especially the inferior parietal gyrus), and the hippocampus, together with the extrastriate cortex. Within the extrastriate cortex, the right and left cuneus would have differentiated roles. In contrast, the learning among normal‐vision subjects would involve less of the extrastriate cortex but more frontal and temporal activity.
MATERIALS AND METHODS
Subjects
The early‐blind group was composed of 12 right‐handed participants with early blindness (seven males, five females, mean age 34.2 years, range 19–46 years). Because one subject (male, 19 years old) performed at chance level on the spatial discrimination task, he was excluded from the analysis. Thus, the final sample size of the early‐blind group was 11. All subjects had suffered from very low vision since birth and had become completely blind before reaching their first birthday. The cause of blindness was bilateral ocular or optic nerve lesions. Otherwise, the subjects were neurologically normal. They were recruited on a voluntary basis with the help of associations for blind people in Hong Kong. The control group was composed of 14 right‐handed, blindfolded adults with normal vision (nine males, five females, mean age 27.4 years, range 21–32 years). The study was approved by the Human Ethics Committee of The Hong Kong Polytechnic University. All participants gave their written informed consent beforehand and were paid for participating in the study.
Experimental Paradigm
The auditory stimuli were generated via an ultrasonic device (Electronic Bat‐Ears) designed to facilitate navigation for people with blindness. The ultrasonic output signals (frequency 40,000 Hz) were emitted by a centrally positioned transmitter, and the echoes that bounced back from individual obstacles were picked up by two receivers located on either side of the transmitter. The input signals were converted linearly into audible sounds in which the audio features were modulated by the location of the obstacle relative to the receiver.
The auditory stimuli were fabricated in the middle of an open air space of about 30 m by 30 m. The obstacles consisted of a 750 mm (width) by 1,500 mm (height) vertical plywood board placed at distances of 1 ± 0.3 m, 3 ± 0.3 m, and 5 ± 0.3 m in front of the Bat‐Ears device. Echoes that bounced back from obstacles in each of the three distance ranges were recorded. For each distance range, echoes were recorded in 0.01 m increments. This gave 60 stimuli for each distance range. The stimulus sound was characterized by a rapid “da … da … da …” and could be differentiated in terms of intensity (from loud [close] to soft [far]) and pitch (from high [close] to low [far]). Power spectral density analysis of these stimuli indicated that the spectrum of the recorded echoes peaked at 2,369 Hz, 2,627 Hz, and 3,876 Hz for the 1 m, 3 m, and 5 m distance ranges, respectively. Power at the spectral peak for the 3 m and 5 m distance ranges dropped by 1.04 dB and 0.66 dB, respectively, compared with that for the 1 m distance. These echoes were randomized and presented in the baseline and post‐training scanning sessions and during training without overlap. Different auditory stimuli were used to prevent subjects from making responses based on direct recall of the sound‐to‐distance relationship learned in the training rather than engaging in auditory‐spatial processing as required by the task.
The spatial judgment task required the subject to judge whether a target audio signal presented was an echo recorded from the obstacle located at a near (∼1 m), medium (∼3 m), or far (∼5 m) distance. Each trial was composed of three audio signals: Cue, Reference, and Target. The Cue sound was presented first for 500 ms to indicate the beginning of the trial (see Fig. 1), followed by the Reference sound, which lasted for 3,000 ms. The subject was asked to listen for the sound and press a button at the same time to acknowledge that it had been perceived. The Reference sound was used as a control for the processes associated with the auditory and motor processes elicited from the task but not specific to the cross auditory‐spatial processing and learning. The inter‐stimulus interval (ISI) between the Cue and Reference sounds was randomly assigned from the values of 500, 2,500, and 4,500 ms. The Target sound was presented to the subject after the Reference sound at an ISI of 2, 4, 6, or 8 s. The Target sound was a 3,000 ms Bat‐Ears echo, which was categorized as near, medium (∼3 m), or far distance. The participant was asked to perceive and judge the distance from which the sound had been recorded by pressing one of three buttons on a keyboard as accurately and quickly as possible. The participants were required to complete the spatial judgment task at baseline and post‐training using the scanner. We computed the accuracy rate and mean response time of each subject and then calculated a composite performance score by dividing the accuracy rate by the mean response time to account for any speed‐accuracy tradeoff on the task.
Figure 1.
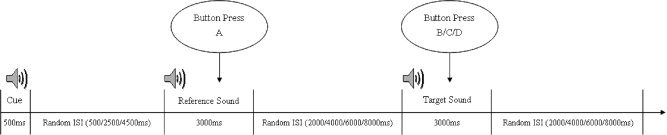
Experimental paradigm of the sound‐to‐distance judgment task with presentation of the Target (Bat‐Ears) sound after the Reference sound, where ISI means the inter‐stimulus‐intervals.
The subjects received training on recognizing the Bat‐Ears sounds‐that is, the Target signals‐during the 4 weeks after the baseline fMRI scan. Sessions, each lasting 2 h, were held once a week so that each subject received a total of 8 h of training. Subjects were blindfolded throughout the training sessions. In the first session, the subject was given the Bat‐Ears to practice navigating within a 5 m × 5 m space (with vertical plywood panels erected along the four edges) for about 15 min before the actual training commenced. The navigation practice enabled the subject to discern changes in the Bat‐Ears sounds and relate them to the distances traveled within the space. This facilitated learning of the sound‐to‐distance relationship in the remaining training sessions. The actual training was conducted in a sitting position. The subject listened to the audio signals presented via a binaural ear phone and judged the distances represented by the sounds. If a subject made an incorrect response, he or she was provided with the correct answer as feedback. The minimum accuracy rate to be achieved by the each subject was 75%. The Bat‐Ears sounds presented in the training were not used in the post‐training fMRI scanning.
fMRI Data Acquisition
The auditory stimuli were presented via an MR‐compatible headphone. There were 30 trials in each run and two runs per scanning session. Before MR imaging, the subject was fully familiarized with the procedures and the experimental conditions. Images were acquired with the 3T MRI system (Philips). Functional data were acquired by T2*‐weighted gradient‐echo planar imaging (repetition time [TR] = 3,000 ms; echo time [TE] = 30 ms; flip angle = 90°; slice thickness = 4 mm with 1 mm gap; in‐plane resolution = 1.8 mm ×1.8 mm; matrix size = 128 × 128 × 32). For each run, five dummy volumes were discarded at the beginning and 193 volumes were stored for analysis. T1‐weighted images were acquired in each session (matrix size = 256 × 256 × 182; voxel size = 1 mm ×1 mm ×1 mm) for normalizing individual brain structure to a standardized space. The same parameters were used in both baseline and post‐training scans.
fMRI Image Analysis
We analyzed all fMRI images using SPM2 (available at: http://www.fil.ion.ucl.ac.uk/spm). We performed motion correction by rigid body transformation and carried out spatial normalization according to the Montreal Neurological Institute (MNI) template (available at: http://www.bic.mni.mcgill.ca/brainweb) using 12‐parameter affine transformation. The images were spatially smoothed with a Gaussian kernel (full‐width‐at‐half‐maximum equal to 2 × voxel size along each dimension). To further validate the images, we detected outliers using artifact detection software developed by the Gabrieli Lab, Massachusetts Institute of Technology [Mazaika et al., 2005] (available at: http://web.mit.edu/swg/software.htm). Images so identified were excluded from the subsequent analysis.
The preprocessed data obtained from baseline and post‐training scans were fitted to a general linear model (GLM) in SPM2 [Friston et al., 1994]. We used five event‐related regressors. Three of those modeled the BOLD signals corresponding to the correct responses made to Cue, Reference, and Target (i.e., Bat‐Ears) stimuli. The other two regressors were factors of no interest that modeled the BOLD signals for incorrect responses made to the Reference and Target stimuli. The regressors were constructed by convolving the onset times of the events with the canonical hemodynamic response function and its temporal derivative. We included the motion parameters (three translational and three rotational) in the GLM for further regression of the motion‐dependent confound, and further included a variable number of additional regressors (each equal to zero and serving as a delta function except for one regressor in each GLM that contained a “1” for tagging the outlier images). We removed slow changes in the data by applying a high‐pass filter with a cut‐off period of 128 s and used a first‐order autoregressive process, that is, AR(1), to correct for autocorrelation of residual signals in the GLM.
Whole‐Brain and Regions‐of‐Interest Analyses
We first conducted whole‐brain analyses separately for each baseline and post‐training occasion and for the early‐blind and normal‐vision groups. The normal‐vision group served as a control. The two contrasts involved comparing Target and Reference responses for each baseline and post‐training occasion. We used sample t‐tests and random effects [Holmes and Friston, 1998] as well as cluster‐level inference [Friston et al., 1996]. The thresholds set for the statistical maps, that is, the t‐images, were P < 0.001 (uncorrected) at the voxel level and P < 0.05 (corrected) at the cluster level. Significant activations were overlaid on the structural template, normalized to the MNI space, as provided in SPM2. Conjunction and disjunction analyses were conducted using the same sets of contrasts [Nichols et al., 2005]. The conjunction analysis was performed to identify the regions commonly activated by the task across the two subject groups during each of the baseline and post‐training occasions. In the disjunction analysis, activation was determined by masking the contrast from one group exclusively with that from the other group. The masks were constructed at an uncorrected P value of 0.05. For both analyses, activated areas were determined with P < 0.001 at the voxel level and P < 0.05 at the cluster level. We used the automated anatomical labeling method to label the coordinates of the maxima in the SPM activation maps with respect to the anatomical atlas defined in the MNI space [Tzourio‐Mazoyer et al., 2002]. Six a priori subject‐specific regions of interest (ROIs) were selected to test the occipital‐enhanced network (one in the frontal lobe, two in the parietal lobe, one in the left hippocampus, and two in the occipital lobe). Specifically, they were the right inferior frontal gyrus, inferior parietal cortex (L/R), left hippocampus, and cuneus (L/R), respectively. To further test the contributions of the occipital lobe to cross‐modal learning, post hoc ROIs—the left middle occipital and the right inferior occipital gyri—were added to the cuneus. These ROIs were constructed separately for each of the baseline and post‐training scans using the simplified peak search procedure [Burton et al., 2004] by creating an 8‐mm radius spherical region at the local extrema on the t‐image. This was followed by paired t‐tests on each pair of regional mean contrast values (baseline contrast averaged over baseline ROI vs. post‐training contrasts averaged over post‐training ROI). The same procedures were conducted separately for the early‐blind and normal‐vision groups. The P values set for the paired t‐tests were corrected with the Bonferroni method and were 0.050 (for the frontal lobe and hippocampus), 0.025 (for the parietal lobe), and 0.0125 (for the occipital lobe).
RESULTS
Behavioral‐Spatial Judgment Task
We excluded from the analyses the trials for which the response times were greater than 3 times the group standard deviations, which involved a total of 14 of 1,130 and two of 971 corrected trials for the early‐blind and normal‐vision groups, respectively. In the early‐blind group, the accuracy rate improved from 67.8% (SD = 13.9%) at baseline to 70.0% (SD = 18.0%) at post‐training (P = 0.583), whereas the response time decreased from 2,163.1 ms (SD = 891.3 ms) to 1,794.1 ms (SD = 539.3 ms) (P = 0.257). In the normal‐vision group, the accuracy rate also improved from 46.1% (SD = 15.7%) to 55.4% (SD = 21.7%) (P = 0.086) after training, but the response time increased from 2,477.6 ms (601.3 ms) to 2,720.6 ms (SD = 704.5 ms) (P = 0.098). No significant within‐group differences were revealed. We then computed the individual subjects' composite performance scores (accuracy rate divided by average response time) for the baseline and post‐training occasions. The composite score was meant to account for the possible speed‐accuracy tradeoff observed in the normal‐vision group [Lavi et al., 2007]. Paired t‐tests revealed significant improvements in the performance of subjects with early blindness after training (t (12) = 2.216, P = 0.047), from 31.36% s−1 (SD = 17.87) to 42.30% s−1 (SD = 15.71). For the normal‐vision group, the performances showed improvements from 17.43% s−1 to 22.50% s−1 after training, but the difference was only marginally significant (t (16) = 2.011, P = 0.061).
BOLD Responses Associating With Cross Auditory‐Spatial Processing
The results from the early‐blind group at baseline (contrast between Target and Reference sounds) revealed significant BOLD responses in the right superior frontal gyrus, the left precentral gyrus, and the right superior and left inferior parietal gyri. Responses in the medial and inferior surfaces of the occipital lobe were from the left calcarine fissures and surrounding cortices and the right lingual gyrus. Significant activation was also observed in the right lenticular nucleus and putamen as well as in the hemisphere lobule crus I and the vermis lobule VIII of the cerebellum (Table I [baseline] and Fig. 2A). The normal‐vision group did not seem to share similar BOLD responses with the early‐blind group, except in the cerebellum (left crus I and vermis lobule VIII) (Table II [baseline]). The shared region was further negated by the nonsignificant results obtained from the conjunction analysis (Table III [baseline]). The significant BOLD responses observed in the early‐blind group but not the normal‐vision group (based on the disjunction analysis) were in the left and right frontal lobes, the left superior parietal gyrus and the angular gyrus, the left and right occipital lobes, and the right crus I (Table III [baseline]). In contrast, the responses observed in the normal‐vision group but not the early‐blind group were in the left inferior frontal gyrus, the right inferior parietal gyrus, and the left precuneus. It is noteworthy that subjects in the normal‐vision group performed slightly above chance level, that is, 33% (accuracy rate: 46.1%), and so these results should be interpreted with caution.
Table I.
Coordinates, cluster size, and t‐values of activation foci for the contrast between Target (Bat‐Ears) and Reference sounds obtained at baseline and post‐training occasions, blind subjects (N = 11)
| Lobe | L/R | Label | x, y, z (mm) | Cluster size | T | Z |
|---|---|---|---|---|---|---|
| Target—reference sounds (at baseline) | ||||||
| Central region | L | Precentral gyrus | −48 4 32 | 34 | 5.46 | 3.64 |
| Frontal lobe, medial surface | R | Superior frontal gyrus, medial | 8 30 44 | 89 | 6.60 | 4.01 |
| Parietal lobe, lateral surface | L | Inferior parietal gyrus | −32 −64 38 | 49 | 8.51 | 4.50 |
| R | Superior parietal gyrus | 24 −76 48 | 30 | 5.78 | 3.75 | |
| Occipital lobe, medial and inferior surfaces | L | Calcarine fissure and surrounding cortex | 2 −90 0 | 120 | 6.37 | 3.94 |
| R | Lingual gyrus | 18 −80 −6 | 108 | 6.26 | 3.91 | |
| Subcortical gray nuclei | R | Lenticular nucleus, putamen | 20 10 −12 | 31 | 7.59 | 4.28 |
| Cerbellum, hemisphere lobule | L | Crus I | −4 −84 −18 | 33 | 5.33 | 3.59 |
| Cerebellum, vermis lobule | Vermis VIII | 2 −58 −30 | 42 | 5.95 | 3.81 | |
| Target—reference sounds (at post‐training) | ||||||
| Central region | L | Precentral gyrus | −50 6 22 | 94 | 7.72 | 4.31 |
| Frontal lobe, lateral surface | R | Inferior frontal gyrus, triangular part | 48 32 28 | 71 | 9.14 | 4.63 |
| R | Inferior frontal gyrus, opercular part | 52 8 28 | 34 | 7.12 | 4.16 | |
| Parietal lobe, lateral surface | L | Inferior parietal gyrus | −56 −30 48 | 292 | 13.01 | 5.27 |
| R | Inferior parietal gyrus | 52 −52 52 | 314 | 10.83 | 4.94 | |
| Occipital lobe, lateral surface | L | Middle occipital gyrus | −34 −92 0 | 81 | 7.97 | 4.37 |
| R | Inferior occipital gyrus | 30 −94 −12 | 34 | 5.45 | 3.63 | |
| Occipital lobe, medial and inferior surfaces | L | Fusiform gyrus | −40 −64 −14 | 414 | 11.31 | 5.02 |
| R | Fusiform gyrus | 44 −70 −18 | 165 | 7.79 | 4.33 | |
| R | Cuneus | 16 −82 26 | 207 | 9.52 | 4.71 | |
| L | Cuneus | −10 −76 36 | 102 | 7.29 | 4.20 | |
| L | Calcarine fissure and surrounding cortex | −12 −80 8 | 43 | 5.95 | 3.81 | |
| R | Lingual gyrus | 8 −26 −10 | 38 | 5.55 | 3.67 | |
| Limbic lobe | L | Hippocampus | −14 −28 −6 | 49 | 12.21 | 5.16 |
| R | Median cingulate and paracingulate gyri | −2 −18 28 | 47 | 6.51 | 3.98 | |
| Cerebellum, hemisphere lobule | R | VI | 30 −64 −20 | 1438 | 10.17 | 4.83 |
| L | Crus 2 | 2 −78 −36 | 72 | 9.43 | 4.69 | |
| Cerebellum, vermis lobule | Vermis VI | 6 −64 −20 | 46 | 5.85 | 3.77 | |
Coordinates are in millimeter according to Talairach and Tournoux [1988], based on spatial normalization to a template by the Montreal Neurological Institute. Significant BOLD responses were set at P < 0.001(uncorrected) at the voxel and P < 0.050 (corrected) at the cluster level.
Figure 2.

Activation maps of neural activities associated with perception of Bat‐Ear sounds (Target contrast with Reference sounds) obtained at the baseline (A) and post‐training (B) occasions, blind subjects (N = 11), and the post‐training occasion (C), normal vision subjects (N = 14).
Table II.
Coordinates, cluster size, and t‐values of activation foci for the contrast between Target (Bat‐Ears) and Reference sounds obtained at baseline and post‐training occasion, normal vision subjects (N = 14)
| Lobe | L/R | Label | x, y, z (mm) | Cluster size | T | Z |
|---|---|---|---|---|---|---|
| Target—reference sounds (at baseline) | ||||||
| Frontal lobe, lateral surface | R | Inferior frontal gyrus, triangular part | 48 32 28 | 56 | 5.92 | 4.05 |
| R | Middle frontal gyrus | 38 2 60 | 49 | 5.51 | 3.89 | |
| Frontal lobe, orbital surface | R | Middle frontal gyrus, orbital part | 38 44 −8 | 45 | 5.73 | 3.98 |
| Parietal lobe, lateral surface | R | Inferior parietal gyrus | 38 −52 40 | 254 | 8.15 | 4.77 |
| Parietal lobe, medial surface | L | Precuneus | −6 −72 48 | 119 | 6.15 | 4.14 |
| Occipital lobe, medial and inferior surface | R | Cuneus | 12 −72 36 | 85 | 6.45 | 4.25 |
| Insula | R | Insula | 30 26 −4 | 56 | 7.30 | 4.53 |
| Subcortical gray nuclei | L | Caudate nuclues | −12 8 4 | 52 | 5.91 | 4.05 |
| Cerebellum, hemisphere lobule | R | Crus 1 | 32 −62 −34 | 43 | 7.09 | 4.46 |
| L | Crus 1 | −30 −66 −34 | 65 | 5.75 | 3.98 | |
| R | Crus 2 | 8 −76 −32 | 62 | 6.32 | 4.2 | |
| L | VIII | −10 −62 −48 | 43 | 7.97 | 4.72 | |
| Target—reference sounds (at post‐training) | ||||||
| Frontal lobe, lateral surface | L | Superior frontal gyrus, dorsolateral | −30 54 0 | 87 | 10.21 | 5.26 |
| L | Inferior frontal gyrus, opercular part | −50 14 4 | 162 | 8.49 | 4.86 | |
| R | Middle frontal gyrus | 38 54 2 | 157 | 7.13 | 4.47 | |
| R | Inferior frontal gyrus, triangular part | 54 24 30 | 245 | 6.43 | 4.24 | |
| Temporal lobe, lateral surface | L | Superior temporal gyrus | −44 −36 12 | 102 | 6.75 | 4.35 |
| R | Superior temporal gyrus | 44 −30 6 | 72 | 5.36 | 3.83 | |
| Parietal lobe, lateral surface | R | Inferior parietal gyrus | 46 −48 46 | 330 | 8.12 | 4.76 |
| Parietal lobe, medial surface | L | Precuneus | −10 −70 36 | 51 | 5.05 | 3.69 |
| Occipital lobe, lateral surface | L | Superior occipital gyrus | −26 −60 24 | 80 | 6.79 | 4.36 |
| Occipital lobe, medial and inferior surface | R | Cuneus | 14 −74 42 | 47 | 5.16 | 3.74 |
| Limbic lobe | R | Medial cingulate gyrus | 2 −16 26 | 43 | 9.64 | 5.14 |
| Subcortical gray nuclei | R | Thalamus | 8 −24 10 | 151 | 7.61 | 4.62 |
| R | Lenticular nucleus, pallidum | 24 −4 4 | 53 | 6.04 | 4.1 | |
| Cerebellum, hemisphere lobule | L | Crus 1 | −12 −82 −28 | 148 | 8.45 | 4.85 |
| L | VIIB | −14 −74 −48 | 96 | 7.58 | 4.61 | |
| R | Crus 2 | 44 −70 −50 | 131 | 7.51 | 4.59 | |
Coordinate definitions and BOLD response significance are the same as those in Table I.
Table III.
Conjunction and disjunction analyses between the blind and normal vision groups with the same coordinate definitions as those in Table I
| Lobe | L/R | Label | x, y, z (mm) | Cluster size | T | Z |
|---|---|---|---|---|---|---|
| Bat‐ears—reference sounds (baseline) | ||||||
| Conjunction (both Blind and normal vision): | ||||||
| Nil | ||||||
| Disjunction (blind but not normal vision): | ||||||
| Central region | L | Precentral gyrus | −48 4 28 | 49 | 5.99 | 4.60 |
| Frontal lobe, lateral surface | R | Inferior frontal gyrus, opercular part | 52 8 22 | 288 | 5.71 | 4.46 |
| L | Inferior frontal gyrus, triangular part | −44 48 4 | 56 | 4.50 | 3.77 | |
| R | Inferior frontal gyrus, triangular part | 40 28 26 | 55 | 4.63 | 3.85 | |
| R | Inferior frontal gyrus, orbital part | 38 34 −4 | 111 | 5.38 | 4.29 | |
| Parietal lobe, lateral surface | L | Superior parietal gyrus | −28 −74 54 | 65 | 5.53 | 4.37 |
| L | Angular gyrus | −44 −56 44 | 47 | 6.06 | 4.64 | |
| Occipital lobe, lateral surface | R | Middle occipital gyrus | 32 −76 22 | 393 | 5.97 | 4.59 |
| Occipital lob, medial and inferior surfaces | L | Lingual gyrus | −24 −94 −14 | 415 | 5.61 | 4.41 |
| L | Cuneus | −8 −86 28 | 83 | 4.45 | 3.74 | |
| Cerebellum, hemisphere lobule | R | Crus I | 46 −70 −22 | 2392 | 6.31 | 4.76 |
| Disjunction (normal vision but not blind): | ||||||
| Frontal lobe, lateral surface | R | Inferior frontal gyrus, orbital part | 40 42 −12 | 88 | 4.75 | 3.93 |
| Parietal lobe, lateral surface | R | Inferior parietal gyrus | 40 −40 38 | 71 | 6.53 | 4.86 |
| Parietal lobe, medial surface | L | Precuneus | −6 −76 48 | 102 | 5.20 | 4.19 |
| Bat‐ears—reference sounds (post‐training) | ||||||
| Conjunction (both Blind and normal vision): | ||||||
| Parietal lobe, lateral surface | R | Inferior parietal gyrus | 46 −46 44 | 124 | 6.14 | 4.68 |
| Disjunction (blind but not normal vision): | ||||||
| Central region | L | Precentral gyrus | −38 −14 62 | 72 | 5.66 | 4.43 |
| Parietal lobe, lateral surface | L | Inferior parietal gyrus | −54 −38 44 | 120 | 6.20 | 4.71 |
| L | Supramarginal gyrus | −56 −24 24 | 141 | 5.51 | 4.35 | |
| Occipital lobe, lateral surface | R | Middle occipital gyrus | 36 −74 24 | 89 | 4.85 | 3.99 |
| L | Inferior occipital gyrus | −44 −68 −12 | 172 | 5.42 | 4.31 | |
| Occipital lobe, medial and inferior surfaces | L | Cuneus | −8 −82 36 | 90 | 5.72 | 4.47 |
| R | Cuneus | 8 −100 10 | 499 | 6.82 | 4.99 | |
| Limbic lobe | L | Hippocampus | −8 −26 −10 | 64 | 5.38 | 4.29 |
| Cerebellum, hemisphere lobule | R | VI | 34 −56 −28 | 1773 | 8.69 | 5.73 |
| Disjunction (normal vision but not blind): | ||||||
| Frontal lobe, lateral surface | L | Inferior frontal gyrus, opercular part | −50 14 4 | 67 | 5.45 | 4.32 |
| Frontal lobe, medial surface | L | Superior frontal gyrus | −2 20 40 | 67 | 4.69 | 3.89 |
| Temporal lobe, lateral surface | L | Superior temporal gyrus | −48 −32 10 | 81 | 5.69 | 4.45 |
| R | Superior temporal gyrus | 34 −28 8 | 82 | 5.17 | 4.17 | |
| L | Middle temporal gyrus | −62 −20 0 | 88 | 5.44 | 4.32 | |
| Occipital lobe, lateral surface | L | Superior occipital gyrus | −26 −60 24 | 213 | 5.91 | 4.56 |
| Subcortical gray nuclei | R | Lenticular nucleus, pallidum | 24 2 2 | 66 | 5.16 | 4.16 |
| Cerebellum, hemisphere lobule | L | Crus 1 | −38 −62 −34 | 106 | 6.61 | 4.90 |
| L | VIIB | −14 −76 −46 | 58 | 5.04 | 4.09 | |
| R | VIIB | 40 −68 −50 | 111 | 5.83 | 4.52 | |
Masks for disjunction analysis were constructed at P < 0.05 (uncorrected). Significant BOLD responses for all analyses were set at P < 0.001 (uncorrected) at the voxel and P < 0.050 (corrected) at the cluster level.
BOLD Responses Associating With Cross Auditory‐Spatial Processing After Training
The early‐blind group learned the cross auditory‐spatial modality during the 4 weeks of training on the sound judgment task. The contrast of the BOLD responses between the Target and Reference sounds at the post‐training occasion elucidated the cross‐modal processes subsequent to the learning phase. Significant increases in BOLD responses were found in the right inferior frontal gyrus, the left precentral gyrus, and the bilateral inferior parietal gyri. Substantial activations were also revealed in the occipital lobe, including the left middle occipital gyrus, the right inferior occipital gyrus, the bilateral fusiform gyrus, the bilateral cuneus, the right lingual gyrus, the left calcarine fissure, and the surrounding cortex. Subcortical activations were revealed in the left hippocampus, the right medial cingulate, and paracingulate gyri, and the right hemispheric lobule VI, left hemispheric lobule II, and vermis lobule VI of the cerebellum (see Table I [post‐training] and Fig. 2B). When compared with the early‐blind subjects, the normal‐vision subjects manifested extensive BOLD responses in the frontal and temporal lobes (Table II [post‐training] and Fig. 2C). The common region of activation between the two groups as identified by conjunctive analysis was in the right inferior parietal gyrus (Table III [post‐training]). The significant responses observed in the early‐blind group but not the normal‐vision group were in the left precentral gyrus, the left parietal lobe, the left and right occipital lobes, the left hippocampus, and the right lobule VI of the cerebellum (Table III [post‐training]). The responses observed in the normal‐vision group but not the early‐blind group were in the left frontal lobe, the left and right temporal lobes, the left superior occipital gyrus, the right lenticular nucleus, the left crus I, and the left and right lobules VIIB of the cerebellum.
ROIs: Cross Auditory‐Spatial Learning
We conducted paired t‐tests on the BOLD responses of the eight ROIs obtained from the early‐blind group between the post‐training and baseline occasions (Table IV). In general, all ROIs revealed relatively stronger BOLD responses at the post‐training occasion. The stronger responses were statistically significant in three ROIs (see Fig. 3): the right inferior parietal cortex (P = 0.001), the left hippocampus (P = 0.011), and the right cuneus (P = 0.012). Among the occipital ROIs, responses in the left cuneus (P = 0.114), left middle occipital gyrus (P = 0.026), and right inferior occipital gyrus (P = 0.051) were not statistically significant. The ROI analyses were repeated for subjects in the normal‐vision group. Although there were overall increases in BOLD responses in ROIs on the post‐training occasion, particularly in the left and right inferior parietal cortices, the right inferior frontal gyrus, and the left and right cuneus, none of the observed increases were statistically significant. The negative values in the mean response magnitudes of the three ROIs on the after‐training occasion suggested that these ROIs might not have played an active role in the normal‐vision subjects during the learning process.
Table IV.
Comparisons of the regional mean contrast magnitudes of ROIs between the post‐training and baseline occasions for the early blind and normal vision groups
| ROI | L/R | Label | Mean response magnitude (SD) | |||||
|---|---|---|---|---|---|---|---|---|
| Early blind group | Normal vision group | |||||||
| After training | Baseline | t‐Values | After training | Baseline | t‐Valuesa | |||
| 1 | R | Inferior frontal gyrus | 7.532 (1.602) | 5.177 (4.135) | 1.909 | 2.031 (2.913) | 1.571 (2.532) | 0.974 |
| 2 | L | Inferior parietal cortex | 6.457 (3.362) | 3.342 (4.165) | 2.597 | 2.068 (0.963) | 1.384 (1.105) | 2.083 |
| 3 | R | Inferior parietal cortex | 5.872 (2.264) | 2.419 (3.199) | 4.463** | 1.229 (1.781) | 0.956 (1.570) | 0.443 |
| 4 | L | Hippocampus | 2.087 (1.719) | 0.243 (1.787) | 3.139* | −0.201 (1.600) | −0.428 (1.088) | 0.390 |
| 5 | R | Cuneus | 9.127 (4.051) | 3.951 (4.175) | 3.058* | 0.313 (2.360) | −0.467 (1.391) | 1.184 |
| 6 | L | Cuneus | 8.180 (3.554) | 4.943 (6.327) | 1.734 | 0.838 (4.985) | −0.068 (1.532) | 0.795 |
| 7 | L | Middle occipital gyrus | 7.146 (5.012) | 4.824 (5.255) | 2.617 | −0.807 (3.064) | −1.082 (1.458) | 0.416 |
| 8 | R | Inferior occipital gyrus | 7.628 (3.586) | 4.263 (4.781) | 2.217 | −1.151 (4.955) | −1.603 (1.430) | 0.367 |
The ROIs 1–3 mediate cross auditory‐spatial processing (auditory localization, spatial judgment); ROI 4 mediates associative learning (general), and ROIs 5–8 mediate associative learning (occipital enhancement). ROIs with asterisks were statistically significant:
P ≤ 0.050 and
P ≤ 0.001 (significance levels set were P ≤ 0.050 for ROIs 1 and 4, P ≤ 0.025 for ROIs 2 and 3, and P ≤ 0.0125 for ROIs 5 to 8).
All t‐values for the normal vision group are not statistically significant only that of the left inferior parietal cortex obtained a marginal value, i.e. P = 0.058.
Figure 3.
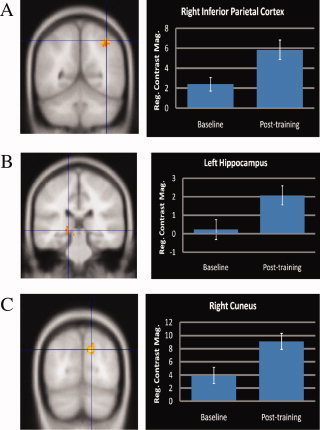
ROI analyses on learning of cross auditory‐spatial processing among the early blind subjects. Only the ROIs with significant changes between the post‐training and baseline occasions were presented. (A) The right inferior parietal cortex mediated cross auditory‐spatial localization; (B) the left hippocampus mediated cross auditory‐spatial binding; and (C) the right cuneus mediated occipital‐enhanced learning and sound localization.
DISCUSSION
This study used individuals with early blindness to explore the neural processes associated with cross auditory‐spatial learning. In general, the results indicate that subjects with early blindness were readily able to utilize the spatial information embedded in the novel Bat‐Ears sounds and to judge their associated distances. Activations of neural substrates at baseline suggest that the judgment processes probably involved sound‐to‐space localization. Further training on the sound‐to‐distance relationship improved performance on the spatial judgment task and also elicited stronger BOLD responses in the frontal and parietal cortices, in specific regions of the occipital cortex, and in the subcortical area. This indicates the involvement of these neural areas in the cross auditory‐spatial specific learning process. ROI analyses further suggest that the right inferior parietal cortex and the left hippocampus, as well as their association with the right cuneus, probably play essential roles in enhancing such learning. In contrast, the normal‐vision subjects performed the sound‐to‐distance judgment task at an above‐chance level only after training. Furthermore, cross auditory‐spatial processing in these normal subjects, relative to the early‐blind subjects, appeared to have elicited stronger frontal and temporal but weaker occipital activations. After training, shared activations in the right inferior parietal gyrus were observed for both the blind and normal subjects. This suggests that the differences between the early‐blind and normal‐vision groups are likely to be in both the processing and learning of cross auditory‐spatial‐specific information as well as in the neuroanatomy subserving these functions.
The Bat‐Ears Involving Sound Discrimination and Localization
The spatial judgment task involved the subjects going beyond sound discrimination and associating the Bat‐Ears sounds with distances (cross auditory‐spatial). The moderate accuracy rates attained by the early‐blind group on both scanning occasions (67.8% and 70.0% at baseline and post‐training, respectively) suggest that the task was not overly easy. The relatively long response times (mean = 2,163.1 ms and 1,794.1 ms, respectively) also suggest that the neural processes associated with the judgment task were rather complicated. Cross auditory‐spatial processing was evident from significant increases in the BOLD responses in the left inferior parietal gyrus. Previous studies have indicated that the inferior parietal lobe is a necessary component for sound localization [Arnott et al., 2004] and that it mediates the transformation of spatial coordinates for localization [Zatorre et al., 2002]. Activations in the superior posterior portion (crus I) and the inferior portion (VIII) of the cerebellum are related to refreshing and maintaining working memory of the task [Chen and Desmond, 2005] and to refining spatial processing [Booth et al., 2007; Clower et al., 2001]. In addition, recent studies have indicated that crus I is associated with amplifying and refining signal representation for the purposes of decision making [Booth et al., 2007; Chen and Desmond, 2005]. Other studies have also revealed a closed‐loop circuit between the cerebellum and the parietal cortex that provides second‐order input to the inferior parietal lobe for use in making spatial judgments [Clower et al., 2001; Yamamoto et al., 1983, 1992]. Our findings indicate that the early‐blind subjects attained a higher accuracy rate than that of their normal‐vision subjects, which is consistent with the findings of other studies on sound, tactile, and locomotion discrimination tasks [Burton et al., 2006; Collignon et al., 2009; Dufour et al., 2005; Gougoux et al., 2005; Voss et al., 2004, 2008]. Other studies have suggested that this superiority results from the involvement of the visual cortex, which augments necessary functions in sound‐to‐distance judgment [Burton et al., 2004; Leclerc et al., 2000; Pascual‐Leone et al., 2005; Ptito and Kupers, 2005; Sadato et al., 1998; Wittenberg et al., 2004]. The significant BOLD responses in the inferior parietal gyrus and crus I of the cerebellum suggest that the normal‐vision subjects might have undergone similar processes of sound localization and spatial judgment at the baseline. Nevertheless, the lack of a shared neuroanatomy suggests that there might be potential between‐group differences in these neural processes. In fact, crus I and extensive occipital lobe BOLD signals were observed in the early‐blind but not the normal‐vision group. In addition, the normal‐vision group displayed weaker frontal BOLD signals, particularly in the inferior frontal areas, which are important for mediating multisensory synthesis [Giard and Peronnet, 1999; McCarthy et al., 1994]. Our findings thus offer an insight into the reason why early‐blind subjects perform much better than normal‐vision subjects in judging sound‐to‐distance relationships.
Cross Auditory‐Spatial Learning
Significant improvements in performance of the sound‐to‐distance judgment task after training suggest that possible cross auditory‐spatial learning occurred among the early‐blind subjects (higher accuracy rate combined with faster response time). The captured stronger BOLD responses occurred in the frontal and parietal cortices, the left hippocampus, the cerebellum, and the occipital lobe, indicating that these areas may have roles in cross auditory‐spatial learning. The roles of the inferior parietal cortices, the hippocampus, and the occipital cortex in cross auditory‐spatial learning are discussed under specific subheadings below. Activities in the left precentral gyrus mediate shifting attention [O'Shea et al., 2004; Ruff et al., 2006]. Previous studies have also shown that the right medial part of the cingulate gyrus is associated with auditory‐spatial processing, particularly sound localization, in other tasks such as joystick movement [Weeks et al., 2000] and Braille reading [Burton et al., 2002].
Similar to the blind subjects, normal‐vision subjects showed an increase in accuracy rate, from 46.1% at baseline to 55.4% at post‐training, on the sound‐to‐distance judgment task. But the improvement was only marginally significant, which may be due to the artifact of increased mean response time from 2,477 ms at baseline to 2,720 ms after training. The difference in the response time between baseline and post‐training may be understood from differences in the participants' cognitive processes involved in performing on the task. According to their responses in post‐experiment debriefing, they tended to engage in random guessing when performing on the task at baseline, whereas they took time to consider the options offered after training. In sum, the results support possible cross auditory‐spatial learning taking place after training. The neural processes involved in such learning are largely different between the two groups. The only similar neural processes may be those subserved by the right inferior parietal gyrus as revealed by the findings of the conjunction analysis. The normal‐vision subjects also showed non‐significant changes in the regional mean contrast magnitudes in all ROIs between the baseline and post‐training occasions. Stronger BOLD responses in the superior frontal gyrus, the superior temporal gyrus, the superior occipital gyrus, and the lenticular nucleus were found in the normal‐vision but not the blind group. These neural substrates were previously found to be associated with reinforcement of the associative learning [Calvert et al., 1999, 2000] of spatial [Bushara et al., 1999] and non‐spatial [Arnott et al., 2004] information. Temporal gyrus and lateral occipital sulcus were found to mediate associative learning of cross‐modal as well as unimodal stimuli [Tanebe et al., 2005]. These findings further support the hypothesis that there could be different processes underlying cross auditory‐spatial learning between the early‐blind and normal‐vision subjects.
The Learning Roles of the Inferior Parietal Cortices
The ROI and conjunction analyses revealed that cross auditory‐spatial learning involved the inferior parietal cortex in both the early‐blind and the normal‐vision subjects. The neural substrate was previously reported to be associated with auditory‐spatial processing, particularly sound localization [Alain et al., 2001; Arnott et al., 2004; Lewis et al., 2000]. The increases in activations after training were consistent with those revealed in a recent study on healthy subjects [Spierer et al., 2007]. The inferior parietal lobe is the principal site for mediating cross‐modal integration [Bavelier and Neville, 2002; Buchel et al., 1998; Weeks et al., 2000], particularly cross‐modal localization [Lewis et al., 2000; Macaluso et al., 2000]. The results in this study further suggest possible dissociable roles of the right from the left inferior parietal gyrus, as reported in other studies, in auditory‐spatial processing and sound localization [Brunetti et al., 2005; Maedar et al., 2001; Tardif et al., 2006]. The right inferior parietal cortex was previously found to mediate auditory working memory for monitoring and updating sound location independently of motor acts [Claude et al., 2008] and for reorienting attention in space [Brunetti et al., 2008]. The left side, in contrast, was responsible for updating mental representation related to body positions and movements [Buxbaum et al., 2007]. At the post‐training occasion, the subjects were presented with Bat‐Ears sounds that had not been presented at baseline or during training. Accurate performance of the task required the subjects to generalize to novel stimuli the sound‐to‐distance relationship learned in training. The involvement of the right inferior parietal gyrus suggests that in cross auditory‐spatial learning, updating spatial representations of the sounds in working memory could be an important process for both the early‐blind and normal‐vision subjects.
The Learning Roles of the Hippocampus
Distinct from the right hippocampus, which is known to be involved in topographic orientation and memory [Maguire, 2001; Mellet et al., 2000], the left hippocampus is associated with nonspatial aspects of memory such as episodic and autographical event memory [Maguire and Mummery, 1999; Maguire et al., 1998, 2001]. Other studies have indicated that the left hippocampus mediates learning [Gabrieli et al., 1997; Gonzalo et al., 2000; Stark and Squire, 2001] by binding different sensory modalities [Norman and O'Reilly, 2003; Small, 2002], which in this study would be the Bat‐Ears auditory signals and the designated distances. This proposition is supported by the results from animal studies of the formation of new associations in the hippocampus during binding processes [Henke et al., 1999; Save et al., 2000; Small, 2002; Wood et al., 1999]. The left hippocampus has also been found to be involved in visual‐auditory associative learning [Gonzalo et al., 2000] and auditory‐visual integration [Calvert et al., 2001]. The negative values observed in the mean response magnitudes at baseline and at post‐training in the normal‐vision subjects suggest that the early‐blind subjects might have engaged different processes for cross auditory‐spatial learning. Reduced activity in the left hippocampus was previously found to be associated with a lower encoding ability among men with the fragile × permutation [Koldewyn et al., 2008]. Deactivation of the left hippocampus was related to unsuccessful working‐memory maintenance, resulting in the failure to recall [Axmacher et al., 2009]. Taken together, these findings suggest that the learning of sound‐to‐distance relationships in the early‐blind subjects relative to the normal‐vision subjects may involve more binding processes that are mediated by the left hippocampus.
The Learning Roles of the Occipital Lobe
Among the selected ROIs in the occipital cortex, only the right cuneus (BA 17) showed significant changes in the BOLD responses, suggesting its unique involvement in cross auditory‐spatial learning. Previous studies have indicated that the cuneus modifies the information input to the extrastriate cortices and hence other visual associative areas for further processing [Vanni et al., 2001]. Among blind subjects, the right cuneus was shown to be activated in Braille reading [Burton et al., 2002; Sadato et al., 1996], speech processing [Roder et al., 2002], verbal memory or verb generation [Amedi et al., 2003; Burton et al., 2002], and episodic memory [Raz et al., 2005]. Our findings further suggest that the right cuneus appears to play a major role in cross auditory‐spatial learning. The lack of involvement of the left cuneus concurs with the findings of Voss et al. [ 2008], who used a binaural sound‐discrimination task. These authors suggested that the right cuneus mediates sound localization (binaural), whereas the left mediates its discrimination (monaural). Activation of the right cuneus possibly indicates that the sound‐to‐distance judgment paradigm used in this study relied more on localization than on discrimination of the Bat‐Ears sound. The changes in BOLD responses in the middle and inferior occipital gyri (BA 18) did not reach a statistically significant level. The middle occipital gyrus is perhaps less involved in the auditory‐to‐spatial process and, as indicated by a previous study, plays a role in tactile‐dependent integration such as Braille reading [Burton et al., 2002a, b]. A recent study indicated that the middle occipital gyrus acitivity was correlated with accuracy of sound‐localization performance [Renier et al., 2010]. Similarly, inferior occipital gyrus activity was associated with tactile‐dependent discrimination tasks, including Braille reading [Sadato et al., 1998]. These findings suggest that the dorsal extrastriate cortex plays a less important role than the striate cortex in mediating the learning of a process among early‐blind subjects. The finding that the middle occipital gyrus was deactivated during auditory conditions among the normal‐vision subjects is consistent with that revealed in Renier et al. study [ 2010].
Limitations
The structural brain differences potentially present between the early‐blind and normal‐vision participants could have confounded the results of this study. Any plastic changes resulting from the lack of visual exposure could make comparisons between the two groups less meaningful. Additionally, this study did not control the within‐group variability of hearing functions of the subjects. Such variability, if it existed, could have lowered the power of the between‐ and within‐group comparisons. The cross auditory‐spatial judgment task was rather specific, thus also limiting the interpretation of the findings, particularly concerning the causal relations between the neural substrates identified in the learning process. The study could also have incorporated an auditory‐spatial task that did not require active learning, such as sounds of different magnitude, as a control task. Results from the control task could have further distinguished the neural substrates not involved in cross auditory‐spatial learning. In future studies, we may consider using a multilevel auditory‐spatial task that could further differentiate sound discrimination with localization to gain a better understanding of the cross‐modal learning process. Finally, the four‐week training (totaling 8 hours) could be increased to achieve even higher task competence, which would perhaps induce further changes in the plastic brain.
CONCLUSION
Our findings shed light on how spatial information embedded in auditory signals is learned by people with early blindness. As suggested by the term cross‐modal, the parietal cortex appeared to play an important role in the learning of sound‐to‐distance judgments, particularly in the localization of the Bat‐Ears sounds in both the early‐blind and normal‐vision groups. Cross auditory‐spatial learning requires the reinforcement of linkages between sounds and locations. This is a binding process that was found to be mediated by the hippocampus and enhanced by the cuneus in the striate cortex. The implications of these findings are that cross‐modal learning requires specific neural networks, and that consistent and repeated associations between the two novel modalities are essential for such learning. The functional network, however, is likely to be unique to individuals with early blindness. For normal‐vision individuals, cross auditory‐spatial learning appears to involve fewer occipital and hippocampus activities but more frontal and temporal lobe activities, as revealed in this study.
Acknowledgements
The authors thank the subjects for participating in this study and also Edward G. Jones of the University of California at Davis for reviewing the draft of the article.
Contributor Information
Chetwyn C.H. Chan, Email: Chetwyn.Chan@inet.polyu.edu.hk.
Tatia M.C. Lee, Email: tmclee@hku.hk.
REFERENCES
- Alain C, Arnott SR, Hevenor S, Graham S, Grady CL ( 2001): “What” and “where” in the human auditory system. Proc Natl Acad Sci USA 98: 12301–12306. [DOI] [PMC free article] [PubMed] [Google Scholar]
- Amedi A, Raz N, Pianka P, Malach R, Zohary E ( 2003): Early ‘visual’ cortex activation correlates with superior verbal memory performance in the blind. Nat Neurosci 6: 758–766. [DOI] [PubMed] [Google Scholar]
- Arno P, De Volder A G, Vanlierde A, Wanet‐Defalque M C, Streel E, Robert A, Sanabria‐Bohórquez S, Veraart C ( 2001): Occipital activation by pattern recognition in the early blind using auditory substitution for vision. Neuroimage 13: 632–645. [DOI] [PubMed] [Google Scholar]
- Arnott SR, Binns MA, Grady CL, Alain C ( 2004): Assessing the auditory dual‐pathway model in humans. Neuroimage 22: 401–408. [DOI] [PubMed] [Google Scholar]
- Ashmead DH, Wall RS, Ebinger KA, Eaton SB, Snook‐Hill MM, Yang XF ( 1998): Spatial hearing in children with visual disabilities. Perception 27: 105–122. [DOI] [PubMed] [Google Scholar]
- Axmacher N, Elger CE, Fell J ( 2009): Working memory‐related hippocampal deviation interferes with long term memory formation. J Neurosci 29: 1052–1960. [DOI] [PMC free article] [PubMed] [Google Scholar]
- Bavelier D, Neville HJ ( 2002): Cross‐modal plasticity: where and how? Nat Rev Neurosci 3: 443–452. [DOI] [PubMed] [Google Scholar]
- Booth JR, Wood L, Lu D, Houk JC, Bitan T ( 2007): The role of the basal ganglia and cerebellum in language processing. Brain Res 1133: 136–144. [DOI] [PMC free article] [PubMed] [Google Scholar]
- Brunetti M, Belardinelli P, Caulo M, Del Gratta C, Della Penna S, Ferretti A, Lucci G, Moretti A, Pizzella V, Tartaro A, Torquati K, Olivetti Belardinelli M, Romani GL ( 2005): Human brain activation during passive listening to sounds from different locations: An fMRI and MEG study. Hum Brain Mapp 26: 251–261. [DOI] [PMC free article] [PubMed] [Google Scholar]
- Brunetti M, Della Penna S, Ferretti A, Del Gratta C, Cianflone F, Belardinelli P, Caulo M, Pizzella V, Olivetti Belardinelli MO, Romani GL ( 2008): A frontoparietal network for spatial attention reorienting in the auditory domain: A human fMRI/MEG study of functional and temporal dynamics. Cereb Cortex 18: 1139–1147. [DOI] [PubMed] [Google Scholar]
- Buchel C, Price C, Friston K ( 1998): A multimodal language region in the ventral visual pathway. Nature 394: 274–277. [DOI] [PubMed] [Google Scholar]
- Burton H, McLaren DG, Sinclair RJ ( 2006): Reading embossed capital letters: An fMRI study in blind and sighted individuals. Hum Brain Mapp 27: 325–339. [DOI] [PMC free article] [PubMed] [Google Scholar]
- Burton H, Sinclair RJ, McLaren DG ( 2004): Cortical activity to vibrotactile stimulation: An fMRI study in blind and sighted individuals. Hum Brain Mapp 23: 210–228. [DOI] [PMC free article] [PubMed] [Google Scholar]
- Burton H, Snyder AZ, Conturo TE, Akbudak E, Ollinger JM, Raichle ME ( 2002a): Adaptive changes in early and late blind: A fMRI study of Braille reading. J Neurophysiol 87: 589–607. [DOI] [PMC free article] [PubMed] [Google Scholar]
- Burton H, Snyder AZ, Diamond JB, Raichle ME ( 2002b): Adaptive changes in early and late blind: A fMRI study of verb generation to heard nouns. J Neurophysiol 88: 3359–3371. [DOI] [PMC free article] [PubMed] [Google Scholar]
- Bushara KO, Weeks RA, Ishii K, Catalan MJ, Tian B, Rauschecker JP, Hallet M ( 1999): Modality‐specific frontal and parietal areas for auditory and visual spatial localization in human. Nat Neurosci 2: 759–766. [DOI] [PubMed] [Google Scholar]
- Buxbaum LJ, Kyle K, Grossman M, Coslett HB ( 2007): Left inferior parietal representations for skilled hand‐object interactions: Evidence from stroke and corticobasal degeneration. Cortex 43: 411–423. [DOI] [PubMed] [Google Scholar]
- Calvert GA, Brammer MJ, Bullmore ET, Campbell R, Iversen SD, David AS ( 1999): Response amplification in senory‐specific cortices during cross‐modal binding. Neuroreport 10: 2619–2626. [DOI] [PubMed] [Google Scholar]
- Calvert GA, Bullmore ET, Brammer MJ ( 2000): Evidence from functional magnetic resonance imaging of crossmodal binding in the human hetermodal cortex. Curr Biol 10: 649–657. [DOI] [PubMed] [Google Scholar]
- Calvert GA, Hansen PC, Iversen SD, Brammer MJ ( 2001): Detection of audio‐visual integration sites in humans by application of electrophysiological criteria to the BOLD effect. Neuroimage 14: 427–438. [DOI] [PubMed] [Google Scholar]
- Calvert GA ( 2001): Crossmodal processing in the human brain: Insights from functional neuroimaging studies. Cereb Cortex 11: 1110–1123. [DOI] [PubMed] [Google Scholar]
- Chen SHA, Desmond JE ( 2005): Temporal dynamics of cerebro‐cerebellar network recruitment during a cognitive task. Neuropsychologia 43: 1227–1237. [DOI] [PubMed] [Google Scholar]
- Claude A, He Y, Grady C ( 2008): The contribution of the inferior parietal lobe to auditory spatial working memory. J Cogn Sci 20: 285–295. [DOI] [PubMed] [Google Scholar]
- Clower DM, West RA, Lynch JC, Strick PL ( 2001): The inferior parietal lobule is the target of output from the superior colliculus, hippocampus, and cerebellum. J Neurosci 21: 6283–6291. [DOI] [PMC free article] [PubMed] [Google Scholar]
- Collignon O, Lassonde M, Lepore F, Bastien D, Veraart C ( 2007): Functional cerebral reorganization for auditory spatial processing and auditory substitution of vision in early blind subjects. Cereb Cortex 17: 457–465. [DOI] [PubMed] [Google Scholar]
- Collignon O, Renier L, Bruyer R, Tranduy D, Veraart C ( 2006): Improved selective and divided spatial attention in early blind subjects. Brain Res 1075: 175–182. [DOI] [PubMed] [Google Scholar]
- Collignon O, Voss P, Lassonde M, Lepore F ( 2009): Cross‐modal plasticity for the spatial processing of sounds in visually deprived subjects. Exp Brain Res 192: 343–358. [DOI] [PubMed] [Google Scholar]
- Dufour A, Despres O, Candas V ( 2005): Enhanced sensitivity to echo cues in blind subjects. Exp Brain Res 165: 515–519. [DOI] [PubMed] [Google Scholar]
- Friston KJ, Holmes A, Poline JB, Price CJ, Frith CD ( 1996): Detecting activations in PET and fMRI: Levels of inference and power. Neuroimage 4: 223–235. [DOI] [PubMed] [Google Scholar]
- Friston KJ, Holmes AP, Worsley KJ, Poline JP, Frith CD, Frackowiak RSJ ( 1994): Statistical parametric maps in functional imaging: A general linear approach. Hum Brain Mapp 2: 189–210. [Google Scholar]
- Gabrieli JDE, Brewer JB, Desmond JE, Glover GH ( 1997): Separate neural bases of two fundamental memory processes in the human medial temporal lobe. Science 276: 264–266. [DOI] [PubMed] [Google Scholar]
- Giard MH, Peronnet F ( 1999): Auditory‐visual integration during multimodal object recognition in humans: A behavioral and electrophysiological study. J Cogn Neurosci 11: 473–490. [DOI] [PubMed] [Google Scholar]
- Gonzalo D, Shallice T, Dolan R ( 2000): Time‐dependent changes in learning audiovisual associations: A single‐trial fMRI study. Neuroimage 11: 243–255. [DOI] [PubMed] [Google Scholar]
- Gottfried JA, Dolan RJ ( 2003): The nose smells what the eye sees: Crossmodal visual facilitation of human olfactory perception. Neuron 39: 375–386. [DOI] [PubMed] [Google Scholar]
- Gougoux F, Zatorre RJ, Lassonde M, Voss P, Lepore F ( 2005): A functional neuroimaging study of sound localization: Visual cortex activity predicts performance in early‐blind individuals. PLoS Biol 3: e27. [DOI] [PMC free article] [PubMed] [Google Scholar]
- Henke K, Weber B, Kneifel S, Wieser HG, Buck A ( 1999): Human hippocampus associates information in memory. Proc Natl Acad Sci USA 96: 5884–5889. [DOI] [PMC free article] [PubMed] [Google Scholar]
- Holmes AP, Friston KJ ( 1998): Generalisability, random effects & population inference. Neuroimage 7: S754. [Google Scholar]
- Koldewyn K, Hessi D, Adams J, Tassone F, Hagerman PJ, Hagerman RJ, Rivera SM ( 2008): Reduced hippocampal activation during recall is associated with elevated FMRI mRNA and psychiatric symptoms in men with the fragile X permutation. Brain Imaging Behav 2: 105–116. [DOI] [PMC free article] [PubMed] [Google Scholar]
- Lavi R, Doniger GM, Simon E, Hochner‐Celnikier D, Zimran A, Elstein D ( 2007): The effect of hormone replacement therapy on cognitive function of post‐menopausal women. QJM 100: 567–573. [DOI] [PubMed] [Google Scholar]
- Leclerc C, Saint‐Amour D, Lavoie ME, Lassonde M, Lepore F ( 2000): Brain functional reorganization in early blind humans revealed by auditory event‐related potentials. Neuroreport 11: 545–550. [DOI] [PubMed] [Google Scholar]
- Lee TMC, Liu HL, Chan CCH, Fang SY, Gao JH ( 2005): Neural activities associated with emotion recognition observed in men and women. Mol Psychiatry 10: 450–455. [DOI] [PubMed] [Google Scholar]
- Lessard N, Pare M, Lepore F, Lassonde M ( 1998): Early‐blind human subjects localize sound sources better than sighted subjects. Nature 395: 278–280. [DOI] [PubMed] [Google Scholar]
- Lewis JW, Beauchamp MS, DeYoe EA ( 2000): A comparison of visual and auditory motion processing in human cerebral cortex. Cereb Cortex 10: 873–888. [DOI] [PubMed] [Google Scholar]
- Macaluso E, Frith CD, Driver J ( 2000): Modulation of human visual cortex by crossmodal spatial attention. Science 289: 1206–1208. [DOI] [PubMed] [Google Scholar]
- Maeder P, Meuli R, Adriani M, Bellmann A, Fornari E, Thiran J, Pittet A, Clarke S ( 2001): Distinct pathways involved in sound recognition and localization: A human fMRI study. Neuroimage 14: 802–816. [DOI] [PubMed] [Google Scholar]
- Maguire E ( 2001): The retrosplenial contribution to human navigation: A review of lesion and neuroimaging findings. Scand J Psychol 42: 225–238. [DOI] [PubMed] [Google Scholar]
- Maguire EA, Burgess N, Donnett JG, Frackowiak RS, Frith CD, O'Keefe J ( 1998): Knowing where and getting there: A human navigation network. Science 280: 921–924. [DOI] [PubMed] [Google Scholar]
- Maguire EA, Mummery CJ ( 1999): Differential modulation of a common memory retrieval network revealed by positron emission tomography. Hippocampus 9: 54–61. [DOI] [PubMed] [Google Scholar]
- Maguire EA, Vargha‐Khadem F, Mishkin M ( 2001): The effects of bilateral hippocampal damage on fMRI regional activations and interactions during memory retrieval. Brain 124: 1156–1170. [DOI] [PubMed] [Google Scholar]
- Mazaika PK, Whitfield S, Cooper JC ( 2005): Detection and repair of transient artifacts in fMRI data. Neuroimage 26: S36. [Google Scholar]
- McCarthy G, Blamire AM, Puce A, Nobre AC, Bloch G, Hyder F ( 1994): Functional magnetic resonance imaging of human prefrontal cortex activation during a spatial working memory task. Proc Natl Acad Sci USA 91: 8690–8694. [DOI] [PMC free article] [PubMed] [Google Scholar]
- Mellet E, Briscogne S, Tzourio‐Mazoyer N, Ghaëm O, Petit L, Zago L, Etard O, Berthoz A, Mazoyer B, Denis M ( 2000): Neural correlates of topographic mental exploration: The impact of route versus survey perspective learning. Neuroimage 12: 588–600. [DOI] [PubMed] [Google Scholar]
- Nichols T, Brett M, Wager J, Poline TB ( 2005): Valid conjunction inference with the minimum statistic. Neuroimage 25: 653–660. [DOI] [PubMed] [Google Scholar]
- Norman KA, O'Reilly RC ( 2003): Modeling hippocampal and neocortical contributions to recognition memory: A complementary‐learning‐systems approach. Psychol Rev NY 110: 611–646. [DOI] [PubMed] [Google Scholar]
- O'Shea J, Muggleton NG, Cowey A, Walsh V ( 2004): Timing of target discrimination in human frontal eye fields. J Cogn Neurosci 16: 1060–1067. [DOI] [PubMed] [Google Scholar]
- Pascual‐Leone A, Amedi A, Fregni F, Merabet LB ( 2005): The plastic human brain cortex. Annu Rev Neurosci 28: 377–401. [DOI] [PubMed] [Google Scholar]
- Ptito M, Kupers R ( 2005): Cross‐modal plasticity in early blindness. J Integr Neurosci 4: 479–488. [DOI] [PubMed] [Google Scholar]
- Raz N, Amedi A, Zohary E ( 2005): V1 activation in congenitally blind humans is associated with episodic retrieval. Cereb Cortex 15: 1459–1468. [DOI] [PubMed] [Google Scholar]
- Renier LA, Anurova I, De Volder AG, Carlson S, VanMeter J, Rauschecker JP ( 2010): Preserved functional specialization for spatial processing in the middle occipital gyrus of the early blind. Neuron 68: 138–148. [DOI] [PMC free article] [PubMed] [Google Scholar]
- Roder B, Stock O, Bien S, Neville H, Rosler F ( 2002): Speech processing activates visual cortex in congenitally blind humans. Eur J Neurosci 16: 930–936. [DOI] [PubMed] [Google Scholar]
- Ruff CC, Blankenburg F, Bjoertomt O, Bestmann S, Freeman E, Haynes JD, Rees HG, Josephs O, Deichmann R, Driver J ( 2006): Concurrent TMS‐fMRI and psychophysics reveal frontal influences on human retinotopic visual cortex. Curr Biol 16: 1479–1488. [DOI] [PubMed] [Google Scholar]
- Sadato N, Pascual‐Leone A, Grafman J, Deiber MP, Ibanez V, Hallett M ( 1998): Neural networks for Braille reading by the blind. Brain 121: 1213–1229. [DOI] [PubMed] [Google Scholar]
- Sadato N, Pascual‐Leone A, Grafman J, Ibañez V, Deiber MP, Dold G, Hallett M ( 1996): Activation of the primary visual cortex by Braille reading in blind subjects. Nature 380: 526–528. [DOI] [PubMed] [Google Scholar]
- Save E, Nerad L, Poucet B ( 2000): Contribution of multiple sensory information to place field stability in hippocampal place cells. Hippocampus 10: 64–76. [DOI] [PubMed] [Google Scholar]
- Small SA ( 2002): The longitudinal axis of the hippocampal formation: Its anatomy, circuitry, and role in cognitive function. Rev Neurosci 13: 183–194. [DOI] [PubMed] [Google Scholar]
- Spierer L, Tardif E, Sperdin H, Murray MM, Clarke S ( 2007): Learning‐induced plasticity in auditory spatial representations revealed by electrical neuroimaging. J Neurosci 27: 5474–5483. [DOI] [PMC free article] [PubMed] [Google Scholar]
- Stark CEL, Squire LR ( 2001): Simple and associative recognition memory in the hippocampal region. Learn Mem 8: 190–197. [DOI] [PMC free article] [PubMed] [Google Scholar]
- Tanabe HC, Honda M, Sadato N ( 2005): Functionally segregated neural substrates for arbitrary audiovisual paired‐ association learning. J Neurosci 25: 6409–6418. [DOI] [PMC free article] [PubMed] [Google Scholar]
- Tardif E, Murray MM, Meylan R, Spierer L, Clarke S ( 2006): The spatio‐temporal brain dynamics of processing and integrating sound localization cues in humans. Brain Res 1092: 161–176. [DOI] [PubMed] [Google Scholar]
- Tzourio‐Mazoyer N, Landeau B, Papathanassiou D, Crivello F, Etard O, Delcroix N, Mazoyer B, Joliot M ( 2002): Automated anatomical labeling of activations in SPM using a macroscopic anatomical parcellation of the MNI MRI single‐subject brain. Neuroimage 15: 273–289. [DOI] [PubMed] [Google Scholar]
- Vanni S, Tanskanen T, Seppa M, Uutela K, Hari R ( 2001): Coinciding early activation of the human primary visual cortex and anteromedial cuneus. Proc Natl Acad Sci USA 98: 2776–2780. [DOI] [PMC free article] [PubMed] [Google Scholar]
- Voss P, Gougoux F, Zatorre RJ, Lassonde M, Lepore F ( 2008): Differential occipital responses in early‐and late‐blind individuals during a sound‐source discrimination task. Neuroimage 40: 746–758. [DOI] [PubMed] [Google Scholar]
- Voss P, Lassonde M, Gougoux F, Fortin M, Guillemot JP, Lepore F ( 2004): Early‐and late‐onset blind individuals show supra‐normal auditory abilities in far‐space. Curr Biol 14: 1734–1738. [DOI] [PubMed] [Google Scholar]
- Weeks R, Horwitz B, Aziz‐Sultan A, Tian B, Wessinger CM, Cohen LG, Hallett M, Rauschecker JP ( 2000): A positron emission tomographic study of auditory localization in the congenitally blind. J Neurosci 20: 2664–2672. [DOI] [PMC free article] [PubMed] [Google Scholar]
- Wittenberg GF, Werhahn KJ, Wassermann EM, Herscovitch P, Cohen LG ( 2004): Functional connectivity between somatosensory and visual cortex in early blind humans. Eur J Neurosci 20: 1923–1927. [DOI] [PubMed] [Google Scholar]
- Wood ER, Dudchenko PA, Eichenbaum H ( 1999): The global record of memory in hippocampal neuronal activity. Nature 397: 613–616. [DOI] [PubMed] [Google Scholar]
- Yamamoto T, Wagner A, Hassler R, Sasaki K ( 1983): Studies on the cerebellocerebral and thalamocortical projections in squirrel monkeys (Saimiri sciureus). Exp Neurol 79: 27–37. [DOI] [PubMed] [Google Scholar]
- Yamamoto T, Yoshida K, Yoshikawa H, Kishimoto Y, Oka H ( 1992): The medial dorsal nucleus is one of the thalamic relays of the cerebellocerebral responses to the frontal association cortex in the monkey: Horseradish peroxidase and fluorescent dye double staining study. Brain Res 579: 315–320. [DOI] [PubMed] [Google Scholar]
- Zatorre RJ, Bouffard M, Ahad P, Belin P ( 2002): Where is ‘where’ in the human auditory cortex? Nat Neurosci 5: 905–909. [DOI] [PubMed] [Google Scholar]